Harrisburg, MO Map & Demographics
Harrisburg Map
Harrisburg Overview
$28,081
PER CAPITA INCOME
$88,125
AVG FAMILY INCOME
$70,893
AVG HOUSEHOLD INCOME
7.5%
WAGE / INCOME GAP [ % ]
92.5¢/ $1
WAGE / INCOME GAP [ $ ]
0.38
INEQUALITY / GINI INDEX
377
TOTAL POPULATION
193
MALE POPULATION
184
FEMALE POPULATION
104.89
MALES / 100 FEMALES
95.34
FEMALES / 100 MALES
27.6
MEDIAN AGE
3.1
AVG FAMILY SIZE
2.7
AVG HOUSEHOLD SIZE
187
LABOR FORCE [ PEOPLE ]
71.9%
PERCENT IN LABOR FORCE
2.7%
UNEMPLOYMENT RATE
Harrisburg Zip Codes
Harrisburg Area Codes
Income in Harrisburg
Income Overview in Harrisburg
Per Capita Income in Harrisburg is $28,081, while median incomes of families and households are $88,125 and $70,893 respectively.
| Characteristic | Number | Measure |
| Per Capita Income | 377 | $28,081 |
| Median Family Income | 93 | $88,125 |
| Mean Family Income | 93 | $95,052 |
| Median Household Income | 141 | $70,893 |
| Mean Household Income | 141 | $74,305 |
| Income Deficit | 93 | $0 |
| Wage / Income Gap (%) | 377 | 7.46% |
| Wage / Income Gap ($) | 377 | 92.54¢ per $1 |
| Gini / Inequality Index | 377 | 0.38 |
Earnings by Sex in Harrisburg
Average Earnings in Harrisburg are $40,417, $39,135 for men and $42,292 for women, a difference of 7.5%.
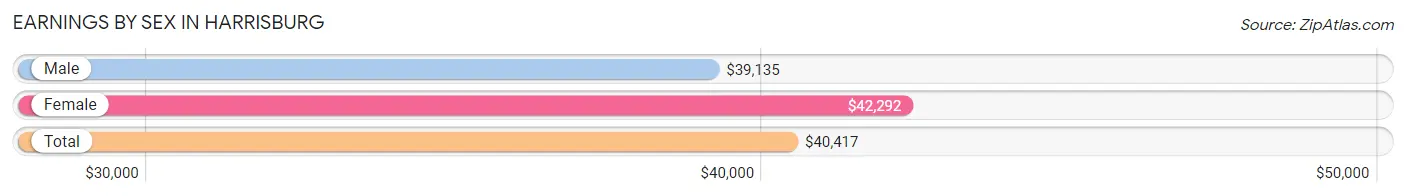
| Sex | Number | Average Earnings |
| Male | 97 (50.5%) | $39,135 |
| Female | 95 (49.5%) | $42,292 |
| Total | 192 (100.0%) | $40,417 |
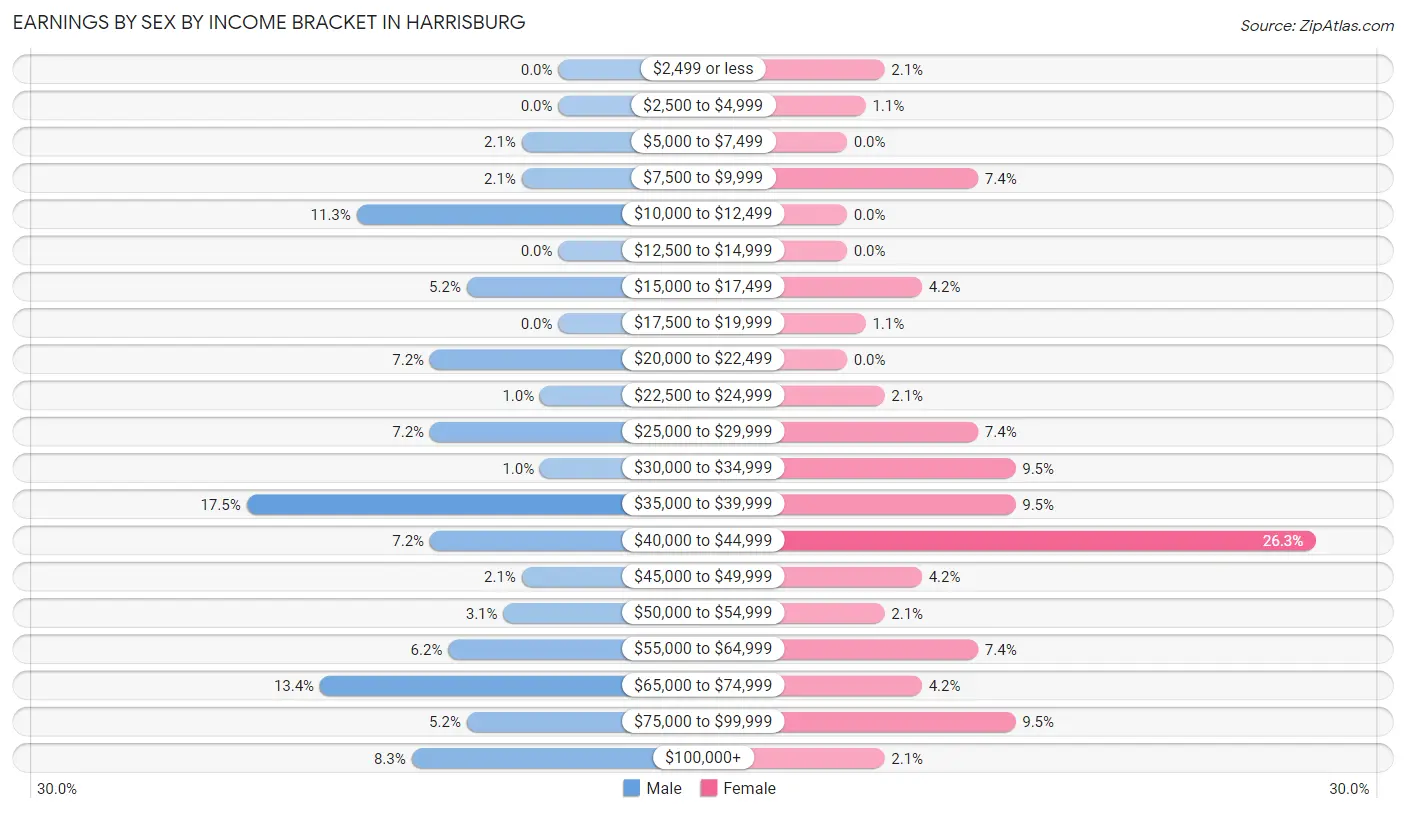
Earnings by Sex by Income Bracket in Harrisburg
The most common earnings brackets in Harrisburg are $35,000 to $39,999 for men (17 | 17.5%) and $40,000 to $44,999 for women (25 | 26.3%).
| Income | Male | Female |
| $2,499 or less | 0 (0.0%) | 2 (2.1%) |
| $2,500 to $4,999 | 0 (0.0%) | 1 (1.1%) |
| $5,000 to $7,499 | 2 (2.1%) | 0 (0.0%) |
| $7,500 to $9,999 | 2 (2.1%) | 7 (7.4%) |
| $10,000 to $12,499 | 11 (11.3%) | 0 (0.0%) |
| $12,500 to $14,999 | 0 (0.0%) | 0 (0.0%) |
| $15,000 to $17,499 | 5 (5.1%) | 4 (4.2%) |
| $17,500 to $19,999 | 0 (0.0%) | 1 (1.1%) |
| $20,000 to $22,499 | 7 (7.2%) | 0 (0.0%) |
| $22,500 to $24,999 | 1 (1.0%) | 2 (2.1%) |
| $25,000 to $29,999 | 7 (7.2%) | 7 (7.4%) |
| $30,000 to $34,999 | 1 (1.0%) | 9 (9.5%) |
| $35,000 to $39,999 | 17 (17.5%) | 9 (9.5%) |
| $40,000 to $44,999 | 7 (7.2%) | 25 (26.3%) |
| $45,000 to $49,999 | 2 (2.1%) | 4 (4.2%) |
| $50,000 to $54,999 | 3 (3.1%) | 2 (2.1%) |
| $55,000 to $64,999 | 6 (6.2%) | 7 (7.4%) |
| $65,000 to $74,999 | 13 (13.4%) | 4 (4.2%) |
| $75,000 to $99,999 | 5 (5.1%) | 9 (9.5%) |
| $100,000+ | 8 (8.3%) | 2 (2.1%) |
| Total | 97 (100.0%) | 95 (100.0%) |
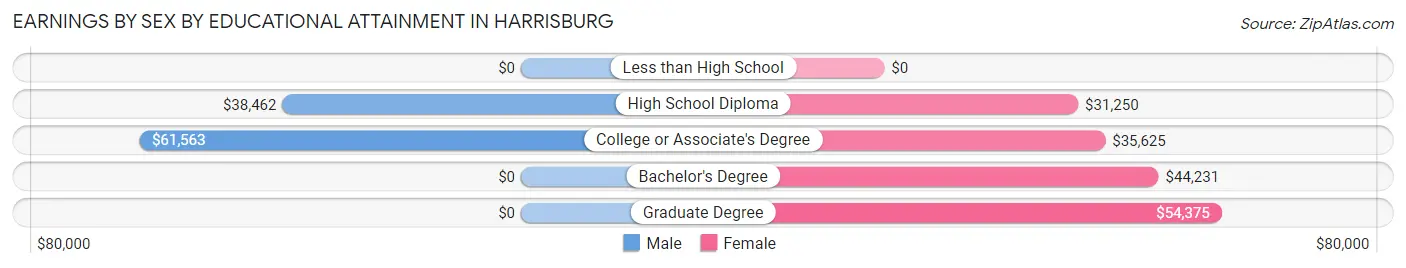
Earnings by Sex by Educational Attainment in Harrisburg
Average earnings in Harrisburg are $44,500 for men and $42,697 for women, a difference of 4.1%. Men with an educational attainment of college or associate's degree enjoy the highest average annual earnings of $61,563, while those with high school diploma education earn the least with $38,462. Women with an educational attainment of graduate degree earn the most with the average annual earnings of $54,375, while those with high school diploma education have the smallest earnings of $31,250.
| Educational Attainment | Male Income | Female Income |
| Less than High School | - | - |
| High School Diploma | $38,462 | $31,250 |
| College or Associate's Degree | $61,563 | $35,625 |
| Bachelor's Degree | - | - |
| Graduate Degree | - | - |
| Total | $44,500 | $42,697 |
Family Income in Harrisburg
Family Income Brackets in Harrisburg
According to the Harrisburg family income data, there are 30 families falling into the $75,000 to $99,999 income range, which is the most common income bracket and makes up 32.3% of all families.
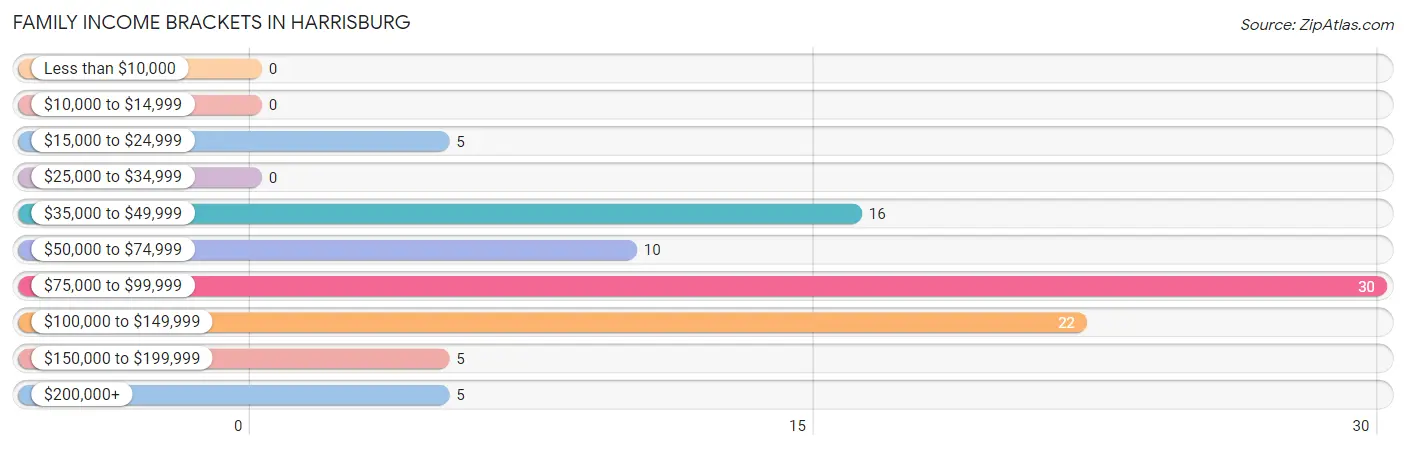
| Income Bracket | # Families | % Families |
| Less than $10,000 | 0 | 0.0% |
| $10,000 to $14,999 | 0 | 0.0% |
| $15,000 to $24,999 | 5 | 5.4% |
| $25,000 to $34,999 | 0 | 0.0% |
| $35,000 to $49,999 | 16 | 17.2% |
| $50,000 to $74,999 | 10 | 10.8% |
| $75,000 to $99,999 | 30 | 32.3% |
| $100,000 to $149,999 | 22 | 23.7% |
| $150,000 to $199,999 | 5 | 5.4% |
| $200,000+ | 5 | 5.4% |
Family Income by Famaliy Size in Harrisburg
4-person families (19 | 20.4%) account for the highest median family income in Harrisburg with $113,542 per family, while 2-person families (34 | 36.6%) have the highest median income of $32,084 per family member.
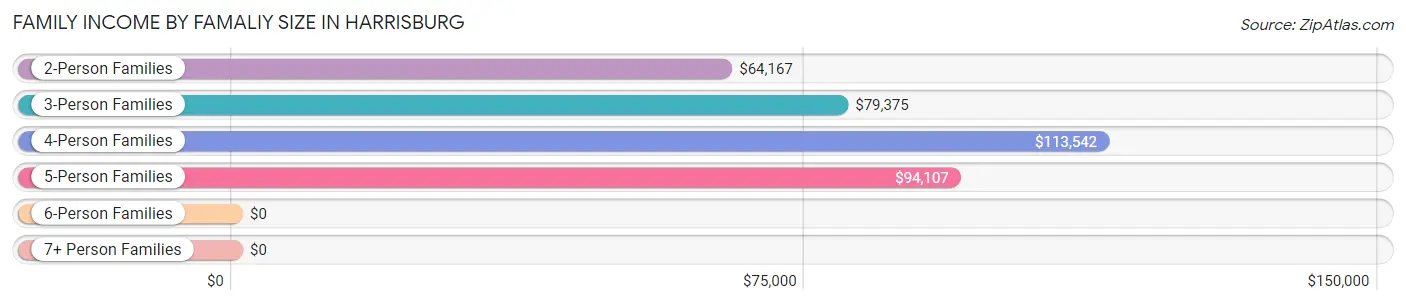
| Income Bracket | # Families | Median Income |
| 2-Person Families | 34 (36.6%) | $64,167 |
| 3-Person Families | 25 (26.9%) | $79,375 |
| 4-Person Families | 19 (20.4%) | $113,542 |
| 5-Person Families | 13 (14.0%) | $94,107 |
| 6-Person Families | 2 (2.1%) | $0 |
| 7+ Person Families | 0 (0.0%) | $0 |
| Total | 93 (100.0%) | $88,125 |
Family Income by Number of Earners in Harrisburg
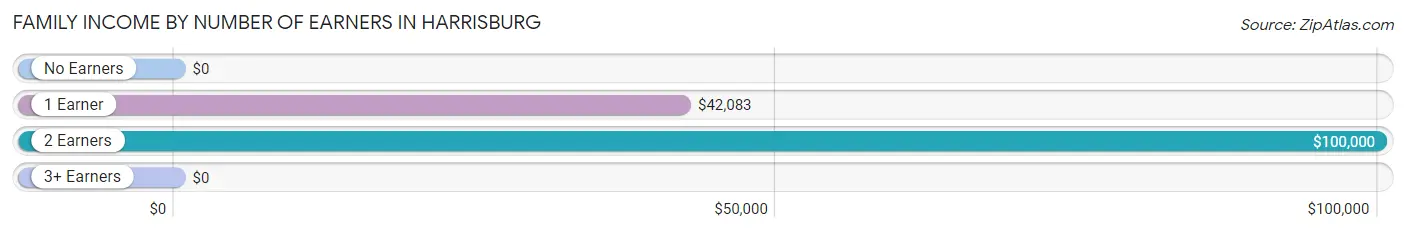
| Number of Earners | # Families | Median Income |
| No Earners | 7 (7.5%) | $0 |
| 1 Earner | 24 (25.8%) | $42,083 |
| 2 Earners | 50 (53.8%) | $100,000 |
| 3+ Earners | 12 (12.9%) | $0 |
| Total | 93 (100.0%) | $88,125 |
Household Income in Harrisburg
Household Income Brackets in Harrisburg
With 34 households falling in the category, the $75,000 to $99,999 income range is the most frequent in Harrisburg, accounting for 24.1% of all households. In contrast, only 1 households (0.7%) fall into the $10,000 to $14,999 income bracket, making it the least populous group.
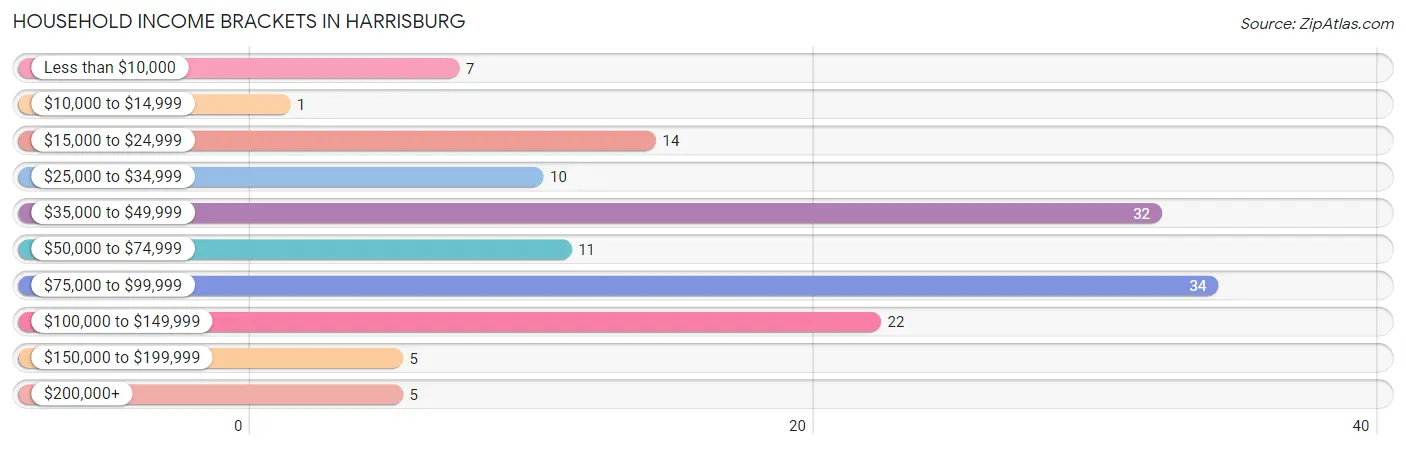
| Income Bracket | # Households | % Households |
| Less than $10,000 | 7 | 5.0% |
| $10,000 to $14,999 | 1 | 0.7% |
| $15,000 to $24,999 | 14 | 9.9% |
| $25,000 to $34,999 | 10 | 7.1% |
| $35,000 to $49,999 | 32 | 22.7% |
| $50,000 to $74,999 | 11 | 7.8% |
| $75,000 to $99,999 | 34 | 24.1% |
| $100,000 to $149,999 | 22 | 15.6% |
| $150,000 to $199,999 | 5 | 3.5% |
| $200,000+ | 5 | 3.5% |
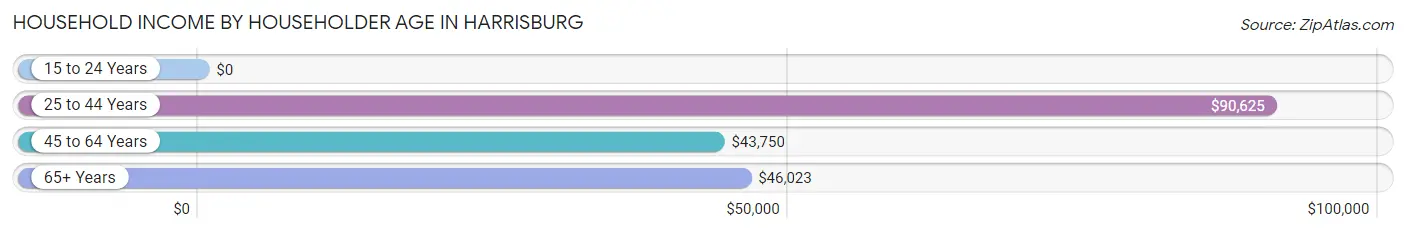
Household Income by Householder Age in Harrisburg
The median household income in Harrisburg is $70,893, with the highest median household income of $90,625 found in the 25 to 44 years age bracket for the primary householder. A total of 67 households (47.5%) fall into this category. Meanwhile, the 15 to 24 years age bracket for the primary householder has the lowest median household income of $0, with 11 households (7.8%) in this group.
| Income Bracket | # Households | Median Income |
| 15 to 24 Years | 11 (7.8%) | $0 |
| 25 to 44 Years | 67 (47.5%) | $90,625 |
| 45 to 64 Years | 34 (24.1%) | $43,750 |
| 65+ Years | 29 (20.6%) | $46,023 |
| Total | 141 (100.0%) | $70,893 |
Poverty in Harrisburg
Income Below Poverty by Sex and Age in Harrisburg
With 10.2% poverty level for males and 11.9% for females among the residents of Harrisburg, 16 and 17 year old males and 75 year old and over females are the most vulnerable to poverty, with 14 males (56.0%) and 7 females (87.5%) in their respective age groups living below the poverty level.
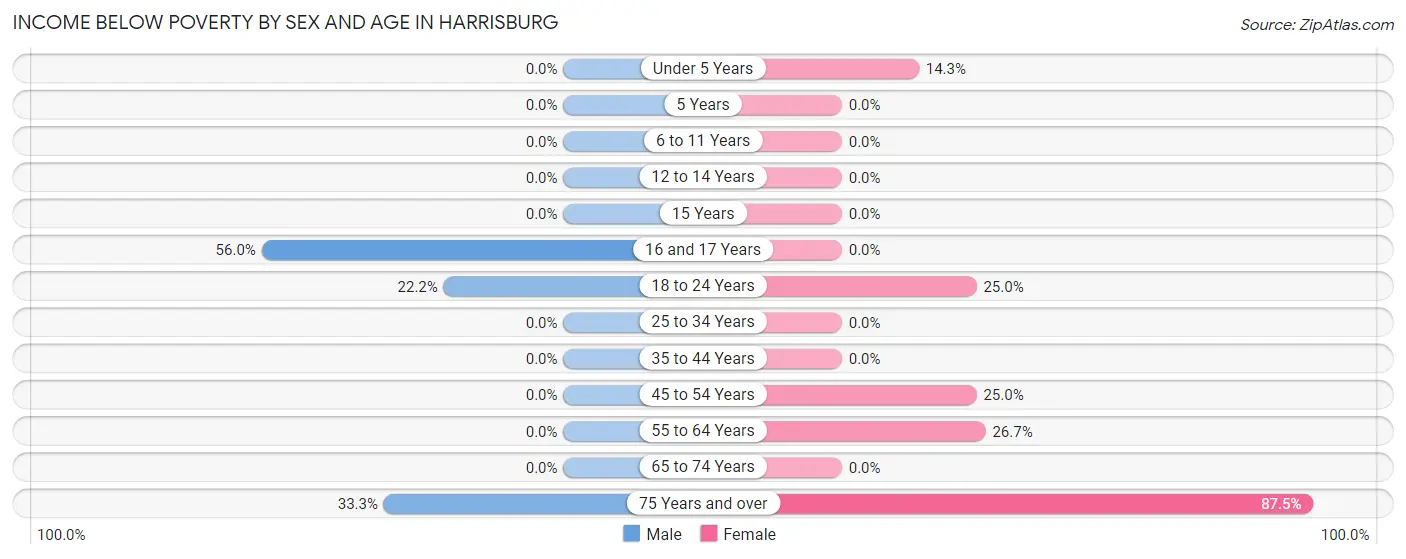
| Age Bracket | Male | Female |
| Under 5 Years | 0 (0.0%) | 2 (14.3%) |
| 5 Years | 0 (0.0%) | 0 (0.0%) |
| 6 to 11 Years | 0 (0.0%) | 0 (0.0%) |
| 12 to 14 Years | 0 (0.0%) | 0 (0.0%) |
| 15 Years | 0 (0.0%) | 0 (0.0%) |
| 16 and 17 Years | 14 (56.0%) | 0 (0.0%) |
| 18 to 24 Years | 4 (22.2%) | 2 (25.0%) |
| 25 to 34 Years | 0 (0.0%) | 0 (0.0%) |
| 35 to 44 Years | 0 (0.0%) | 0 (0.0%) |
| 45 to 54 Years | 0 (0.0%) | 6 (25.0%) |
| 55 to 64 Years | 0 (0.0%) | 4 (26.7%) |
| 65 to 74 Years | 0 (0.0%) | 0 (0.0%) |
| 75 Years and over | 1 (33.3%) | 7 (87.5%) |
| Total | 19 (10.2%) | 21 (11.9%) |
Income Above Poverty by Sex and Age in Harrisburg
According to the poverty statistics in Harrisburg, males aged under 5 years and females aged 6 to 11 years are the age groups that are most secure financially, with 100.0% of males and 100.0% of females in these age groups living above the poverty line.
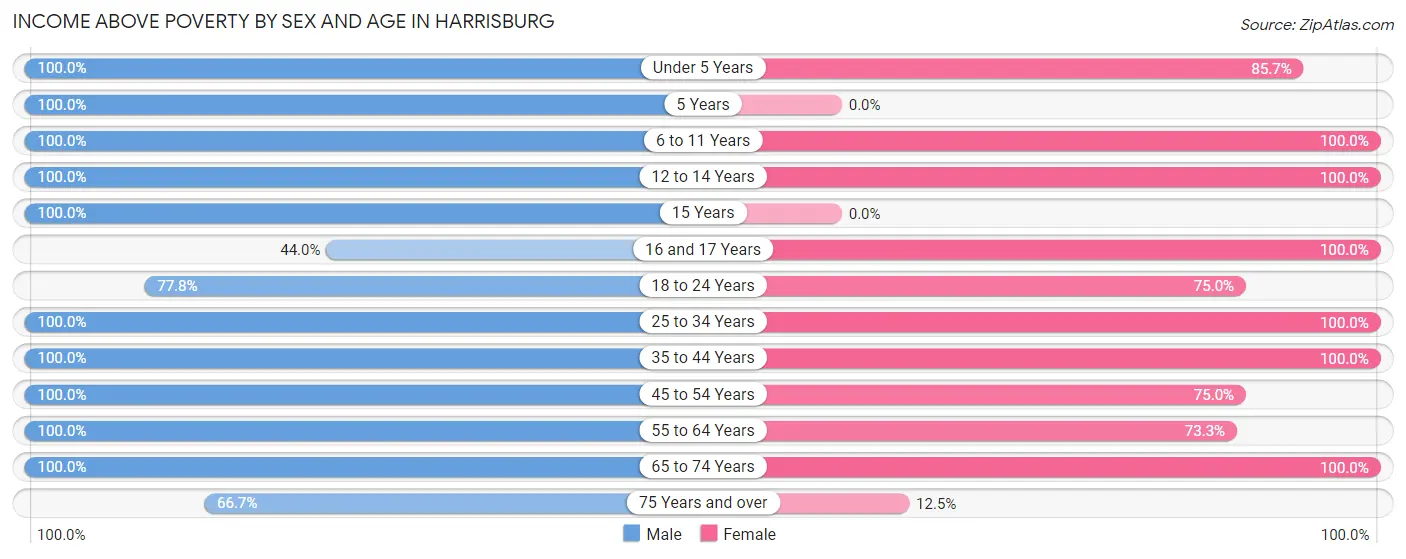
| Age Bracket | Male | Female |
| Under 5 Years | 26 (100.0%) | 12 (85.7%) |
| 5 Years | 4 (100.0%) | 0 (0.0%) |
| 6 to 11 Years | 18 (100.0%) | 21 (100.0%) |
| 12 to 14 Years | 8 (100.0%) | 6 (100.0%) |
| 15 Years | 6 (100.0%) | 0 (0.0%) |
| 16 and 17 Years | 11 (44.0%) | 2 (100.0%) |
| 18 to 24 Years | 14 (77.8%) | 6 (75.0%) |
| 25 to 34 Years | 23 (100.0%) | 33 (100.0%) |
| 35 to 44 Years | 40 (100.0%) | 21 (100.0%) |
| 45 to 54 Years | 3 (100.0%) | 18 (75.0%) |
| 55 to 64 Years | 9 (100.0%) | 11 (73.3%) |
| 65 to 74 Years | 4 (100.0%) | 24 (100.0%) |
| 75 Years and over | 2 (66.7%) | 1 (12.5%) |
| Total | 168 (89.8%) | 155 (88.1%) |
Income Below Poverty Among Married-Couple Families in Harrisburg
The poverty statistics for married-couple families in Harrisburg show that 1.6% or 1 of the total 61 families live below the poverty line. Families with no children have the highest poverty rate of 5.3%, comprising of 1 families. On the other hand, families with 1 or 2 children have the lowest poverty rate of 0.0%, which includes 0 families.
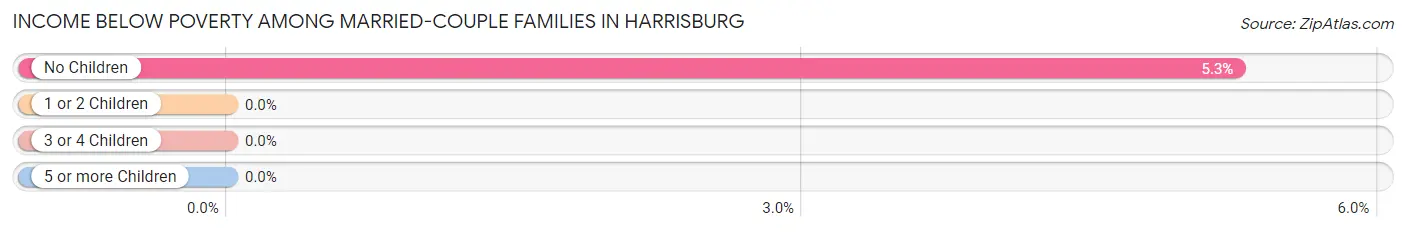
| Children | Above Poverty | Below Poverty |
| No Children | 18 (94.7%) | 1 (5.3%) |
| 1 or 2 Children | 27 (100.0%) | 0 (0.0%) |
| 3 or 4 Children | 15 (100.0%) | 0 (0.0%) |
| 5 or more Children | 0 (0.0%) | 0 (0.0%) |
| Total | 60 (98.4%) | 1 (1.6%) |
Income Below Poverty Among Single-Parent Households in Harrisburg
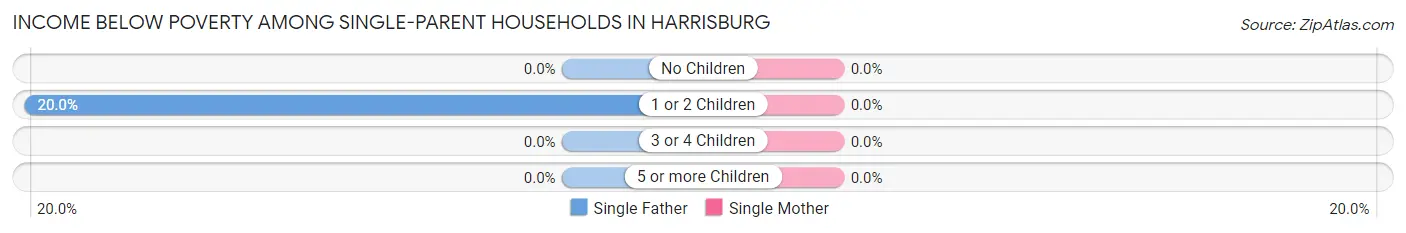
| Children | Single Father | Single Mother |
| No Children | 0 (0.0%) | 0 (0.0%) |
| 1 or 2 Children | 2 (20.0%) | 0 (0.0%) |
| 3 or 4 Children | 0 (0.0%) | 0 (0.0%) |
| 5 or more Children | 0 (0.0%) | 0 (0.0%) |
| Total | 2 (20.0%) | 0 (0.0%) |
Income Below Poverty Among Married-Couple vs Single-Parent Households in Harrisburg
The poverty data for Harrisburg shows that 1 of the married-couple family households (1.6%) and 2 of the single-parent households (6.2%) are living below the poverty level. Within the married-couple family households, those with no children have the highest poverty rate, with 1 households (5.3%) falling below the poverty line. Among the single-parent households, those with 1 or 2 children have the highest poverty rate, with 2 household (7.7%) living below poverty.
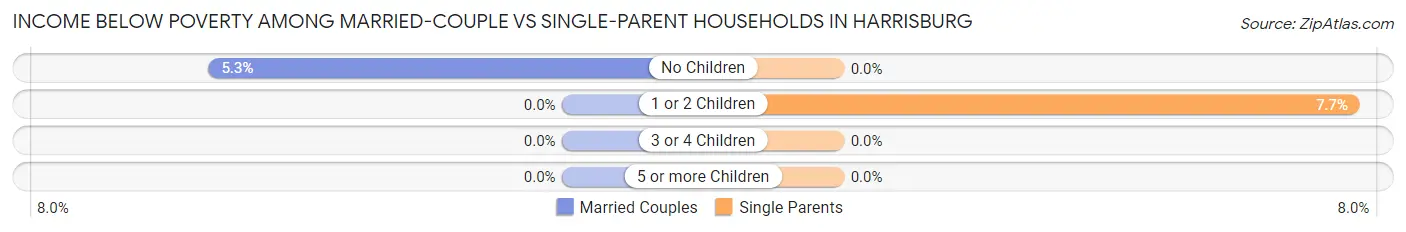
| Children | Married-Couple Families | Single-Parent Households |
| No Children | 1 (5.3%) | 0 (0.0%) |
| 1 or 2 Children | 0 (0.0%) | 2 (7.7%) |
| 3 or 4 Children | 0 (0.0%) | 0 (0.0%) |
| 5 or more Children | 0 (0.0%) | 0 (0.0%) |
| Total | 1 (1.6%) | 2 (6.2%) |
Race in Harrisburg
The most populous races in Harrisburg are White / Caucasian (337 | 89.4%), Hispanic or Latino (26 | 6.9%), and Some other Race (22 | 5.8%).
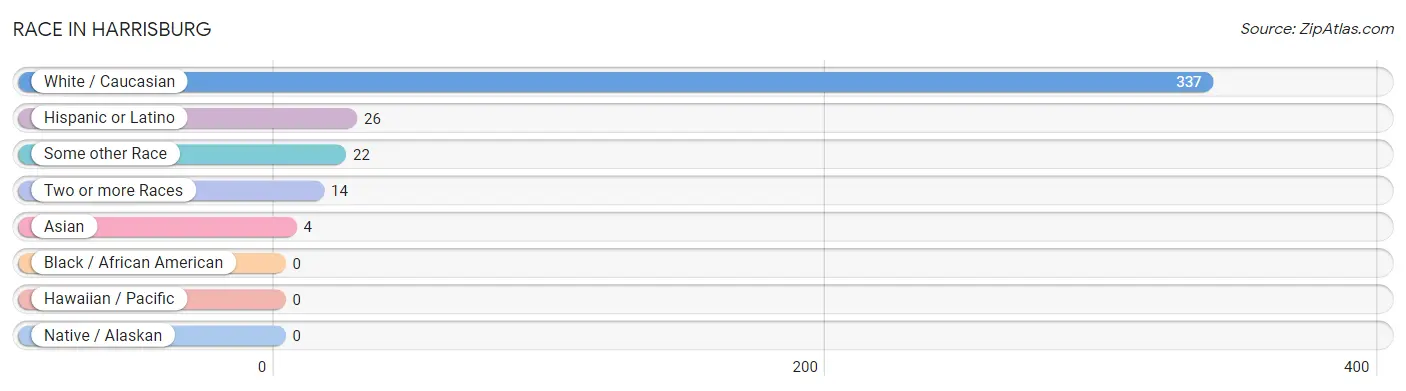
| Race | # Population | % Population |
| Asian | 4 | 1.1% |
| Black / African American | 0 | 0.0% |
| Hawaiian / Pacific | 0 | 0.0% |
| Hispanic or Latino | 26 | 6.9% |
| Native / Alaskan | 0 | 0.0% |
| White / Caucasian | 337 | 89.4% |
| Two or more Races | 14 | 3.7% |
| Some other Race | 22 | 5.8% |
| Total | 377 | 100.0% |
Ancestry in Harrisburg
The most populous ancestries reported in Harrisburg are German (64 | 17.0%), Irish (63 | 16.7%), American (37 | 9.8%), Mexican (22 | 5.8%), and English (20 | 5.3%), together accounting for 54.6% of all Harrisburg residents.
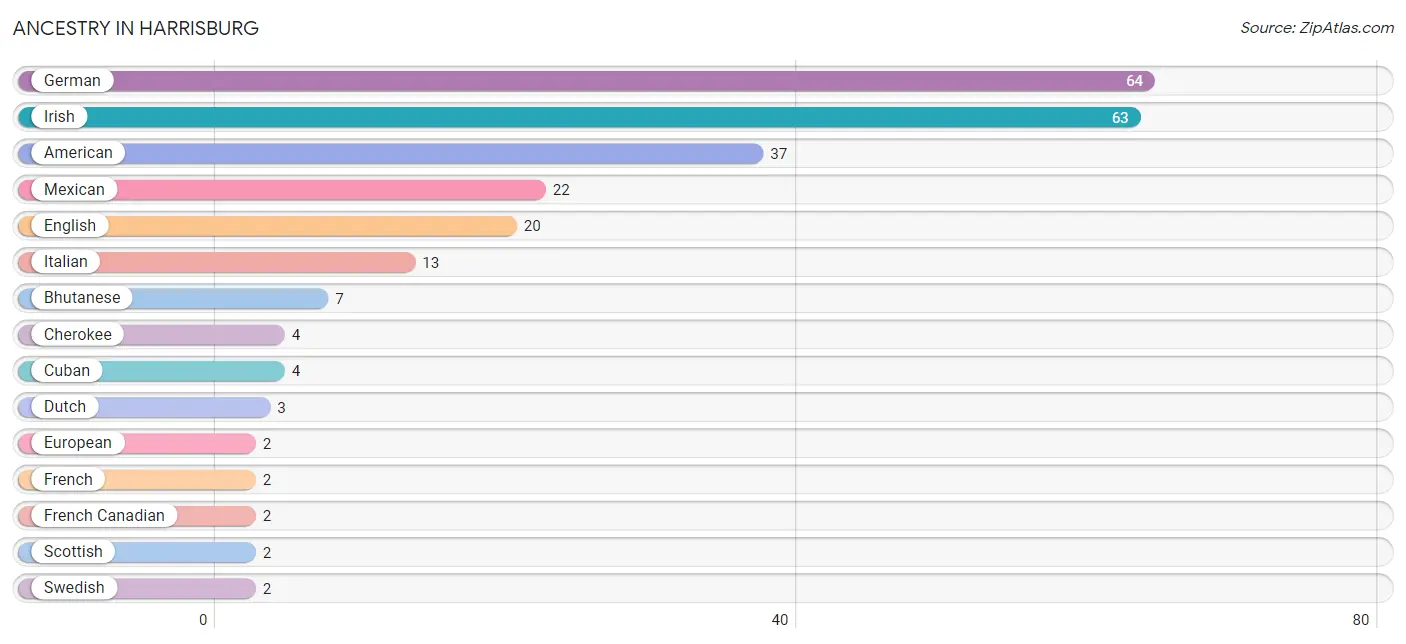
| Ancestry | # Population | % Population |
| American | 37 | 9.8% |
| Bhutanese | 7 | 1.9% |
| Cherokee | 4 | 1.1% |
| Cuban | 4 | 1.1% |
| Dutch | 3 | 0.8% |
| English | 20 | 5.3% |
| European | 2 | 0.5% |
| Finnish | 1 | 0.3% |
| French | 2 | 0.5% |
| French Canadian | 2 | 0.5% |
| German | 64 | 17.0% |
| Hungarian | 1 | 0.3% |
| Irish | 63 | 16.7% |
| Italian | 13 | 3.5% |
| Korean | 1 | 0.3% |
| Mexican | 22 | 5.8% |
| Scottish | 2 | 0.5% |
| Swedish | 2 | 0.5% |
| Welsh | 1 | 0.3% | View All 19 Rows |
Immigrants in Harrisburg
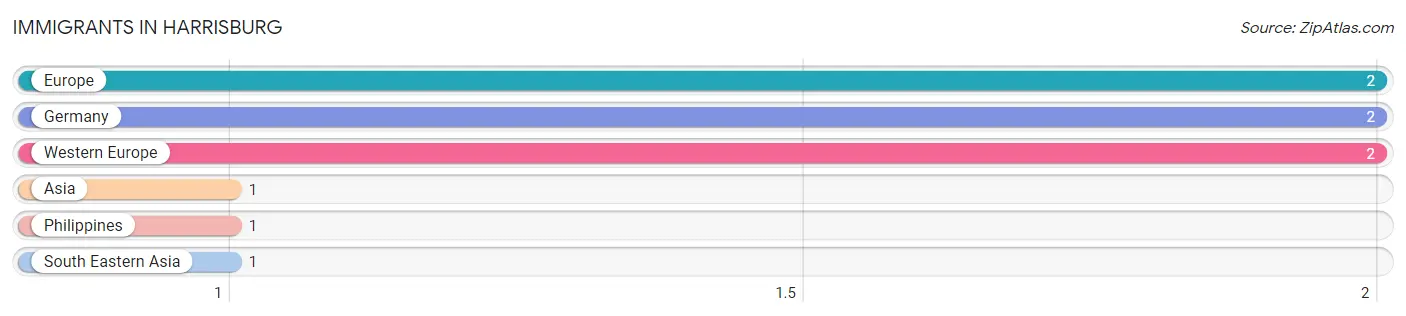
The most numerous immigrant groups reported in Harrisburg came from Europe (2 | 0.5%), Germany (2 | 0.5%), Western Europe (2 | 0.5%), Asia (1 | 0.3%), and Philippines (1 | 0.3%), together accounting for 2.1% of all Harrisburg residents.
| Immigration Origin | # Population | % Population |
| Asia | 1 | 0.3% |
| Europe | 2 | 0.5% |
| Germany | 2 | 0.5% |
| Philippines | 1 | 0.3% |
| South Eastern Asia | 1 | 0.3% |
| Western Europe | 2 | 0.5% | View All 6 Rows |
Sex and Age in Harrisburg
Sex and Age in Harrisburg
The most populous age groups in Harrisburg are 15 to 19 Years (38 | 19.7%) for men and 10 to 14 Years (25 | 13.6%) for women.
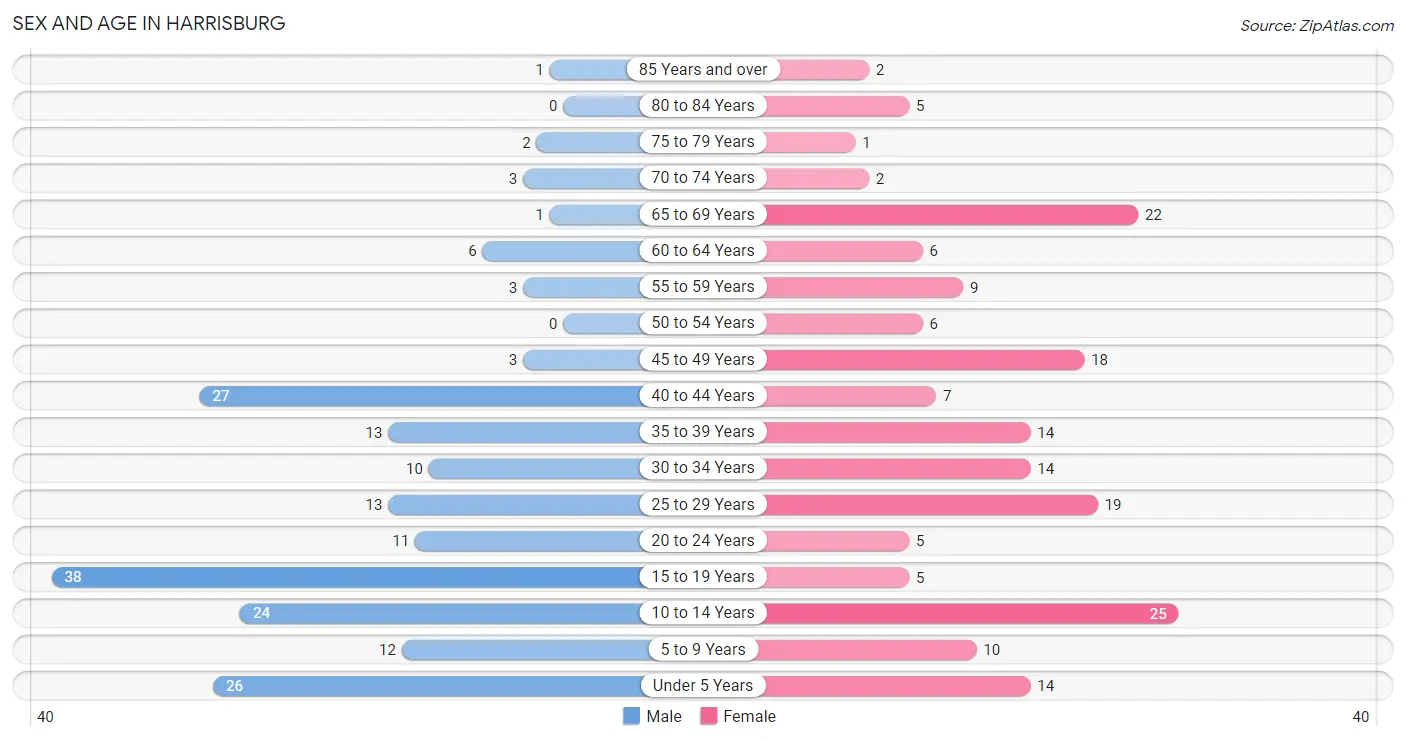
| Age Bracket | Male | Female |
| Under 5 Years | 26 (13.5%) | 14 (7.6%) |
| 5 to 9 Years | 12 (6.2%) | 10 (5.4%) |
| 10 to 14 Years | 24 (12.4%) | 25 (13.6%) |
| 15 to 19 Years | 38 (19.7%) | 5 (2.7%) |
| 20 to 24 Years | 11 (5.7%) | 5 (2.7%) |
| 25 to 29 Years | 13 (6.7%) | 19 (10.3%) |
| 30 to 34 Years | 10 (5.2%) | 14 (7.6%) |
| 35 to 39 Years | 13 (6.7%) | 14 (7.6%) |
| 40 to 44 Years | 27 (14.0%) | 7 (3.8%) |
| 45 to 49 Years | 3 (1.5%) | 18 (9.8%) |
| 50 to 54 Years | 0 (0.0%) | 6 (3.3%) |
| 55 to 59 Years | 3 (1.5%) | 9 (4.9%) |
| 60 to 64 Years | 6 (3.1%) | 6 (3.3%) |
| 65 to 69 Years | 1 (0.5%) | 22 (12.0%) |
| 70 to 74 Years | 3 (1.5%) | 2 (1.1%) |
| 75 to 79 Years | 2 (1.0%) | 1 (0.5%) |
| 80 to 84 Years | 0 (0.0%) | 5 (2.7%) |
| 85 Years and over | 1 (0.5%) | 2 (1.1%) |
| Total | 193 (100.0%) | 184 (100.0%) |
Families and Households in Harrisburg
Median Family Size in Harrisburg
The median family size in Harrisburg is 3.12 persons per family, with married-couple families (61 | 65.6%) accounting for the largest median family size of 3.69 persons per family. On the other hand, single male/father families (10 | 10.7%) represent the smallest median family size with 2.00 persons per family.
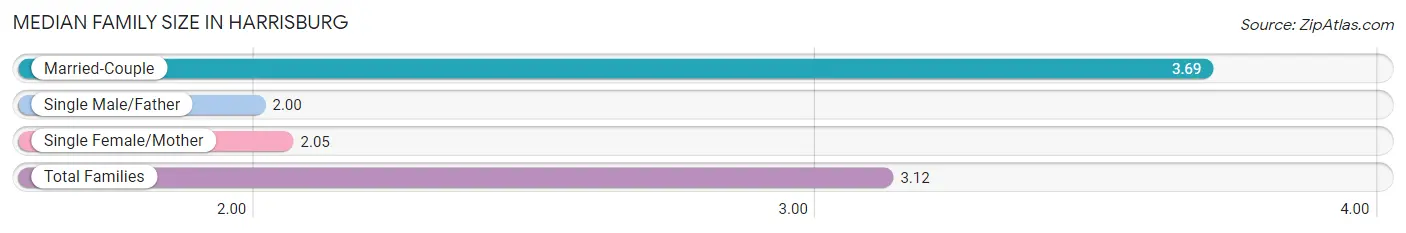
| Family Type | # Families | Family Size |
| Married-Couple | 61 (65.6%) | 3.69 |
| Single Male/Father | 10 (10.7%) | 2.00 |
| Single Female/Mother | 22 (23.7%) | 2.05 |
| Total Families | 93 (100.0%) | 3.12 |
Median Household Size in Harrisburg
The median household size in Harrisburg is 2.67 persons per household, with married-couple households (61 | 43.3%) accounting for the largest median household size of 3.79 persons per household. non-family households (48 | 34.0%) represent the smallest median household size with 1.65 persons per household.
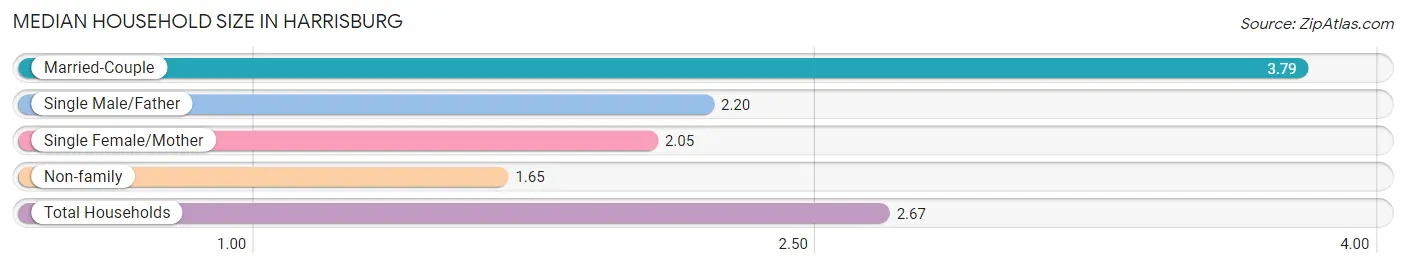
| Household Type | # Households | Household Size |
| Married-Couple | 61 (43.3%) | 3.79 |
| Single Male/Father | 10 (7.1%) | 2.20 |
| Single Female/Mother | 22 (15.6%) | 2.05 |
| Non-family | 48 (34.0%) | 1.65 |
| Total Households | 141 (100.0%) | 2.67 |
Household Size by Marriage Status in Harrisburg
Out of a total of 141 households in Harrisburg, 93 (66.0%) are family households, while 48 (34.0%) are nonfamily households. The most numerous type of family households are 2-person households, comprising 32, and the most common type of nonfamily households are 1-person households, comprising 39.
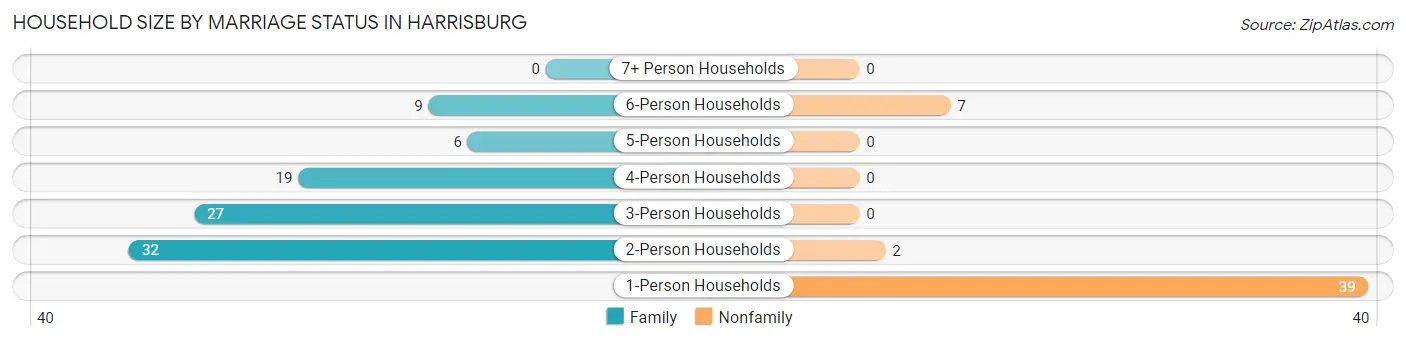
| Household Size | Family Households | Nonfamily Households |
| 1-Person Households | - | 39 (27.7%) |
| 2-Person Households | 32 (22.7%) | 2 (1.4%) |
| 3-Person Households | 27 (19.2%) | 0 (0.0%) |
| 4-Person Households | 19 (13.5%) | 0 (0.0%) |
| 5-Person Households | 6 (4.3%) | 0 (0.0%) |
| 6-Person Households | 9 (6.4%) | 7 (5.0%) |
| 7+ Person Households | 0 (0.0%) | 0 (0.0%) |
| Total | 93 (66.0%) | 48 (34.0%) |
Female Fertility in Harrisburg
Fertility by Age in Harrisburg
Average fertility rate in Harrisburg is 232.0 births per 1,000 women. Women in the age bracket of 20 to 34 years have the highest fertility rate with 500.0 births per 1,000 women. Women in the age bracket of 20 to 34 years acount for 100.0% of all women with births.
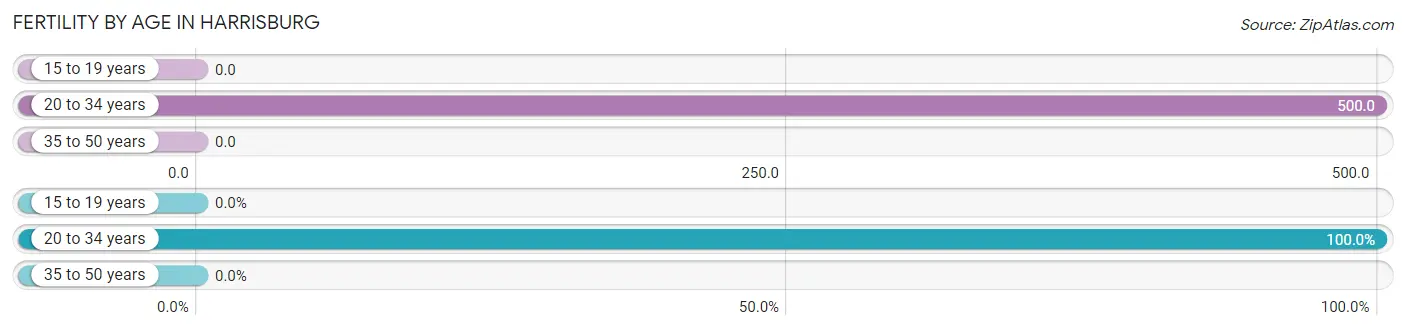
| Age Bracket | Women with Births | Births / 1,000 Women |
| 15 to 19 years | 0 (0.0%) | 0.0 |
| 20 to 34 years | 19 (100.0%) | 500.0 |
| 35 to 50 years | 0 (0.0%) | 0.0 |
| Total | 19 (100.0%) | 232.0 |
Fertility by Age by Marriage Status in Harrisburg
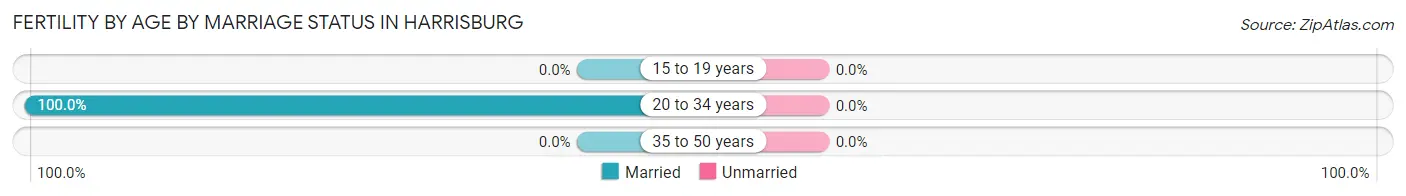
| Age Bracket | Married | Unmarried |
| 15 to 19 years | 0 (0.0%) | 0 (0.0%) |
| 20 to 34 years | 19 (100.0%) | 0 (0.0%) |
| 35 to 50 years | 0 (0.0%) | 0 (0.0%) |
| Total | 19 (100.0%) | 0 (0.0%) |
Fertility by Education in Harrisburg
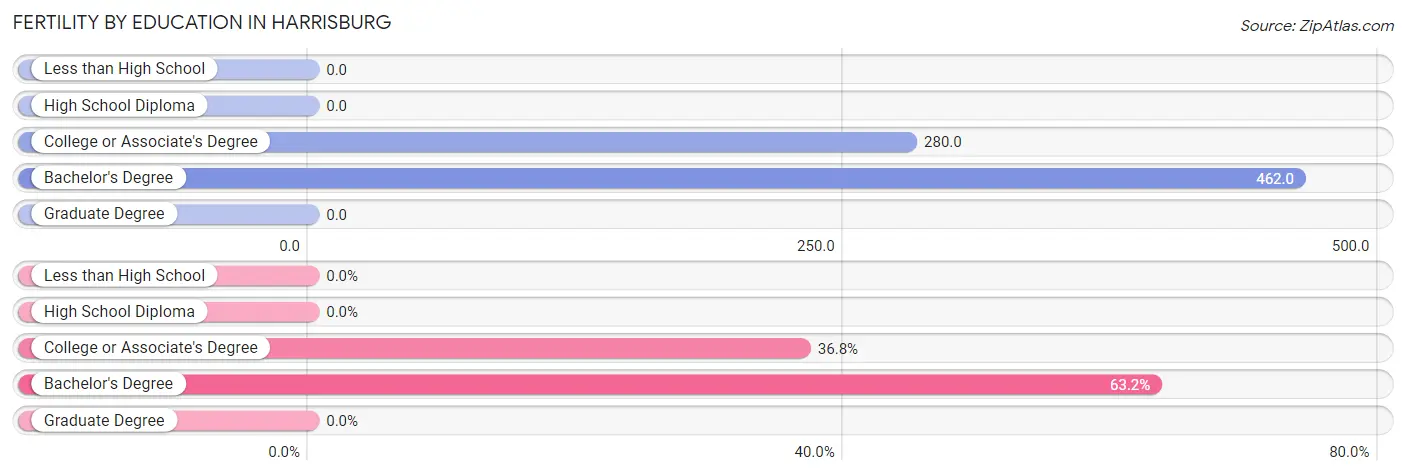
| Educational Attainment | Women with Births | Births / 1,000 Women |
| Less than High School | 0 (0.0%) | 0.0 |
| High School Diploma | 0 (0.0%) | 0.0 |
| College or Associate's Degree | 7 (36.8%) | 280.0 |
| Bachelor's Degree | 12 (63.2%) | 462.0 |
| Graduate Degree | 0 (0.0%) | 0.0 |
| Total | 19 (100.0%) | 232.0 |
Fertility by Education by Marriage Status in Harrisburg
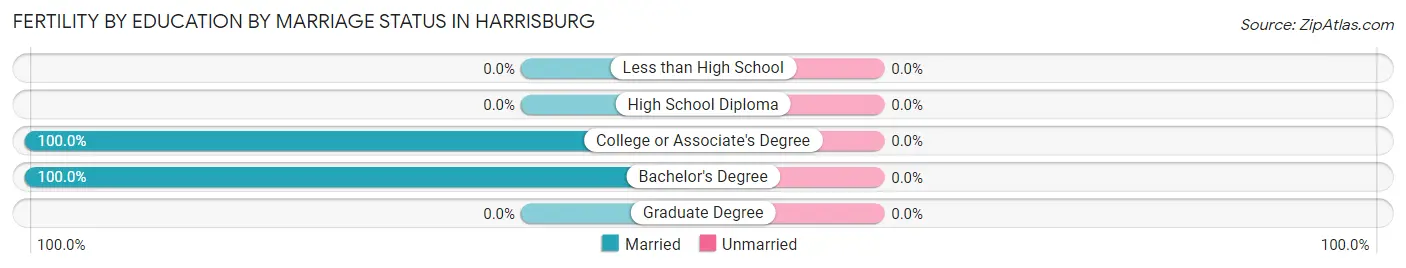
| Educational Attainment | Married | Unmarried |
| Less than High School | 0 (0.0%) | 0 (0.0%) |
| High School Diploma | 0 (0.0%) | 0 (0.0%) |
| College or Associate's Degree | 7 (100.0%) | 0 (0.0%) |
| Bachelor's Degree | 12 (100.0%) | 0 (0.0%) |
| Graduate Degree | 0 (0.0%) | 0 (0.0%) |
| Total | 19 (100.0%) | 0 (0.0%) |
Employment Characteristics in Harrisburg
Employment by Class of Employer in Harrisburg
Among the 176 employed individuals in Harrisburg, private company employees (102 | 58.0%), not-for-profit organizations (29 | 16.5%), and state government employees (20 | 11.4%) make up the most common classes of employment.
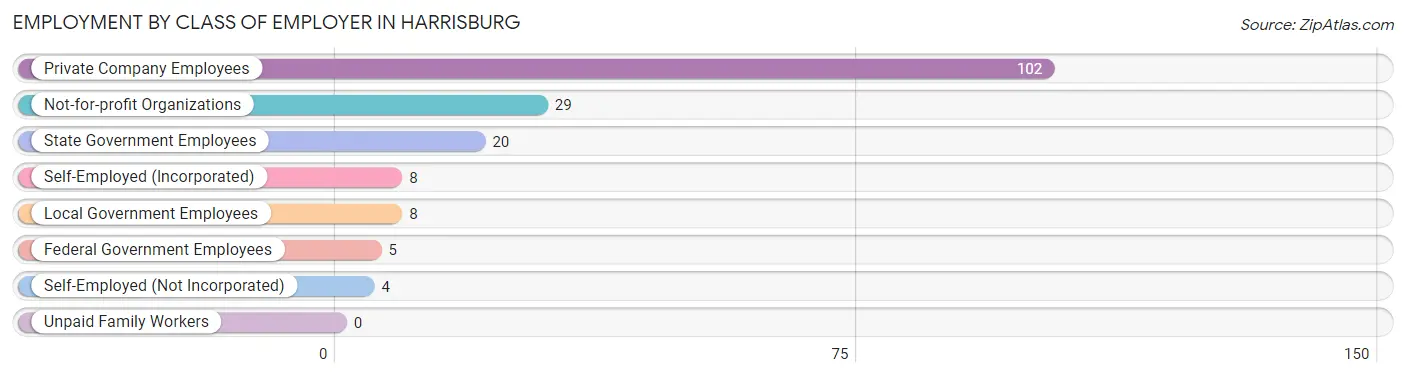
| Employer Class | # Employees | % Employees |
| Private Company Employees | 102 | 58.0% |
| Self-Employed (Incorporated) | 8 | 4.5% |
| Self-Employed (Not Incorporated) | 4 | 2.3% |
| Not-for-profit Organizations | 29 | 16.5% |
| Local Government Employees | 8 | 4.5% |
| State Government Employees | 20 | 11.4% |
| Federal Government Employees | 5 | 2.8% |
| Unpaid Family Workers | 0 | 0.0% |
| Total | 176 | 100.0% |
Employment Status by Age in Harrisburg
According to the labor force statistics for Harrisburg, out of the total population over 16 years of age (260), 71.9% or 187 individuals are in the labor force, with 2.7% or 5 of them unemployed. The age group with the highest labor force participation rate is 25 to 29 years, with 100.0% or 32 individuals in the labor force. Within the labor force, the 55 to 59 years age range has the highest percentage of unemployed individuals, with 20.0% or 2 of them being unemployed.
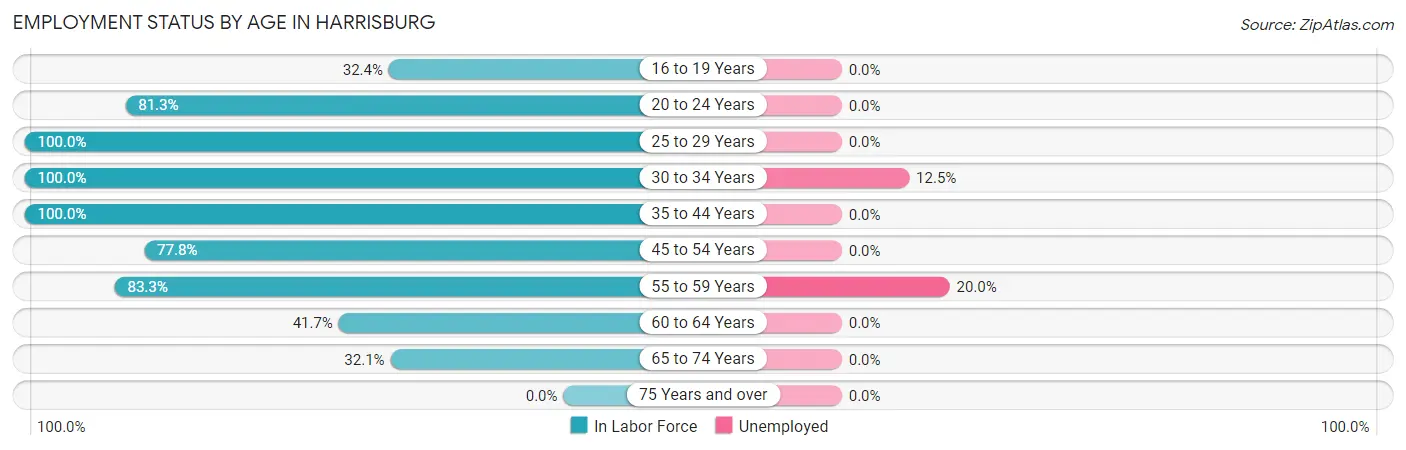
| Age Bracket | In Labor Force | Unemployed |
| 16 to 19 Years | 12 (32.4%) | 0 (0.0%) |
| 20 to 24 Years | 13 (81.3%) | 0 (0.0%) |
| 25 to 29 Years | 32 (100.0%) | 0 (0.0%) |
| 30 to 34 Years | 24 (100.0%) | 3 (12.5%) |
| 35 to 44 Years | 61 (100.0%) | 0 (0.0%) |
| 45 to 54 Years | 21 (77.8%) | 0 (0.0%) |
| 55 to 59 Years | 10 (83.3%) | 2 (20.0%) |
| 60 to 64 Years | 5 (41.7%) | 0 (0.0%) |
| 65 to 74 Years | 9 (32.1%) | 0 (0.0%) |
| 75 Years and over | 0 (0.0%) | 0 (0.0%) |
| Total | 187 (71.9%) | 5 (2.7%) |
Employment Status by Educational Attainment in Harrisburg
According to labor force statistics for Harrisburg, 91.1% of individuals (153) out of the total population between 25 and 64 years of age (168) are in the labor force, with 3.3% or 5 of them being unemployed. The group with the highest labor force participation rate are those with the educational attainment of college / associate degree, with 100.0% or 44 individuals in the labor force. Within the labor force, individuals with high school diploma education have the highest percentage of unemployment, with 9.1% or 5 of them being unemployed.
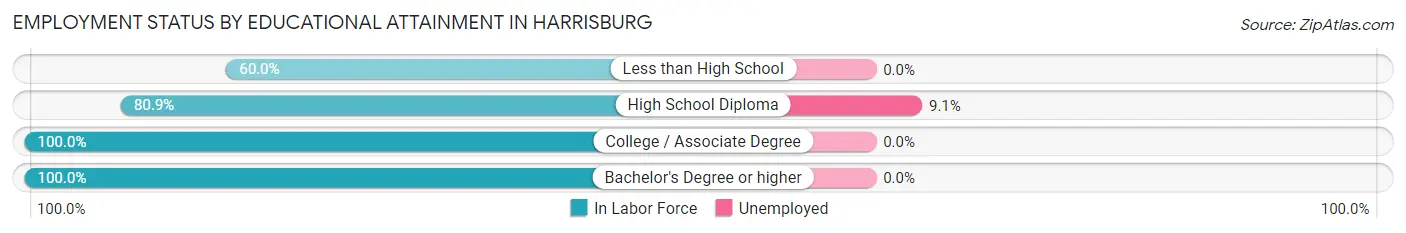
| Educational Attainment | In Labor Force | Unemployed |
| Less than High School | 3 (60.0%) | 0 (0.0%) |
| High School Diploma | 55 (80.9%) | 6 (9.1%) |
| College / Associate Degree | 44 (100.0%) | 0 (0.0%) |
| Bachelor's Degree or higher | 51 (100.0%) | 0 (0.0%) |
| Total | 153 (91.1%) | 6 (3.3%) |
Employment Occupations by Sex in Harrisburg
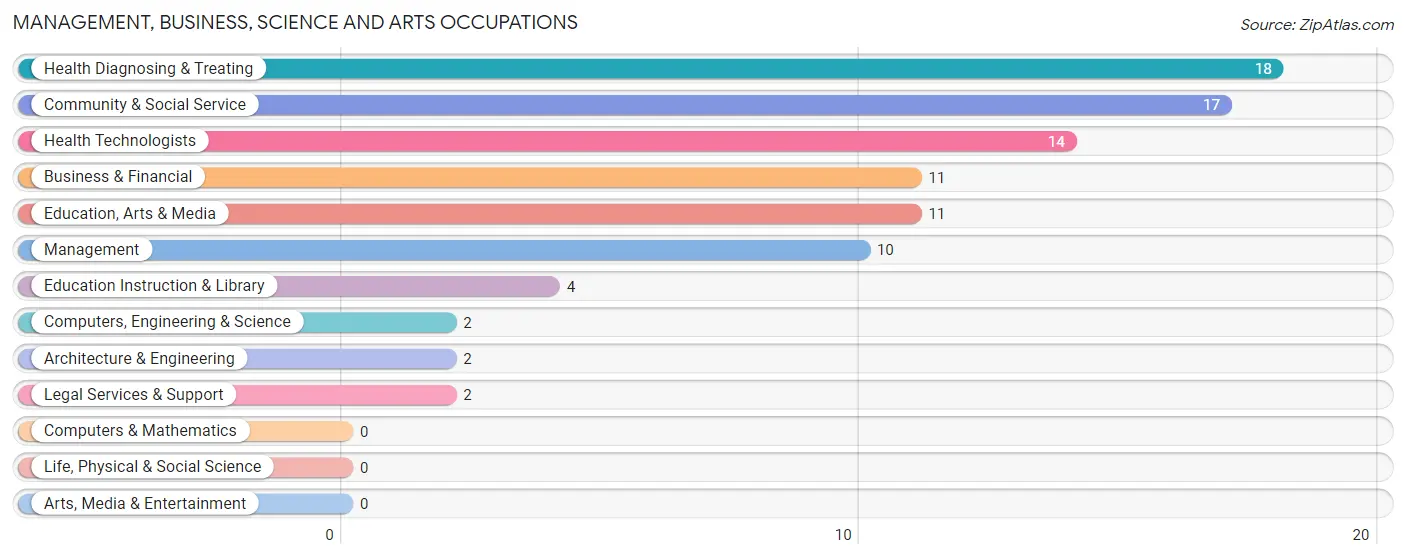
Management, Business, Science and Arts Occupations
The most common Management, Business, Science and Arts occupations in Harrisburg are Health Diagnosing & Treating (18 | 9.9%), Community & Social Service (17 | 9.3%), Health Technologists (14 | 7.7%), Business & Financial (11 | 6.0%), and Education, Arts & Media (11 | 6.0%).
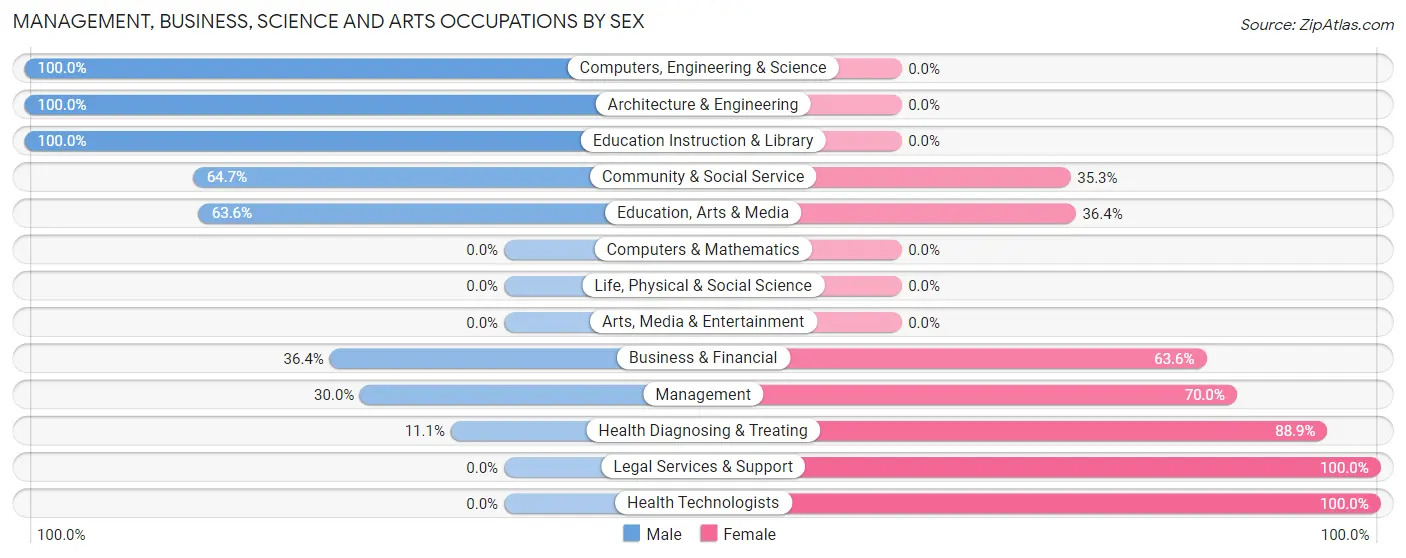
Management, Business, Science and Arts Occupations by Sex
Within the Management, Business, Science and Arts occupations in Harrisburg, the most male-oriented occupations are Computers, Engineering & Science (100.0%), Architecture & Engineering (100.0%), and Education Instruction & Library (100.0%), while the most female-oriented occupations are Legal Services & Support (100.0%), Health Technologists (100.0%), and Health Diagnosing & Treating (88.9%).
| Occupation | Male | Female |
| Management | 3 (30.0%) | 7 (70.0%) |
| Business & Financial | 4 (36.4%) | 7 (63.6%) |
| Computers, Engineering & Science | 2 (100.0%) | 0 (0.0%) |
| Computers & Mathematics | 0 (0.0%) | 0 (0.0%) |
| Architecture & Engineering | 2 (100.0%) | 0 (0.0%) |
| Life, Physical & Social Science | 0 (0.0%) | 0 (0.0%) |
| Community & Social Service | 11 (64.7%) | 6 (35.3%) |
| Education, Arts & Media | 7 (63.6%) | 4 (36.4%) |
| Legal Services & Support | 0 (0.0%) | 2 (100.0%) |
| Education Instruction & Library | 4 (100.0%) | 0 (0.0%) |
| Arts, Media & Entertainment | 0 (0.0%) | 0 (0.0%) |
| Health Diagnosing & Treating | 2 (11.1%) | 16 (88.9%) |
| Health Technologists | 0 (0.0%) | 14 (100.0%) |
| Total (Category) | 22 (37.9%) | 36 (62.1%) |
| Total (Overall) | 91 (50.0%) | 91 (50.0%) |
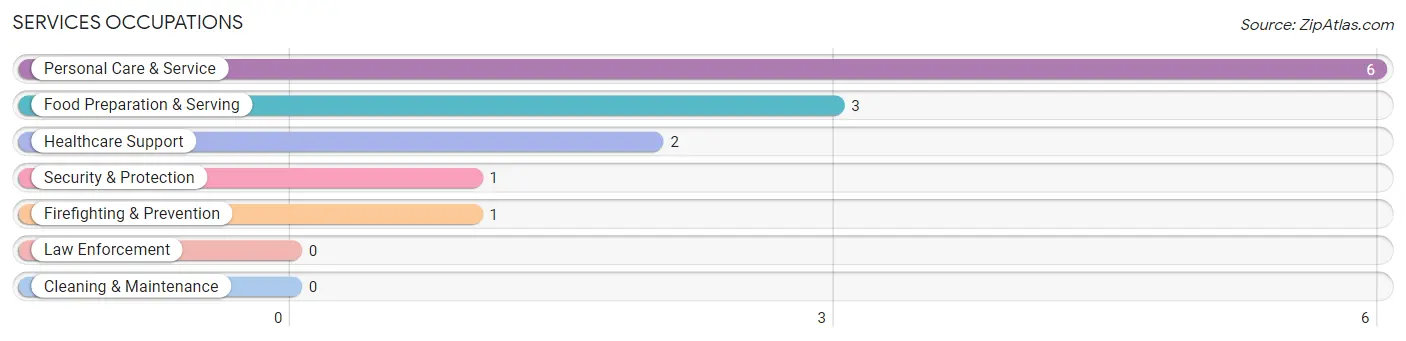
Services Occupations
The most common Services occupations in Harrisburg are Personal Care & Service (6 | 3.3%), Food Preparation & Serving (3 | 1.7%), Healthcare Support (2 | 1.1%), Security & Protection (1 | 0.5%), and Firefighting & Prevention (1 | 0.5%).
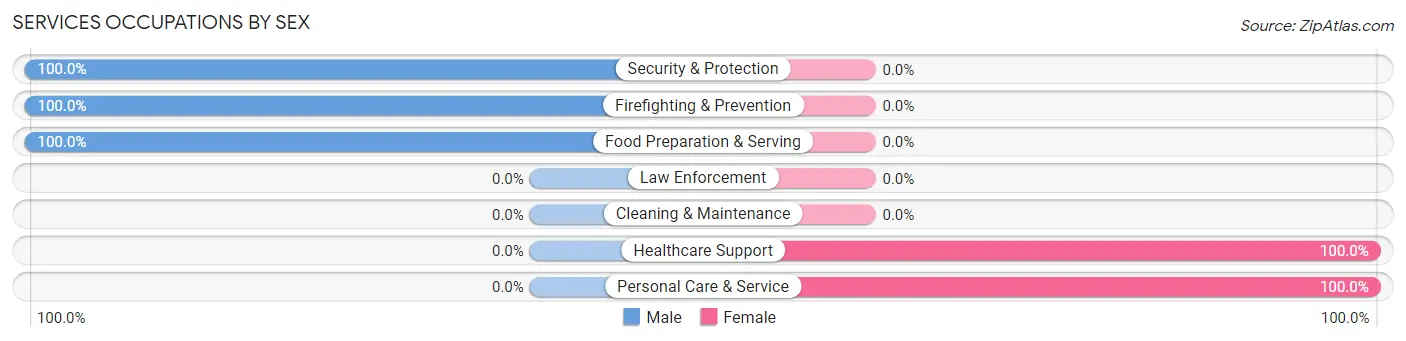
Services Occupations by Sex
Within the Services occupations in Harrisburg, the most male-oriented occupations are Security & Protection (100.0%), Firefighting & Prevention (100.0%), and Food Preparation & Serving (100.0%), while the most female-oriented occupations are Healthcare Support (100.0%), and Personal Care & Service (100.0%).
| Occupation | Male | Female |
| Healthcare Support | 0 (0.0%) | 2 (100.0%) |
| Security & Protection | 1 (100.0%) | 0 (0.0%) |
| Firefighting & Prevention | 1 (100.0%) | 0 (0.0%) |
| Law Enforcement | 0 (0.0%) | 0 (0.0%) |
| Food Preparation & Serving | 3 (100.0%) | 0 (0.0%) |
| Cleaning & Maintenance | 0 (0.0%) | 0 (0.0%) |
| Personal Care & Service | 0 (0.0%) | 6 (100.0%) |
| Total (Category) | 4 (33.3%) | 8 (66.7%) |
| Total (Overall) | 91 (50.0%) | 91 (50.0%) |
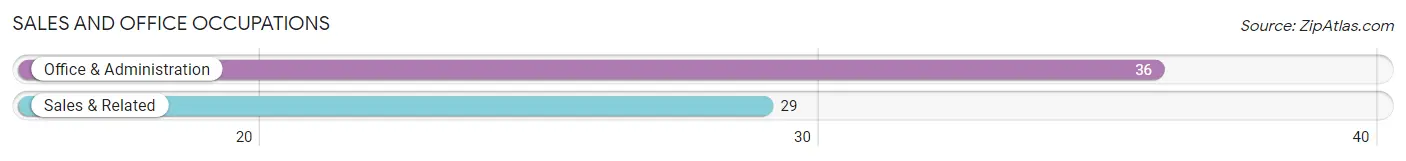
Sales and Office Occupations
The most common Sales and Office occupations in Harrisburg are Office & Administration (36 | 19.8%), and Sales & Related (29 | 15.9%).
Sales and Office Occupations by Sex
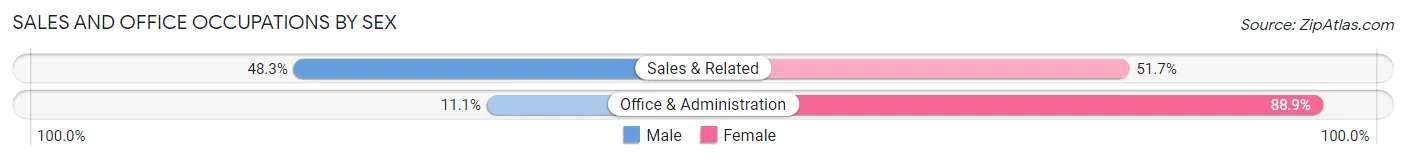
| Occupation | Male | Female |
| Sales & Related | 14 (48.3%) | 15 (51.7%) |
| Office & Administration | 4 (11.1%) | 32 (88.9%) |
| Total (Category) | 18 (27.7%) | 47 (72.3%) |
| Total (Overall) | 91 (50.0%) | 91 (50.0%) |
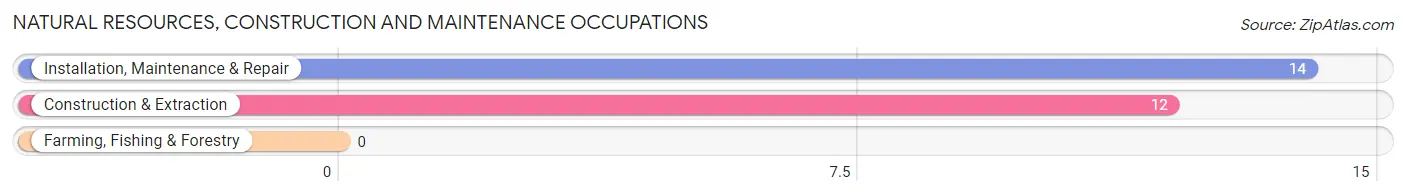
Natural Resources, Construction and Maintenance Occupations
The most common Natural Resources, Construction and Maintenance occupations in Harrisburg are Installation, Maintenance & Repair (14 | 7.7%), and Construction & Extraction (12 | 6.6%).
Natural Resources, Construction and Maintenance Occupations by Sex
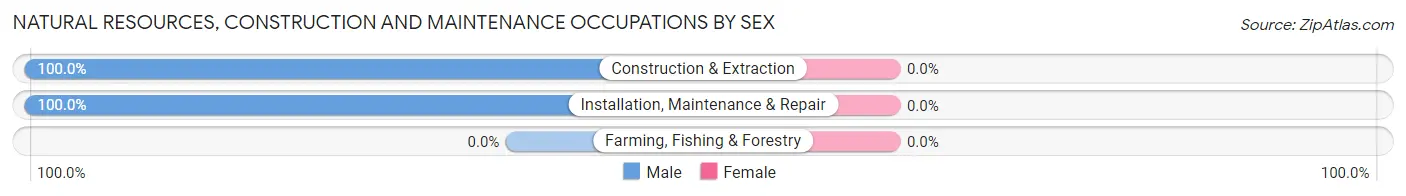
| Occupation | Male | Female |
| Farming, Fishing & Forestry | 0 (0.0%) | 0 (0.0%) |
| Construction & Extraction | 12 (100.0%) | 0 (0.0%) |
| Installation, Maintenance & Repair | 14 (100.0%) | 0 (0.0%) |
| Total (Category) | 26 (100.0%) | 0 (0.0%) |
| Total (Overall) | 91 (50.0%) | 91 (50.0%) |
Production, Transportation and Moving Occupations
The most common Production, Transportation and Moving occupations in Harrisburg are Material Moving (10 | 5.5%), Transportation (7 | 3.8%), and Production (4 | 2.2%).
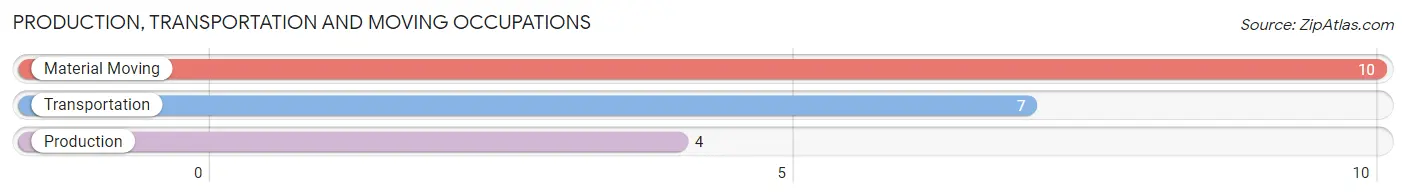
Production, Transportation and Moving Occupations by Sex
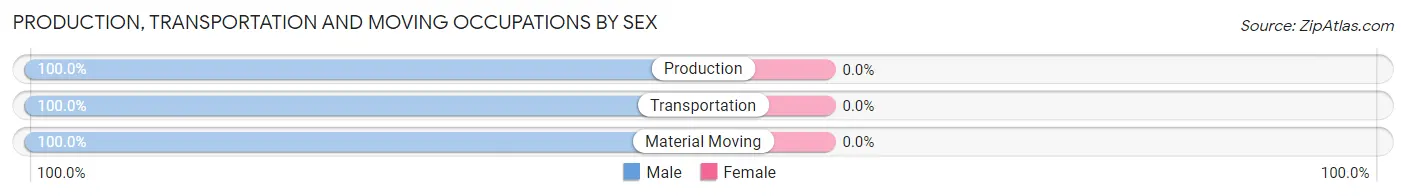
| Occupation | Male | Female |
| Production | 4 (100.0%) | 0 (0.0%) |
| Transportation | 7 (100.0%) | 0 (0.0%) |
| Material Moving | 10 (100.0%) | 0 (0.0%) |
| Total (Category) | 21 (100.0%) | 0 (0.0%) |
| Total (Overall) | 91 (50.0%) | 91 (50.0%) |
Employment Industries by Sex in Harrisburg
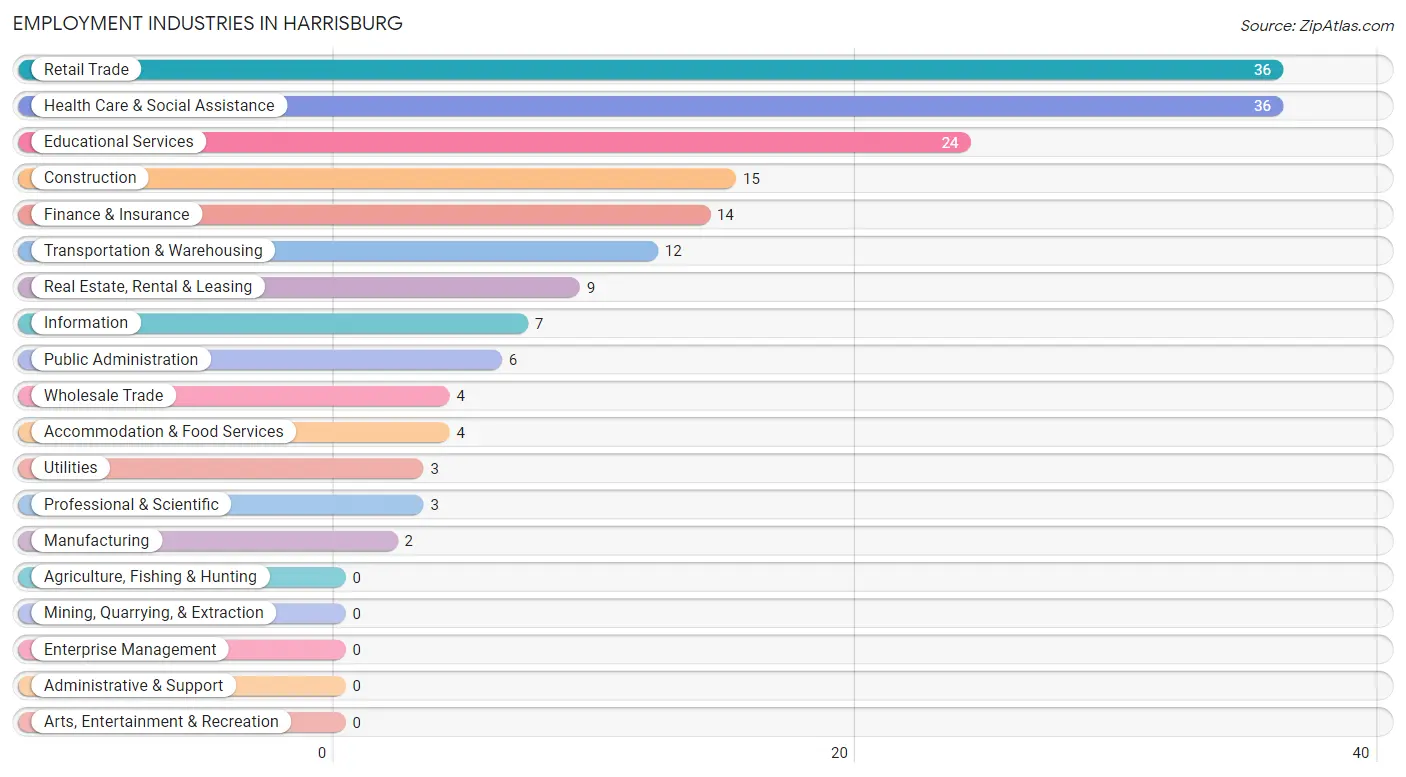
Employment Industries in Harrisburg
The major employment industries in Harrisburg include Retail Trade (36 | 19.8%), Health Care & Social Assistance (36 | 19.8%), Educational Services (24 | 13.2%), Construction (15 | 8.2%), and Finance & Insurance (14 | 7.7%).
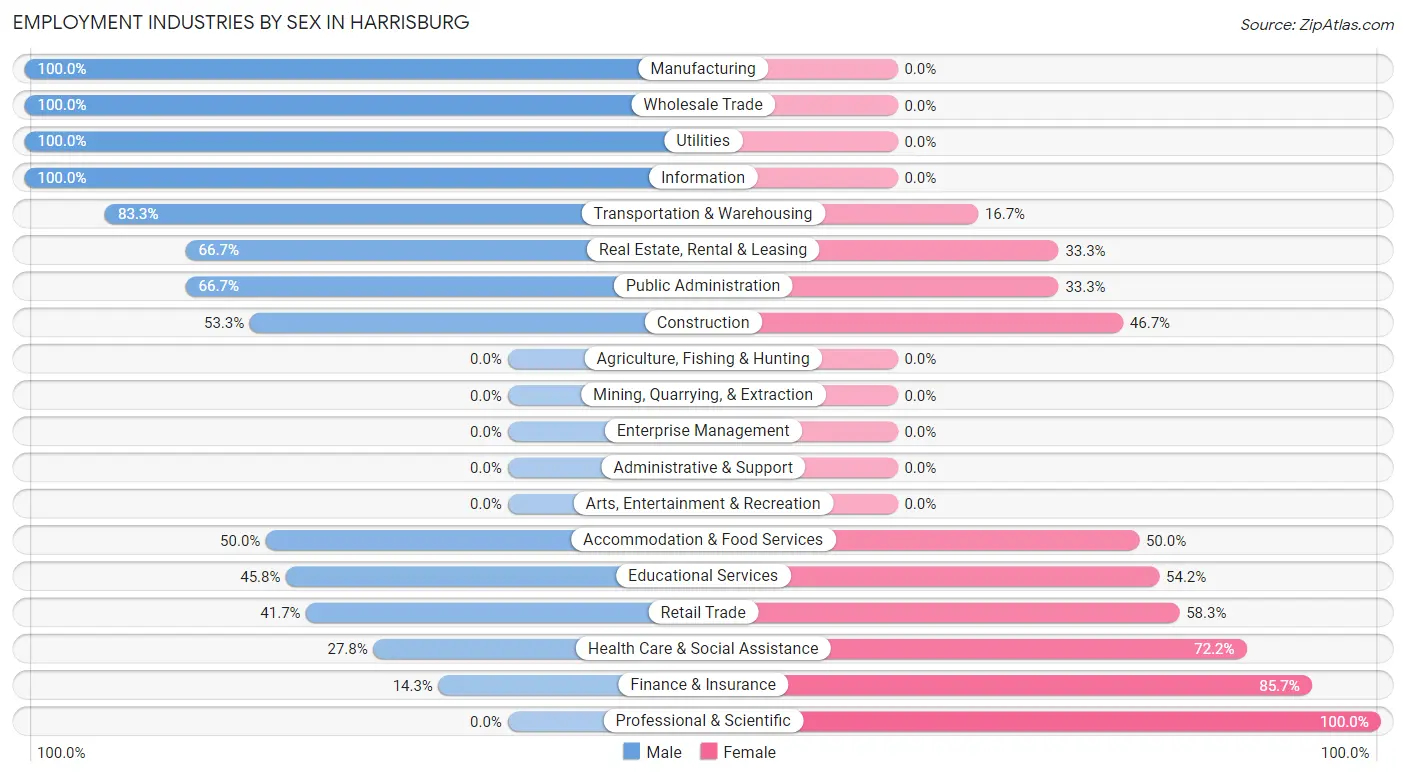
Employment Industries by Sex in Harrisburg
The Harrisburg industries that see more men than women are Manufacturing (100.0%), Wholesale Trade (100.0%), and Utilities (100.0%), whereas the industries that tend to have a higher number of women are Professional & Scientific (100.0%), Finance & Insurance (85.7%), and Health Care & Social Assistance (72.2%).
| Industry | Male | Female |
| Agriculture, Fishing & Hunting | 0 (0.0%) | 0 (0.0%) |
| Mining, Quarrying, & Extraction | 0 (0.0%) | 0 (0.0%) |
| Construction | 8 (53.3%) | 7 (46.7%) |
| Manufacturing | 2 (100.0%) | 0 (0.0%) |
| Wholesale Trade | 4 (100.0%) | 0 (0.0%) |
| Retail Trade | 15 (41.7%) | 21 (58.3%) |
| Transportation & Warehousing | 10 (83.3%) | 2 (16.7%) |
| Utilities | 3 (100.0%) | 0 (0.0%) |
| Information | 7 (100.0%) | 0 (0.0%) |
| Finance & Insurance | 2 (14.3%) | 12 (85.7%) |
| Real Estate, Rental & Leasing | 6 (66.7%) | 3 (33.3%) |
| Professional & Scientific | 0 (0.0%) | 3 (100.0%) |
| Enterprise Management | 0 (0.0%) | 0 (0.0%) |
| Administrative & Support | 0 (0.0%) | 0 (0.0%) |
| Educational Services | 11 (45.8%) | 13 (54.2%) |
| Health Care & Social Assistance | 10 (27.8%) | 26 (72.2%) |
| Arts, Entertainment & Recreation | 0 (0.0%) | 0 (0.0%) |
| Accommodation & Food Services | 2 (50.0%) | 2 (50.0%) |
| Public Administration | 4 (66.7%) | 2 (33.3%) |
| Total | 91 (50.0%) | 91 (50.0%) |
Education in Harrisburg
School Enrollment in Harrisburg
The most common levels of schooling among the 118 students in Harrisburg are high school (44 | 37.3%), middle school (37 | 31.4%), and elementary school (22 | 18.6%).
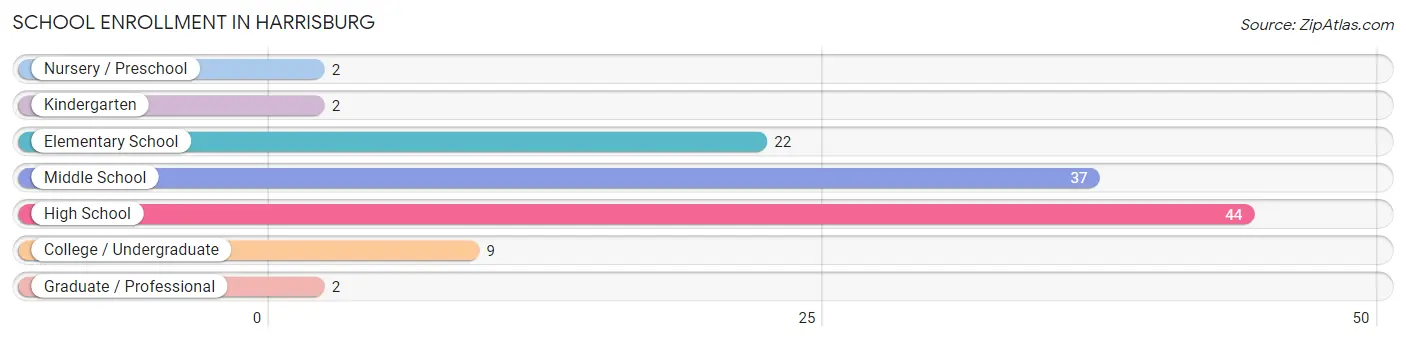
| School Level | # Students | % Students |
| Nursery / Preschool | 2 | 1.7% |
| Kindergarten | 2 | 1.7% |
| Elementary School | 22 | 18.6% |
| Middle School | 37 | 31.4% |
| High School | 44 | 37.3% |
| College / Undergraduate | 9 | 7.6% |
| Graduate / Professional | 2 | 1.7% |
| Total | 118 | 100.0% |
School Enrollment by Age by Funding Source in Harrisburg
Out of a total of 118 students who are enrolled in schools in Harrisburg, 2 (1.7%) attend a private institution, while the remaining 116 (98.3%) are enrolled in public schools. The age group of 25 to 34 year olds has the highest likelihood of being enrolled in private schools, with 2 (66.7% in the age bracket) enrolled. Conversely, the age group of 5 to 9 year old has the lowest likelihood of being enrolled in a private school, with 22 (100.0% in the age bracket) attending a public institution.
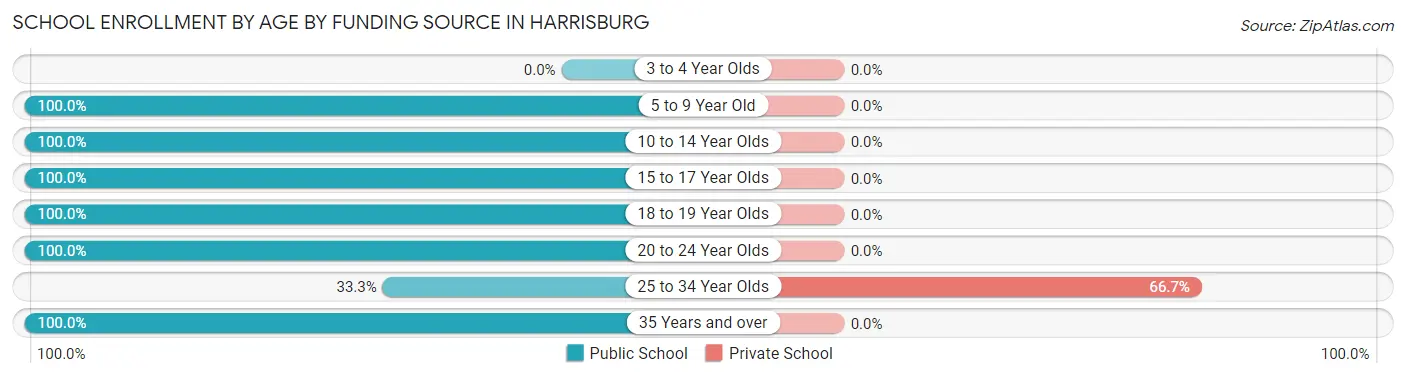
| Age Bracket | Public School | Private School |
| 3 to 4 Year Olds | 0 (0.0%) | 0 (0.0%) |
| 5 to 9 Year Old | 22 (100.0%) | 0 (0.0%) |
| 10 to 14 Year Olds | 49 (100.0%) | 0 (0.0%) |
| 15 to 17 Year Olds | 29 (100.0%) | 0 (0.0%) |
| 18 to 19 Year Olds | 6 (100.0%) | 0 (0.0%) |
| 20 to 24 Year Olds | 2 (100.0%) | 0 (0.0%) |
| 25 to 34 Year Olds | 1 (33.3%) | 2 (66.7%) |
| 35 Years and over | 7 (100.0%) | 0 (0.0%) |
| Total | 116 (98.3%) | 2 (1.7%) |
Educational Attainment by Field of Study in Harrisburg
Science & technology (15 | 21.7%), education (14 | 20.3%), business (12 | 17.4%), arts & humanities (10 | 14.5%), and psychology (6 | 8.7%) are the most common fields of study among 69 individuals in Harrisburg who have obtained a bachelor's degree or higher.
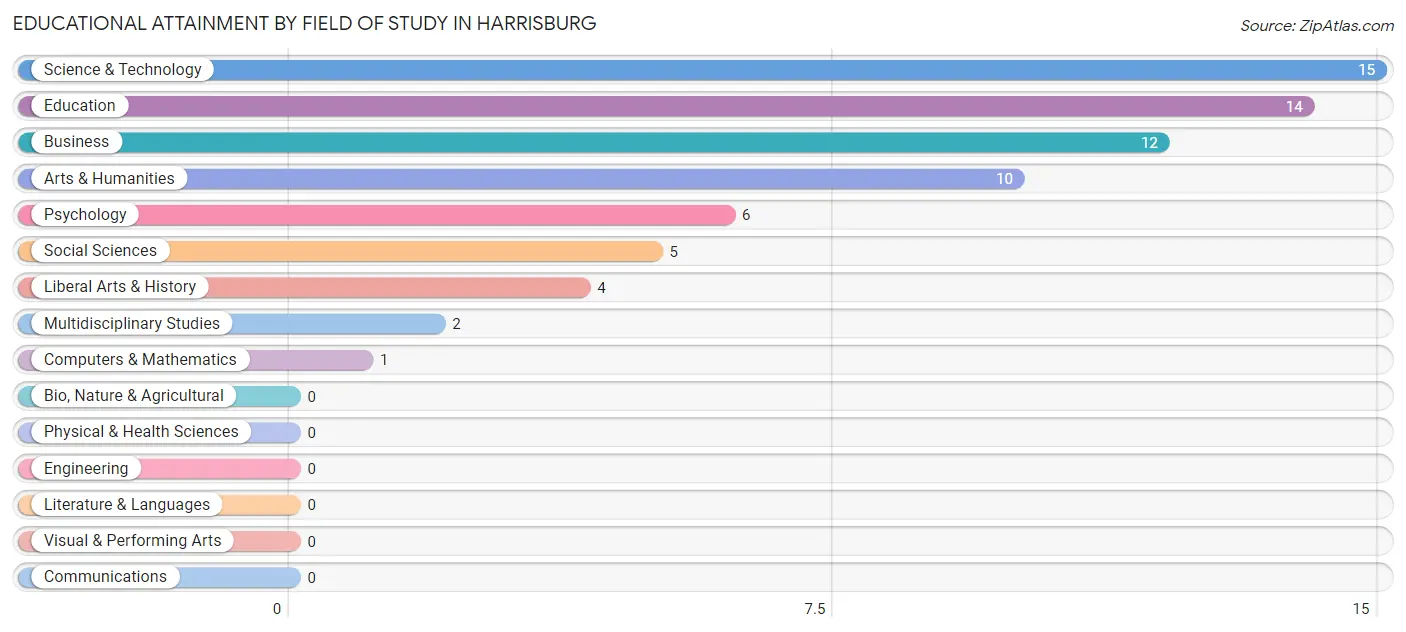
| Field of Study | # Graduates | % Graduates |
| Computers & Mathematics | 1 | 1.5% |
| Bio, Nature & Agricultural | 0 | 0.0% |
| Physical & Health Sciences | 0 | 0.0% |
| Psychology | 6 | 8.7% |
| Social Sciences | 5 | 7.2% |
| Engineering | 0 | 0.0% |
| Multidisciplinary Studies | 2 | 2.9% |
| Science & Technology | 15 | 21.7% |
| Business | 12 | 17.4% |
| Education | 14 | 20.3% |
| Literature & Languages | 0 | 0.0% |
| Liberal Arts & History | 4 | 5.8% |
| Visual & Performing Arts | 0 | 0.0% |
| Communications | 0 | 0.0% |
| Arts & Humanities | 10 | 14.5% |
| Total | 69 | 100.0% |
Transportation & Commute in Harrisburg
Vehicle Availability by Sex in Harrisburg
The most prevalent vehicle ownership categories in Harrisburg are males with 2 vehicles (49, accounting for 57.7%) and females with 2 vehicles (52, making up 53.8%).
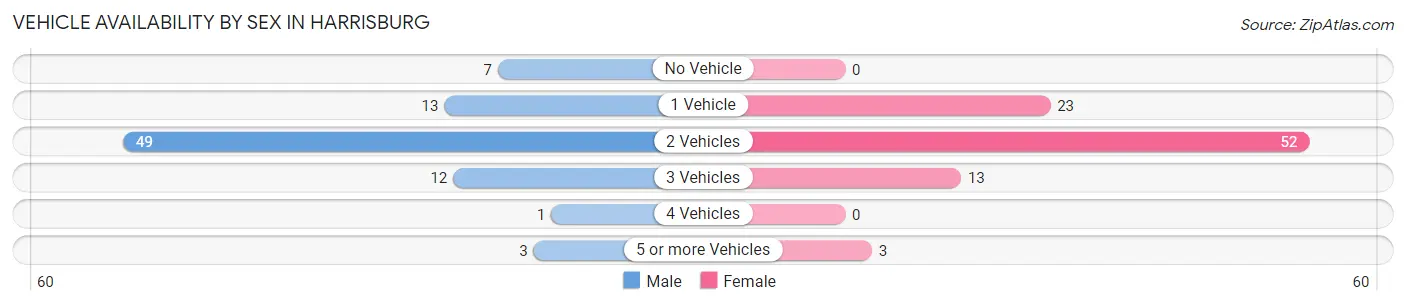
| Vehicles Available | Male | Female |
| No Vehicle | 7 (8.2%) | 0 (0.0%) |
| 1 Vehicle | 13 (15.3%) | 23 (25.3%) |
| 2 Vehicles | 49 (57.7%) | 52 (57.1%) |
| 3 Vehicles | 12 (14.1%) | 13 (14.3%) |
| 4 Vehicles | 1 (1.2%) | 0 (0.0%) |
| 5 or more Vehicles | 3 (3.5%) | 3 (3.3%) |
| Total | 85 (100.0%) | 91 (100.0%) |
Commute Time in Harrisburg
The most frequently occuring commute durations in Harrisburg are 30 to 34 minutes (61 commuters, 36.1%), 5 to 9 minutes (25 commuters, 14.8%), and 20 to 24 minutes (22 commuters, 13.0%).
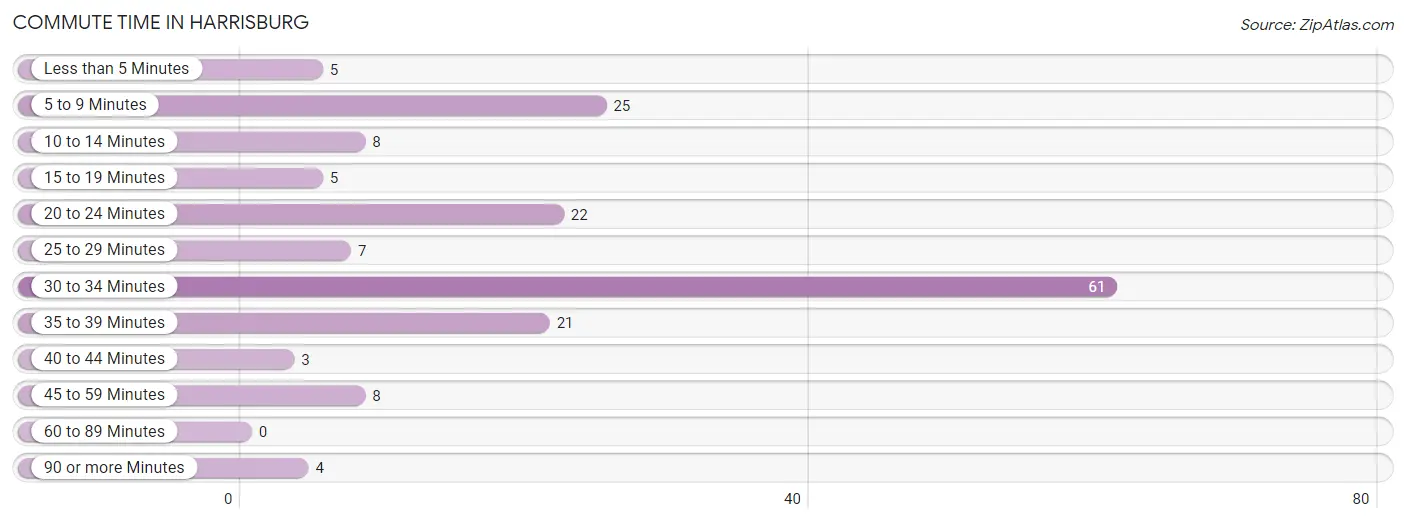
| Commute Time | # Commuters | % Commuters |
| Less than 5 Minutes | 5 | 3.0% |
| 5 to 9 Minutes | 25 | 14.8% |
| 10 to 14 Minutes | 8 | 4.7% |
| 15 to 19 Minutes | 5 | 3.0% |
| 20 to 24 Minutes | 22 | 13.0% |
| 25 to 29 Minutes | 7 | 4.1% |
| 30 to 34 Minutes | 61 | 36.1% |
| 35 to 39 Minutes | 21 | 12.4% |
| 40 to 44 Minutes | 3 | 1.8% |
| 45 to 59 Minutes | 8 | 4.7% |
| 60 to 89 Minutes | 0 | 0.0% |
| 90 or more Minutes | 4 | 2.4% |
Commute Time by Sex in Harrisburg
The most common commute times in Harrisburg are 30 to 34 minutes (22 commuters, 27.2%) for males and 30 to 34 minutes (39 commuters, 44.3%) for females.
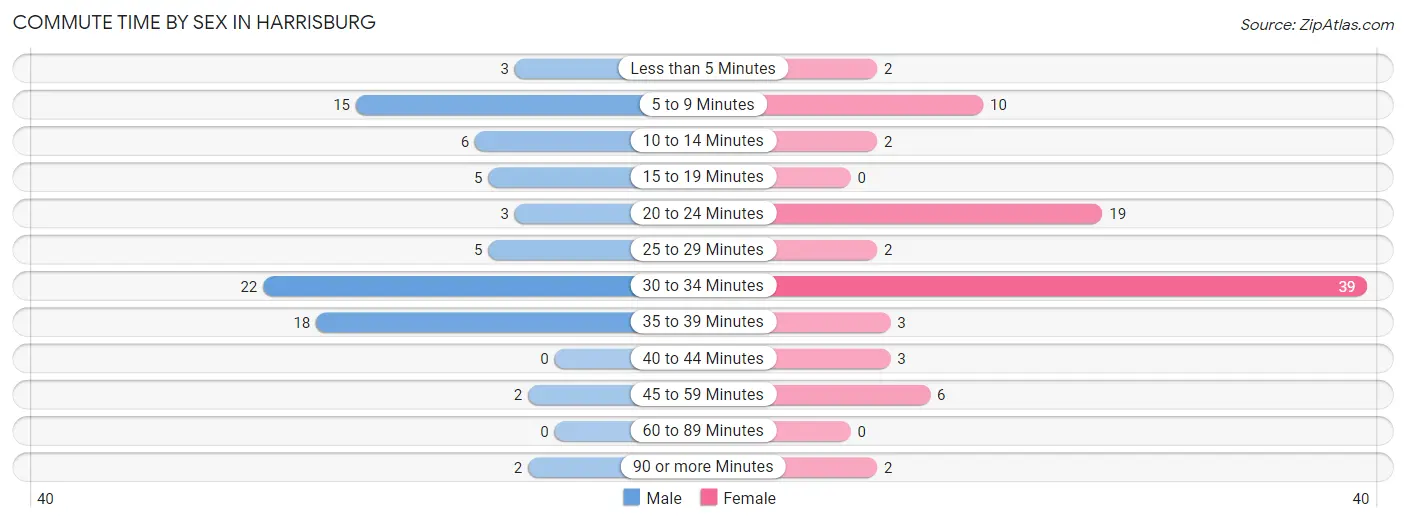
| Commute Time | Male | Female |
| Less than 5 Minutes | 3 (3.7%) | 2 (2.3%) |
| 5 to 9 Minutes | 15 (18.5%) | 10 (11.4%) |
| 10 to 14 Minutes | 6 (7.4%) | 2 (2.3%) |
| 15 to 19 Minutes | 5 (6.2%) | 0 (0.0%) |
| 20 to 24 Minutes | 3 (3.7%) | 19 (21.6%) |
| 25 to 29 Minutes | 5 (6.2%) | 2 (2.3%) |
| 30 to 34 Minutes | 22 (27.2%) | 39 (44.3%) |
| 35 to 39 Minutes | 18 (22.2%) | 3 (3.4%) |
| 40 to 44 Minutes | 0 (0.0%) | 3 (3.4%) |
| 45 to 59 Minutes | 2 (2.5%) | 6 (6.8%) |
| 60 to 89 Minutes | 0 (0.0%) | 0 (0.0%) |
| 90 or more Minutes | 2 (2.5%) | 2 (2.3%) |
Time of Departure to Work by Sex in Harrisburg
The most frequent times of departure to work in Harrisburg are 7:30 AM to 7:59 AM (23, 28.4%) for males and 7:00 AM to 7:29 AM (21, 23.9%) for females.
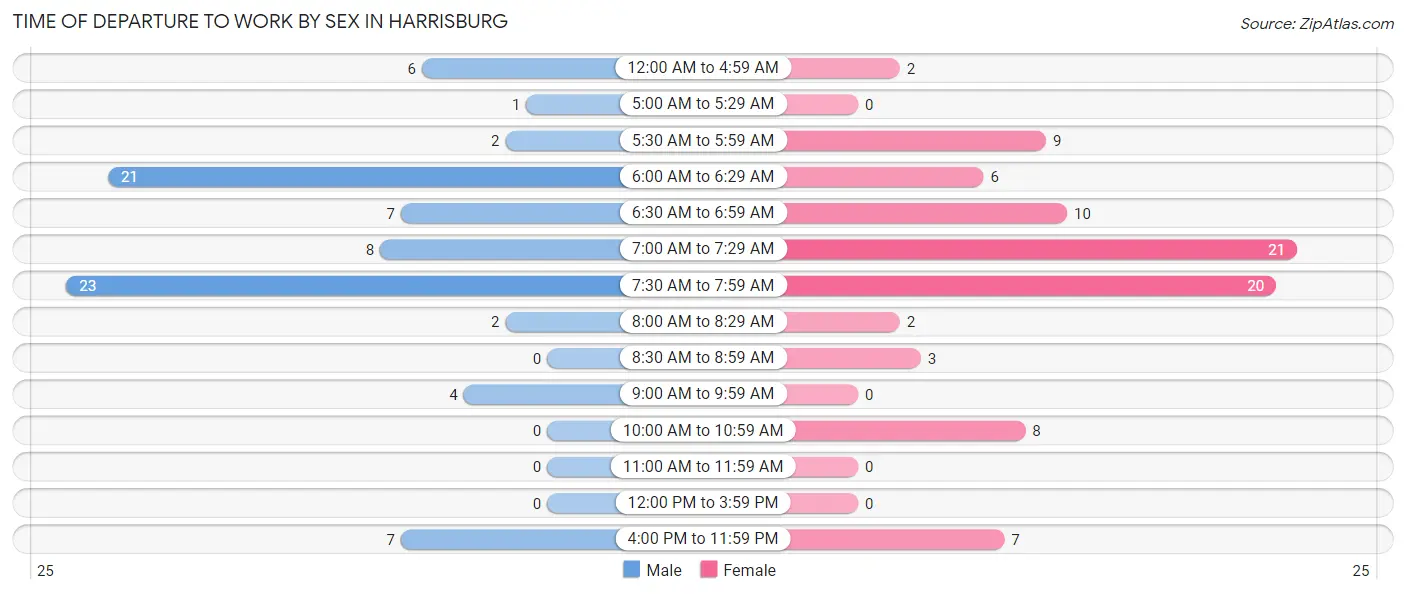
| Time of Departure | Male | Female |
| 12:00 AM to 4:59 AM | 6 (7.4%) | 2 (2.3%) |
| 5:00 AM to 5:29 AM | 1 (1.2%) | 0 (0.0%) |
| 5:30 AM to 5:59 AM | 2 (2.5%) | 9 (10.2%) |
| 6:00 AM to 6:29 AM | 21 (25.9%) | 6 (6.8%) |
| 6:30 AM to 6:59 AM | 7 (8.6%) | 10 (11.4%) |
| 7:00 AM to 7:29 AM | 8 (9.9%) | 21 (23.9%) |
| 7:30 AM to 7:59 AM | 23 (28.4%) | 20 (22.7%) |
| 8:00 AM to 8:29 AM | 2 (2.5%) | 2 (2.3%) |
| 8:30 AM to 8:59 AM | 0 (0.0%) | 3 (3.4%) |
| 9:00 AM to 9:59 AM | 4 (4.9%) | 0 (0.0%) |
| 10:00 AM to 10:59 AM | 0 (0.0%) | 8 (9.1%) |
| 11:00 AM to 11:59 AM | 0 (0.0%) | 0 (0.0%) |
| 12:00 PM to 3:59 PM | 0 (0.0%) | 0 (0.0%) |
| 4:00 PM to 11:59 PM | 7 (8.6%) | 7 (8.0%) |
| Total | 81 (100.0%) | 88 (100.0%) |
Housing Occupancy in Harrisburg
Occupancy by Ownership in Harrisburg
Of the total 141 dwellings in Harrisburg, owner-occupied units account for 112 (79.4%), while renter-occupied units make up 29 (20.6%).
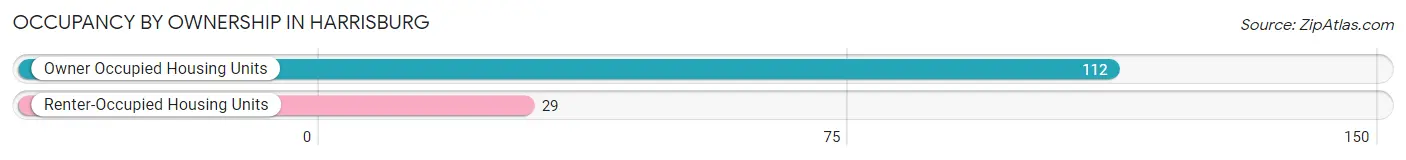
| Occupancy | # Housing Units | % Housing Units |
| Owner Occupied Housing Units | 112 | 79.4% |
| Renter-Occupied Housing Units | 29 | 20.6% |
| Total Occupied Housing Units | 141 | 100.0% |
Occupancy by Household Size in Harrisburg
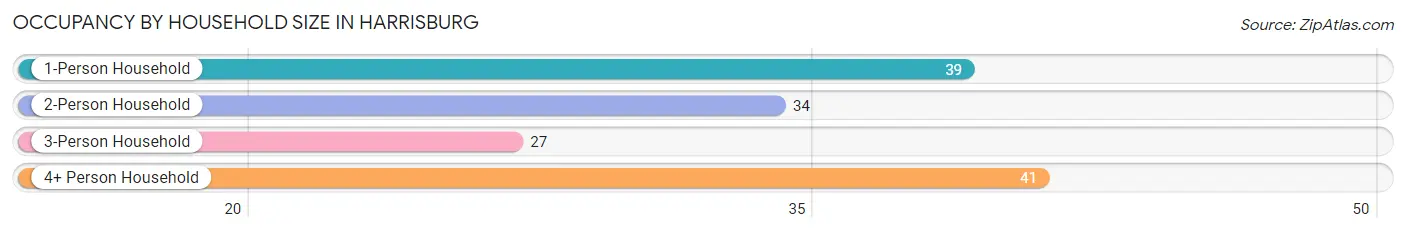
| Household Size | # Housing Units | % Housing Units |
| 1-Person Household | 39 | 27.7% |
| 2-Person Household | 34 | 24.1% |
| 3-Person Household | 27 | 19.2% |
| 4+ Person Household | 41 | 29.1% |
| Total Housing Units | 141 | 100.0% |
Occupancy by Ownership by Household Size in Harrisburg
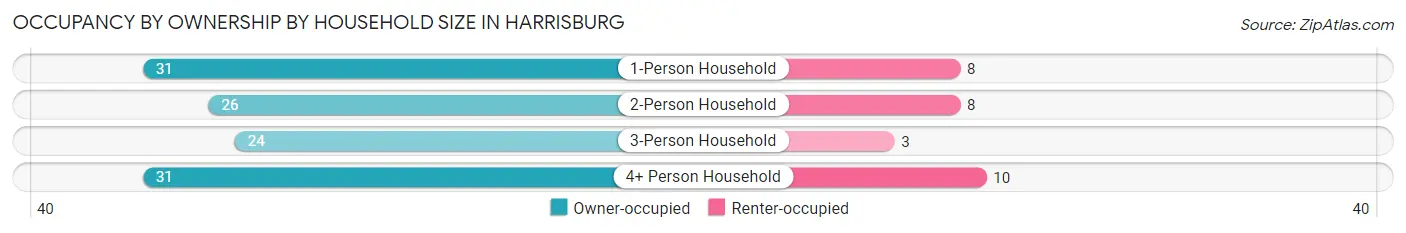
| Household Size | Owner-occupied | Renter-occupied |
| 1-Person Household | 31 (79.5%) | 8 (20.5%) |
| 2-Person Household | 26 (76.5%) | 8 (23.5%) |
| 3-Person Household | 24 (88.9%) | 3 (11.1%) |
| 4+ Person Household | 31 (75.6%) | 10 (24.4%) |
| Total Housing Units | 112 (79.4%) | 29 (20.6%) |
Occupancy by Educational Attainment in Harrisburg
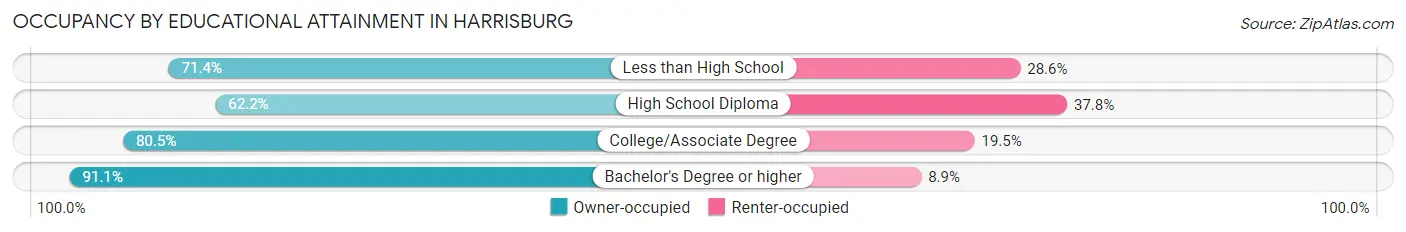
| Household Size | Owner-occupied | Renter-occupied |
| Less than High School | 5 (71.4%) | 2 (28.6%) |
| High School Diploma | 23 (62.2%) | 14 (37.8%) |
| College/Associate Degree | 33 (80.5%) | 8 (19.5%) |
| Bachelor's Degree or higher | 51 (91.1%) | 5 (8.9%) |
Occupancy by Age of Householder in Harrisburg
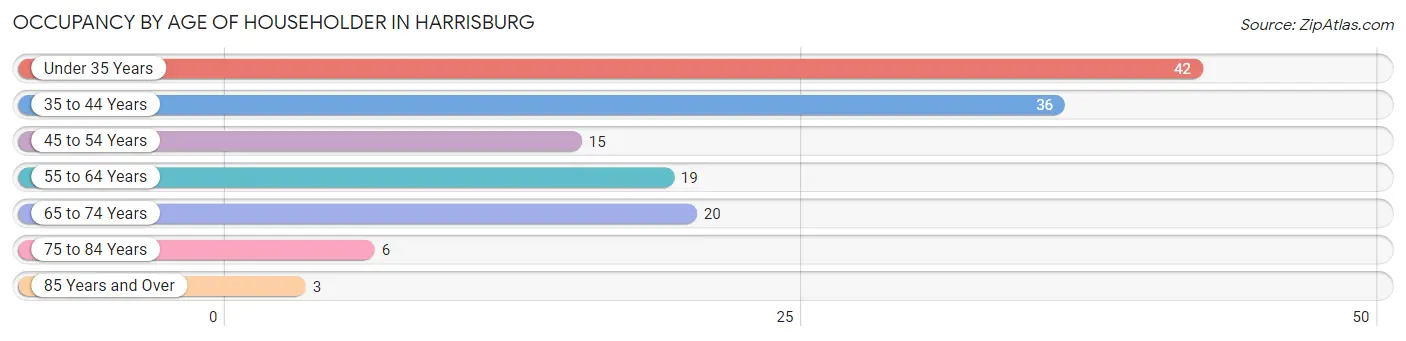
| Age Bracket | # Households | % Households |
| Under 35 Years | 42 | 29.8% |
| 35 to 44 Years | 36 | 25.5% |
| 45 to 54 Years | 15 | 10.6% |
| 55 to 64 Years | 19 | 13.5% |
| 65 to 74 Years | 20 | 14.2% |
| 75 to 84 Years | 6 | 4.3% |
| 85 Years and Over | 3 | 2.1% |
| Total | 141 | 100.0% |
Housing Finances in Harrisburg
Median Income by Occupancy in Harrisburg
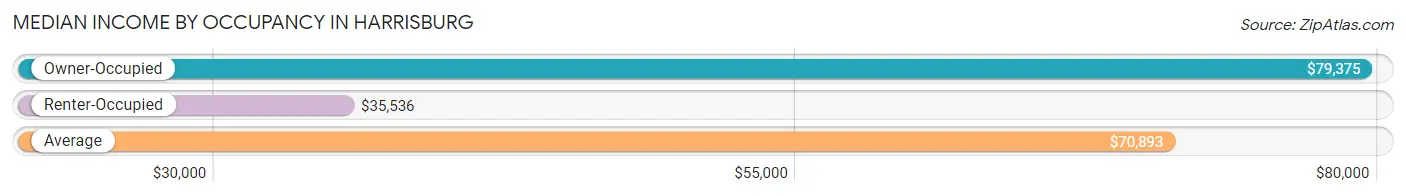
| Occupancy Type | # Households | Median Income |
| Owner-Occupied | 112 (79.4%) | $79,375 |
| Renter-Occupied | 29 (20.6%) | $35,536 |
| Average | 141 (100.0%) | $70,893 |
Occupancy by Householder Income Bracket in Harrisburg
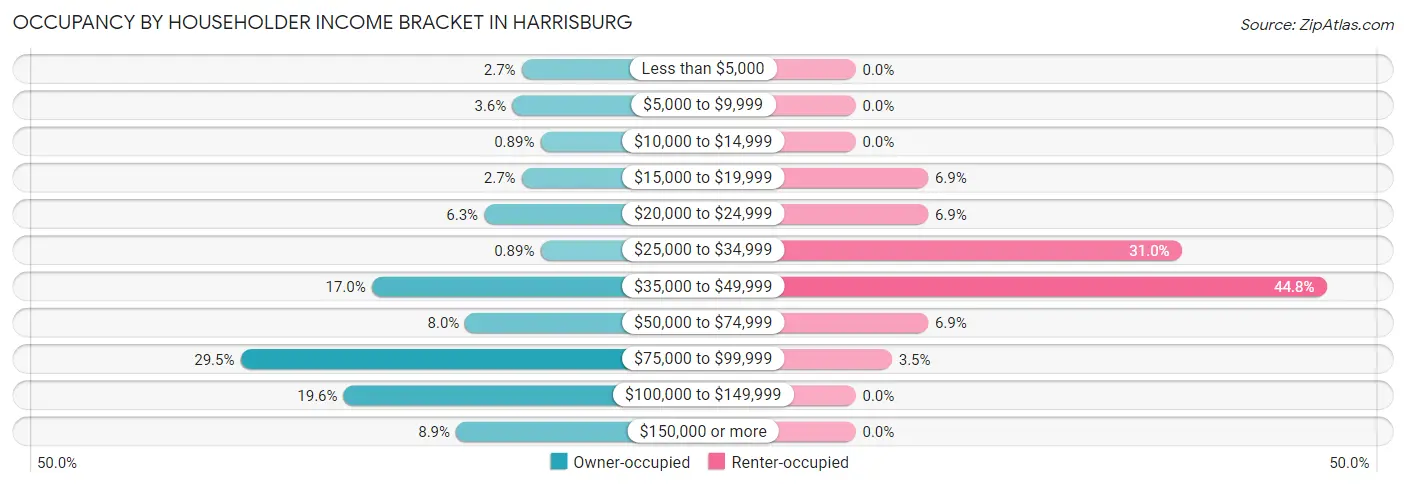
| Income Bracket | Owner-occupied | Renter-occupied |
| Less than $5,000 | 3 (2.7%) | 0 (0.0%) |
| $5,000 to $9,999 | 4 (3.6%) | 0 (0.0%) |
| $10,000 to $14,999 | 1 (0.9%) | 0 (0.0%) |
| $15,000 to $19,999 | 3 (2.7%) | 2 (6.9%) |
| $20,000 to $24,999 | 7 (6.2%) | 2 (6.9%) |
| $25,000 to $34,999 | 1 (0.9%) | 9 (31.0%) |
| $35,000 to $49,999 | 19 (17.0%) | 13 (44.8%) |
| $50,000 to $74,999 | 9 (8.0%) | 2 (6.9%) |
| $75,000 to $99,999 | 33 (29.5%) | 1 (3.5%) |
| $100,000 to $149,999 | 22 (19.6%) | 0 (0.0%) |
| $150,000 or more | 10 (8.9%) | 0 (0.0%) |
| Total | 112 (100.0%) | 29 (100.0%) |
Monthly Housing Cost Tiers in Harrisburg
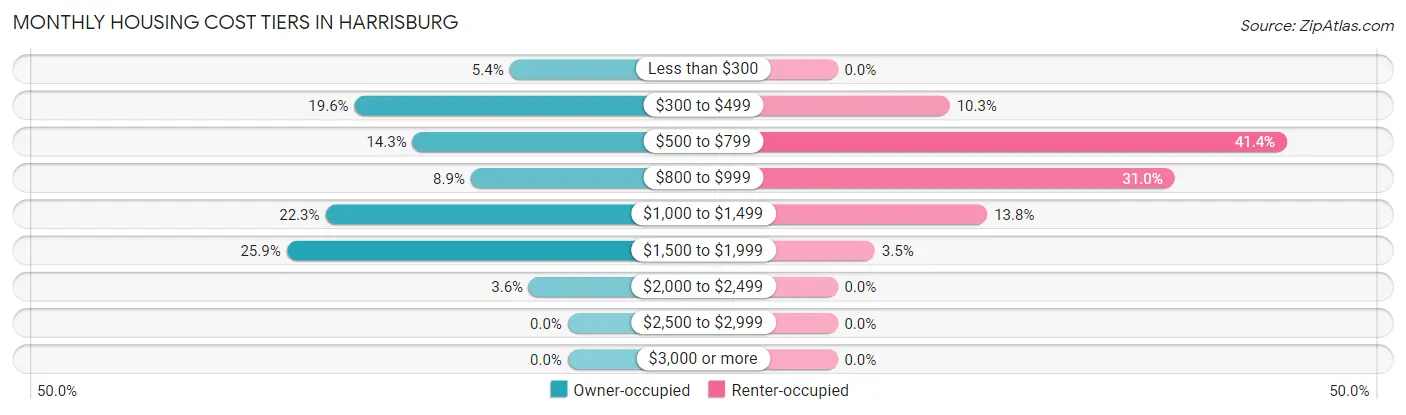
| Monthly Cost | Owner-occupied | Renter-occupied |
| Less than $300 | 6 (5.4%) | 0 (0.0%) |
| $300 to $499 | 22 (19.6%) | 3 (10.3%) |
| $500 to $799 | 16 (14.3%) | 12 (41.4%) |
| $800 to $999 | 10 (8.9%) | 9 (31.0%) |
| $1,000 to $1,499 | 25 (22.3%) | 4 (13.8%) |
| $1,500 to $1,999 | 29 (25.9%) | 1 (3.5%) |
| $2,000 to $2,499 | 4 (3.6%) | 0 (0.0%) |
| $2,500 to $2,999 | 0 (0.0%) | 0 (0.0%) |
| $3,000 or more | 0 (0.0%) | 0 (0.0%) |
| Total | 112 (100.0%) | 29 (100.0%) |
Physical Housing Characteristics in Harrisburg
Housing Structures in Harrisburg
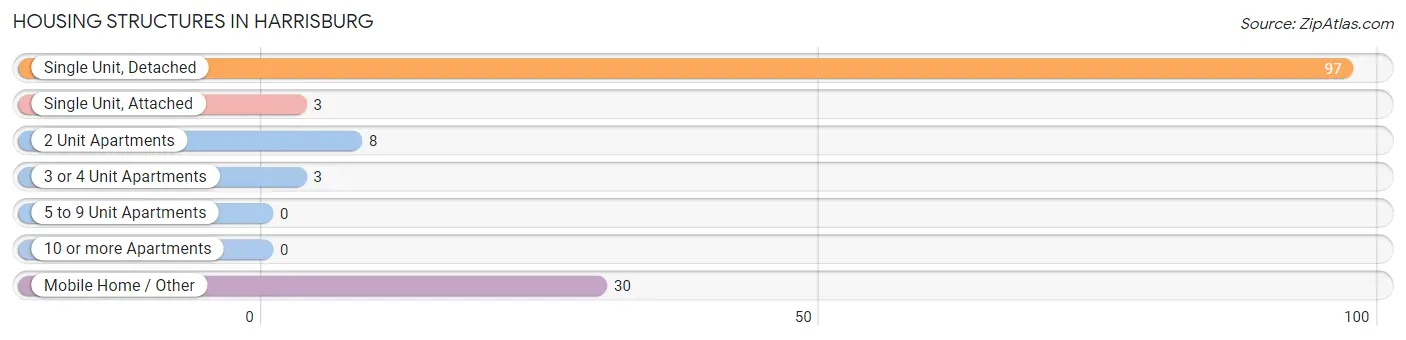
| Structure Type | # Housing Units | % Housing Units |
| Single Unit, Detached | 97 | 68.8% |
| Single Unit, Attached | 3 | 2.1% |
| 2 Unit Apartments | 8 | 5.7% |
| 3 or 4 Unit Apartments | 3 | 2.1% |
| 5 to 9 Unit Apartments | 0 | 0.0% |
| 10 or more Apartments | 0 | 0.0% |
| Mobile Home / Other | 30 | 21.3% |
| Total | 141 | 100.0% |
Housing Structures by Occupancy in Harrisburg
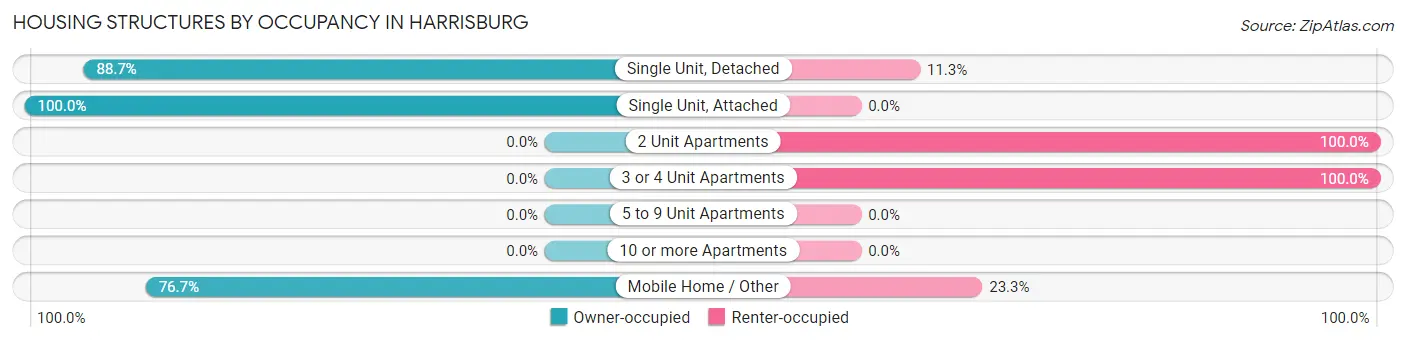
| Structure Type | Owner-occupied | Renter-occupied |
| Single Unit, Detached | 86 (88.7%) | 11 (11.3%) |
| Single Unit, Attached | 3 (100.0%) | 0 (0.0%) |
| 2 Unit Apartments | 0 (0.0%) | 8 (100.0%) |
| 3 or 4 Unit Apartments | 0 (0.0%) | 3 (100.0%) |
| 5 to 9 Unit Apartments | 0 (0.0%) | 0 (0.0%) |
| 10 or more Apartments | 0 (0.0%) | 0 (0.0%) |
| Mobile Home / Other | 23 (76.7%) | 7 (23.3%) |
| Total | 112 (79.4%) | 29 (20.6%) |
Housing Structures by Number of Rooms in Harrisburg
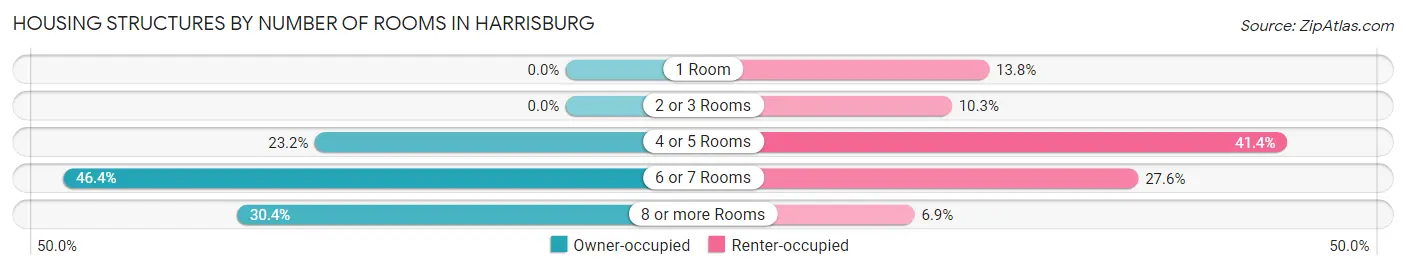
| Number of Rooms | Owner-occupied | Renter-occupied |
| 1 Room | 0 (0.0%) | 4 (13.8%) |
| 2 or 3 Rooms | 0 (0.0%) | 3 (10.3%) |
| 4 or 5 Rooms | 26 (23.2%) | 12 (41.4%) |
| 6 or 7 Rooms | 52 (46.4%) | 8 (27.6%) |
| 8 or more Rooms | 34 (30.4%) | 2 (6.9%) |
| Total | 112 (100.0%) | 29 (100.0%) |
Housing Structure by Heating Type in Harrisburg
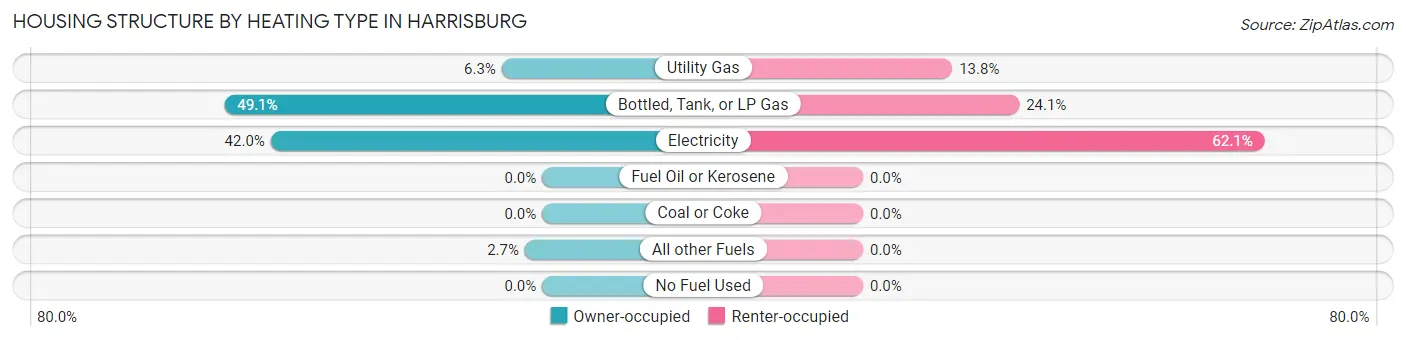
| Heating Type | Owner-occupied | Renter-occupied |
| Utility Gas | 7 (6.2%) | 4 (13.8%) |
| Bottled, Tank, or LP Gas | 55 (49.1%) | 7 (24.1%) |
| Electricity | 47 (42.0%) | 18 (62.1%) |
| Fuel Oil or Kerosene | 0 (0.0%) | 0 (0.0%) |
| Coal or Coke | 0 (0.0%) | 0 (0.0%) |
| All other Fuels | 3 (2.7%) | 0 (0.0%) |
| No Fuel Used | 0 (0.0%) | 0 (0.0%) |
| Total | 112 (100.0%) | 29 (100.0%) |
Household Vehicle Usage in Harrisburg
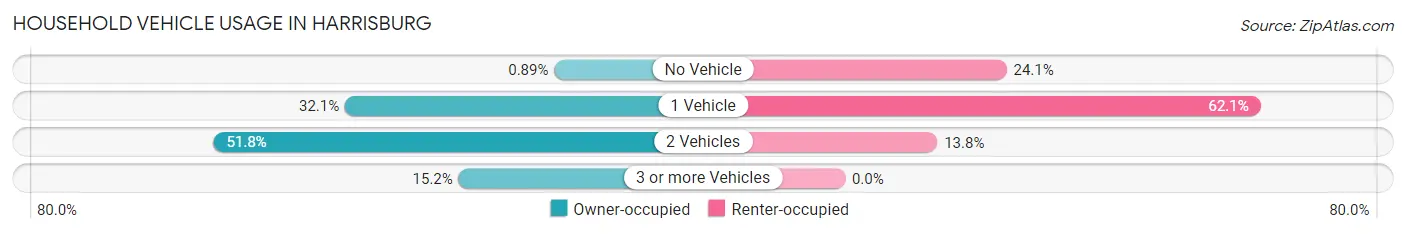
| Vehicles per Household | Owner-occupied | Renter-occupied |
| No Vehicle | 1 (0.9%) | 7 (24.1%) |
| 1 Vehicle | 36 (32.1%) | 18 (62.1%) |
| 2 Vehicles | 58 (51.8%) | 4 (13.8%) |
| 3 or more Vehicles | 17 (15.2%) | 0 (0.0%) |
| Total | 112 (100.0%) | 29 (100.0%) |
Real Estate & Mortgages in Harrisburg
Real Estate and Mortgage Overview in Harrisburg
| Characteristic | Without Mortgage | With Mortgage |
| Housing Units | 44 | 68 |
| Median Property Value | $125,000 | $180,000 |
| Median Household Income | $42,500 | $9 |
| Monthly Housing Costs | $392 | $0 |
| Real Estate Taxes | $947 | $0 |
Property Value by Mortgage Status in Harrisburg
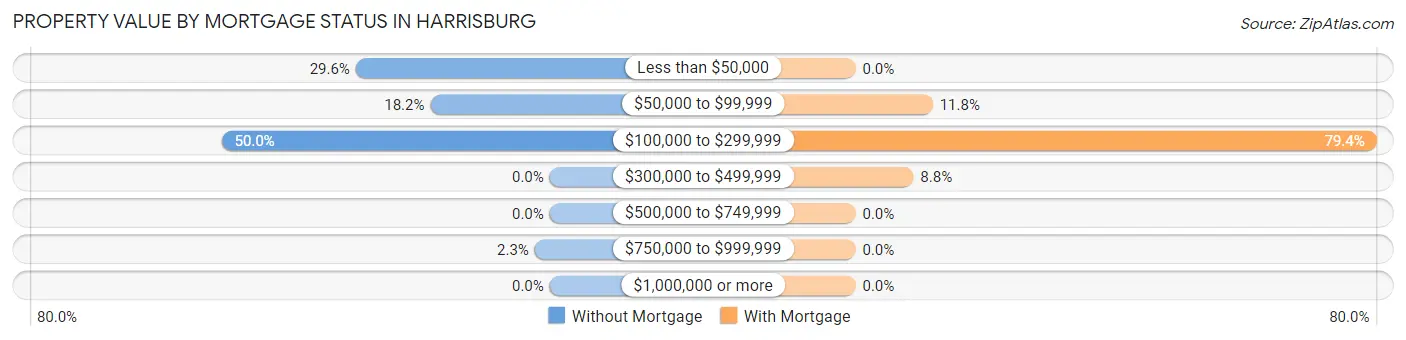
| Property Value | Without Mortgage | With Mortgage |
| Less than $50,000 | 13 (29.5%) | 0 (0.0%) |
| $50,000 to $99,999 | 8 (18.2%) | 8 (11.8%) |
| $100,000 to $299,999 | 22 (50.0%) | 54 (79.4%) |
| $300,000 to $499,999 | 0 (0.0%) | 6 (8.8%) |
| $500,000 to $749,999 | 0 (0.0%) | 0 (0.0%) |
| $750,000 to $999,999 | 1 (2.3%) | 0 (0.0%) |
| $1,000,000 or more | 0 (0.0%) | 0 (0.0%) |
| Total | 44 (100.0%) | 68 (100.0%) |
Household Income by Mortgage Status in Harrisburg
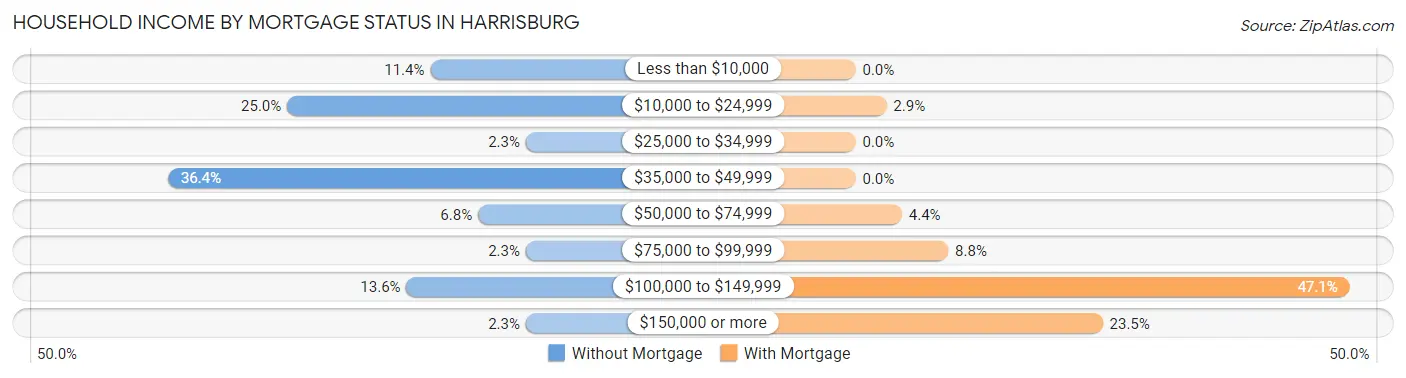
| Household Income | Without Mortgage | With Mortgage |
| Less than $10,000 | 5 (11.4%) | 0 (0.0%) |
| $10,000 to $24,999 | 11 (25.0%) | 2 (2.9%) |
| $25,000 to $34,999 | 1 (2.3%) | 0 (0.0%) |
| $35,000 to $49,999 | 16 (36.4%) | 0 (0.0%) |
| $50,000 to $74,999 | 3 (6.8%) | 3 (4.4%) |
| $75,000 to $99,999 | 1 (2.3%) | 6 (8.8%) |
| $100,000 to $149,999 | 6 (13.6%) | 32 (47.1%) |
| $150,000 or more | 1 (2.3%) | 16 (23.5%) |
| Total | 44 (100.0%) | 68 (100.0%) |
Property Value to Household Income Ratio in Harrisburg
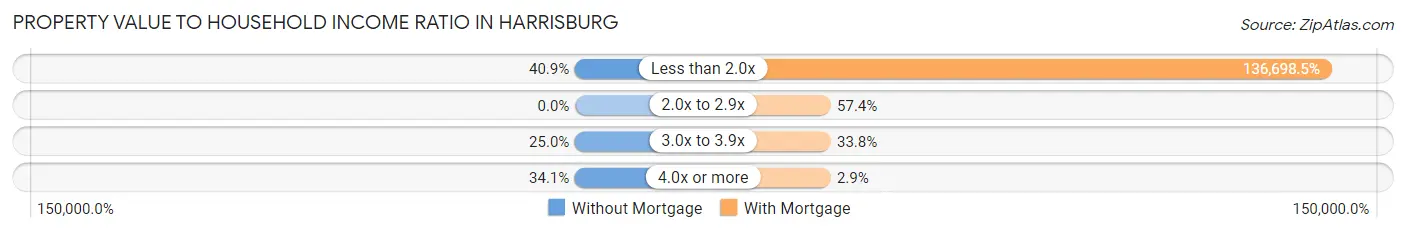
| Value-to-Income Ratio | Without Mortgage | With Mortgage |
| Less than 2.0x | 18 (40.9%) | 92,955 (136,698.5%) |
| 2.0x to 2.9x | 0 (0.0%) | 39 (57.4%) |
| 3.0x to 3.9x | 11 (25.0%) | 23 (33.8%) |
| 4.0x or more | 15 (34.1%) | 2 (2.9%) |
| Total | 44 (100.0%) | 68 (100.0%) |
Real Estate Taxes by Mortgage Status in Harrisburg
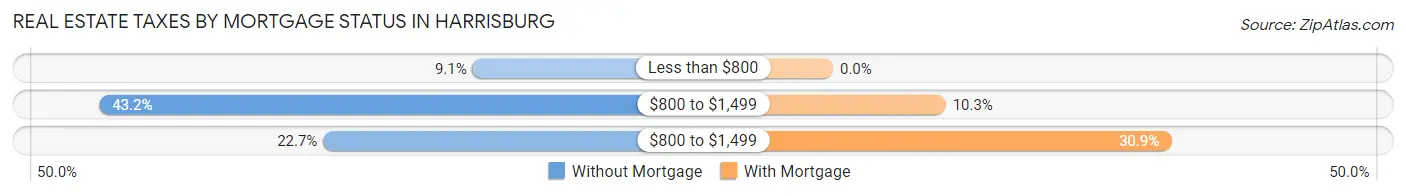
| Property Taxes | Without Mortgage | With Mortgage |
| Less than $800 | 4 (9.1%) | 0 (0.0%) |
| $800 to $1,499 | 19 (43.2%) | 7 (10.3%) |
| $800 to $1,499 | 10 (22.7%) | 21 (30.9%) |
| Total | 44 (100.0%) | 68 (100.0%) |
Health & Disability in Harrisburg
Health Insurance Coverage by Age in Harrisburg
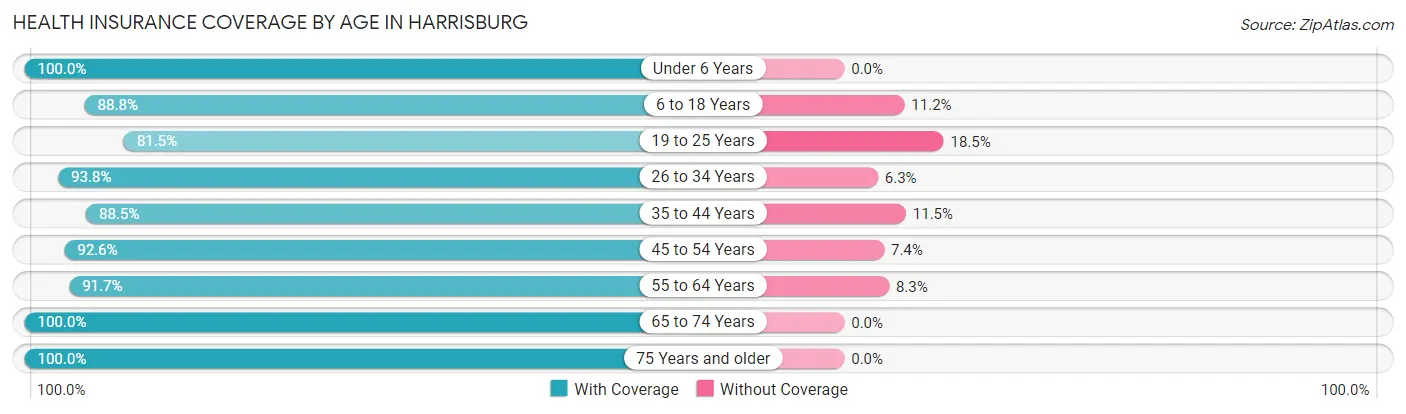
| Age Bracket | With Coverage | Without Coverage |
| Under 6 Years | 44 (100.0%) | 0 (0.0%) |
| 6 to 18 Years | 95 (88.8%) | 12 (11.2%) |
| 19 to 25 Years | 22 (81.5%) | 5 (18.5%) |
| 26 to 34 Years | 45 (93.8%) | 3 (6.2%) |
| 35 to 44 Years | 54 (88.5%) | 7 (11.5%) |
| 45 to 54 Years | 25 (92.6%) | 2 (7.4%) |
| 55 to 64 Years | 22 (91.7%) | 2 (8.3%) |
| 65 to 74 Years | 28 (100.0%) | 0 (0.0%) |
| 75 Years and older | 11 (100.0%) | 0 (0.0%) |
| Total | 346 (91.8%) | 31 (8.2%) |
Health Insurance Coverage by Citizenship Status in Harrisburg
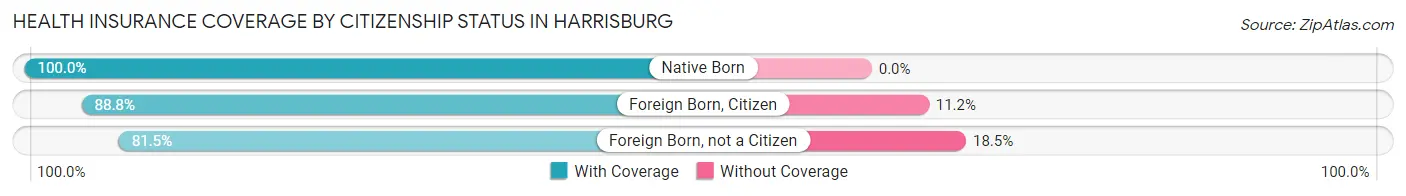
| Citizenship Status | With Coverage | Without Coverage |
| Native Born | 44 (100.0%) | 0 (0.0%) |
| Foreign Born, Citizen | 95 (88.8%) | 12 (11.2%) |
| Foreign Born, not a Citizen | 22 (81.5%) | 5 (18.5%) |
Health Insurance Coverage by Household Income in Harrisburg
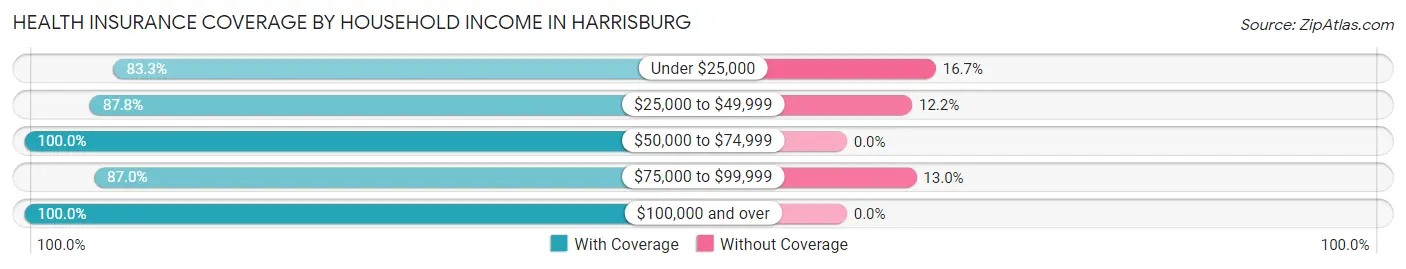
| Household Income | With Coverage | Without Coverage |
| Under $25,000 | 25 (83.3%) | 5 (16.7%) |
| $25,000 to $49,999 | 79 (87.8%) | 11 (12.2%) |
| $50,000 to $74,999 | 24 (100.0%) | 0 (0.0%) |
| $75,000 to $99,999 | 100 (87.0%) | 15 (13.0%) |
| $100,000 and over | 118 (100.0%) | 0 (0.0%) |
Public vs Private Health Insurance Coverage by Age in Harrisburg
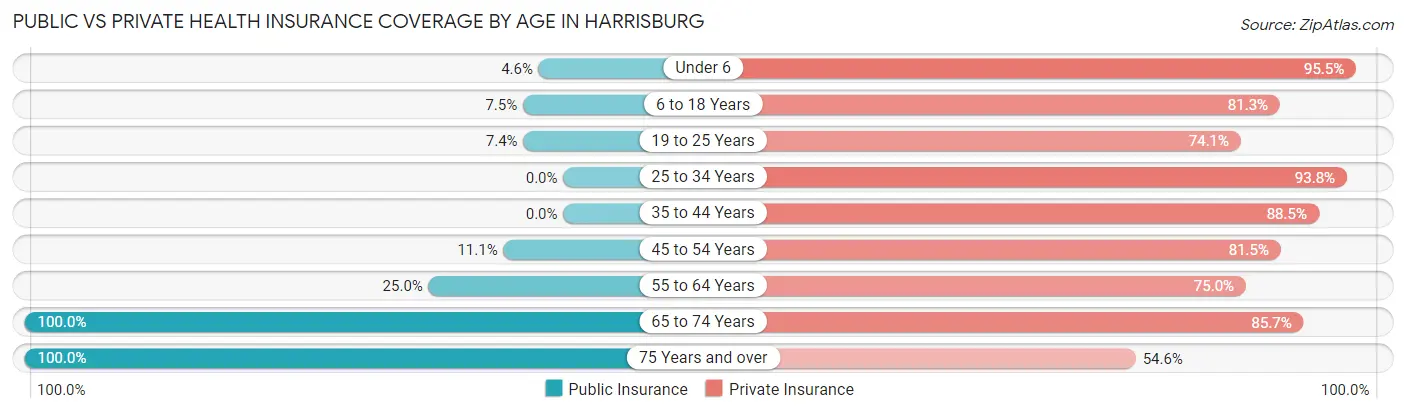
| Age Bracket | Public Insurance | Private Insurance |
| Under 6 | 2 (4.5%) | 42 (95.5%) |
| 6 to 18 Years | 8 (7.5%) | 87 (81.3%) |
| 19 to 25 Years | 2 (7.4%) | 20 (74.1%) |
| 25 to 34 Years | 0 (0.0%) | 45 (93.8%) |
| 35 to 44 Years | 0 (0.0%) | 54 (88.5%) |
| 45 to 54 Years | 3 (11.1%) | 22 (81.5%) |
| 55 to 64 Years | 6 (25.0%) | 18 (75.0%) |
| 65 to 74 Years | 28 (100.0%) | 24 (85.7%) |
| 75 Years and over | 11 (100.0%) | 6 (54.5%) |
| Total | 60 (15.9%) | 318 (84.4%) |
Disability Status by Sex by Age in Harrisburg
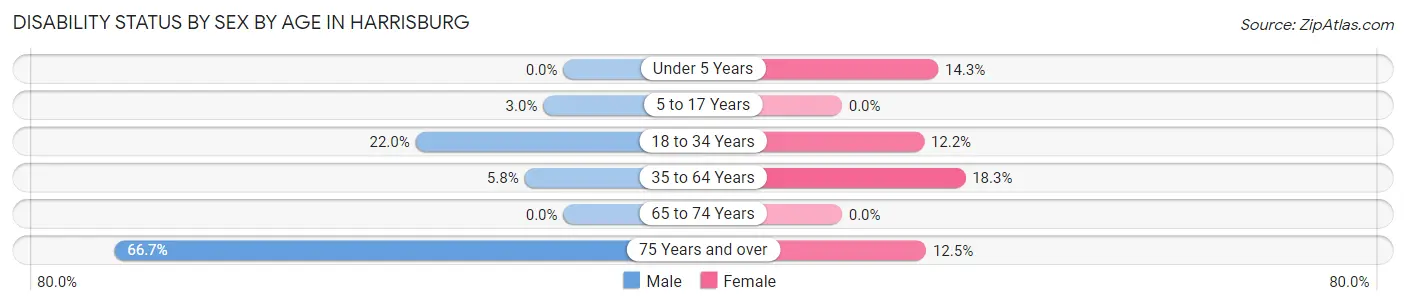
| Age Bracket | Male | Female |
| Under 5 Years | 0 (0.0%) | 2 (14.3%) |
| 5 to 17 Years | 2 (3.0%) | 0 (0.0%) |
| 18 to 34 Years | 9 (22.0%) | 5 (12.2%) |
| 35 to 64 Years | 3 (5.8%) | 11 (18.3%) |
| 65 to 74 Years | 0 (0.0%) | 0 (0.0%) |
| 75 Years and over | 2 (66.7%) | 1 (12.5%) |
Disability Class by Sex by Age in Harrisburg
Disability Class: Hearing Difficulty
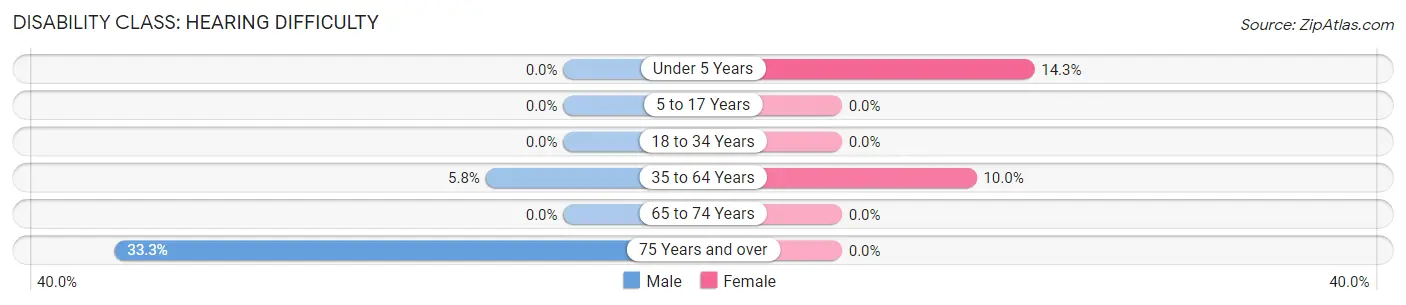
| Age Bracket | Male | Female |
| Under 5 Years | 0 (0.0%) | 2 (14.3%) |
| 5 to 17 Years | 0 (0.0%) | 0 (0.0%) |
| 18 to 34 Years | 0 (0.0%) | 0 (0.0%) |
| 35 to 64 Years | 3 (5.8%) | 6 (10.0%) |
| 65 to 74 Years | 0 (0.0%) | 0 (0.0%) |
| 75 Years and over | 1 (33.3%) | 0 (0.0%) |
Disability Class: Vision Difficulty
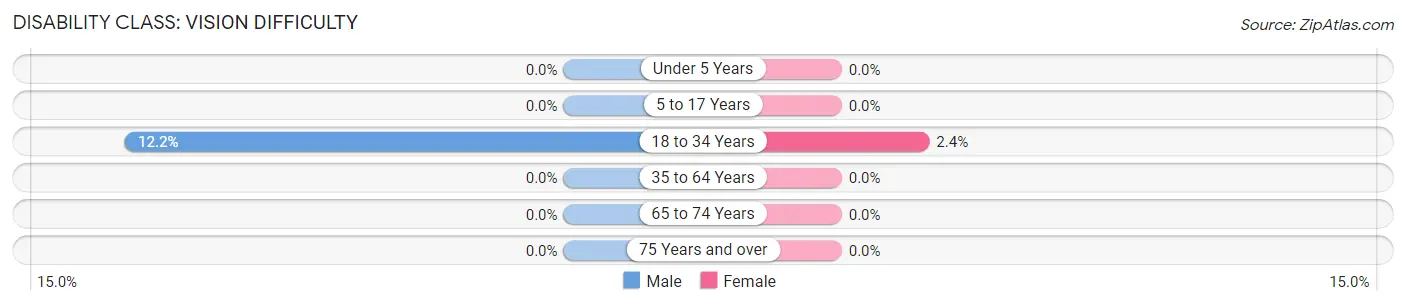
| Age Bracket | Male | Female |
| Under 5 Years | 0 (0.0%) | 0 (0.0%) |
| 5 to 17 Years | 0 (0.0%) | 0 (0.0%) |
| 18 to 34 Years | 5 (12.2%) | 1 (2.4%) |
| 35 to 64 Years | 0 (0.0%) | 0 (0.0%) |
| 65 to 74 Years | 0 (0.0%) | 0 (0.0%) |
| 75 Years and over | 0 (0.0%) | 0 (0.0%) |
Disability Class: Cognitive Difficulty
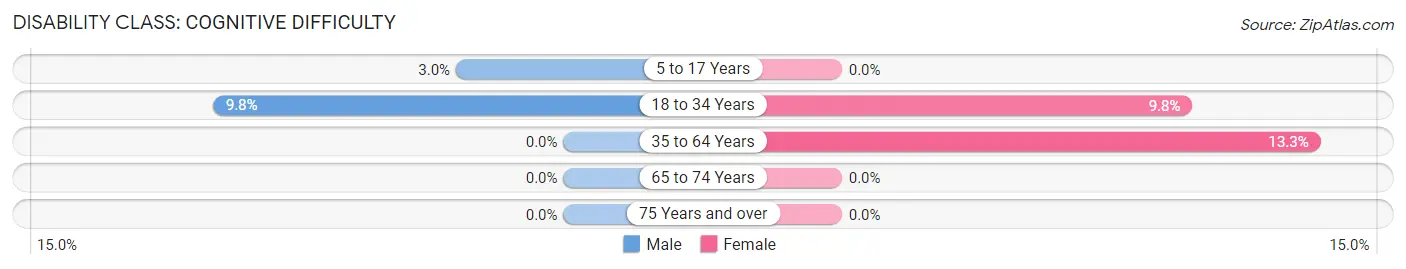
| Age Bracket | Male | Female |
| 5 to 17 Years | 2 (3.0%) | 0 (0.0%) |
| 18 to 34 Years | 4 (9.8%) | 4 (9.8%) |
| 35 to 64 Years | 0 (0.0%) | 8 (13.3%) |
| 65 to 74 Years | 0 (0.0%) | 0 (0.0%) |
| 75 Years and over | 0 (0.0%) | 0 (0.0%) |
Disability Class: Ambulatory Difficulty
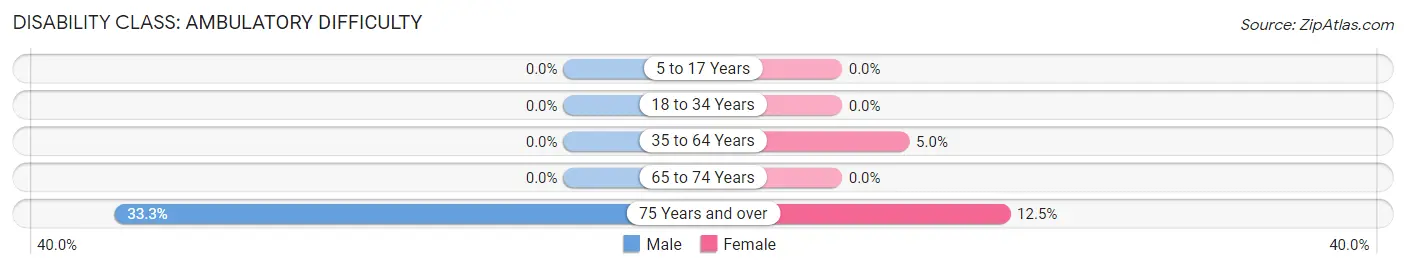
| Age Bracket | Male | Female |
| 5 to 17 Years | 0 (0.0%) | 0 (0.0%) |
| 18 to 34 Years | 0 (0.0%) | 0 (0.0%) |
| 35 to 64 Years | 0 (0.0%) | 3 (5.0%) |
| 65 to 74 Years | 0 (0.0%) | 0 (0.0%) |
| 75 Years and over | 1 (33.3%) | 1 (12.5%) |
Disability Class: Self-Care Difficulty
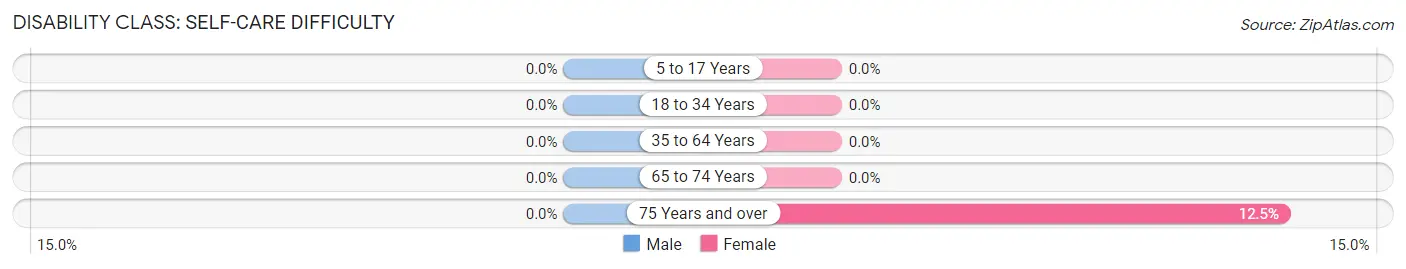
| Age Bracket | Male | Female |
| 5 to 17 Years | 0 (0.0%) | 0 (0.0%) |
| 18 to 34 Years | 0 (0.0%) | 0 (0.0%) |
| 35 to 64 Years | 0 (0.0%) | 0 (0.0%) |
| 65 to 74 Years | 0 (0.0%) | 0 (0.0%) |
| 75 Years and over | 0 (0.0%) | 1 (12.5%) |
Technology Access in Harrisburg
Computing Device Access in Harrisburg
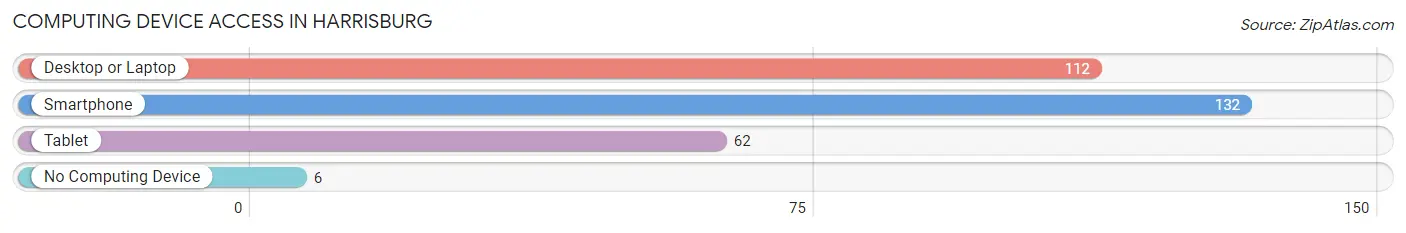
| Device Type | # Households | % Households |
| Desktop or Laptop | 112 | 79.4% |
| Smartphone | 132 | 93.6% |
| Tablet | 62 | 44.0% |
| No Computing Device | 6 | 4.3% |
| Total | 141 | 100.0% |
Internet Access in Harrisburg
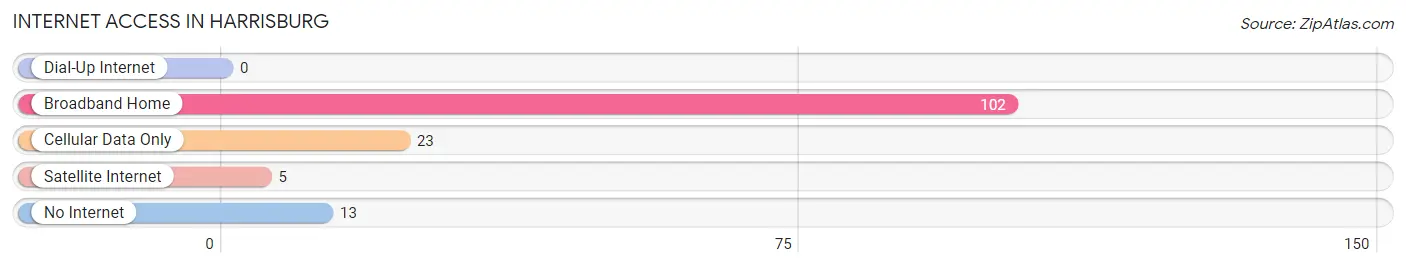
| Internet Type | # Households | % Households |
| Dial-Up Internet | 0 | 0.0% |
| Broadband Home | 102 | 72.3% |
| Cellular Data Only | 23 | 16.3% |
| Satellite Internet | 5 | 3.5% |
| No Internet | 13 | 9.2% |
| Total | 141 | 100.0% |
Harrisburg Summary
Harrisburg, Missouri is a small town located in the southeastern corner of the state, in the Ozark Mountains. It is situated in the heart of the Ozark National Scenic Riverways, a protected area of rivers, streams, and forests. The town is home to a population of just over 1,000 people, and is the county seat of Shannon County.
History
The area that is now Harrisburg was first settled in the early 1800s by settlers from Kentucky and Tennessee. The town was originally known as “Harrisonburg”, after the first settler, William Harrison. The name was changed to Harrisburg in 1845, when the post office was established.
The town was officially incorporated in 1876, and the first mayor was elected in 1877. The town grew slowly, but steadily, and by the early 1900s, it had become a thriving community. The town was home to several businesses, including a general store, a blacksmith shop, a hotel, and a sawmill.
Geography
Harrisburg is located in the southeastern corner of Missouri, in the Ozark Mountains. It is situated in the heart of the Ozark National Scenic Riverways, a protected area of rivers, streams, and forests. The town is located at the intersection of US Highway 60 and Missouri Highway 19.
The town is situated on the banks of the Current River, which is a popular destination for canoeing, kayaking, and fishing. The town is also located near several state parks, including Montauk State Park, Johnson’s Shut-Ins State Park, and Big Spring State Park.
Economy
The economy of Harrisburg is largely based on tourism. The town is a popular destination for outdoor recreation, and is home to several businesses that cater to tourists, including restaurants, hotels, and campgrounds.
The town is also home to several small businesses, including a general store, a hardware store, and a lumber yard. The town is also home to a small manufacturing plant, which produces plastic products.
Demographics
As of the 2010 census, the population of Harrisburg was 1,072. The racial makeup of the town was 97.2% White, 0.7% African American, 0.3% Native American, 0.2% Asian, 0.1% Pacific Islander, 0.3% from other races, and 1.3% from two or more races. Hispanic or Latino of any race were 1.3% of the population.
The median household income in Harrisburg was $30,938, and the median family income was $37,500. The per capita income for the town was $15,945. About 17.2% of families and 20.2% of the population were below the poverty line, including 28.3% of those under age 18 and 11.2% of those age 65 or over.
Harrisburg is a small town with a rich history and a vibrant economy. It is a popular destination for outdoor recreation, and is home to several businesses that cater to tourists. The town is also home to a diverse population, with a median household income that is slightly below the state average.
Common Questions
What is Per Capita Income in Harrisburg?
Per Capita income in Harrisburg is $28,081.
What is the Median Family Income in Harrisburg?
Median Family Income in Harrisburg is $88,125.
What is the Median Household income in Harrisburg?
Median Household Income in Harrisburg is $70,893.
What is Income or Wage Gap in Harrisburg?
Income or Wage Gap in Harrisburg is 7.5%.
Women in Harrisburg earn 92.5 cents for every dollar earned by a man.
What is Inequality or Gini Index in Harrisburg?
Inequality or Gini Index in Harrisburg is 0.38.
What is the Total Population of Harrisburg?
Total Population of Harrisburg is 377.
What is the Total Male Population of Harrisburg?
Total Male Population of Harrisburg is 193.
What is the Total Female Population of Harrisburg?
Total Female Population of Harrisburg is 184.
What is the Ratio of Males per 100 Females in Harrisburg?
There are 104.89 Males per 100 Females in Harrisburg.
What is the Ratio of Females per 100 Males in Harrisburg?
There are 95.34 Females per 100 Males in Harrisburg.
What is the Median Population Age in Harrisburg?
Median Population Age in Harrisburg is 27.6 Years.
What is the Average Family Size in Harrisburg
Average Family Size in Harrisburg is 3.1 People.
What is the Average Household Size in Harrisburg
Average Household Size in Harrisburg is 2.7 People.
How Large is the Labor Force in Harrisburg?
There are 187 People in the Labor Forcein in Harrisburg.
What is the Percentage of People in the Labor Force in Harrisburg?
71.9% of People are in the Labor Force in Harrisburg.
What is the Unemployment Rate in Harrisburg?
Unemployment Rate in Harrisburg is 2.7%.