Hannibal, MO Map & Demographics
Hannibal Map
Hannibal Overview
$28,710
PER CAPITA INCOME
$67,827
AVG FAMILY INCOME
$52,746
AVG HOUSEHOLD INCOME
32.6%
WAGE / INCOME GAP [ % ]
67.4¢/ $1
WAGE / INCOME GAP [ $ ]
$10,575
FAMILY INCOME DEFICIT
0.47
INEQUALITY / GINI INDEX
17,003
TOTAL POPULATION
8,068
MALE POPULATION
8,935
FEMALE POPULATION
90.30
MALES / 100 FEMALES
110.75
FEMALES / 100 MALES
38.5
MEDIAN AGE
3.0
AVG FAMILY SIZE
2.3
AVG HOUSEHOLD SIZE
7,751
LABOR FORCE [ PEOPLE ]
56.9%
PERCENT IN LABOR FORCE
3.9%
UNEMPLOYMENT RATE
Hannibal Zip Codes
Hannibal Area Codes
Income in Hannibal
Income Overview in Hannibal
Per Capita Income in Hannibal is $28,710, while median incomes of families and households are $67,827 and $52,746 respectively.
| Characteristic | Number | Measure |
| Per Capita Income | 17,003 | $28,710 |
| Median Family Income | 4,113 | $67,827 |
| Mean Family Income | 4,113 | $77,295 |
| Median Household Income | 6,810 | $52,746 |
| Mean Household Income | 6,810 | $71,017 |
| Income Deficit | 4,113 | $10,575 |
| Wage / Income Gap (%) | 17,003 | 32.64% |
| Wage / Income Gap ($) | 17,003 | 67.36¢ per $1 |
| Gini / Inequality Index | 17,003 | 0.47 |
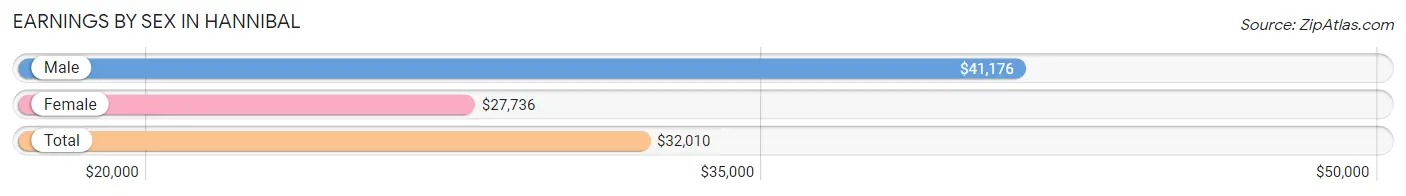
Earnings by Sex in Hannibal
Average Earnings in Hannibal are $32,010, $41,176 for men and $27,736 for women, a difference of 32.6%.
| Sex | Number | Average Earnings |
| Male | 4,011 (49.1%) | $41,176 |
| Female | 4,149 (50.8%) | $27,736 |
| Total | 8,160 (100.0%) | $32,010 |
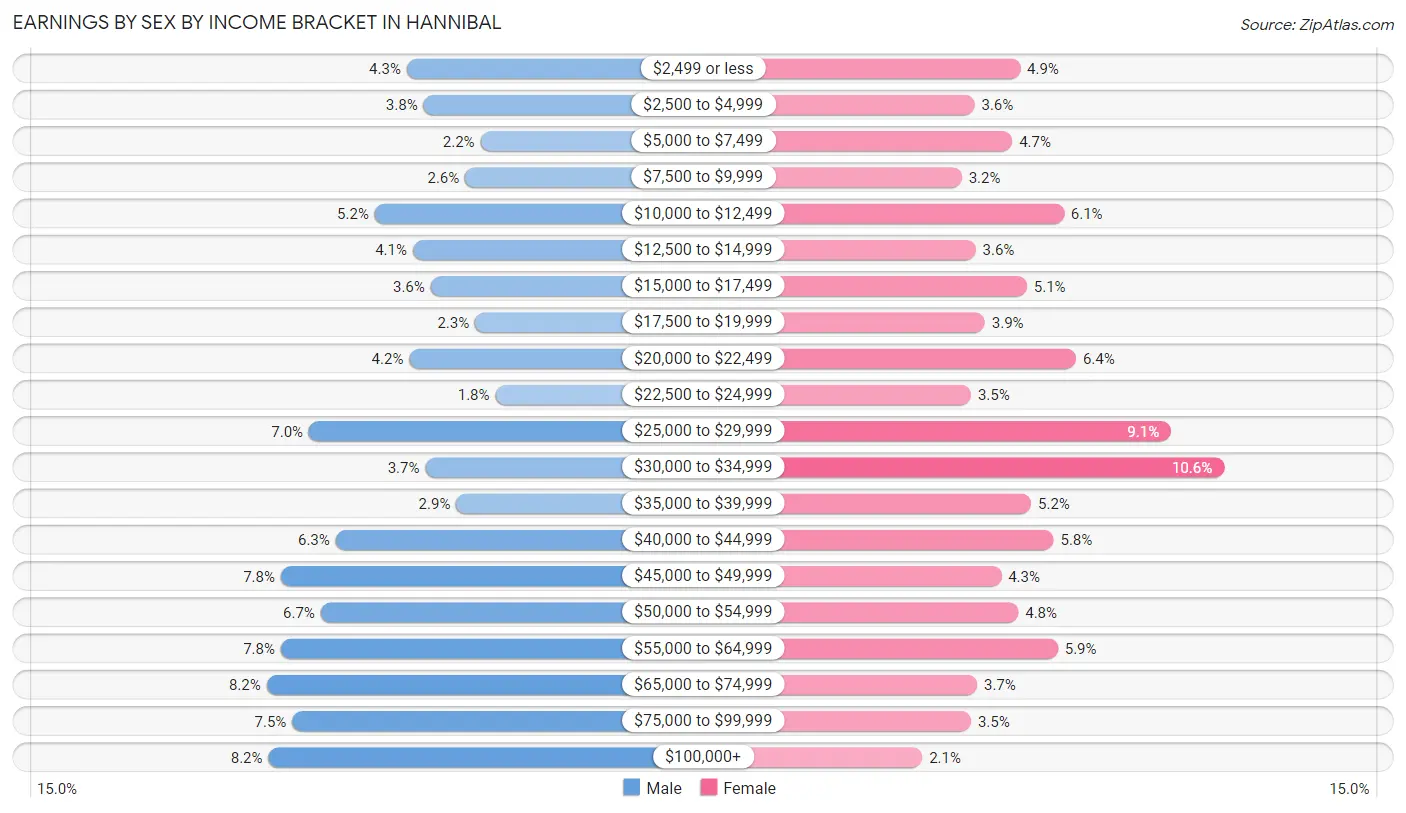
Earnings by Sex by Income Bracket in Hannibal
The most common earnings brackets in Hannibal are $65,000 to $74,999 for men (329 | 8.2%) and $30,000 to $34,999 for women (440 | 10.6%).
| Income | Male | Female |
| $2,499 or less | 171 (4.3%) | 202 (4.9%) |
| $2,500 to $4,999 | 152 (3.8%) | 149 (3.6%) |
| $5,000 to $7,499 | 88 (2.2%) | 193 (4.6%) |
| $7,500 to $9,999 | 105 (2.6%) | 134 (3.2%) |
| $10,000 to $12,499 | 207 (5.2%) | 253 (6.1%) |
| $12,500 to $14,999 | 164 (4.1%) | 150 (3.6%) |
| $15,000 to $17,499 | 144 (3.6%) | 210 (5.1%) |
| $17,500 to $19,999 | 94 (2.3%) | 161 (3.9%) |
| $20,000 to $22,499 | 168 (4.2%) | 267 (6.4%) |
| $22,500 to $24,999 | 71 (1.8%) | 145 (3.5%) |
| $25,000 to $29,999 | 281 (7.0%) | 378 (9.1%) |
| $30,000 to $34,999 | 150 (3.7%) | 440 (10.6%) |
| $35,000 to $39,999 | 115 (2.9%) | 215 (5.2%) |
| $40,000 to $44,999 | 251 (6.3%) | 241 (5.8%) |
| $45,000 to $49,999 | 313 (7.8%) | 180 (4.3%) |
| $50,000 to $54,999 | 268 (6.7%) | 200 (4.8%) |
| $55,000 to $64,999 | 313 (7.8%) | 246 (5.9%) |
| $65,000 to $74,999 | 329 (8.2%) | 152 (3.7%) |
| $75,000 to $99,999 | 300 (7.5%) | 145 (3.5%) |
| $100,000+ | 327 (8.2%) | 88 (2.1%) |
| Total | 4,011 (100.0%) | 4,149 (100.0%) |
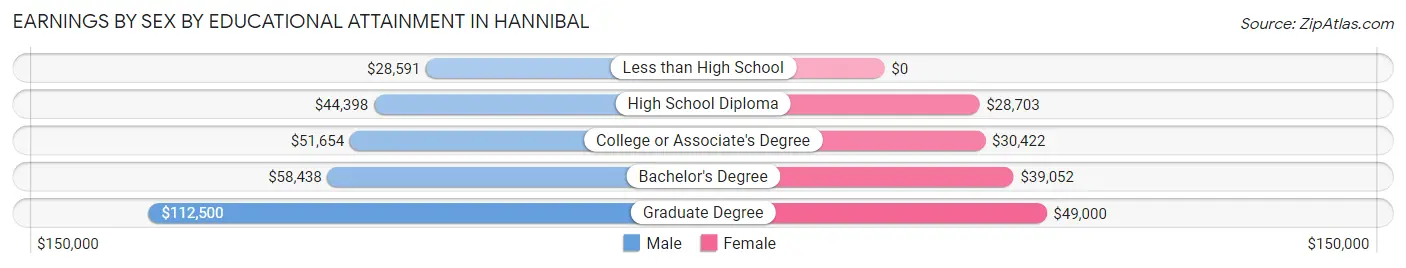
Earnings by Sex by Educational Attainment in Hannibal
Average earnings in Hannibal are $45,868 for men and $31,069 for women, a difference of 32.3%. Men with an educational attainment of graduate degree enjoy the highest average annual earnings of $112,500, while those with less than high school education earn the least with $28,591. Women with an educational attainment of graduate degree earn the most with the average annual earnings of $49,000, while those with high school diploma education have the smallest earnings of $28,703.
| Educational Attainment | Male Income | Female Income |
| Less than High School | $28,591 | $0 |
| High School Diploma | $44,398 | $28,703 |
| College or Associate's Degree | $51,654 | $30,422 |
| Bachelor's Degree | $58,438 | $39,052 |
| Graduate Degree | $112,500 | $49,000 |
| Total | $45,868 | $31,069 |
Family Income in Hannibal
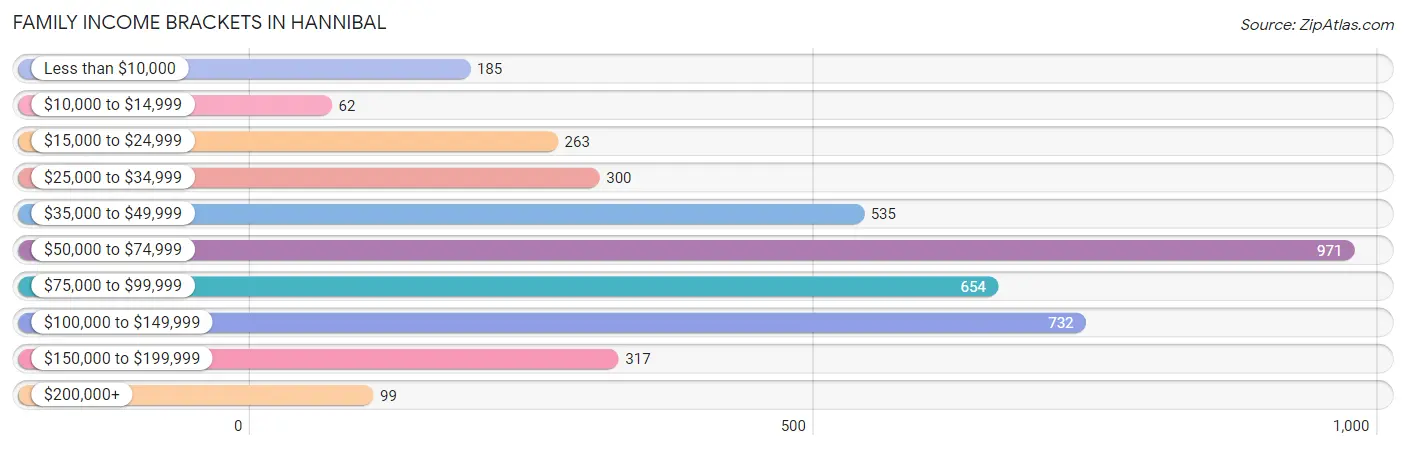
Family Income Brackets in Hannibal
According to the Hannibal family income data, there are 971 families falling into the $50,000 to $74,999 income range, which is the most common income bracket and makes up 23.6% of all families. Conversely, the $10,000 to $14,999 income bracket is the least frequent group with only 62 families (1.5%) belonging to this category.
| Income Bracket | # Families | % Families |
| Less than $10,000 | 185 | 4.5% |
| $10,000 to $14,999 | 62 | 1.5% |
| $15,000 to $24,999 | 263 | 6.4% |
| $25,000 to $34,999 | 300 | 7.3% |
| $35,000 to $49,999 | 535 | 13.0% |
| $50,000 to $74,999 | 971 | 23.6% |
| $75,000 to $99,999 | 654 | 15.9% |
| $100,000 to $149,999 | 732 | 17.8% |
| $150,000 to $199,999 | 317 | 7.7% |
| $200,000+ | 99 | 2.4% |
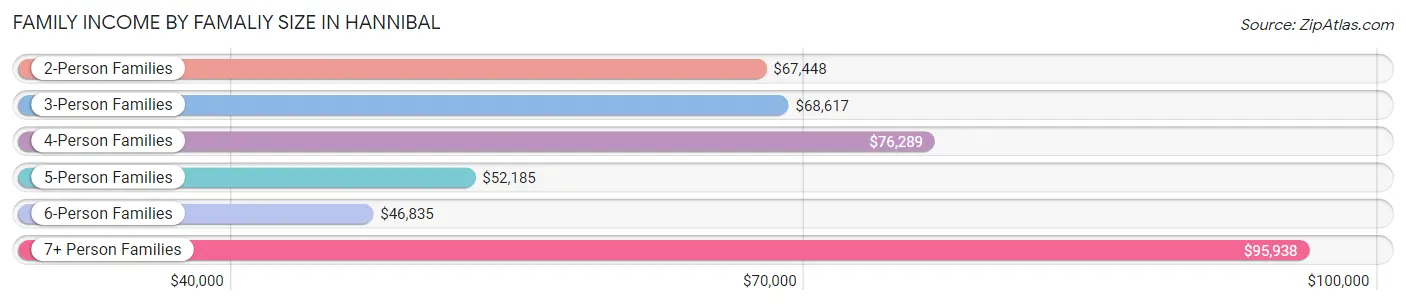
Family Income by Famaliy Size in Hannibal
7+ person families (85 | 2.1%) account for the highest median family income in Hannibal with $95,938 per family, while 2-person families (2,055 | 50.0%) have the highest median income of $33,724 per family member.
| Income Bracket | # Families | Median Income |
| 2-Person Families | 2,055 (50.0%) | $67,448 |
| 3-Person Families | 994 (24.2%) | $68,617 |
| 4-Person Families | 509 (12.4%) | $76,289 |
| 5-Person Families | 355 (8.6%) | $52,185 |
| 6-Person Families | 115 (2.8%) | $46,835 |
| 7+ Person Families | 85 (2.1%) | $95,938 |
| Total | 4,113 (100.0%) | $67,827 |
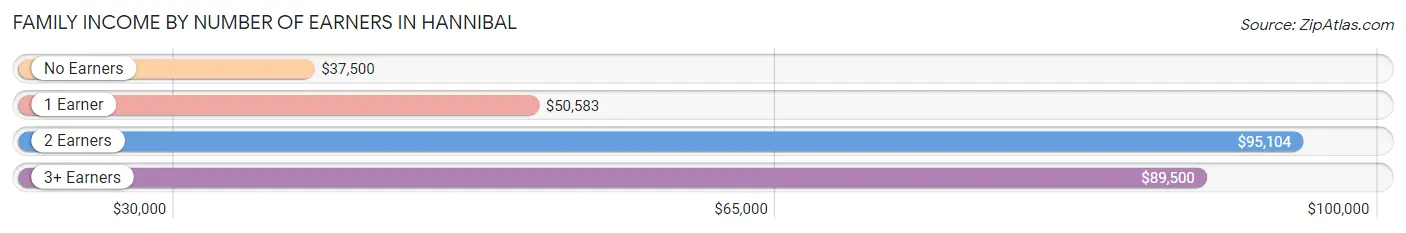
Family Income by Number of Earners in Hannibal
The median family income in Hannibal is $67,827, with families comprising 2 earners (1,625) having the highest median family income of $95,104, while families with no earners (656) have the lowest median family income of $37,500, accounting for 39.5% and 16.0% of families, respectively.
| Number of Earners | # Families | Median Income |
| No Earners | 656 (16.0%) | $37,500 |
| 1 Earner | 1,496 (36.4%) | $50,583 |
| 2 Earners | 1,625 (39.5%) | $95,104 |
| 3+ Earners | 336 (8.2%) | $89,500 |
| Total | 4,113 (100.0%) | $67,827 |
Household Income in Hannibal
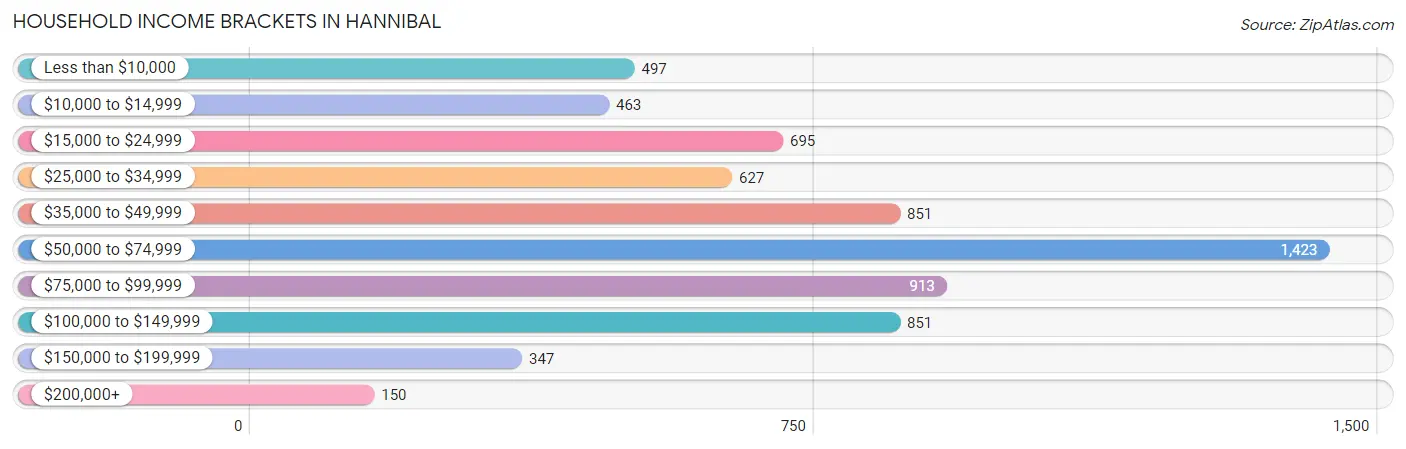
Household Income Brackets in Hannibal
With 1,423 households falling in the category, the $50,000 to $74,999 income range is the most frequent in Hannibal, accounting for 20.9% of all households. In contrast, only 150 households (2.2%) fall into the $200,000+ income bracket, making it the least populous group.
| Income Bracket | # Households | % Households |
| Less than $10,000 | 497 | 7.3% |
| $10,000 to $14,999 | 463 | 6.8% |
| $15,000 to $24,999 | 695 | 10.2% |
| $25,000 to $34,999 | 627 | 9.2% |
| $35,000 to $49,999 | 851 | 12.5% |
| $50,000 to $74,999 | 1,423 | 20.9% |
| $75,000 to $99,999 | 913 | 13.4% |
| $100,000 to $149,999 | 851 | 12.5% |
| $150,000 to $199,999 | 347 | 5.1% |
| $200,000+ | 150 | 2.2% |
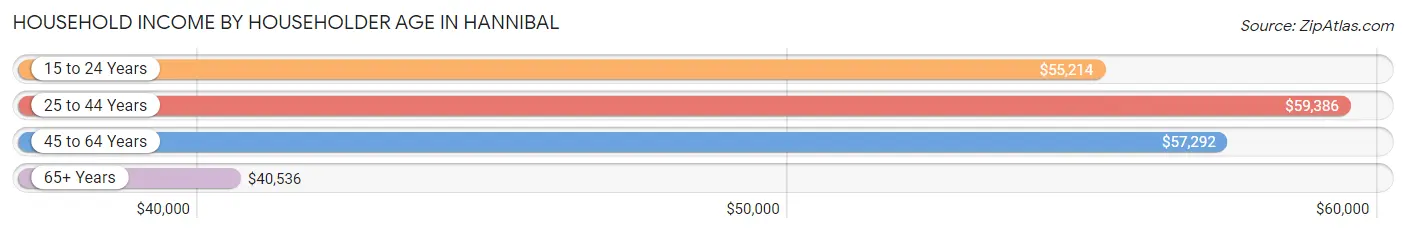
Household Income by Householder Age in Hannibal
The median household income in Hannibal is $52,746, with the highest median household income of $59,386 found in the 25 to 44 years age bracket for the primary householder. A total of 1,927 households (28.3%) fall into this category. Meanwhile, the 65+ years age bracket for the primary householder has the lowest median household income of $40,536, with 2,094 households (30.7%) in this group.
| Income Bracket | # Households | Median Income |
| 15 to 24 Years | 448 (6.6%) | $55,214 |
| 25 to 44 Years | 1,927 (28.3%) | $59,386 |
| 45 to 64 Years | 2,341 (34.4%) | $57,292 |
| 65+ Years | 2,094 (30.7%) | $40,536 |
| Total | 6,810 (100.0%) | $52,746 |
Poverty in Hannibal
Income Below Poverty by Sex and Age in Hannibal
With 15.5% poverty level for males and 17.6% for females among the residents of Hannibal, 15 year old males and 12 to 14 year old females are the most vulnerable to poverty, with 45 males (47.4%) and 57 females (24.5%) in their respective age groups living below the poverty level.
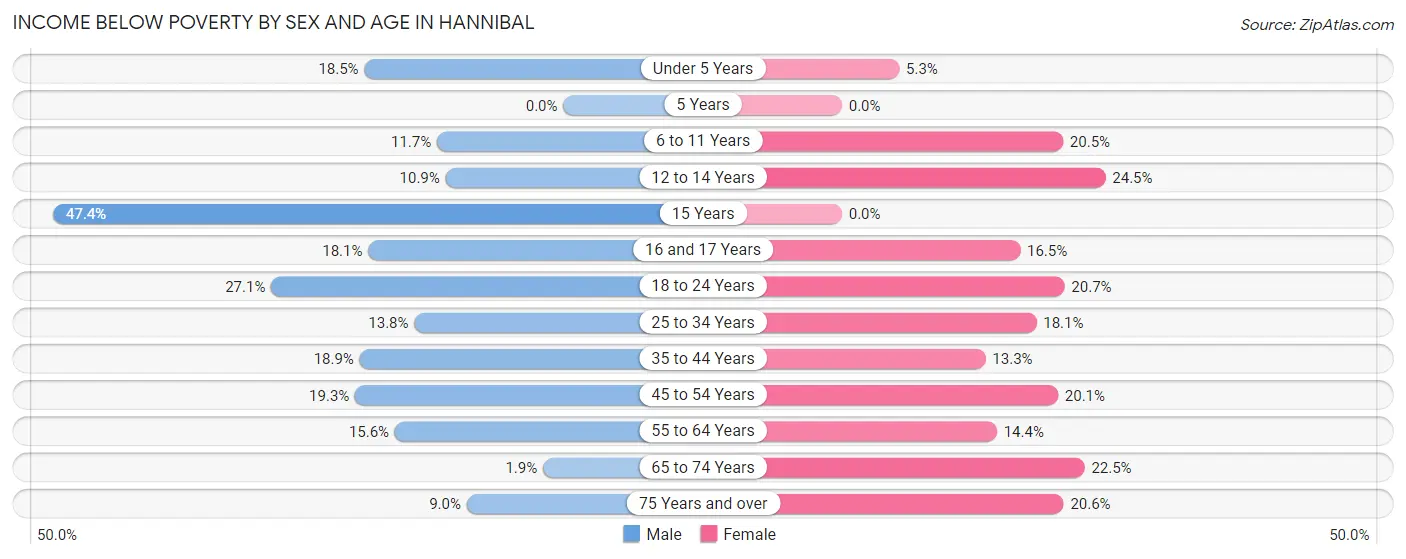
| Age Bracket | Male | Female |
| Under 5 Years | 108 (18.5%) | 24 (5.3%) |
| 5 Years | 0 (0.0%) | 0 (0.0%) |
| 6 to 11 Years | 73 (11.7%) | 167 (20.5%) |
| 12 to 14 Years | 33 (10.9%) | 57 (24.5%) |
| 15 Years | 45 (47.4%) | 0 (0.0%) |
| 16 and 17 Years | 40 (18.1%) | 43 (16.5%) |
| 18 to 24 Years | 167 (27.1%) | 137 (20.7%) |
| 25 to 34 Years | 134 (13.8%) | 185 (18.0%) |
| 35 to 44 Years | 183 (18.9%) | 122 (13.3%) |
| 45 to 54 Years | 164 (19.3%) | 172 (20.1%) |
| 55 to 64 Years | 174 (15.6%) | 174 (14.4%) |
| 65 to 74 Years | 13 (1.9%) | 227 (22.5%) |
| 75 Years and over | 44 (9.0%) | 172 (20.6%) |
| Total | 1,178 (15.5%) | 1,480 (17.6%) |
Income Above Poverty by Sex and Age in Hannibal
According to the poverty statistics in Hannibal, males aged 5 years and females aged 5 years are the age groups that are most secure financially, with 100.0% of males and 100.0% of females in these age groups living above the poverty line.
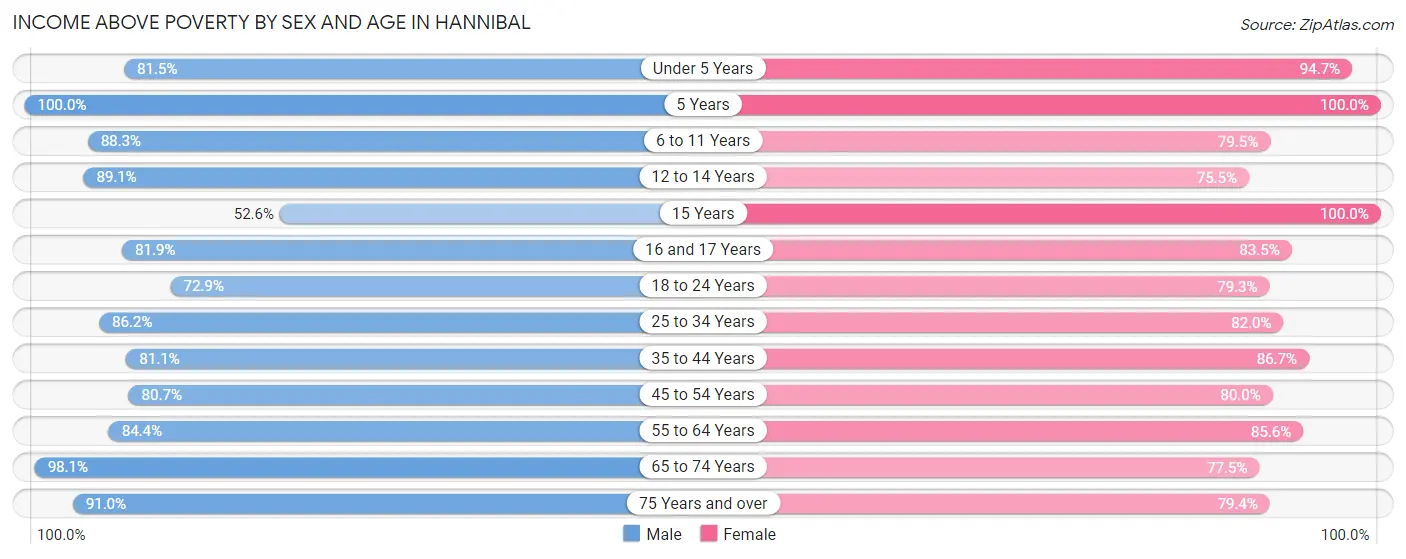
| Age Bracket | Male | Female |
| Under 5 Years | 477 (81.5%) | 427 (94.7%) |
| 5 Years | 88 (100.0%) | 69 (100.0%) |
| 6 to 11 Years | 550 (88.3%) | 647 (79.5%) |
| 12 to 14 Years | 269 (89.1%) | 176 (75.5%) |
| 15 Years | 50 (52.6%) | 61 (100.0%) |
| 16 and 17 Years | 181 (81.9%) | 217 (83.5%) |
| 18 to 24 Years | 449 (72.9%) | 526 (79.3%) |
| 25 to 34 Years | 835 (86.2%) | 840 (82.0%) |
| 35 to 44 Years | 785 (81.1%) | 793 (86.7%) |
| 45 to 54 Years | 685 (80.7%) | 686 (79.9%) |
| 55 to 64 Years | 939 (84.4%) | 1,036 (85.6%) |
| 65 to 74 Years | 680 (98.1%) | 781 (77.5%) |
| 75 Years and over | 447 (91.0%) | 664 (79.4%) |
| Total | 6,435 (84.5%) | 6,923 (82.4%) |
Income Below Poverty Among Married-Couple Families in Hannibal
The poverty statistics for married-couple families in Hannibal show that 2.7% or 74 of the total 2,787 families live below the poverty line. Families with 5 or more children have the highest poverty rate of 58.3%, comprising of 28 families. On the other hand, families with 3 or 4 children have the lowest poverty rate of 0.0%, which includes 0 families.
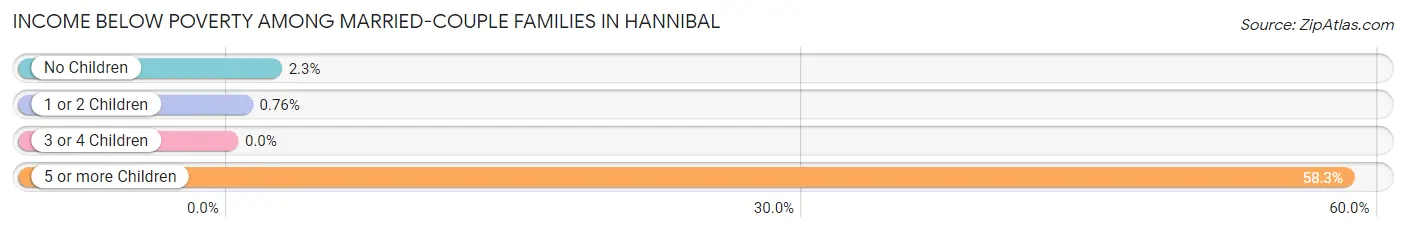
| Children | Above Poverty | Below Poverty |
| No Children | 1,711 (97.7%) | 40 (2.3%) |
| 1 or 2 Children | 786 (99.2%) | 6 (0.8%) |
| 3 or 4 Children | 196 (100.0%) | 0 (0.0%) |
| 5 or more Children | 20 (41.7%) | 28 (58.3%) |
| Total | 2,713 (97.3%) | 74 (2.7%) |
Income Below Poverty Among Single-Parent Households in Hannibal
According to the poverty data in Hannibal, 24.7% or 96 single-father households and 28.5% or 267 single-mother households are living below the poverty line. Among single-father households, those with 1 or 2 children have the highest poverty rate, with 74 households (36.3%) experiencing poverty. Likewise, among single-mother households, those with 1 or 2 children have the highest poverty rate, with 222 households (40.7%) falling below the poverty line.
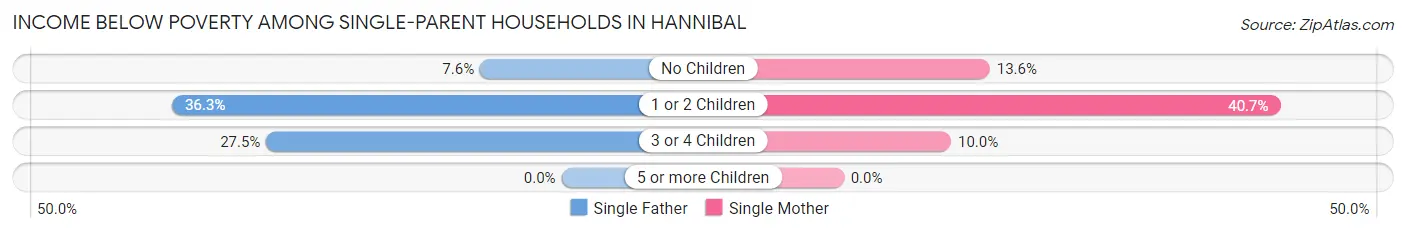
| Children | Single Father | Single Mother |
| No Children | 11 (7.6%) | 26 (13.6%) |
| 1 or 2 Children | 74 (36.3%) | 222 (40.7%) |
| 3 or 4 Children | 11 (27.5%) | 19 (10.0%) |
| 5 or more Children | 0 (0.0%) | 0 (0.0%) |
| Total | 96 (24.7%) | 267 (28.5%) |
Income Below Poverty Among Married-Couple vs Single-Parent Households in Hannibal
The poverty data for Hannibal shows that 74 of the married-couple family households (2.7%) and 363 of the single-parent households (27.4%) are living below the poverty level. Within the married-couple family households, those with 5 or more children have the highest poverty rate, with 28 households (58.3%) falling below the poverty line. Among the single-parent households, those with 1 or 2 children have the highest poverty rate, with 296 household (39.5%) living below poverty.
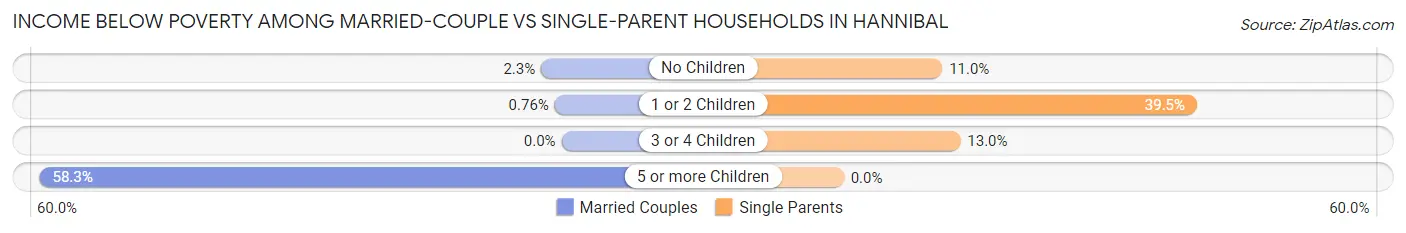
| Children | Married-Couple Families | Single-Parent Households |
| No Children | 40 (2.3%) | 37 (11.0%) |
| 1 or 2 Children | 6 (0.8%) | 296 (39.5%) |
| 3 or 4 Children | 0 (0.0%) | 30 (13.0%) |
| 5 or more Children | 28 (58.3%) | 0 (0.0%) |
| Total | 74 (2.7%) | 363 (27.4%) |
Race in Hannibal
The most populous races in Hannibal are White / Caucasian (14,939 | 87.9%), Black / African American (1,294 | 7.6%), and Two or more Races (586 | 3.5%).
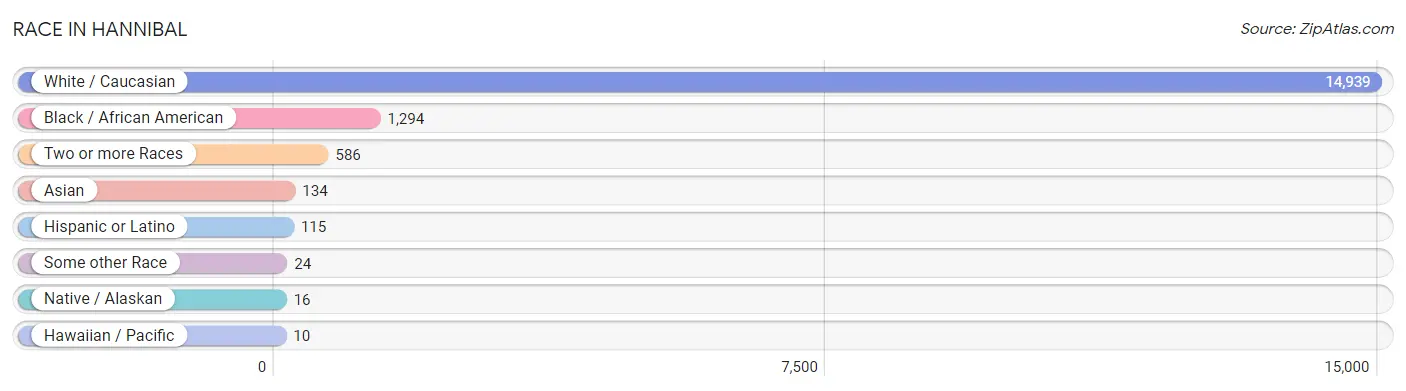
| Race | # Population | % Population |
| Asian | 134 | 0.8% |
| Black / African American | 1,294 | 7.6% |
| Hawaiian / Pacific | 10 | 0.1% |
| Hispanic or Latino | 115 | 0.7% |
| Native / Alaskan | 16 | 0.1% |
| White / Caucasian | 14,939 | 87.9% |
| Two or more Races | 586 | 3.5% |
| Some other Race | 24 | 0.1% |
| Total | 17,003 | 100.0% |
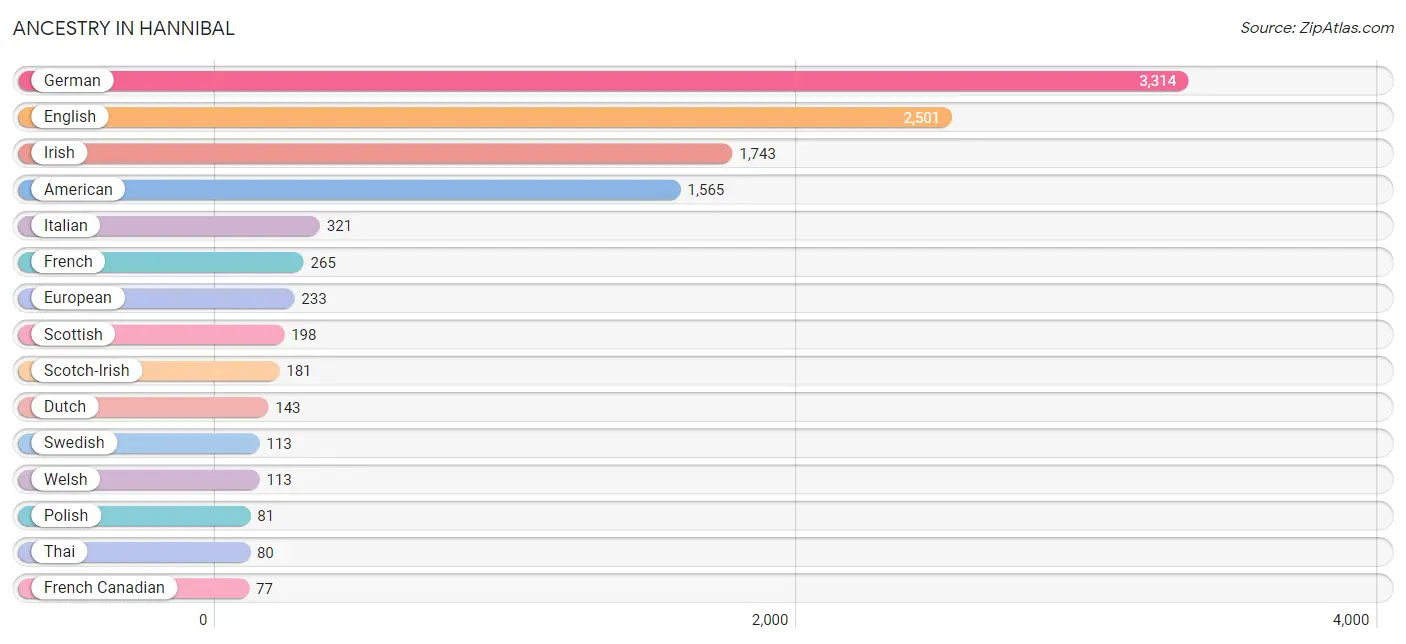
Ancestry in Hannibal
The most populous ancestries reported in Hannibal are German (3,314 | 19.5%), English (2,501 | 14.7%), Irish (1,743 | 10.2%), American (1,565 | 9.2%), and Italian (321 | 1.9%), together accounting for 55.5% of all Hannibal residents.
| Ancestry | # Population | % Population |
| African | 30 | 0.2% |
| American | 1,565 | 9.2% |
| Arab | 17 | 0.1% |
| Austrian | 25 | 0.2% |
| Bhutanese | 23 | 0.1% |
| Blackfeet | 31 | 0.2% |
| British | 31 | 0.2% |
| Burmese | 27 | 0.2% |
| Cherokee | 50 | 0.3% |
| Czech | 63 | 0.4% |
| Dutch | 143 | 0.8% |
| Eastern European | 43 | 0.3% |
| Egyptian | 5 | 0.0% |
| English | 2,501 | 14.7% |
| Ethiopian | 3 | 0.0% |
| European | 233 | 1.4% |
| Finnish | 11 | 0.1% |
| French | 265 | 1.6% |
| French American Indian | 6 | 0.0% |
| French Canadian | 77 | 0.4% |
| German | 3,314 | 19.5% |
| Hungarian | 11 | 0.1% |
| Indian (Asian) | 57 | 0.3% |
| Irish | 1,743 | 10.2% |
| Italian | 321 | 1.9% |
| Jamaican | 8 | 0.1% |
| Lebanese | 12 | 0.1% |
| Lithuanian | 10 | 0.1% |
| Mexican | 71 | 0.4% |
| Native Hawaiian | 10 | 0.1% |
| Nigerian | 19 | 0.1% |
| Northern European | 12 | 0.1% |
| Norwegian | 47 | 0.3% |
| Okinawan | 6 | 0.0% |
| Polish | 81 | 0.5% |
| Russian | 41 | 0.2% |
| Scandinavian | 51 | 0.3% |
| Scotch-Irish | 181 | 1.1% |
| Scottish | 198 | 1.2% |
| Sioux | 33 | 0.2% |
| South American | 18 | 0.1% |
| Spaniard | 26 | 0.2% |
| Subsaharan African | 52 | 0.3% |
| Swedish | 113 | 0.7% |
| Swiss | 7 | 0.0% |
| Thai | 80 | 0.5% |
| Ukrainian | 43 | 0.3% |
| Venezuelan | 18 | 0.1% |
| Welsh | 113 | 0.7% | View All 49 Rows |
Immigrants in Hannibal
The most numerous immigrant groups reported in Hannibal came from Asia (110 | 0.6%), India (44 | 0.3%), South Central Asia (44 | 0.3%), Saudi Arabia (36 | 0.2%), and Western Asia (36 | 0.2%), together accounting for 1.6% of all Hannibal residents.
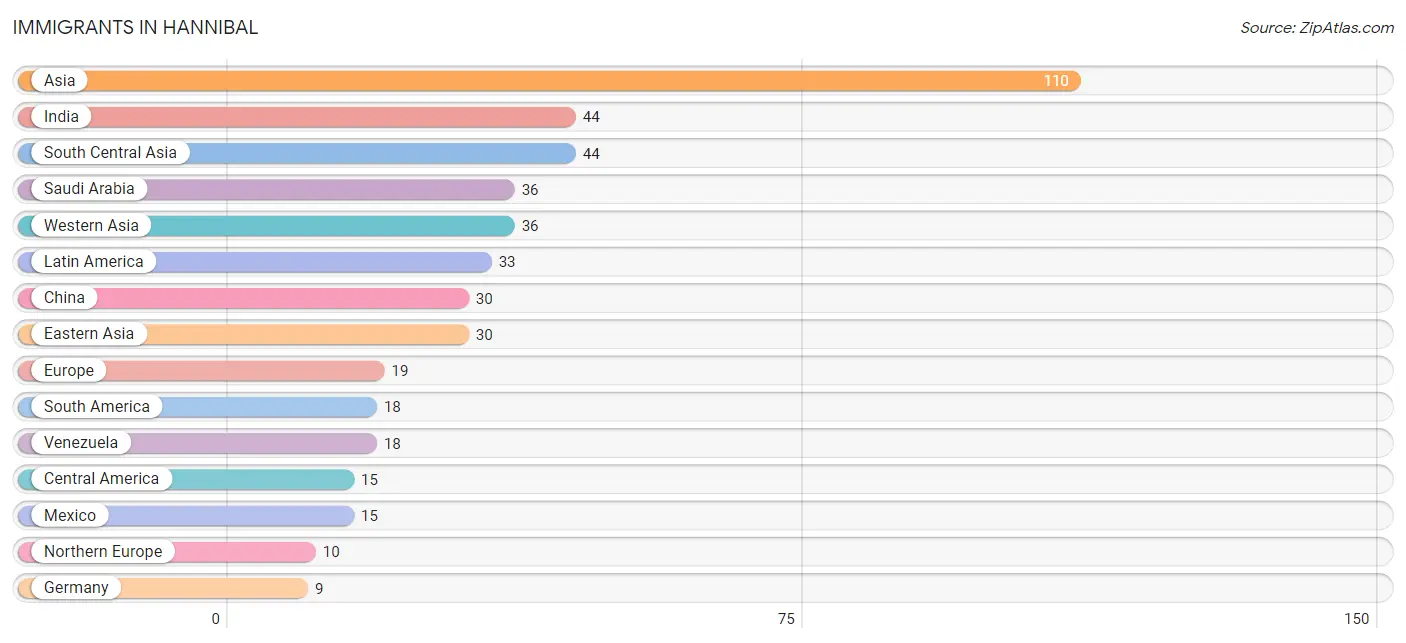
| Immigration Origin | # Population | % Population |
| Asia | 110 | 0.6% |
| Central America | 15 | 0.1% |
| China | 30 | 0.2% |
| Eastern Asia | 30 | 0.2% |
| Europe | 19 | 0.1% |
| Germany | 9 | 0.1% |
| India | 44 | 0.3% |
| Latin America | 33 | 0.2% |
| Mexico | 15 | 0.1% |
| Northern Europe | 10 | 0.1% |
| Saudi Arabia | 36 | 0.2% |
| South America | 18 | 0.1% |
| South Central Asia | 44 | 0.3% |
| Venezuela | 18 | 0.1% |
| Western Asia | 36 | 0.2% |
| Western Europe | 9 | 0.1% | View All 16 Rows |
Sex and Age in Hannibal
Sex and Age in Hannibal
The most populous age groups in Hannibal are 60 to 64 Years (720 | 8.9%) for men and 20 to 24 Years (789 | 8.8%) for women.
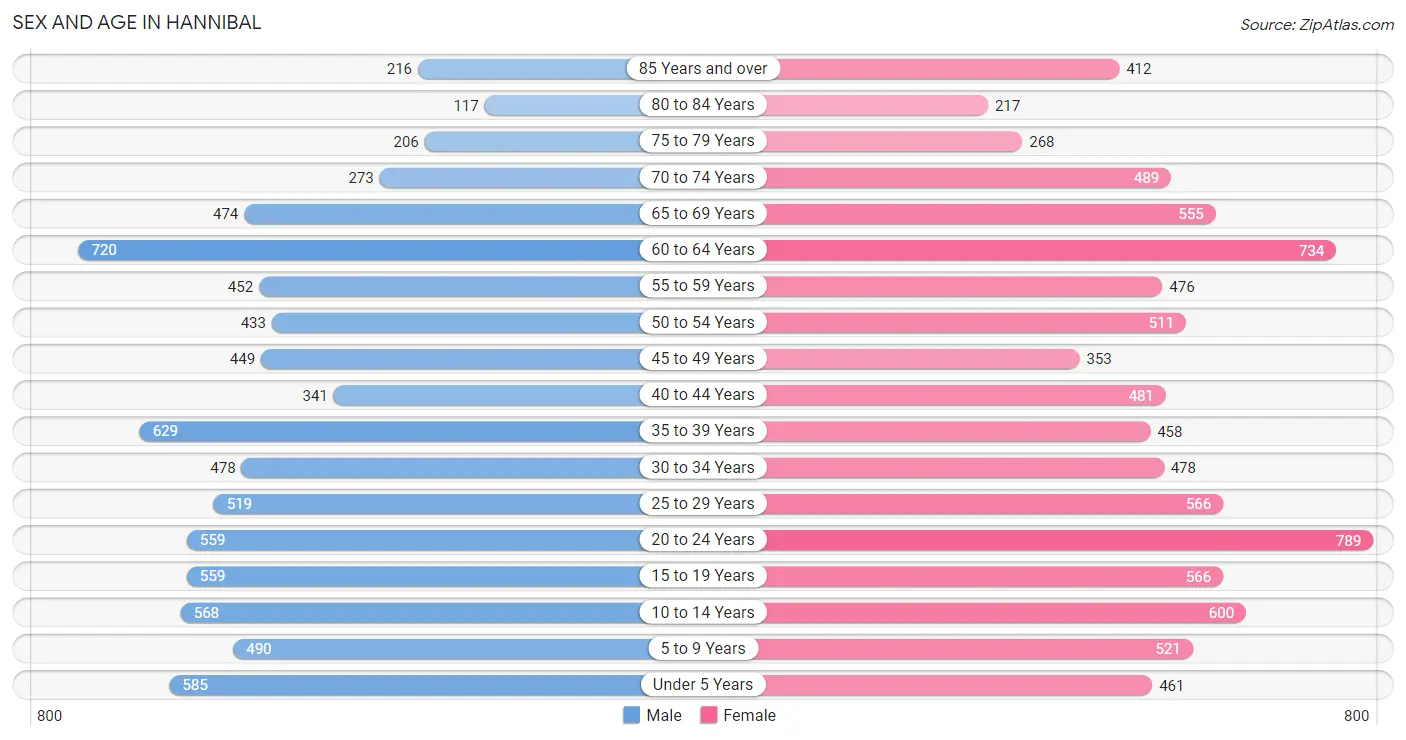
| Age Bracket | Male | Female |
| Under 5 Years | 585 (7.2%) | 461 (5.2%) |
| 5 to 9 Years | 490 (6.1%) | 521 (5.8%) |
| 10 to 14 Years | 568 (7.0%) | 600 (6.7%) |
| 15 to 19 Years | 559 (6.9%) | 566 (6.3%) |
| 20 to 24 Years | 559 (6.9%) | 789 (8.8%) |
| 25 to 29 Years | 519 (6.4%) | 566 (6.3%) |
| 30 to 34 Years | 478 (5.9%) | 478 (5.3%) |
| 35 to 39 Years | 629 (7.8%) | 458 (5.1%) |
| 40 to 44 Years | 341 (4.2%) | 481 (5.4%) |
| 45 to 49 Years | 449 (5.6%) | 353 (4.0%) |
| 50 to 54 Years | 433 (5.4%) | 511 (5.7%) |
| 55 to 59 Years | 452 (5.6%) | 476 (5.3%) |
| 60 to 64 Years | 720 (8.9%) | 734 (8.2%) |
| 65 to 69 Years | 474 (5.9%) | 555 (6.2%) |
| 70 to 74 Years | 273 (3.4%) | 489 (5.5%) |
| 75 to 79 Years | 206 (2.5%) | 268 (3.0%) |
| 80 to 84 Years | 117 (1.5%) | 217 (2.4%) |
| 85 Years and over | 216 (2.7%) | 412 (4.6%) |
| Total | 8,068 (100.0%) | 8,935 (100.0%) |
Families and Households in Hannibal
Median Family Size in Hannibal
The median family size in Hannibal is 2.95 persons per family, with married-couple families (2,787 | 67.8%) accounting for the largest median family size of 2.99 persons per family. On the other hand, single male/father families (389 | 9.5%) represent the smallest median family size with 2.58 persons per family.
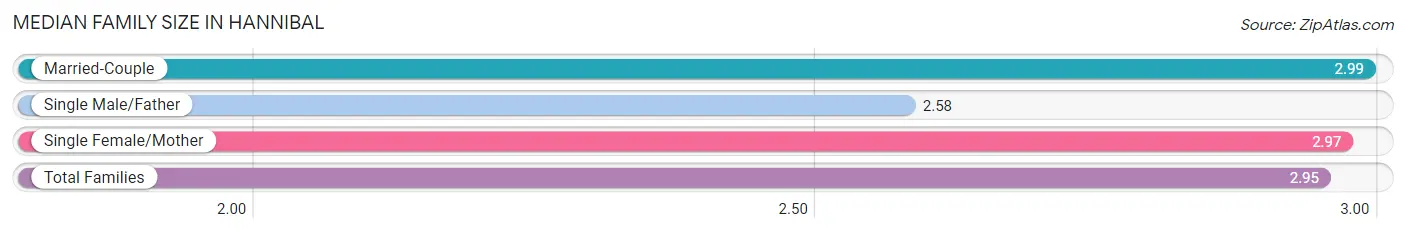
| Family Type | # Families | Family Size |
| Married-Couple | 2,787 (67.8%) | 2.99 |
| Single Male/Father | 389 (9.5%) | 2.58 |
| Single Female/Mother | 937 (22.8%) | 2.97 |
| Total Families | 4,113 (100.0%) | 2.95 |
Median Household Size in Hannibal
The median household size in Hannibal is 2.32 persons per household, with single female/mother households (937 | 13.8%) accounting for the largest median household size of 3.25 persons per household. non-family households (2,697 | 39.6%) represent the smallest median household size with 1.16 persons per household.
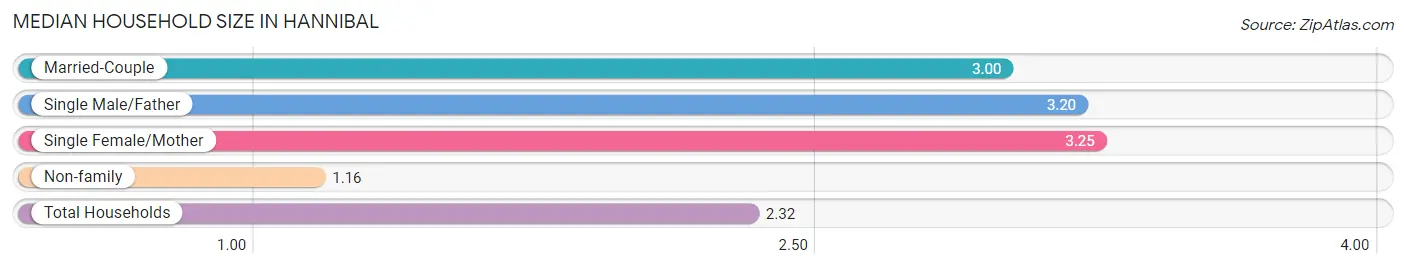
| Household Type | # Households | Household Size |
| Married-Couple | 2,787 (40.9%) | 3.00 |
| Single Male/Father | 389 (5.7%) | 3.20 |
| Single Female/Mother | 937 (13.8%) | 3.25 |
| Non-family | 2,697 (39.6%) | 1.16 |
| Total Households | 6,810 (100.0%) | 2.32 |
Household Size by Marriage Status in Hannibal
Out of a total of 6,810 households in Hannibal, 4,113 (60.4%) are family households, while 2,697 (39.6%) are nonfamily households. The most numerous type of family households are 2-person households, comprising 1,946, and the most common type of nonfamily households are 1-person households, comprising 2,389.
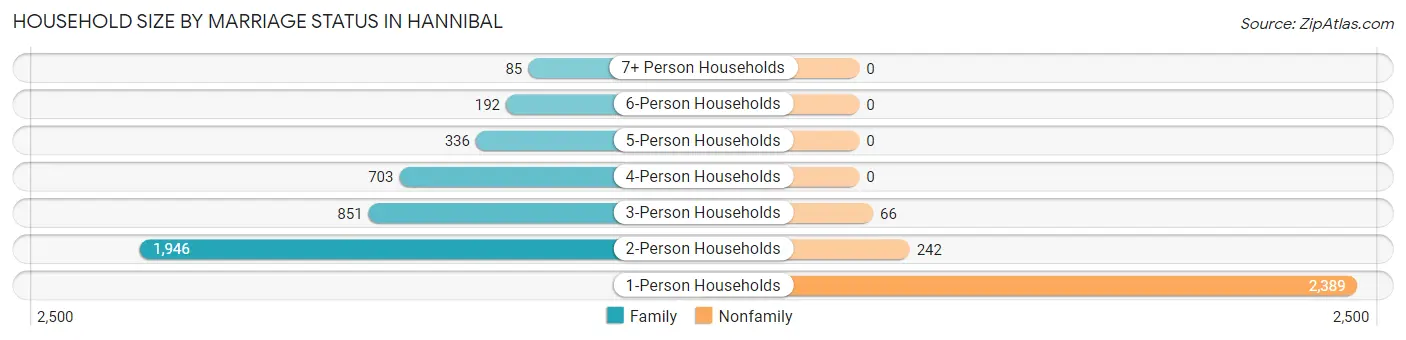
| Household Size | Family Households | Nonfamily Households |
| 1-Person Households | - | 2,389 (35.1%) |
| 2-Person Households | 1,946 (28.6%) | 242 (3.5%) |
| 3-Person Households | 851 (12.5%) | 66 (1.0%) |
| 4-Person Households | 703 (10.3%) | 0 (0.0%) |
| 5-Person Households | 336 (4.9%) | 0 (0.0%) |
| 6-Person Households | 192 (2.8%) | 0 (0.0%) |
| 7+ Person Households | 85 (1.3%) | 0 (0.0%) |
| Total | 4,113 (60.4%) | 2,697 (39.6%) |
Female Fertility in Hannibal
Fertility by Age in Hannibal
Average fertility rate in Hannibal is 35.0 births per 1,000 women. Women in the age bracket of 20 to 34 years have the highest fertility rate with 56.0 births per 1,000 women. Women in the age bracket of 20 to 34 years acount for 75.6% of all women with births.
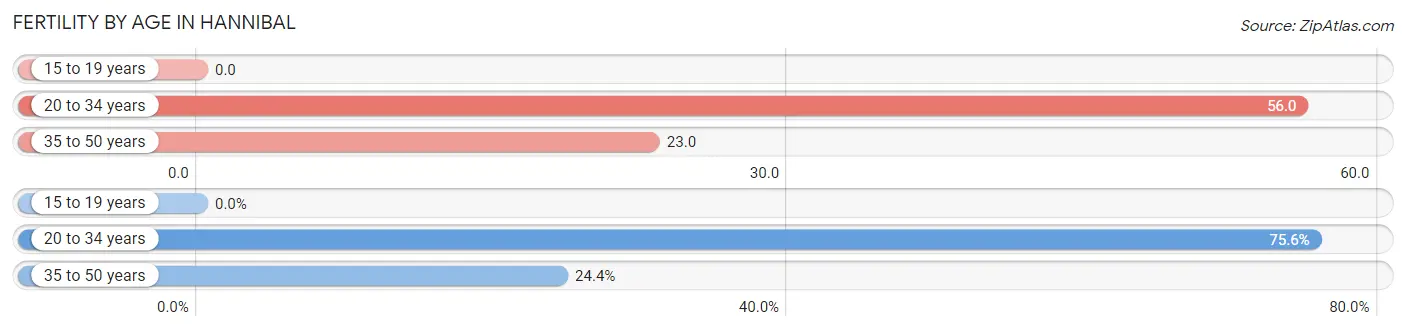
| Age Bracket | Women with Births | Births / 1,000 Women |
| 15 to 19 years | 0 (0.0%) | 0.0 |
| 20 to 34 years | 102 (75.6%) | 56.0 |
| 35 to 50 years | 33 (24.4%) | 23.0 |
| Total | 135 (100.0%) | 35.0 |
Fertility by Age by Marriage Status in Hannibal
64.4% of women with births (135) in Hannibal are married. The highest percentage of unmarried women with births falls into 35 to 50 years age bracket with 57.6% of them unmarried at the time of birth, while the lowest percentage of unmarried women with births belong to 20 to 34 years age bracket with 28.4% of them unmarried.
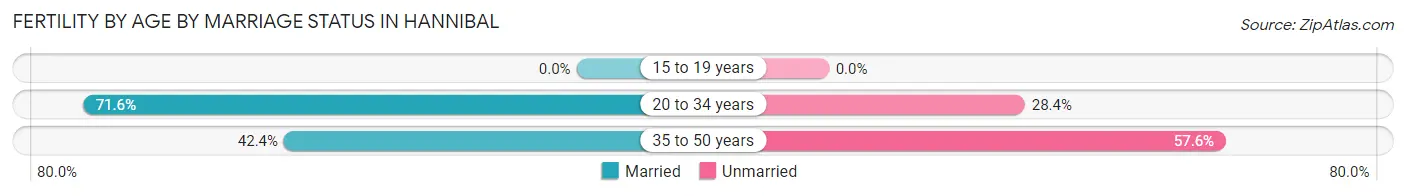
| Age Bracket | Married | Unmarried |
| 15 to 19 years | 0 (0.0%) | 0 (0.0%) |
| 20 to 34 years | 73 (71.6%) | 29 (28.4%) |
| 35 to 50 years | 14 (42.4%) | 19 (57.6%) |
| Total | 87 (64.4%) | 48 (35.6%) |
Fertility by Education in Hannibal
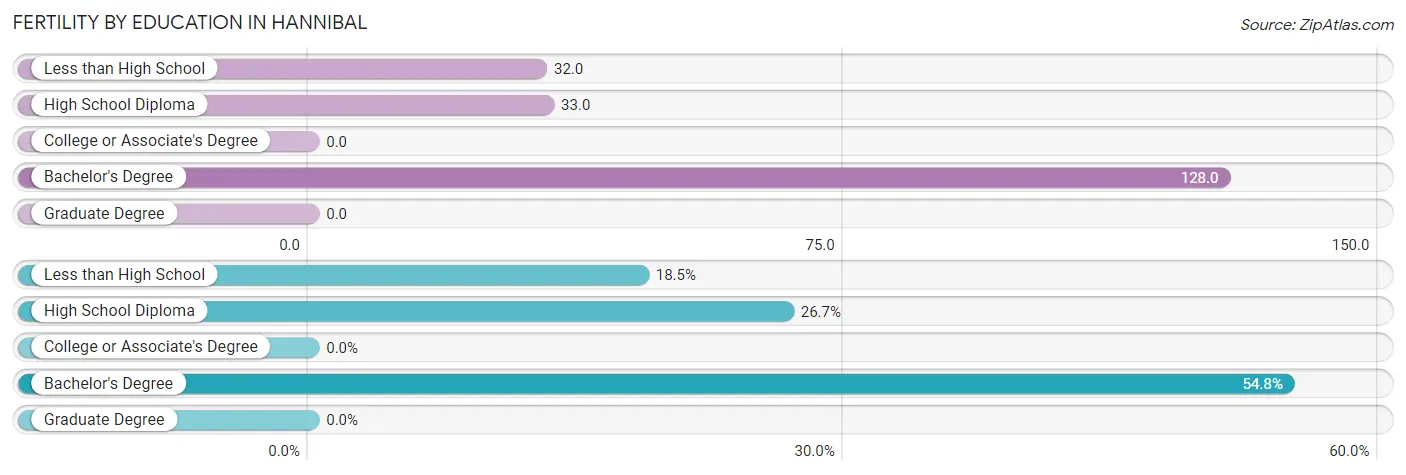
| Educational Attainment | Women with Births | Births / 1,000 Women |
| Less than High School | 25 (18.5%) | 32.0 |
| High School Diploma | 36 (26.7%) | 33.0 |
| College or Associate's Degree | 0 (0.0%) | 0.0 |
| Bachelor's Degree | 74 (54.8%) | 128.0 |
| Graduate Degree | 0 (0.0%) | 0.0 |
| Total | 135 (100.0%) | 35.0 |
Fertility by Education by Marriage Status in Hannibal
35.6% of women with births in Hannibal are unmarried. Women with the educational attainment of less than high school are most likely to be married with 100.0% of them married at childbirth, while women with the educational attainment of high school diploma are least likely to be married with 52.8% of them unmarried at childbirth.
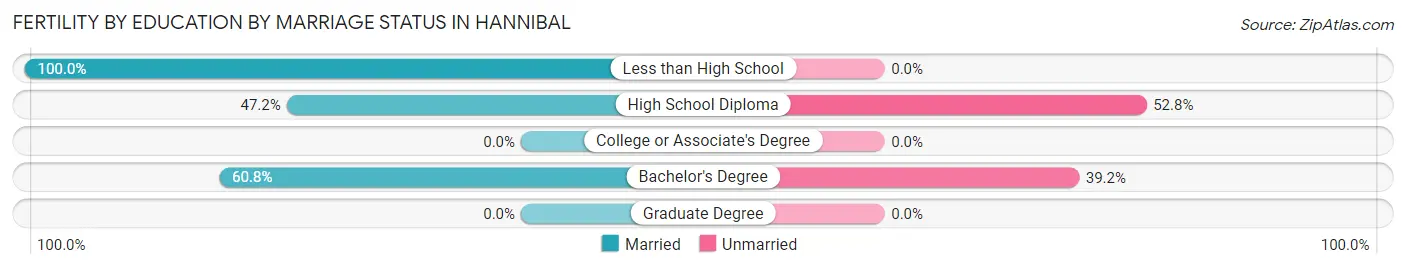
| Educational Attainment | Married | Unmarried |
| Less than High School | 25 (100.0%) | 0 (0.0%) |
| High School Diploma | 17 (47.2%) | 19 (52.8%) |
| College or Associate's Degree | 0 (0.0%) | 0 (0.0%) |
| Bachelor's Degree | 45 (60.8%) | 29 (39.2%) |
| Graduate Degree | 0 (0.0%) | 0 (0.0%) |
| Total | 87 (64.4%) | 48 (35.6%) |
Employment Characteristics in Hannibal
Employment by Class of Employer in Hannibal
Among the 7,306 employed individuals in Hannibal, private company employees (4,829 | 66.1%), not-for-profit organizations (1,184 | 16.2%), and local government employees (489 | 6.7%) make up the most common classes of employment.
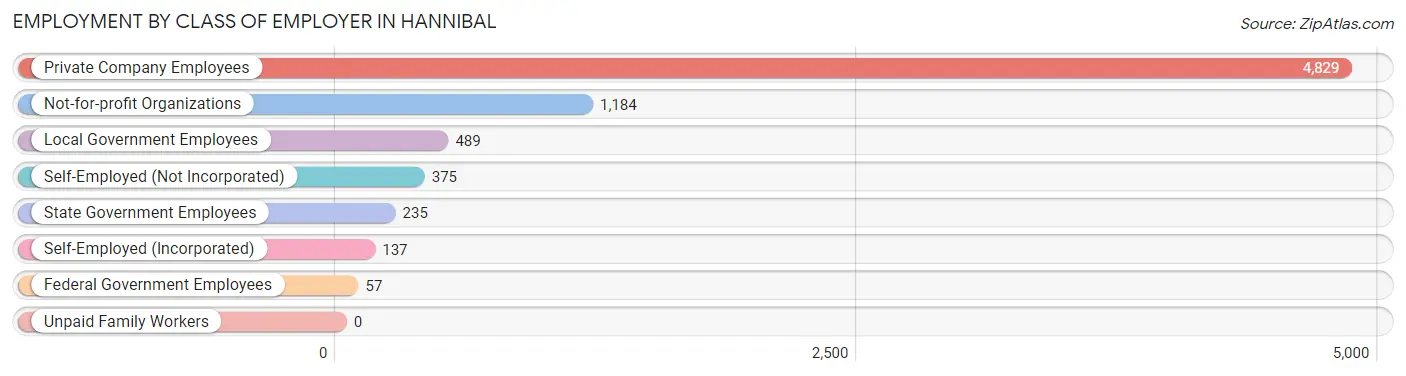
| Employer Class | # Employees | % Employees |
| Private Company Employees | 4,829 | 66.1% |
| Self-Employed (Incorporated) | 137 | 1.9% |
| Self-Employed (Not Incorporated) | 375 | 5.1% |
| Not-for-profit Organizations | 1,184 | 16.2% |
| Local Government Employees | 489 | 6.7% |
| State Government Employees | 235 | 3.2% |
| Federal Government Employees | 57 | 0.8% |
| Unpaid Family Workers | 0 | 0.0% |
| Total | 7,306 | 100.0% |
Employment Status by Age in Hannibal
According to the labor force statistics for Hannibal, out of the total population over 16 years of age (13,622), 56.9% or 7,751 individuals are in the labor force, with 3.9% or 302 of them unemployed. The age group with the highest labor force participation rate is 25 to 29 years, with 87.6% or 950 individuals in the labor force. Within the labor force, the 75 years and over age range has the highest percentage of unemployed individuals, with 12.1% or 8 of them being unemployed.
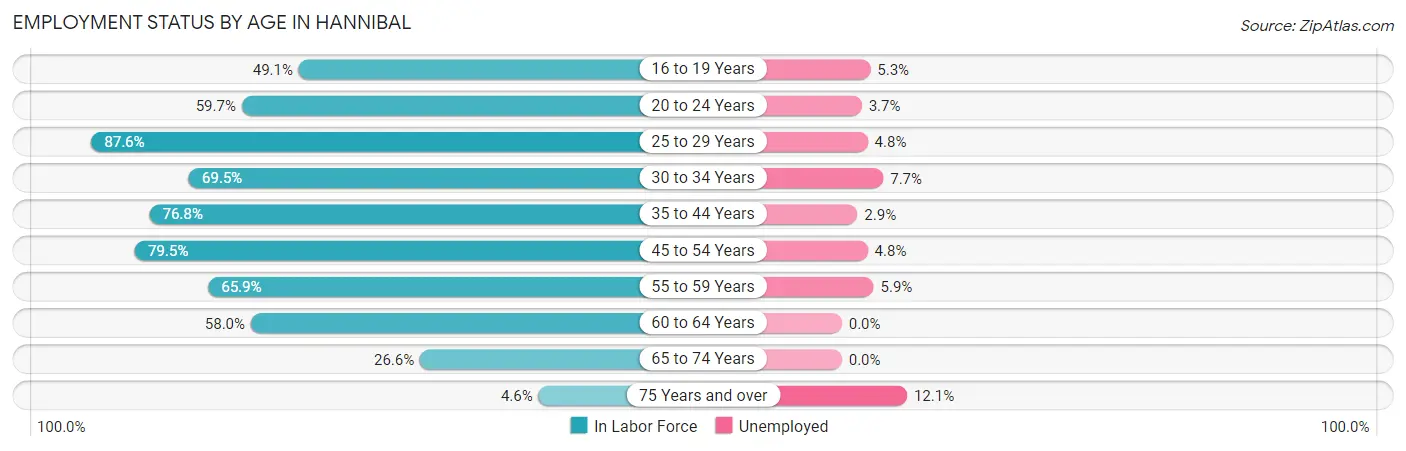
| Age Bracket | In Labor Force | Unemployed |
| 16 to 19 Years | 476 (49.1%) | 25 (5.3%) |
| 20 to 24 Years | 805 (59.7%) | 30 (3.7%) |
| 25 to 29 Years | 950 (87.6%) | 46 (4.8%) |
| 30 to 34 Years | 664 (69.5%) | 51 (7.7%) |
| 35 to 44 Years | 1,466 (76.8%) | 43 (2.9%) |
| 45 to 54 Years | 1,388 (79.5%) | 67 (4.8%) |
| 55 to 59 Years | 612 (65.9%) | 36 (5.9%) |
| 60 to 64 Years | 843 (58.0%) | 0 (0.0%) |
| 65 to 74 Years | 476 (26.6%) | 0 (0.0%) |
| 75 Years and over | 66 (4.6%) | 8 (12.1%) |
| Total | 7,751 (56.9%) | 302 (3.9%) |
Employment Status by Educational Attainment in Hannibal
According to labor force statistics for Hannibal, 73.3% of individuals (5,921) out of the total population between 25 and 64 years of age (8,078) are in the labor force, with 4.1% or 243 of them being unemployed. The group with the highest labor force participation rate are those with the educational attainment of bachelor's degree or higher, with 81.7% or 1,570 individuals in the labor force. Within the labor force, individuals with bachelor's degree or higher education have the highest percentage of unemployment, with 6.6% or 104 of them being unemployed.
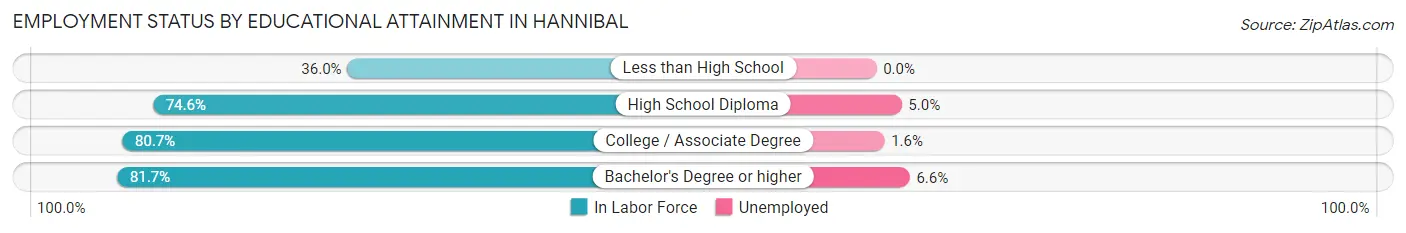
| Educational Attainment | In Labor Force | Unemployed |
| Less than High School | 348 (36.0%) | 0 (0.0%) |
| High School Diploma | 2,223 (74.6%) | 149 (5.0%) |
| College / Associate Degree | 1,782 (80.7%) | 35 (1.6%) |
| Bachelor's Degree or higher | 1,570 (81.7%) | 127 (6.6%) |
| Total | 5,921 (73.3%) | 331 (4.1%) |
Employment Occupations by Sex in Hannibal
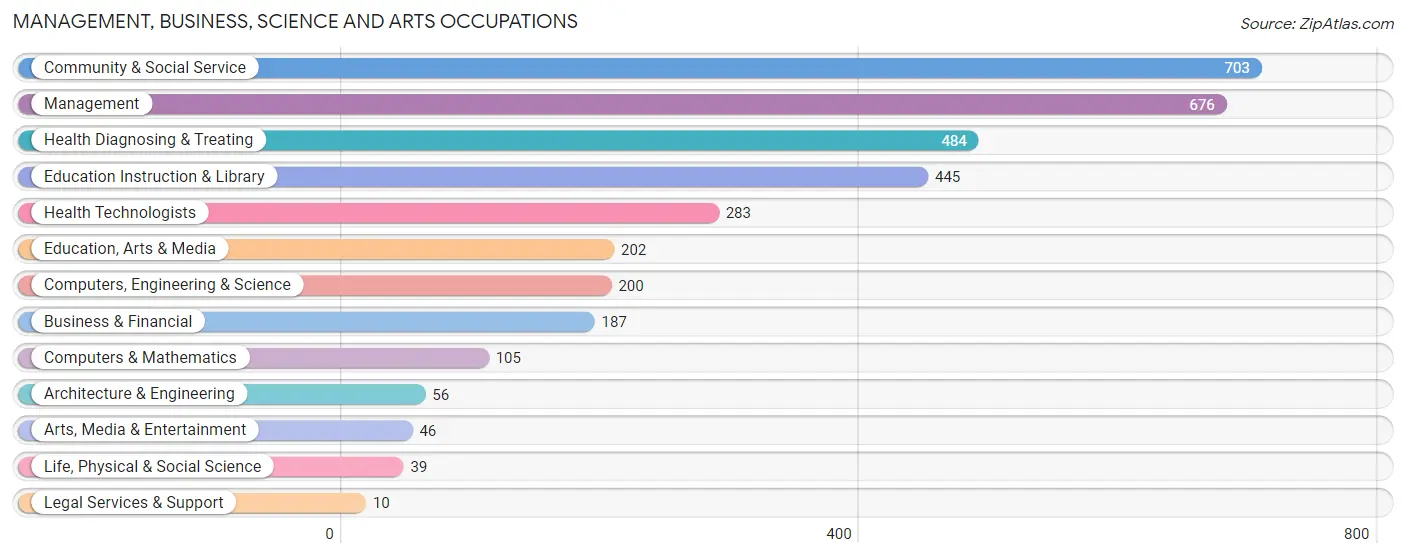
Management, Business, Science and Arts Occupations
The most common Management, Business, Science and Arts occupations in Hannibal are Community & Social Service (703 | 9.5%), Management (676 | 9.1%), Health Diagnosing & Treating (484 | 6.5%), Education Instruction & Library (445 | 6.0%), and Health Technologists (283 | 3.8%).
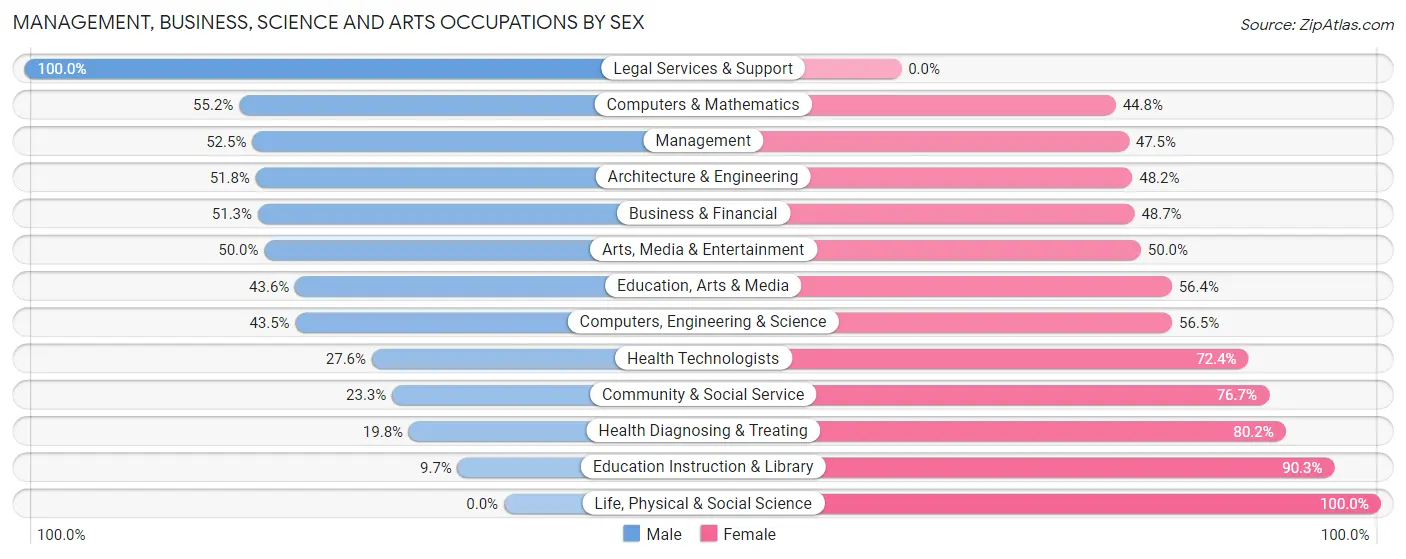
Management, Business, Science and Arts Occupations by Sex
Within the Management, Business, Science and Arts occupations in Hannibal, the most male-oriented occupations are Legal Services & Support (100.0%), Computers & Mathematics (55.2%), and Management (52.5%), while the most female-oriented occupations are Life, Physical & Social Science (100.0%), Education Instruction & Library (90.3%), and Health Diagnosing & Treating (80.2%).
| Occupation | Male | Female |
| Management | 355 (52.5%) | 321 (47.5%) |
| Business & Financial | 96 (51.3%) | 91 (48.7%) |
| Computers, Engineering & Science | 87 (43.5%) | 113 (56.5%) |
| Computers & Mathematics | 58 (55.2%) | 47 (44.8%) |
| Architecture & Engineering | 29 (51.8%) | 27 (48.2%) |
| Life, Physical & Social Science | 0 (0.0%) | 39 (100.0%) |
| Community & Social Service | 164 (23.3%) | 539 (76.7%) |
| Education, Arts & Media | 88 (43.6%) | 114 (56.4%) |
| Legal Services & Support | 10 (100.0%) | 0 (0.0%) |
| Education Instruction & Library | 43 (9.7%) | 402 (90.3%) |
| Arts, Media & Entertainment | 23 (50.0%) | 23 (50.0%) |
| Health Diagnosing & Treating | 96 (19.8%) | 388 (80.2%) |
| Health Technologists | 78 (27.6%) | 205 (72.4%) |
| Total (Category) | 798 (35.5%) | 1,452 (64.5%) |
| Total (Overall) | 3,585 (48.2%) | 3,856 (51.8%) |
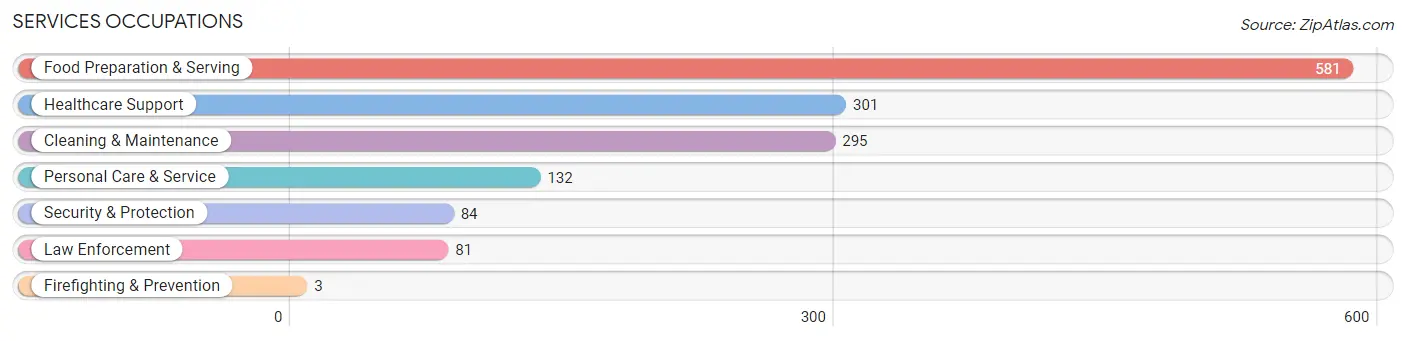
Services Occupations
The most common Services occupations in Hannibal are Food Preparation & Serving (581 | 7.8%), Healthcare Support (301 | 4.1%), Cleaning & Maintenance (295 | 4.0%), Personal Care & Service (132 | 1.8%), and Security & Protection (84 | 1.1%).
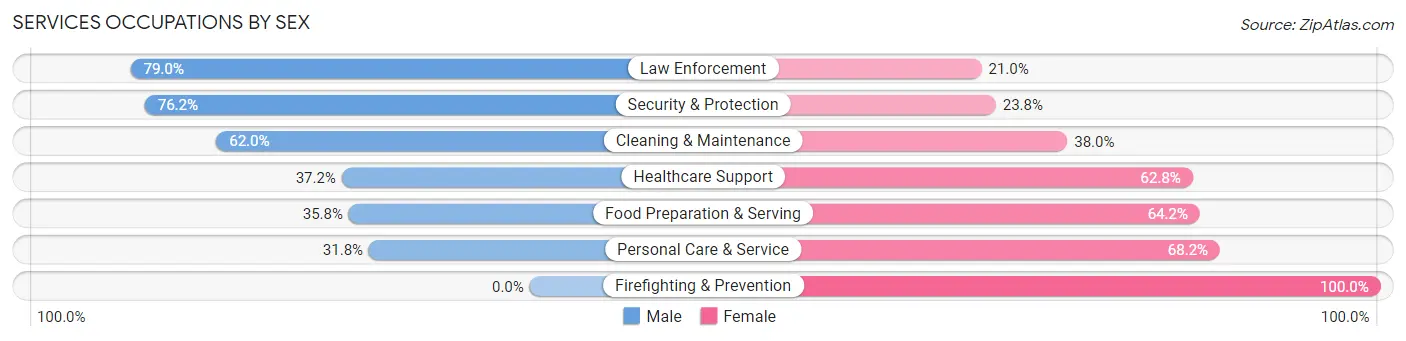
Services Occupations by Sex
Within the Services occupations in Hannibal, the most male-oriented occupations are Law Enforcement (79.0%), Security & Protection (76.2%), and Cleaning & Maintenance (62.0%), while the most female-oriented occupations are Firefighting & Prevention (100.0%), Personal Care & Service (68.2%), and Food Preparation & Serving (64.2%).
| Occupation | Male | Female |
| Healthcare Support | 112 (37.2%) | 189 (62.8%) |
| Security & Protection | 64 (76.2%) | 20 (23.8%) |
| Firefighting & Prevention | 0 (0.0%) | 3 (100.0%) |
| Law Enforcement | 64 (79.0%) | 17 (21.0%) |
| Food Preparation & Serving | 208 (35.8%) | 373 (64.2%) |
| Cleaning & Maintenance | 183 (62.0%) | 112 (38.0%) |
| Personal Care & Service | 42 (31.8%) | 90 (68.2%) |
| Total (Category) | 609 (43.7%) | 784 (56.3%) |
| Total (Overall) | 3,585 (48.2%) | 3,856 (51.8%) |
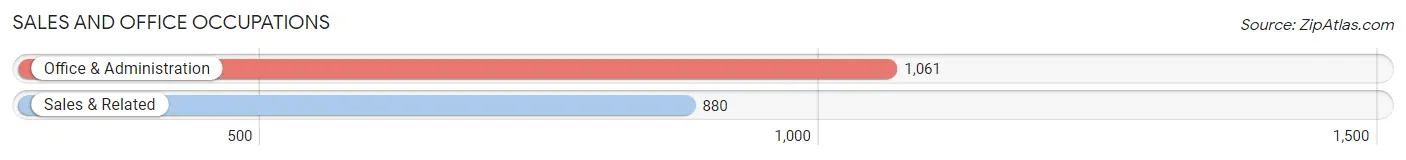
Sales and Office Occupations
The most common Sales and Office occupations in Hannibal are Office & Administration (1,061 | 14.3%), and Sales & Related (880 | 11.8%).
Sales and Office Occupations by Sex
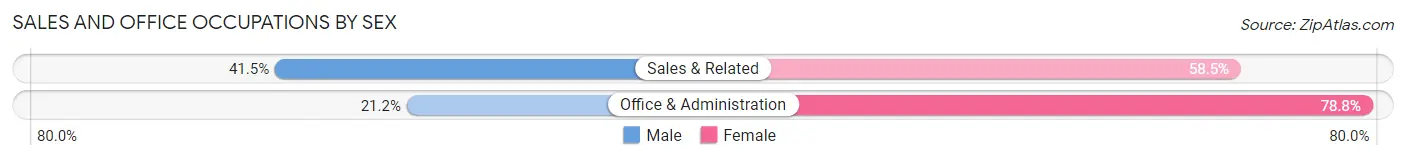
| Occupation | Male | Female |
| Sales & Related | 365 (41.5%) | 515 (58.5%) |
| Office & Administration | 225 (21.2%) | 836 (78.8%) |
| Total (Category) | 590 (30.4%) | 1,351 (69.6%) |
| Total (Overall) | 3,585 (48.2%) | 3,856 (51.8%) |
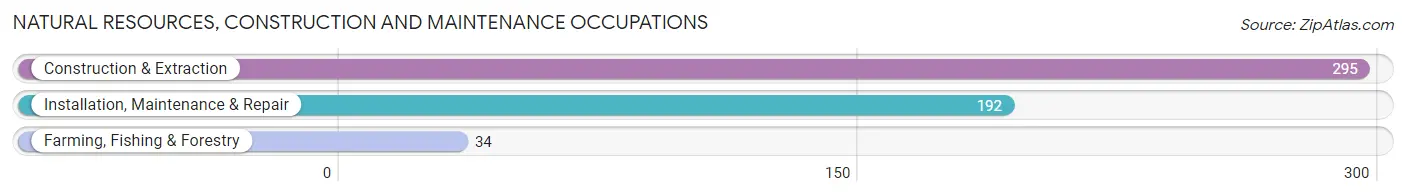
Natural Resources, Construction and Maintenance Occupations
The most common Natural Resources, Construction and Maintenance occupations in Hannibal are Construction & Extraction (295 | 4.0%), Installation, Maintenance & Repair (192 | 2.6%), and Farming, Fishing & Forestry (34 | 0.5%).
Natural Resources, Construction and Maintenance Occupations by Sex
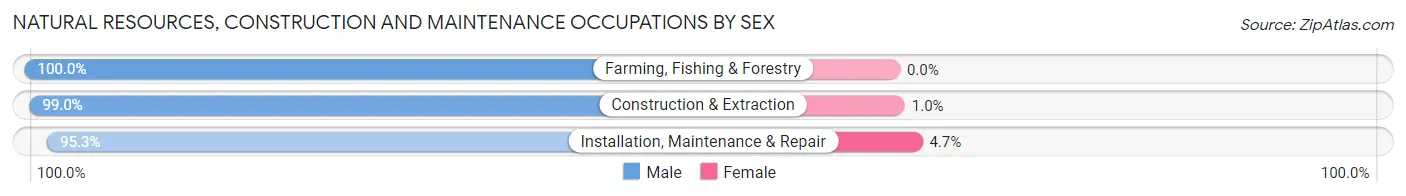
| Occupation | Male | Female |
| Farming, Fishing & Forestry | 34 (100.0%) | 0 (0.0%) |
| Construction & Extraction | 292 (99.0%) | 3 (1.0%) |
| Installation, Maintenance & Repair | 183 (95.3%) | 9 (4.7%) |
| Total (Category) | 509 (97.7%) | 12 (2.3%) |
| Total (Overall) | 3,585 (48.2%) | 3,856 (51.8%) |
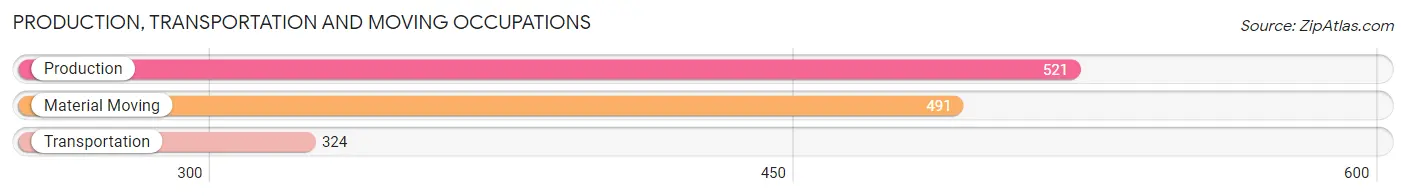
Production, Transportation and Moving Occupations
The most common Production, Transportation and Moving occupations in Hannibal are Production (521 | 7.0%), Material Moving (491 | 6.6%), and Transportation (324 | 4.3%).
Production, Transportation and Moving Occupations by Sex
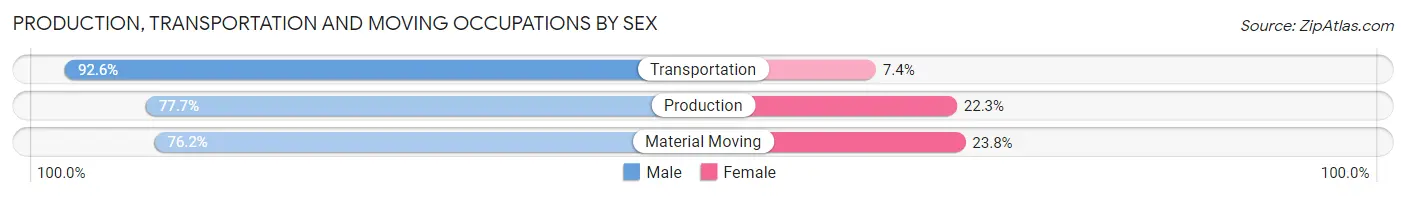
| Occupation | Male | Female |
| Production | 405 (77.7%) | 116 (22.3%) |
| Transportation | 300 (92.6%) | 24 (7.4%) |
| Material Moving | 374 (76.2%) | 117 (23.8%) |
| Total (Category) | 1,079 (80.8%) | 257 (19.2%) |
| Total (Overall) | 3,585 (48.2%) | 3,856 (51.8%) |
Employment Industries by Sex in Hannibal
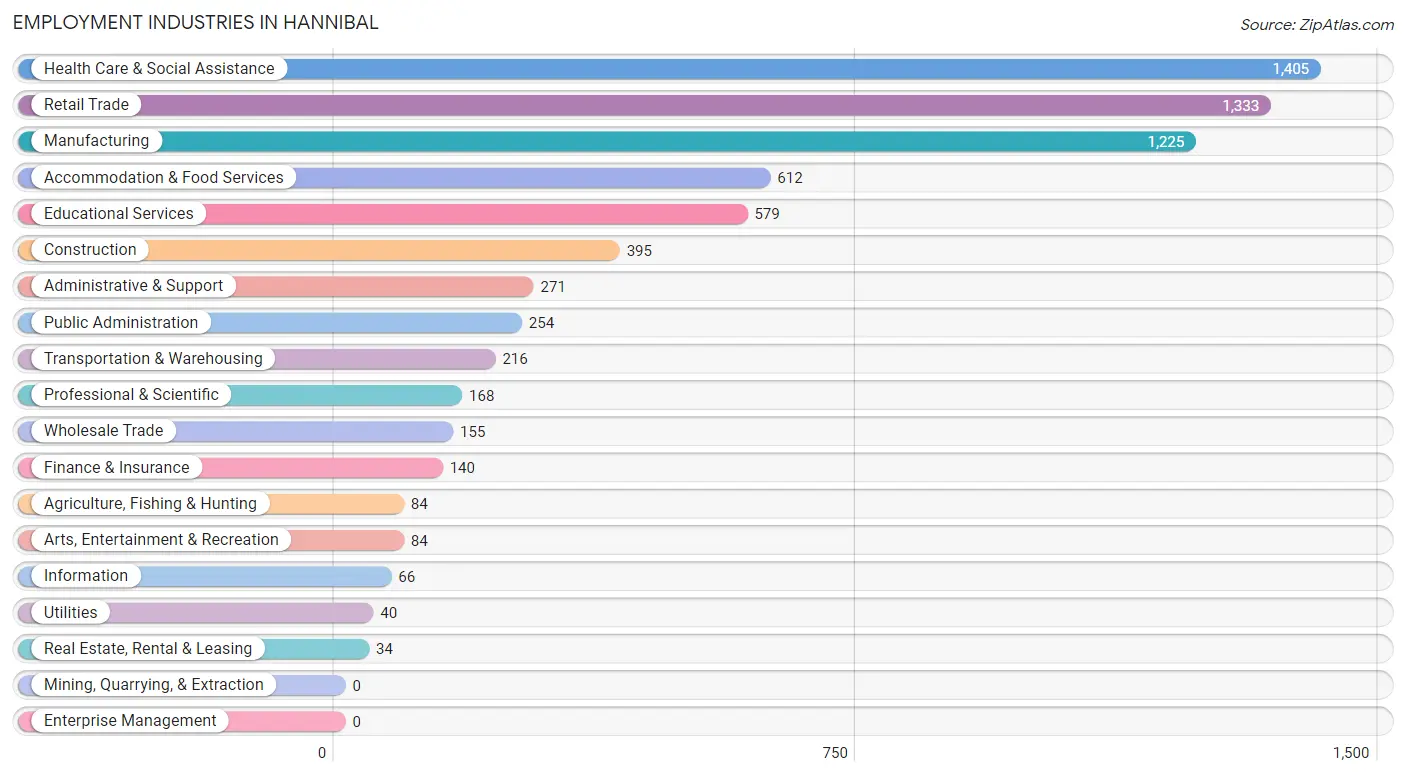
Employment Industries in Hannibal
The major employment industries in Hannibal include Health Care & Social Assistance (1,405 | 18.9%), Retail Trade (1,333 | 17.9%), Manufacturing (1,225 | 16.5%), Accommodation & Food Services (612 | 8.2%), and Educational Services (579 | 7.8%).
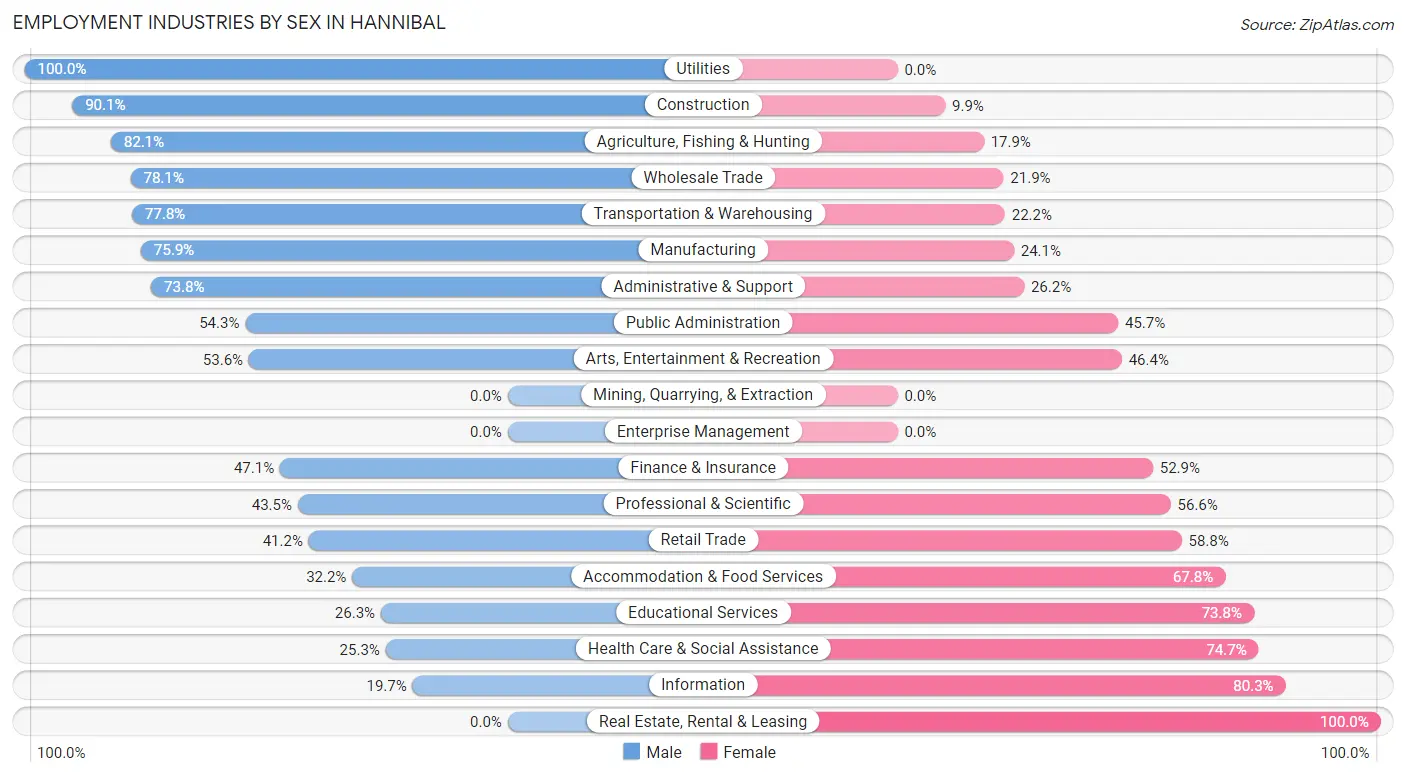
Employment Industries by Sex in Hannibal
The Hannibal industries that see more men than women are Utilities (100.0%), Construction (90.1%), and Agriculture, Fishing & Hunting (82.1%), whereas the industries that tend to have a higher number of women are Real Estate, Rental & Leasing (100.0%), Information (80.3%), and Health Care & Social Assistance (74.7%).
| Industry | Male | Female |
| Agriculture, Fishing & Hunting | 69 (82.1%) | 15 (17.9%) |
| Mining, Quarrying, & Extraction | 0 (0.0%) | 0 (0.0%) |
| Construction | 356 (90.1%) | 39 (9.9%) |
| Manufacturing | 930 (75.9%) | 295 (24.1%) |
| Wholesale Trade | 121 (78.1%) | 34 (21.9%) |
| Retail Trade | 549 (41.2%) | 784 (58.8%) |
| Transportation & Warehousing | 168 (77.8%) | 48 (22.2%) |
| Utilities | 40 (100.0%) | 0 (0.0%) |
| Information | 13 (19.7%) | 53 (80.3%) |
| Finance & Insurance | 66 (47.1%) | 74 (52.9%) |
| Real Estate, Rental & Leasing | 0 (0.0%) | 34 (100.0%) |
| Professional & Scientific | 73 (43.4%) | 95 (56.6%) |
| Enterprise Management | 0 (0.0%) | 0 (0.0%) |
| Administrative & Support | 200 (73.8%) | 71 (26.2%) |
| Educational Services | 152 (26.3%) | 427 (73.8%) |
| Health Care & Social Assistance | 355 (25.3%) | 1,050 (74.7%) |
| Arts, Entertainment & Recreation | 45 (53.6%) | 39 (46.4%) |
| Accommodation & Food Services | 197 (32.2%) | 415 (67.8%) |
| Public Administration | 138 (54.3%) | 116 (45.7%) |
| Total | 3,585 (48.2%) | 3,856 (51.8%) |
Education in Hannibal
School Enrollment in Hannibal
The most common levels of schooling among the 3,859 students in Hannibal are college / undergraduate (931 | 24.1%), elementary school (904 | 23.4%), and middle school (833 | 21.6%).
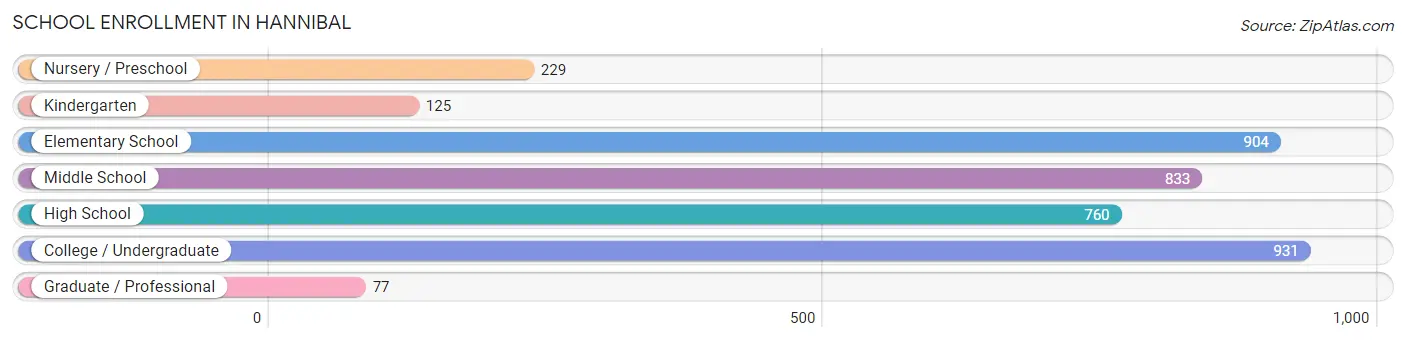
| School Level | # Students | % Students |
| Nursery / Preschool | 229 | 5.9% |
| Kindergarten | 125 | 3.2% |
| Elementary School | 904 | 23.4% |
| Middle School | 833 | 21.6% |
| High School | 760 | 19.7% |
| College / Undergraduate | 931 | 24.1% |
| Graduate / Professional | 77 | 2.0% |
| Total | 3,859 | 100.0% |
School Enrollment by Age by Funding Source in Hannibal
Out of a total of 3,859 students who are enrolled in schools in Hannibal, 915 (23.7%) attend a private institution, while the remaining 2,944 (76.3%) are enrolled in public schools. The age group of 20 to 24 year olds has the highest likelihood of being enrolled in private schools, with 429 (74.2% in the age bracket) enrolled. Conversely, the age group of 10 to 14 year olds has the lowest likelihood of being enrolled in a private school, with 1,080 (98.0% in the age bracket) attending a public institution.
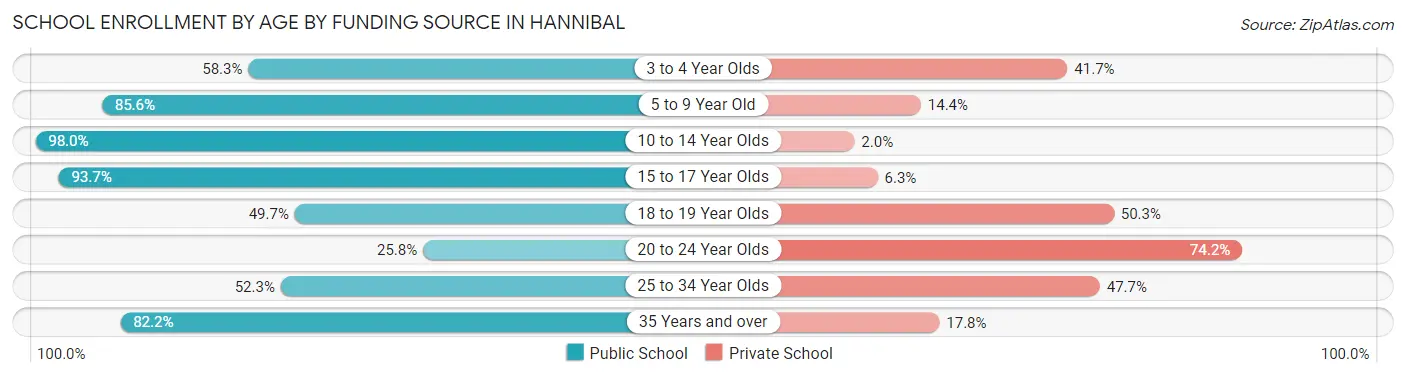
| Age Bracket | Public School | Private School |
| 3 to 4 Year Olds | 98 (58.3%) | 70 (41.7%) |
| 5 to 9 Year Old | 774 (85.6%) | 130 (14.4%) |
| 10 to 14 Year Olds | 1,080 (98.0%) | 22 (2.0%) |
| 15 to 17 Year Olds | 548 (93.7%) | 37 (6.3%) |
| 18 to 19 Year Olds | 155 (49.7%) | 157 (50.3%) |
| 20 to 24 Year Olds | 149 (25.8%) | 429 (74.2%) |
| 25 to 34 Year Olds | 57 (52.3%) | 52 (47.7%) |
| 35 Years and over | 83 (82.2%) | 18 (17.8%) |
| Total | 2,944 (76.3%) | 915 (23.7%) |
Educational Attainment by Field of Study in Hannibal
Business (663 | 24.5%), education (419 | 15.5%), arts & humanities (288 | 10.6%), science & technology (248 | 9.2%), and bio, nature & agricultural (162 | 6.0%) are the most common fields of study among 2,708 individuals in Hannibal who have obtained a bachelor's degree or higher.
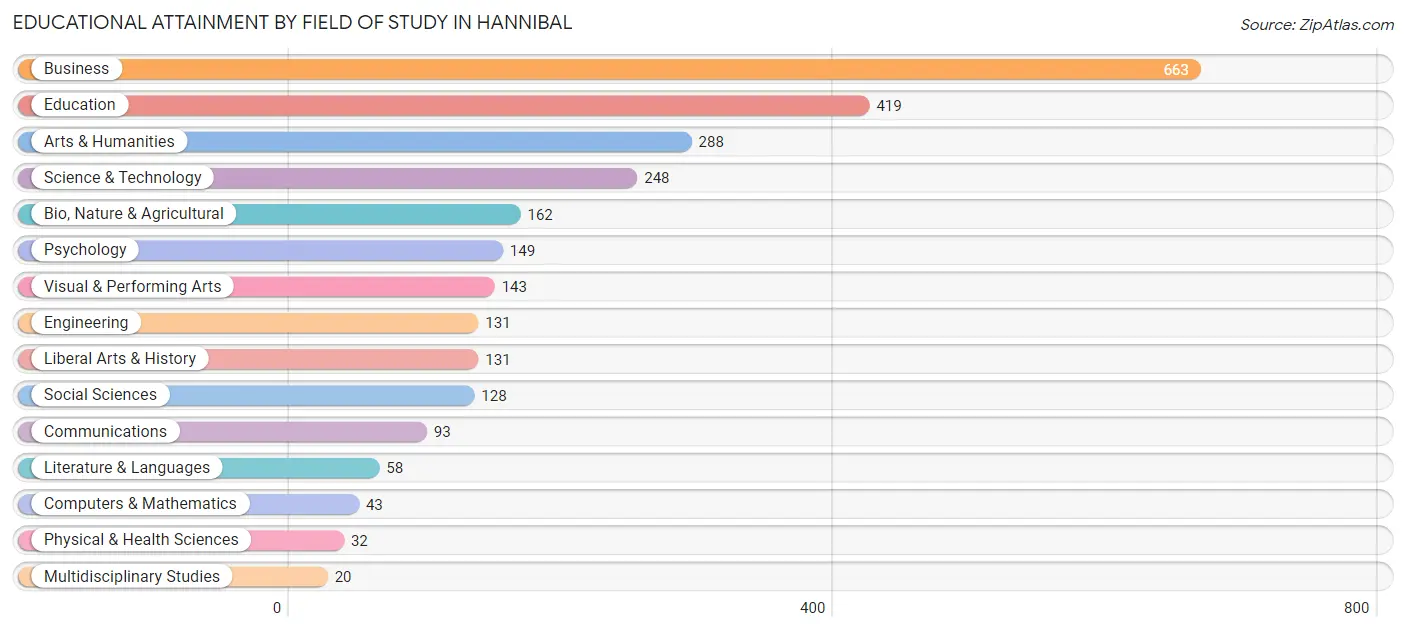
| Field of Study | # Graduates | % Graduates |
| Computers & Mathematics | 43 | 1.6% |
| Bio, Nature & Agricultural | 162 | 6.0% |
| Physical & Health Sciences | 32 | 1.2% |
| Psychology | 149 | 5.5% |
| Social Sciences | 128 | 4.7% |
| Engineering | 131 | 4.8% |
| Multidisciplinary Studies | 20 | 0.7% |
| Science & Technology | 248 | 9.2% |
| Business | 663 | 24.5% |
| Education | 419 | 15.5% |
| Literature & Languages | 58 | 2.1% |
| Liberal Arts & History | 131 | 4.8% |
| Visual & Performing Arts | 143 | 5.3% |
| Communications | 93 | 3.4% |
| Arts & Humanities | 288 | 10.6% |
| Total | 2,708 | 100.0% |
Transportation & Commute in Hannibal
Vehicle Availability by Sex in Hannibal
The most prevalent vehicle ownership categories in Hannibal are males with 2 vehicles (1,675, accounting for 48.5%) and females with 2 vehicles (1,625, making up 46.9%).
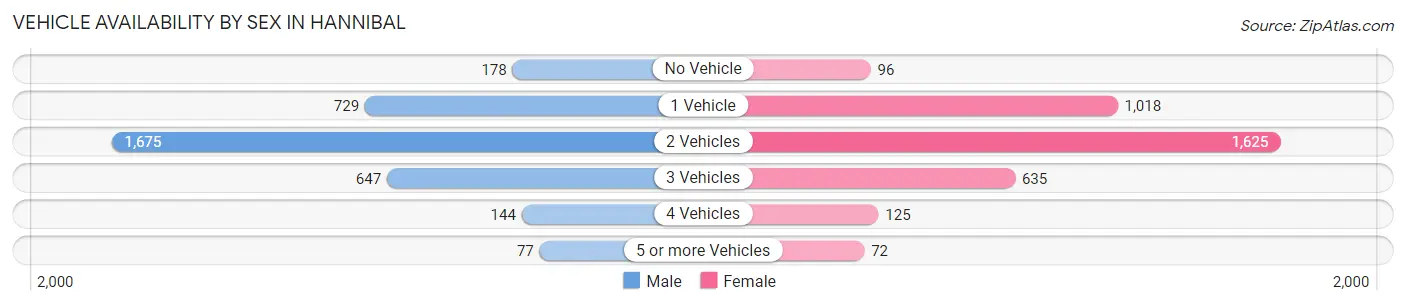
| Vehicles Available | Male | Female |
| No Vehicle | 178 (5.2%) | 96 (2.7%) |
| 1 Vehicle | 729 (21.1%) | 1,018 (28.5%) |
| 2 Vehicles | 1,675 (48.5%) | 1,625 (45.5%) |
| 3 Vehicles | 647 (18.8%) | 635 (17.8%) |
| 4 Vehicles | 144 (4.2%) | 125 (3.5%) |
| 5 or more Vehicles | 77 (2.2%) | 72 (2.0%) |
| Total | 3,450 (100.0%) | 3,571 (100.0%) |
Commute Time in Hannibal
The most frequently occuring commute durations in Hannibal are 10 to 14 minutes (2,124 commuters, 30.6%), 5 to 9 minutes (1,674 commuters, 24.1%), and 15 to 19 minutes (923 commuters, 13.3%).
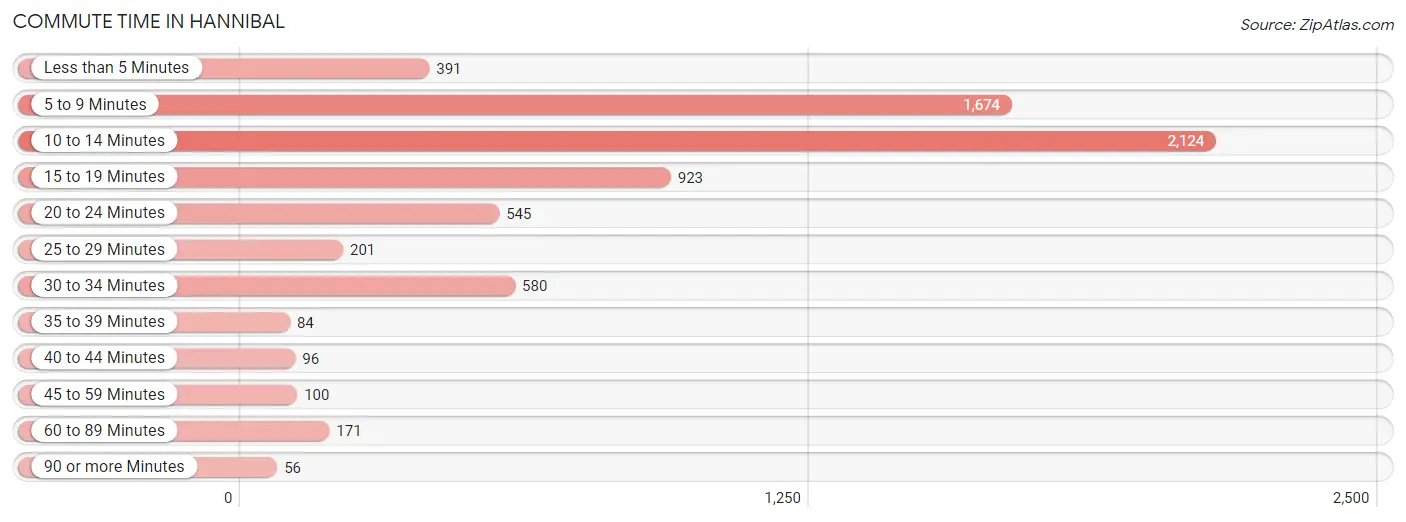
| Commute Time | # Commuters | % Commuters |
| Less than 5 Minutes | 391 | 5.6% |
| 5 to 9 Minutes | 1,674 | 24.1% |
| 10 to 14 Minutes | 2,124 | 30.6% |
| 15 to 19 Minutes | 923 | 13.3% |
| 20 to 24 Minutes | 545 | 7.9% |
| 25 to 29 Minutes | 201 | 2.9% |
| 30 to 34 Minutes | 580 | 8.4% |
| 35 to 39 Minutes | 84 | 1.2% |
| 40 to 44 Minutes | 96 | 1.4% |
| 45 to 59 Minutes | 100 | 1.4% |
| 60 to 89 Minutes | 171 | 2.5% |
| 90 or more Minutes | 56 | 0.8% |
Commute Time by Sex in Hannibal
The most common commute times in Hannibal are 10 to 14 minutes (905 commuters, 26.7%) for males and 10 to 14 minutes (1,219 commuters, 34.3%) for females.
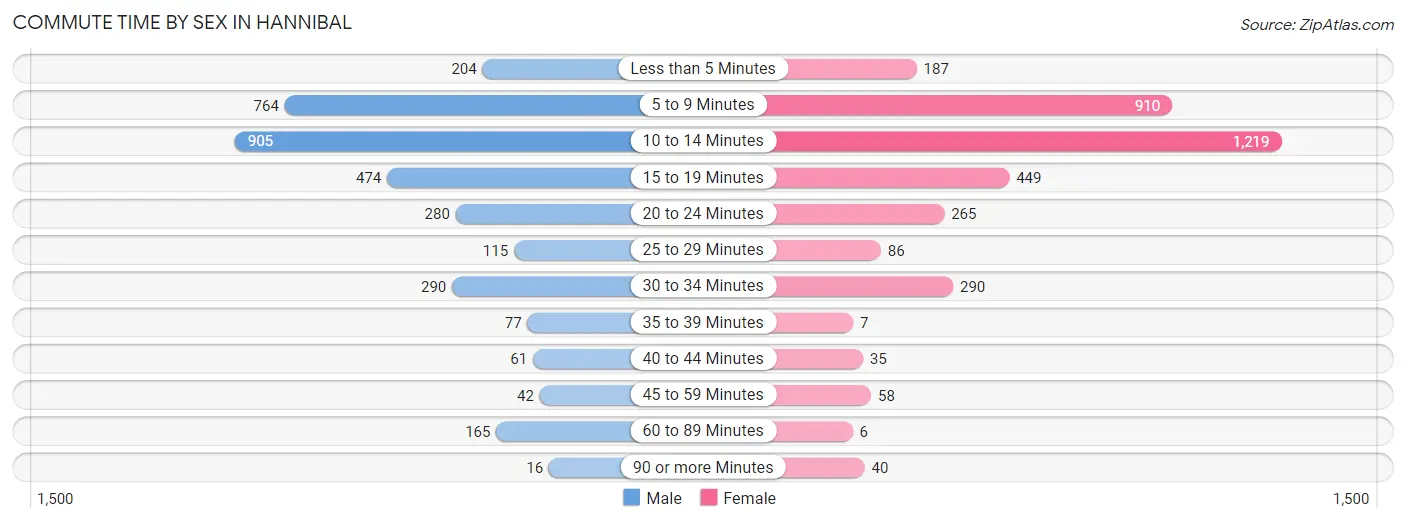
| Commute Time | Male | Female |
| Less than 5 Minutes | 204 (6.0%) | 187 (5.3%) |
| 5 to 9 Minutes | 764 (22.5%) | 910 (25.6%) |
| 10 to 14 Minutes | 905 (26.7%) | 1,219 (34.3%) |
| 15 to 19 Minutes | 474 (14.0%) | 449 (12.6%) |
| 20 to 24 Minutes | 280 (8.3%) | 265 (7.5%) |
| 25 to 29 Minutes | 115 (3.4%) | 86 (2.4%) |
| 30 to 34 Minutes | 290 (8.6%) | 290 (8.2%) |
| 35 to 39 Minutes | 77 (2.3%) | 7 (0.2%) |
| 40 to 44 Minutes | 61 (1.8%) | 35 (1.0%) |
| 45 to 59 Minutes | 42 (1.2%) | 58 (1.6%) |
| 60 to 89 Minutes | 165 (4.9%) | 6 (0.2%) |
| 90 or more Minutes | 16 (0.5%) | 40 (1.1%) |
Time of Departure to Work by Sex in Hannibal
The most frequent times of departure to work in Hannibal are 7:30 AM to 7:59 AM (664, 19.6%) for males and 7:30 AM to 7:59 AM (803, 22.6%) for females.
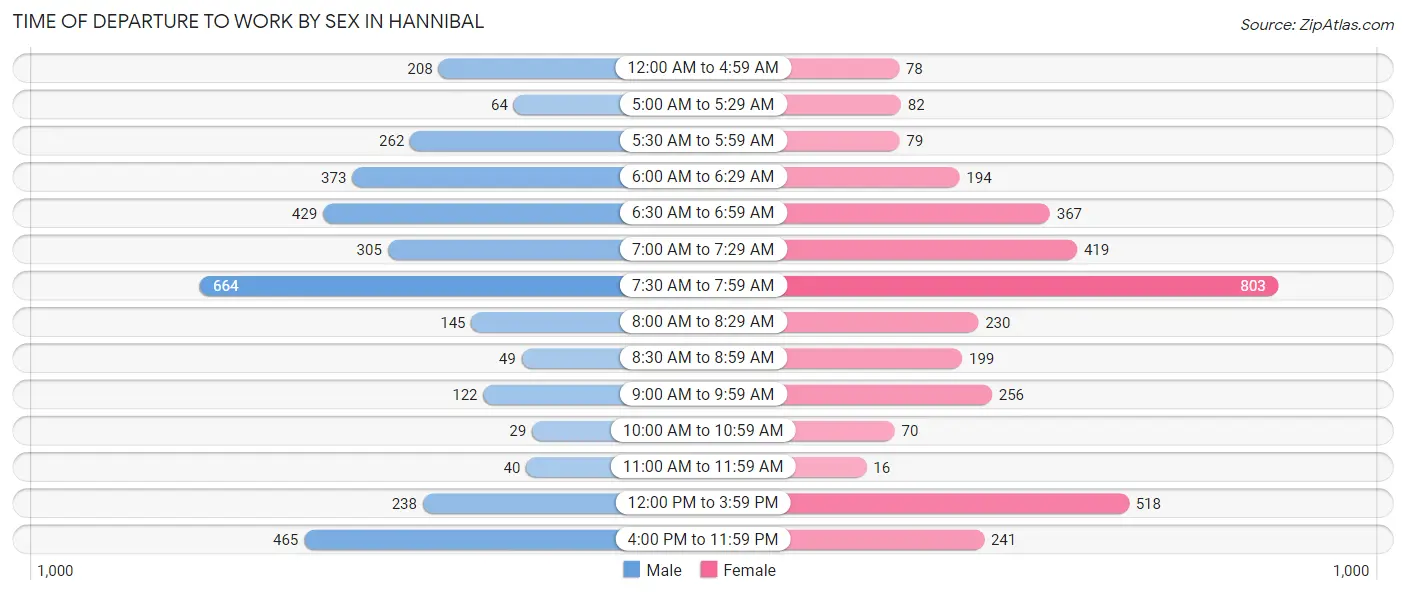
| Time of Departure | Male | Female |
| 12:00 AM to 4:59 AM | 208 (6.1%) | 78 (2.2%) |
| 5:00 AM to 5:29 AM | 64 (1.9%) | 82 (2.3%) |
| 5:30 AM to 5:59 AM | 262 (7.7%) | 79 (2.2%) |
| 6:00 AM to 6:29 AM | 373 (11.0%) | 194 (5.5%) |
| 6:30 AM to 6:59 AM | 429 (12.6%) | 367 (10.3%) |
| 7:00 AM to 7:29 AM | 305 (9.0%) | 419 (11.8%) |
| 7:30 AM to 7:59 AM | 664 (19.6%) | 803 (22.6%) |
| 8:00 AM to 8:29 AM | 145 (4.3%) | 230 (6.5%) |
| 8:30 AM to 8:59 AM | 49 (1.4%) | 199 (5.6%) |
| 9:00 AM to 9:59 AM | 122 (3.6%) | 256 (7.2%) |
| 10:00 AM to 10:59 AM | 29 (0.9%) | 70 (2.0%) |
| 11:00 AM to 11:59 AM | 40 (1.2%) | 16 (0.4%) |
| 12:00 PM to 3:59 PM | 238 (7.0%) | 518 (14.6%) |
| 4:00 PM to 11:59 PM | 465 (13.7%) | 241 (6.8%) |
| Total | 3,393 (100.0%) | 3,552 (100.0%) |
Housing Occupancy in Hannibal
Occupancy by Ownership in Hannibal
Of the total 6,810 dwellings in Hannibal, owner-occupied units account for 4,210 (61.8%), while renter-occupied units make up 2,600 (38.2%).
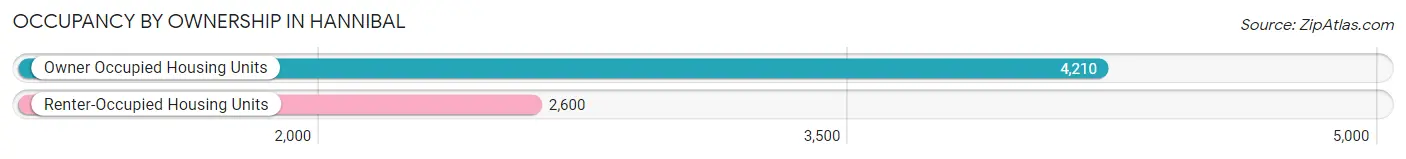
| Occupancy | # Housing Units | % Housing Units |
| Owner Occupied Housing Units | 4,210 | 61.8% |
| Renter-Occupied Housing Units | 2,600 | 38.2% |
| Total Occupied Housing Units | 6,810 | 100.0% |
Occupancy by Household Size in Hannibal
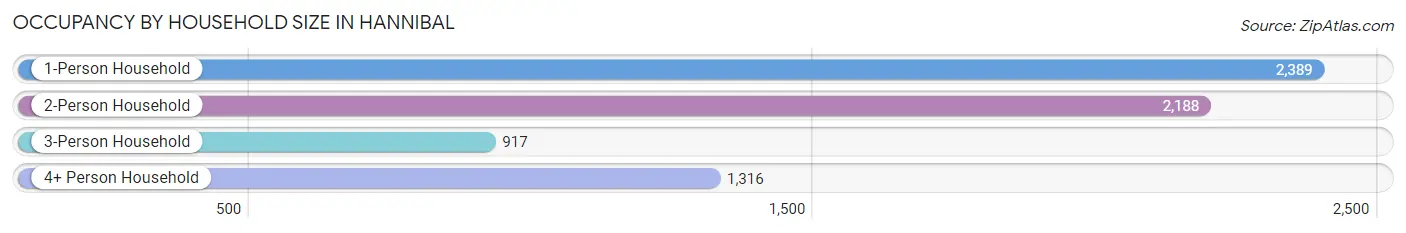
| Household Size | # Housing Units | % Housing Units |
| 1-Person Household | 2,389 | 35.1% |
| 2-Person Household | 2,188 | 32.1% |
| 3-Person Household | 917 | 13.5% |
| 4+ Person Household | 1,316 | 19.3% |
| Total Housing Units | 6,810 | 100.0% |
Occupancy by Ownership by Household Size in Hannibal
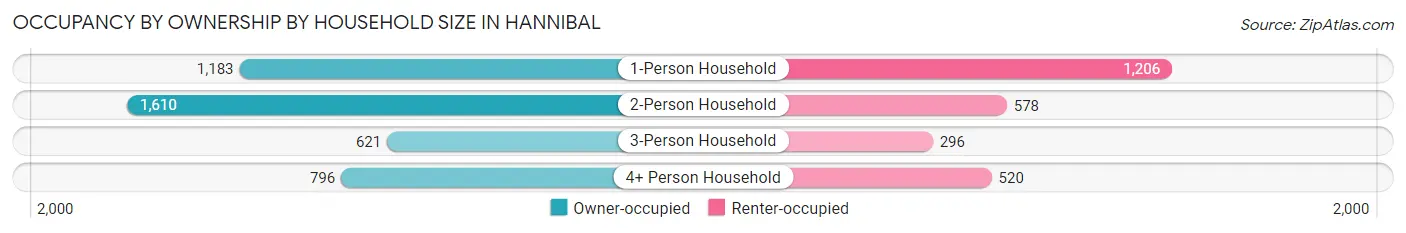
| Household Size | Owner-occupied | Renter-occupied |
| 1-Person Household | 1,183 (49.5%) | 1,206 (50.5%) |
| 2-Person Household | 1,610 (73.6%) | 578 (26.4%) |
| 3-Person Household | 621 (67.7%) | 296 (32.3%) |
| 4+ Person Household | 796 (60.5%) | 520 (39.5%) |
| Total Housing Units | 4,210 (61.8%) | 2,600 (38.2%) |
Occupancy by Educational Attainment in Hannibal
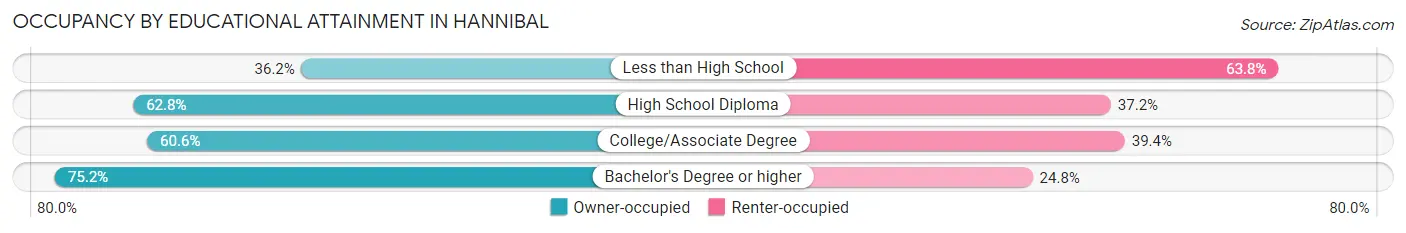
| Household Size | Owner-occupied | Renter-occupied |
| Less than High School | 280 (36.2%) | 493 (63.8%) |
| High School Diploma | 1,605 (62.8%) | 952 (37.2%) |
| College/Associate Degree | 1,207 (60.6%) | 786 (39.4%) |
| Bachelor's Degree or higher | 1,118 (75.2%) | 369 (24.8%) |
Occupancy by Age of Householder in Hannibal
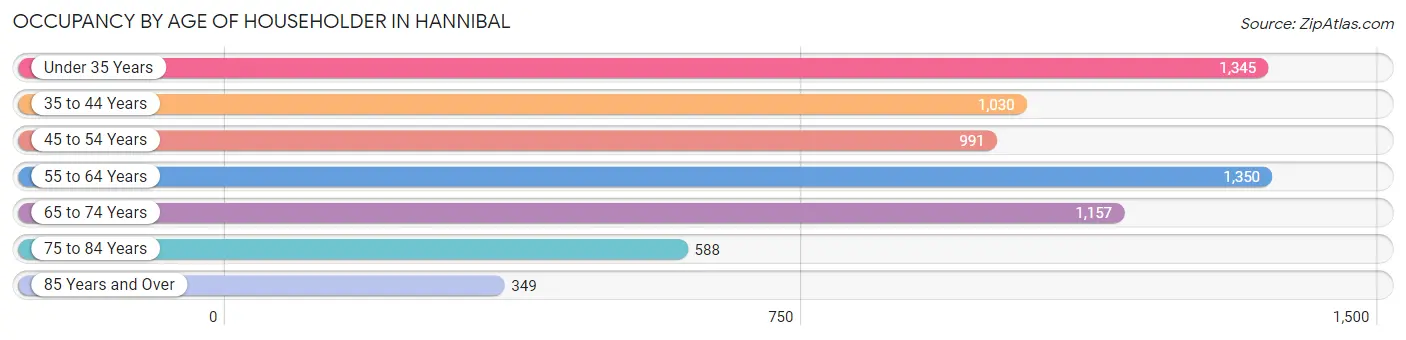
| Age Bracket | # Households | % Households |
| Under 35 Years | 1,345 | 19.8% |
| 35 to 44 Years | 1,030 | 15.1% |
| 45 to 54 Years | 991 | 14.5% |
| 55 to 64 Years | 1,350 | 19.8% |
| 65 to 74 Years | 1,157 | 17.0% |
| 75 to 84 Years | 588 | 8.6% |
| 85 Years and Over | 349 | 5.1% |
| Total | 6,810 | 100.0% |
Housing Finances in Hannibal
Median Income by Occupancy in Hannibal
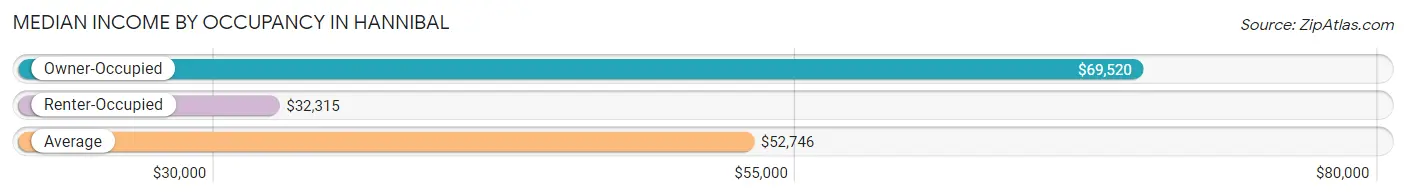
| Occupancy Type | # Households | Median Income |
| Owner-Occupied | 4,210 (61.8%) | $69,520 |
| Renter-Occupied | 2,600 (38.2%) | $32,315 |
| Average | 6,810 (100.0%) | $52,746 |
Occupancy by Householder Income Bracket in Hannibal
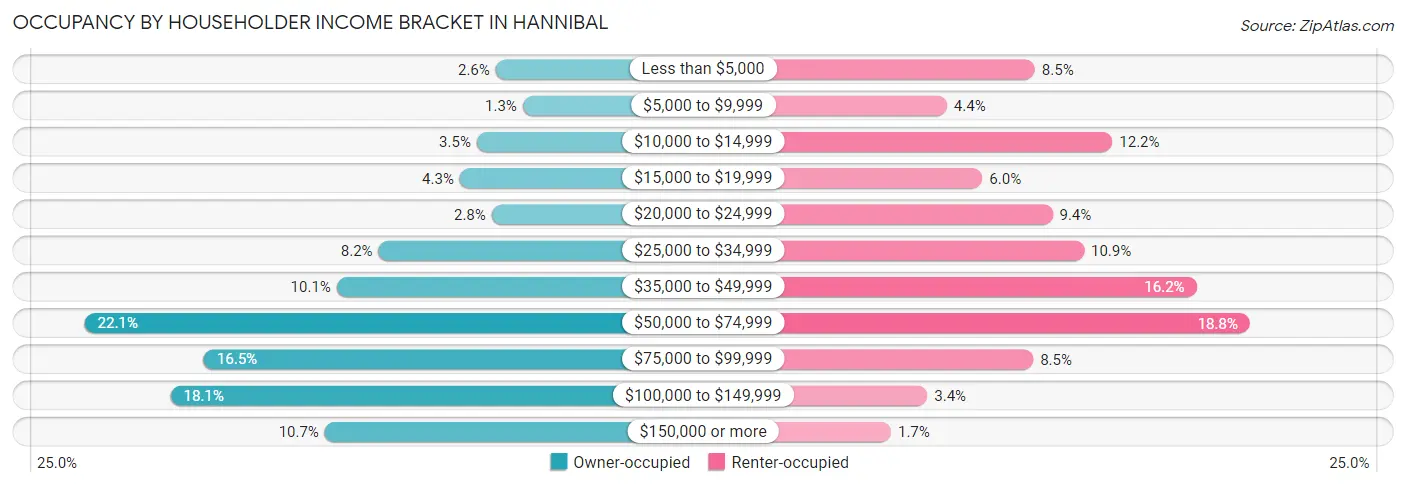
| Income Bracket | Owner-occupied | Renter-occupied |
| Less than $5,000 | 108 (2.6%) | 222 (8.5%) |
| $5,000 to $9,999 | 54 (1.3%) | 113 (4.3%) |
| $10,000 to $14,999 | 146 (3.5%) | 318 (12.2%) |
| $15,000 to $19,999 | 180 (4.3%) | 157 (6.0%) |
| $20,000 to $24,999 | 116 (2.8%) | 244 (9.4%) |
| $25,000 to $34,999 | 343 (8.2%) | 283 (10.9%) |
| $35,000 to $49,999 | 427 (10.1%) | 422 (16.2%) |
| $50,000 to $74,999 | 932 (22.1%) | 488 (18.8%) |
| $75,000 to $99,999 | 693 (16.5%) | 220 (8.5%) |
| $100,000 to $149,999 | 760 (18.0%) | 89 (3.4%) |
| $150,000 or more | 451 (10.7%) | 44 (1.7%) |
| Total | 4,210 (100.0%) | 2,600 (100.0%) |
Monthly Housing Cost Tiers in Hannibal
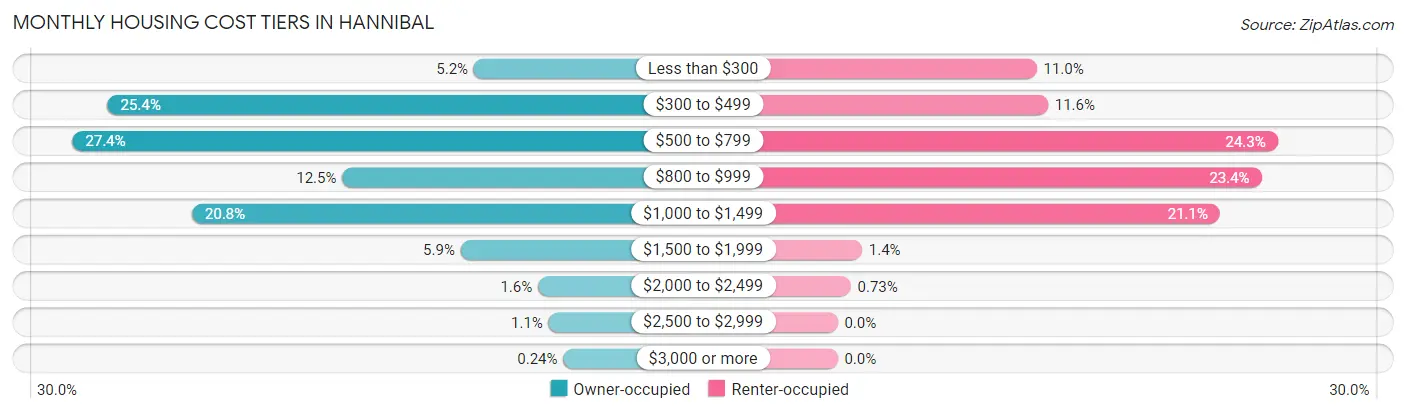
| Monthly Cost | Owner-occupied | Renter-occupied |
| Less than $300 | 218 (5.2%) | 286 (11.0%) |
| $300 to $499 | 1,070 (25.4%) | 302 (11.6%) |
| $500 to $799 | 1,152 (27.4%) | 632 (24.3%) |
| $800 to $999 | 524 (12.4%) | 609 (23.4%) |
| $1,000 to $1,499 | 874 (20.8%) | 549 (21.1%) |
| $1,500 to $1,999 | 249 (5.9%) | 35 (1.3%) |
| $2,000 to $2,499 | 69 (1.6%) | 19 (0.7%) |
| $2,500 to $2,999 | 44 (1.1%) | 0 (0.0%) |
| $3,000 or more | 10 (0.2%) | 0 (0.0%) |
| Total | 4,210 (100.0%) | 2,600 (100.0%) |
Physical Housing Characteristics in Hannibal
Housing Structures in Hannibal
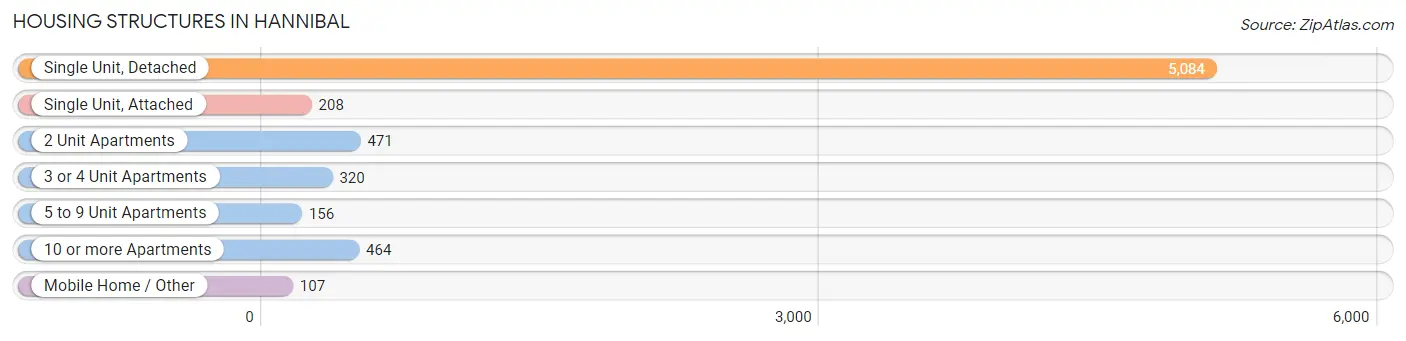
| Structure Type | # Housing Units | % Housing Units |
| Single Unit, Detached | 5,084 | 74.7% |
| Single Unit, Attached | 208 | 3.0% |
| 2 Unit Apartments | 471 | 6.9% |
| 3 or 4 Unit Apartments | 320 | 4.7% |
| 5 to 9 Unit Apartments | 156 | 2.3% |
| 10 or more Apartments | 464 | 6.8% |
| Mobile Home / Other | 107 | 1.6% |
| Total | 6,810 | 100.0% |
Housing Structures by Occupancy in Hannibal
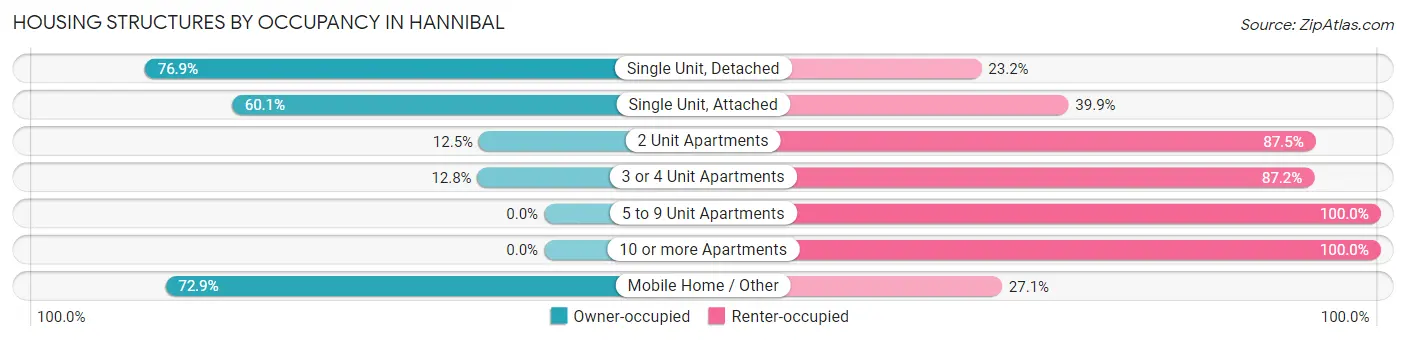
| Structure Type | Owner-occupied | Renter-occupied |
| Single Unit, Detached | 3,907 (76.8%) | 1,177 (23.2%) |
| Single Unit, Attached | 125 (60.1%) | 83 (39.9%) |
| 2 Unit Apartments | 59 (12.5%) | 412 (87.5%) |
| 3 or 4 Unit Apartments | 41 (12.8%) | 279 (87.2%) |
| 5 to 9 Unit Apartments | 0 (0.0%) | 156 (100.0%) |
| 10 or more Apartments | 0 (0.0%) | 464 (100.0%) |
| Mobile Home / Other | 78 (72.9%) | 29 (27.1%) |
| Total | 4,210 (61.8%) | 2,600 (38.2%) |
Housing Structures by Number of Rooms in Hannibal
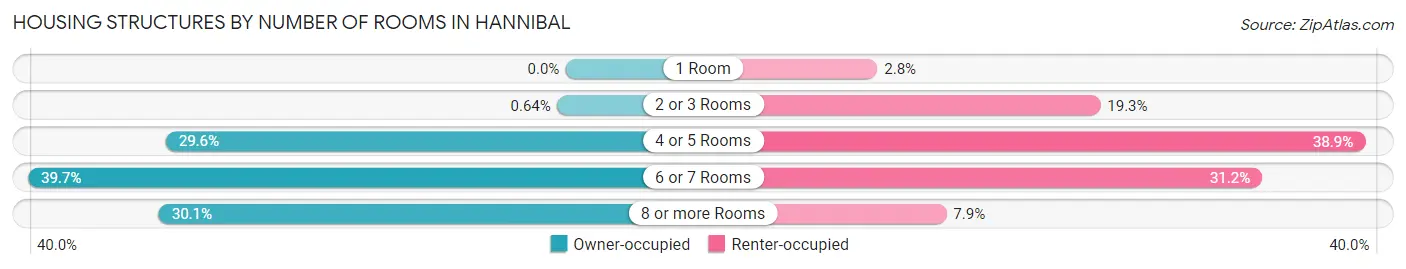
| Number of Rooms | Owner-occupied | Renter-occupied |
| 1 Room | 0 (0.0%) | 72 (2.8%) |
| 2 or 3 Rooms | 27 (0.6%) | 501 (19.3%) |
| 4 or 5 Rooms | 1,244 (29.5%) | 1,010 (38.9%) |
| 6 or 7 Rooms | 1,673 (39.7%) | 812 (31.2%) |
| 8 or more Rooms | 1,266 (30.1%) | 205 (7.9%) |
| Total | 4,210 (100.0%) | 2,600 (100.0%) |
Housing Structure by Heating Type in Hannibal
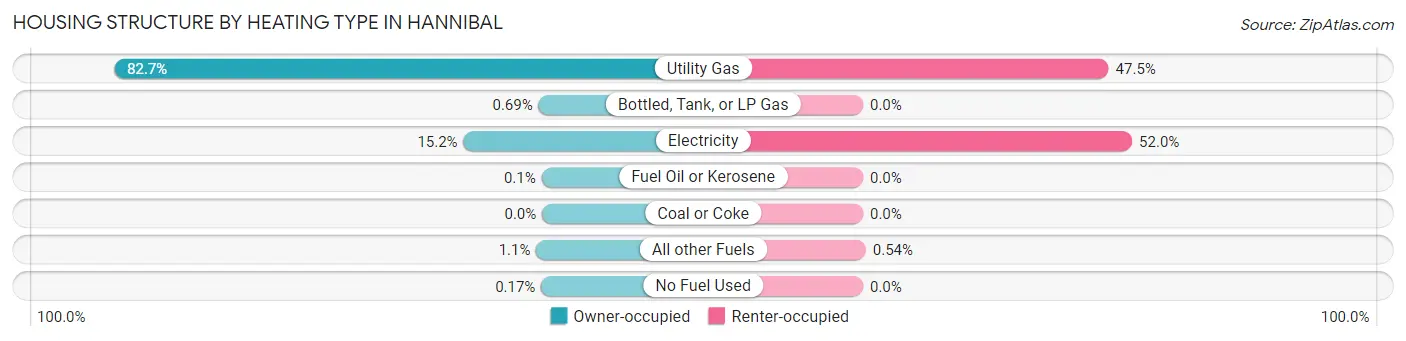
| Heating Type | Owner-occupied | Renter-occupied |
| Utility Gas | 3,483 (82.7%) | 1,234 (47.5%) |
| Bottled, Tank, or LP Gas | 29 (0.7%) | 0 (0.0%) |
| Electricity | 640 (15.2%) | 1,352 (52.0%) |
| Fuel Oil or Kerosene | 4 (0.1%) | 0 (0.0%) |
| Coal or Coke | 0 (0.0%) | 0 (0.0%) |
| All other Fuels | 47 (1.1%) | 14 (0.5%) |
| No Fuel Used | 7 (0.2%) | 0 (0.0%) |
| Total | 4,210 (100.0%) | 2,600 (100.0%) |
Household Vehicle Usage in Hannibal
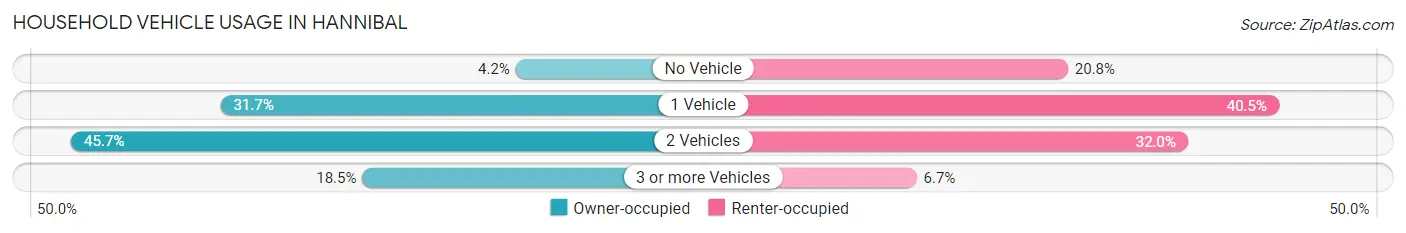
| Vehicles per Household | Owner-occupied | Renter-occupied |
| No Vehicle | 175 (4.2%) | 541 (20.8%) |
| 1 Vehicle | 1,335 (31.7%) | 1,053 (40.5%) |
| 2 Vehicles | 1,922 (45.7%) | 832 (32.0%) |
| 3 or more Vehicles | 778 (18.5%) | 174 (6.7%) |
| Total | 4,210 (100.0%) | 2,600 (100.0%) |
Real Estate & Mortgages in Hannibal
Real Estate and Mortgage Overview in Hannibal
| Characteristic | Without Mortgage | With Mortgage |
| Housing Units | 2,169 | 2,041 |
| Median Property Value | $114,300 | $145,800 |
| Median Household Income | $59,575 | $175 |
| Monthly Housing Costs | $453 | $10 |
| Real Estate Taxes | $1,059 | $64 |
Property Value by Mortgage Status in Hannibal
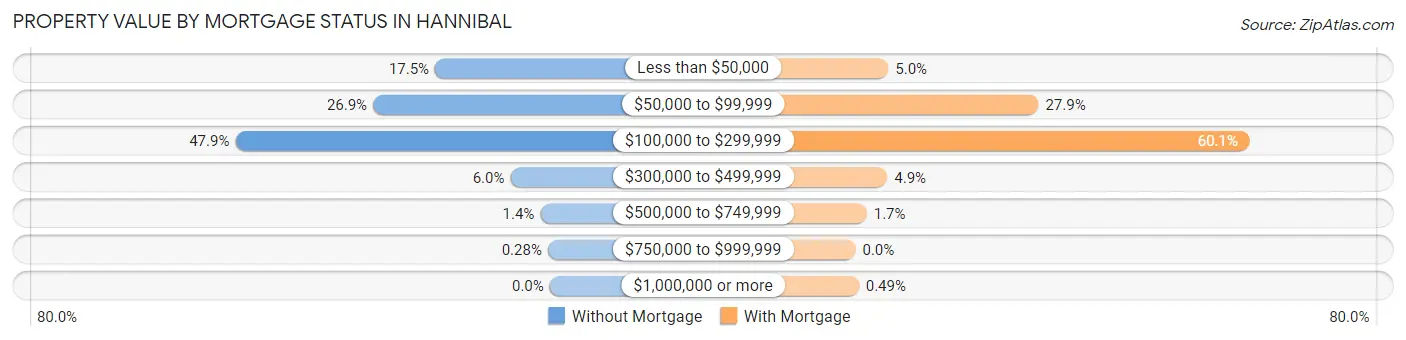
| Property Value | Without Mortgage | With Mortgage |
| Less than $50,000 | 379 (17.5%) | 102 (5.0%) |
| $50,000 to $99,999 | 584 (26.9%) | 569 (27.9%) |
| $100,000 to $299,999 | 1,039 (47.9%) | 1,226 (60.1%) |
| $300,000 to $499,999 | 130 (6.0%) | 99 (4.9%) |
| $500,000 to $749,999 | 31 (1.4%) | 35 (1.7%) |
| $750,000 to $999,999 | 6 (0.3%) | 0 (0.0%) |
| $1,000,000 or more | 0 (0.0%) | 10 (0.5%) |
| Total | 2,169 (100.0%) | 2,041 (100.0%) |
Household Income by Mortgage Status in Hannibal
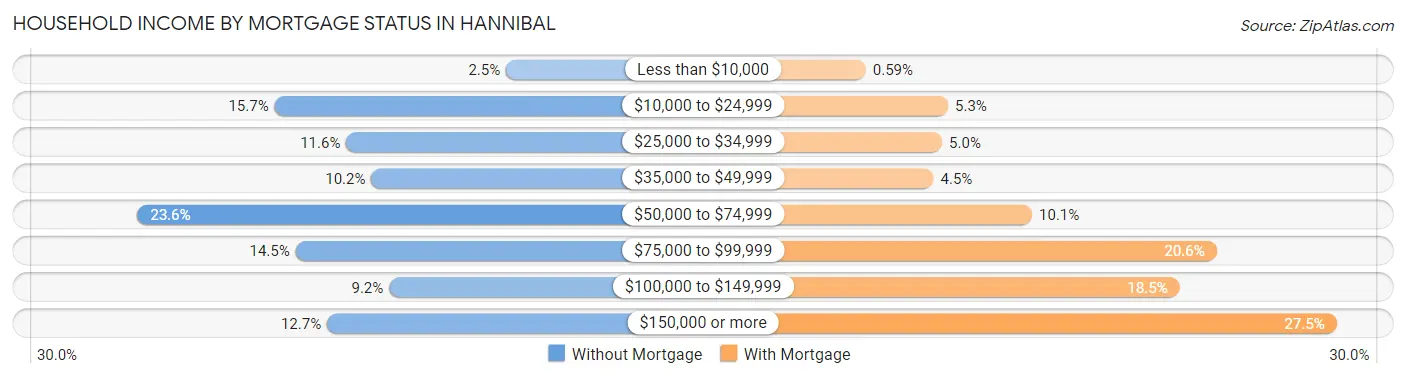
| Household Income | Without Mortgage | With Mortgage |
| Less than $10,000 | 54 (2.5%) | 12 (0.6%) |
| $10,000 to $24,999 | 341 (15.7%) | 108 (5.3%) |
| $25,000 to $34,999 | 252 (11.6%) | 101 (5.0%) |
| $35,000 to $49,999 | 221 (10.2%) | 91 (4.5%) |
| $50,000 to $74,999 | 511 (23.6%) | 206 (10.1%) |
| $75,000 to $99,999 | 315 (14.5%) | 421 (20.6%) |
| $100,000 to $149,999 | 199 (9.2%) | 378 (18.5%) |
| $150,000 or more | 276 (12.7%) | 561 (27.5%) |
| Total | 2,169 (100.0%) | 2,041 (100.0%) |
Property Value to Household Income Ratio in Hannibal
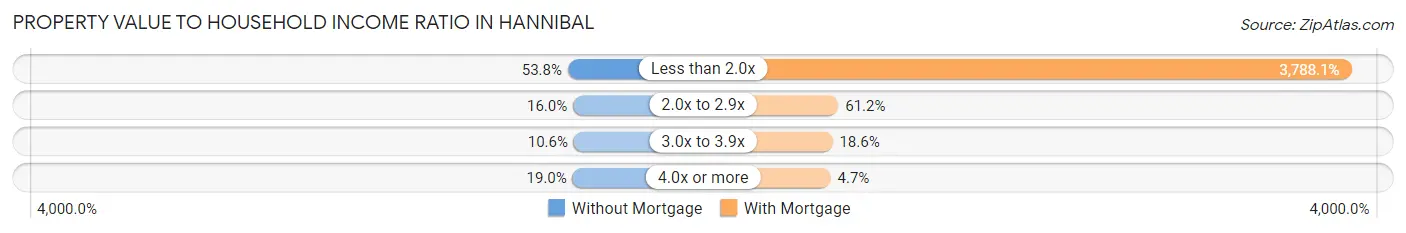
| Value-to-Income Ratio | Without Mortgage | With Mortgage |
| Less than 2.0x | 1,166 (53.8%) | 77,314 (3,788.0%) |
| 2.0x to 2.9x | 347 (16.0%) | 1,248 (61.2%) |
| 3.0x to 3.9x | 229 (10.6%) | 380 (18.6%) |
| 4.0x or more | 411 (19.0%) | 96 (4.7%) |
| Total | 2,169 (100.0%) | 2,041 (100.0%) |
Real Estate Taxes by Mortgage Status in Hannibal
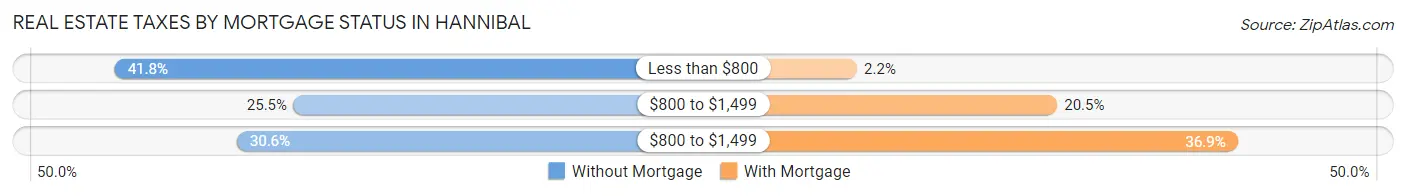
| Property Taxes | Without Mortgage | With Mortgage |
| Less than $800 | 906 (41.8%) | 45 (2.2%) |
| $800 to $1,499 | 553 (25.5%) | 418 (20.5%) |
| $800 to $1,499 | 664 (30.6%) | 754 (36.9%) |
| Total | 2,169 (100.0%) | 2,041 (100.0%) |
Health & Disability in Hannibal
Health Insurance Coverage by Age in Hannibal
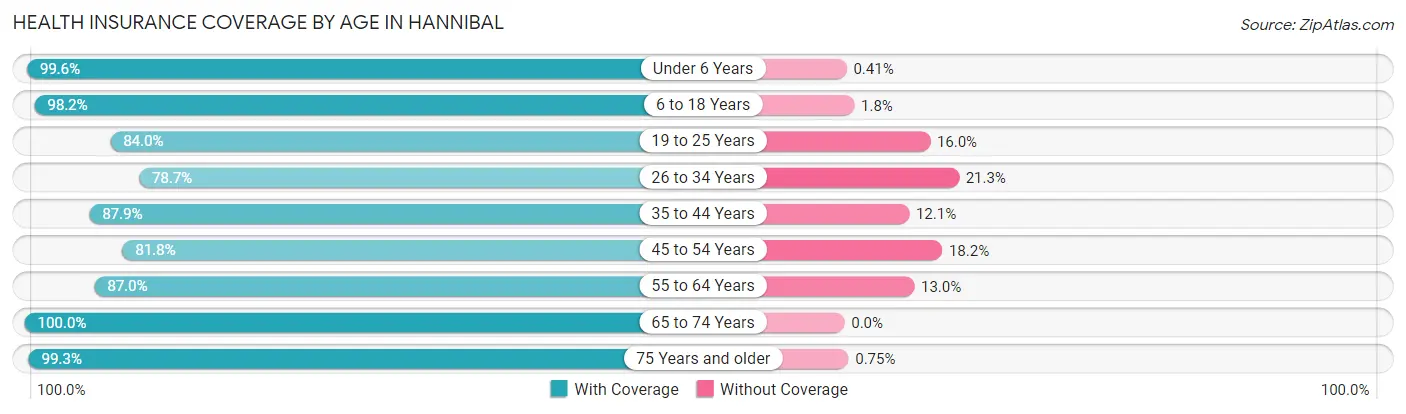
| Age Bracket | With Coverage | Without Coverage |
| Under 6 Years | 1,206 (99.6%) | 5 (0.4%) |
| 6 to 18 Years | 2,782 (98.2%) | 52 (1.8%) |
| 19 to 25 Years | 1,505 (84.0%) | 286 (16.0%) |
| 26 to 34 Years | 1,457 (78.7%) | 395 (21.3%) |
| 35 to 44 Years | 1,656 (87.9%) | 227 (12.1%) |
| 45 to 54 Years | 1,396 (81.8%) | 311 (18.2%) |
| 55 to 64 Years | 2,021 (87.0%) | 302 (13.0%) |
| 65 to 74 Years | 1,701 (100.0%) | 0 (0.0%) |
| 75 Years and older | 1,317 (99.3%) | 10 (0.7%) |
| Total | 15,041 (90.4%) | 1,588 (9.6%) |
Health Insurance Coverage by Citizenship Status in Hannibal
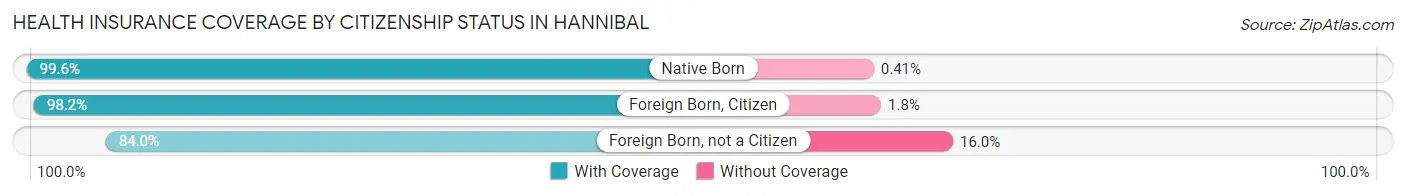
| Citizenship Status | With Coverage | Without Coverage |
| Native Born | 1,206 (99.6%) | 5 (0.4%) |
| Foreign Born, Citizen | 2,782 (98.2%) | 52 (1.8%) |
| Foreign Born, not a Citizen | 1,505 (84.0%) | 286 (16.0%) |
Health Insurance Coverage by Household Income in Hannibal
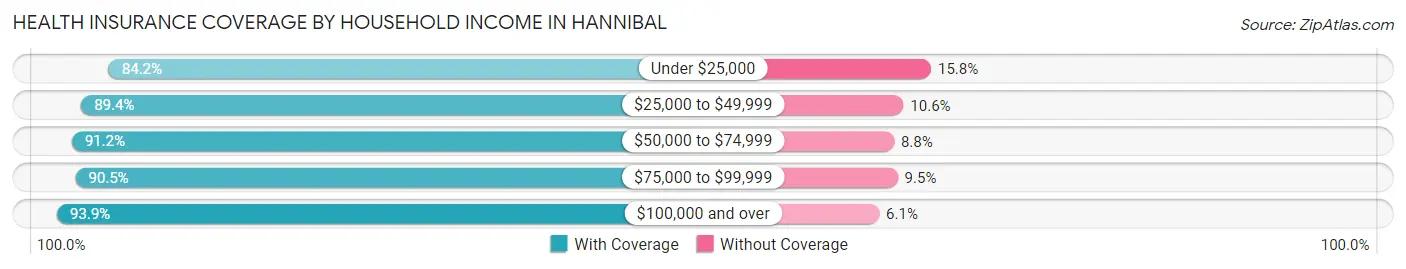
| Household Income | With Coverage | Without Coverage |
| Under $25,000 | 1,946 (84.2%) | 365 (15.8%) |
| $25,000 to $49,999 | 2,992 (89.4%) | 355 (10.6%) |
| $50,000 to $74,999 | 3,052 (91.2%) | 296 (8.8%) |
| $75,000 to $99,999 | 2,498 (90.5%) | 263 (9.5%) |
| $100,000 and over | 3,768 (93.9%) | 243 (6.1%) |
Public vs Private Health Insurance Coverage by Age in Hannibal
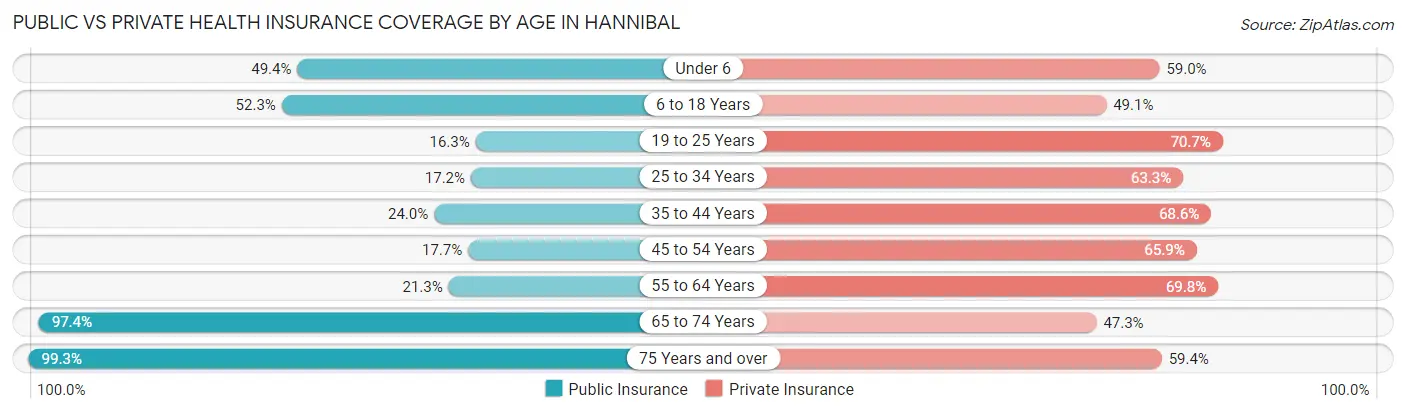
| Age Bracket | Public Insurance | Private Insurance |
| Under 6 | 598 (49.4%) | 714 (59.0%) |
| 6 to 18 Years | 1,482 (52.3%) | 1,391 (49.1%) |
| 19 to 25 Years | 292 (16.3%) | 1,266 (70.7%) |
| 25 to 34 Years | 318 (17.2%) | 1,173 (63.3%) |
| 35 to 44 Years | 452 (24.0%) | 1,291 (68.6%) |
| 45 to 54 Years | 302 (17.7%) | 1,124 (65.8%) |
| 55 to 64 Years | 495 (21.3%) | 1,622 (69.8%) |
| 65 to 74 Years | 1,656 (97.4%) | 804 (47.3%) |
| 75 Years and over | 1,317 (99.3%) | 788 (59.4%) |
| Total | 6,912 (41.6%) | 10,173 (61.2%) |
Disability Status by Sex by Age in Hannibal
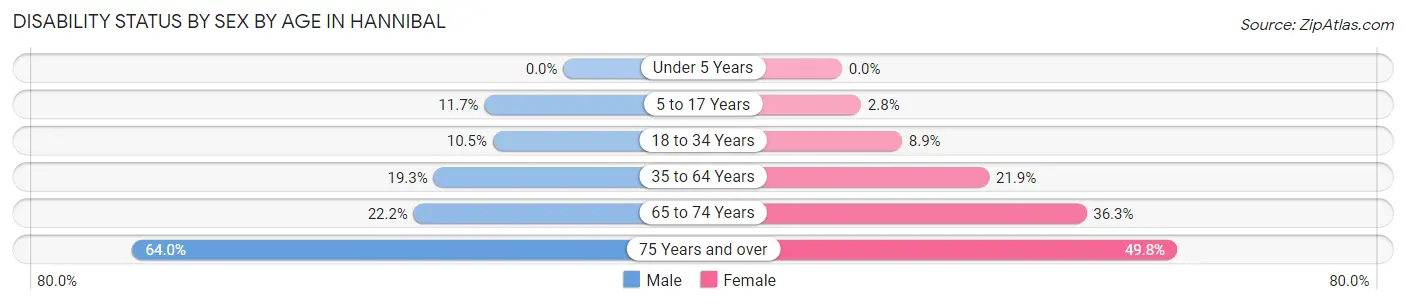
| Age Bracket | Male | Female |
| Under 5 Years | 0 (0.0%) | 0 (0.0%) |
| 5 to 17 Years | 161 (11.7%) | 41 (2.8%) |
| 18 to 34 Years | 186 (10.5%) | 183 (8.9%) |
| 35 to 64 Years | 565 (19.3%) | 652 (21.9%) |
| 65 to 74 Years | 154 (22.2%) | 366 (36.3%) |
| 75 Years and over | 314 (63.9%) | 416 (49.8%) |
Disability Class by Sex by Age in Hannibal
Disability Class: Hearing Difficulty
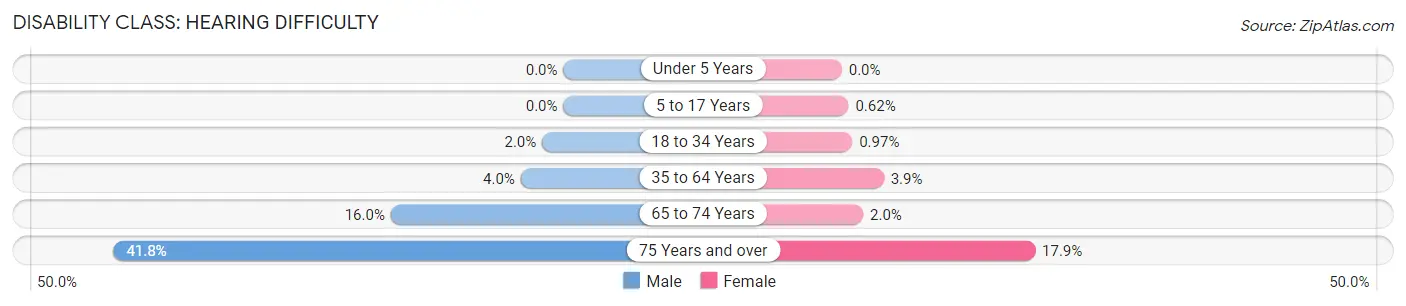
| Age Bracket | Male | Female |
| Under 5 Years | 0 (0.0%) | 0 (0.0%) |
| 5 to 17 Years | 0 (0.0%) | 9 (0.6%) |
| 18 to 34 Years | 35 (2.0%) | 20 (1.0%) |
| 35 to 64 Years | 116 (4.0%) | 116 (3.9%) |
| 65 to 74 Years | 111 (16.0%) | 20 (2.0%) |
| 75 Years and over | 205 (41.7%) | 150 (17.9%) |
Disability Class: Vision Difficulty
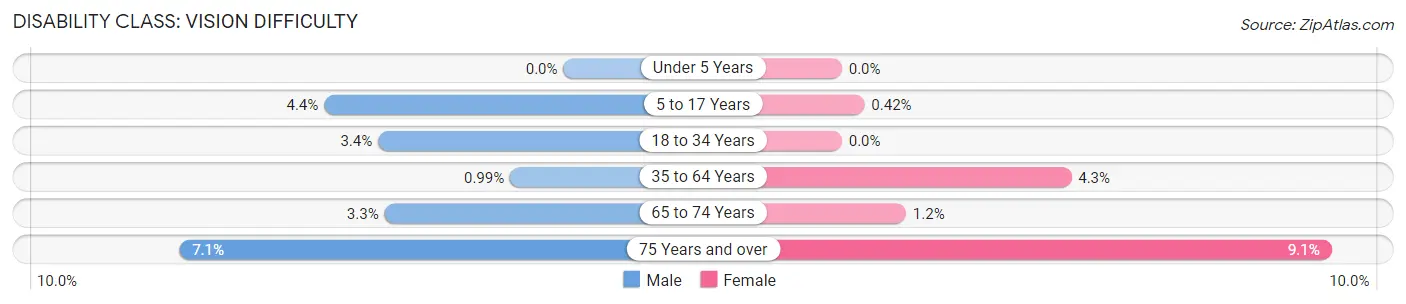
| Age Bracket | Male | Female |
| Under 5 Years | 0 (0.0%) | 0 (0.0%) |
| 5 to 17 Years | 61 (4.4%) | 6 (0.4%) |
| 18 to 34 Years | 61 (3.4%) | 0 (0.0%) |
| 35 to 64 Years | 29 (1.0%) | 127 (4.3%) |
| 65 to 74 Years | 23 (3.3%) | 12 (1.2%) |
| 75 Years and over | 35 (7.1%) | 76 (9.1%) |
Disability Class: Cognitive Difficulty
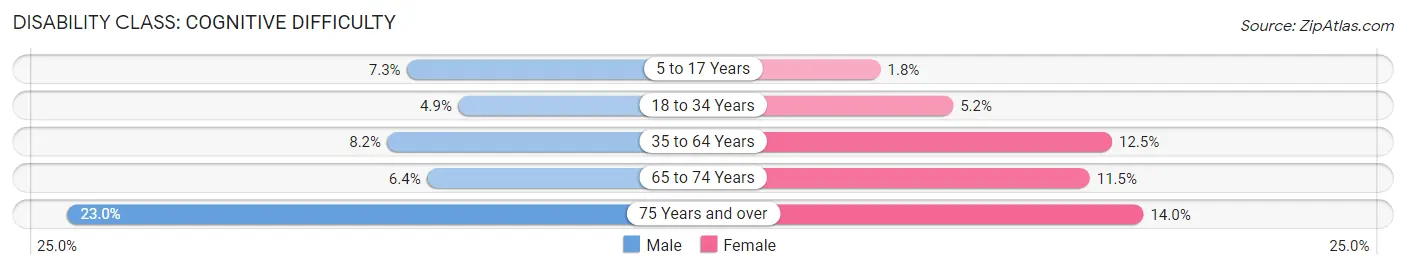
| Age Bracket | Male | Female |
| 5 to 17 Years | 100 (7.3%) | 26 (1.8%) |
| 18 to 34 Years | 87 (4.9%) | 106 (5.2%) |
| 35 to 64 Years | 240 (8.2%) | 374 (12.5%) |
| 65 to 74 Years | 44 (6.4%) | 116 (11.5%) |
| 75 Years and over | 113 (23.0%) | 117 (14.0%) |
Disability Class: Ambulatory Difficulty
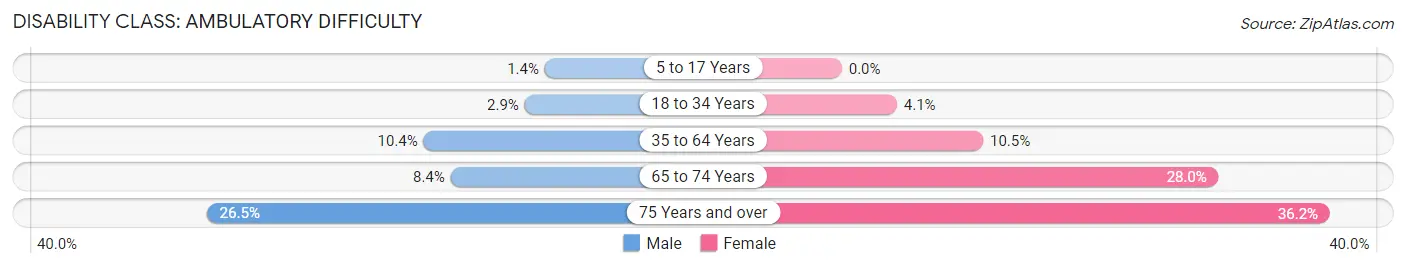
| Age Bracket | Male | Female |
| 5 to 17 Years | 19 (1.4%) | 0 (0.0%) |
| 18 to 34 Years | 51 (2.9%) | 84 (4.1%) |
| 35 to 64 Years | 304 (10.4%) | 313 (10.5%) |
| 65 to 74 Years | 58 (8.4%) | 282 (28.0%) |
| 75 Years and over | 130 (26.5%) | 303 (36.2%) |
Disability Class: Self-Care Difficulty
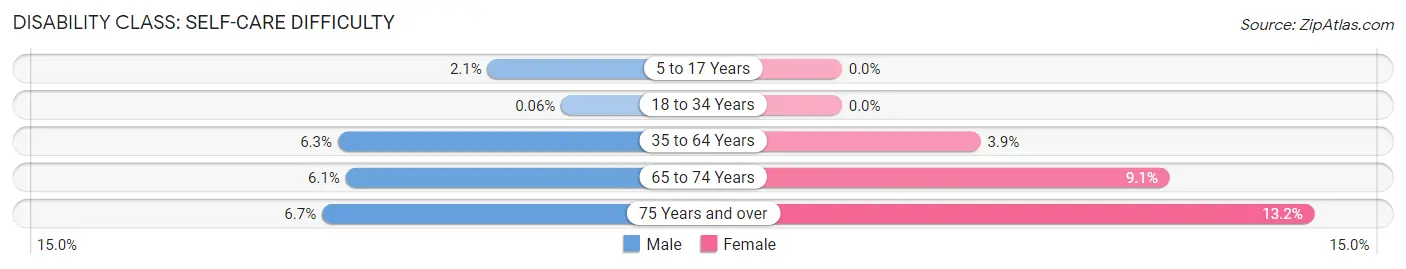
| Age Bracket | Male | Female |
| 5 to 17 Years | 29 (2.1%) | 0 (0.0%) |
| 18 to 34 Years | 1 (0.1%) | 0 (0.0%) |
| 35 to 64 Years | 184 (6.3%) | 115 (3.9%) |
| 65 to 74 Years | 42 (6.1%) | 92 (9.1%) |
| 75 Years and over | 33 (6.7%) | 110 (13.2%) |
Technology Access in Hannibal
Computing Device Access in Hannibal
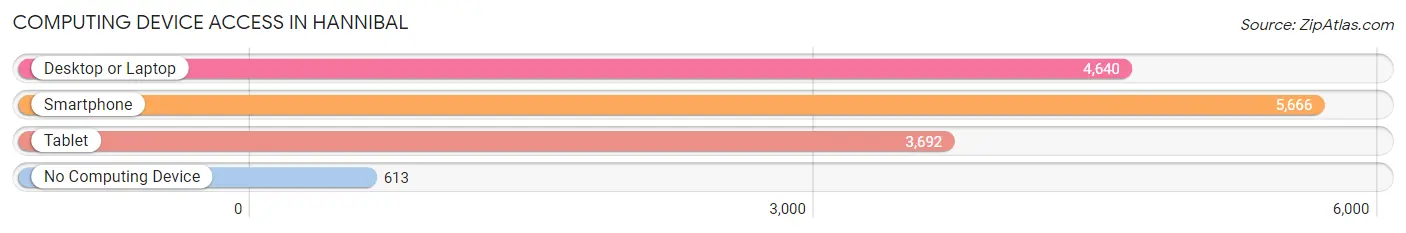
| Device Type | # Households | % Households |
| Desktop or Laptop | 4,640 | 68.1% |
| Smartphone | 5,666 | 83.2% |
| Tablet | 3,692 | 54.2% |
| No Computing Device | 613 | 9.0% |
| Total | 6,810 | 100.0% |
Internet Access in Hannibal
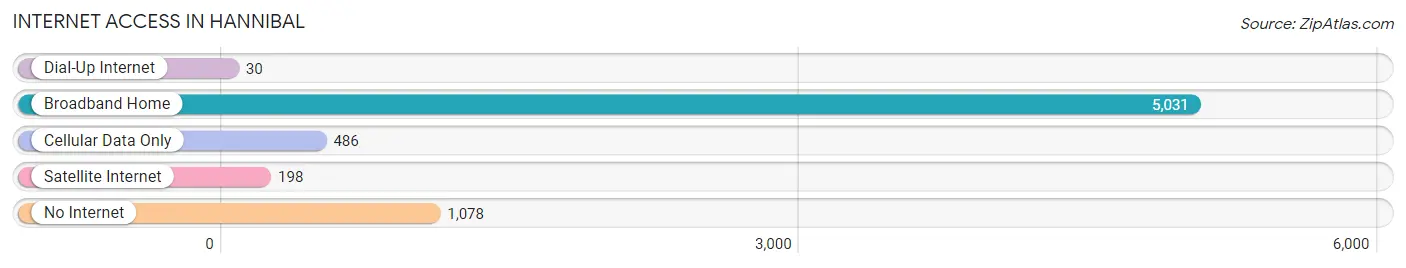
| Internet Type | # Households | % Households |
| Dial-Up Internet | 30 | 0.4% |
| Broadband Home | 5,031 | 73.9% |
| Cellular Data Only | 486 | 7.1% |
| Satellite Internet | 198 | 2.9% |
| No Internet | 1,078 | 15.8% |
| Total | 6,810 | 100.0% |
Hannibal Summary
Hannibal, Missouri is a city located in Marion and Ralls counties in the northeastern part of the state. It is situated on the banks of the Mississippi River, about 100 miles north of St. Louis. The city is best known as the boyhood home of author Mark Twain, and is a popular tourist destination for its historic sites and attractions.
History
Hannibal was founded in 1819 by Moses Bates and John Wood, two entrepreneurs from Kentucky. The city was named after the Carthaginian general Hannibal, who famously crossed the Alps with his army and elephants. The city was incorporated in 1837 and quickly became a major port on the Mississippi River. During the 19th century, Hannibal was a major center for steamboat traffic and a hub for the lumber industry.
In the early 20th century, Hannibal was a major stop on the Hannibal and St. Joseph Railroad, which connected the city to St. Louis. The railroad was immortalized in Mark Twain’s novel The Adventures of Tom Sawyer. The city was also home to a large number of Italian immigrants, who worked in the local brickyards and other industries.
Geography
Hannibal is located in the northeast corner of Missouri, on the banks of the Mississippi River. The city is situated at the confluence of the Mississippi and Illinois rivers, and is surrounded by rolling hills and wooded areas. The city has a total area of 8.3 square miles, of which 8.2 square miles is land and 0.1 square miles is water.
Economy
Hannibal’s economy is largely based on tourism, with the city’s historic sites and attractions drawing visitors from around the world. The city is also home to a number of manufacturing and industrial businesses, including a large paper mill and a number of food processing plants. Other major employers in the area include healthcare, retail, and education.
Demographics
As of the 2010 census, Hannibal had a population of 17,606. The racial makeup of the city was 87.3% White, 8.2% African American, 0.4% Native American, 0.7% Asian, 0.1% Pacific Islander, 1.2% from other races, and 2.1% from two or more races. Hispanic or Latino of any race were 3.2% of the population.
The median income for a household in the city was $35,945, and the median income for a family was $45,945. The per capita income for the city was $19,945. About 13.2% of families and 16.3% of the population were below the poverty line, including 22.2% of those under age 18 and 10.2% of those age 65 or over.
Common Questions
What is Per Capita Income in Hannibal?
Per Capita income in Hannibal is $28,710.
What is the Median Family Income in Hannibal?
Median Family Income in Hannibal is $67,827.
What is the Median Household income in Hannibal?
Median Household Income in Hannibal is $52,746.
What is Income or Wage Gap in Hannibal?
Income or Wage Gap in Hannibal is 32.6%.
Women in Hannibal earn 67.4 cents for every dollar earned by a man.
What is Family Income Deficit in Hannibal?
Family Income Deficit in Hannibal is $10,575.
Families that are below poverty line in Hannibal earn $10,575 less on average than the poverty threshold level.
What is Inequality or Gini Index in Hannibal?
Inequality or Gini Index in Hannibal is 0.47.
What is the Total Population of Hannibal?
Total Population of Hannibal is 17,003.
What is the Total Male Population of Hannibal?
Total Male Population of Hannibal is 8,068.
What is the Total Female Population of Hannibal?
Total Female Population of Hannibal is 8,935.
What is the Ratio of Males per 100 Females in Hannibal?
There are 90.30 Males per 100 Females in Hannibal.
What is the Ratio of Females per 100 Males in Hannibal?
There are 110.75 Females per 100 Males in Hannibal.
What is the Median Population Age in Hannibal?
Median Population Age in Hannibal is 38.5 Years.
What is the Average Family Size in Hannibal
Average Family Size in Hannibal is 3.0 People.
What is the Average Household Size in Hannibal
Average Household Size in Hannibal is 2.3 People.
How Large is the Labor Force in Hannibal?
There are 7,751 People in the Labor Forcein in Hannibal.
What is the Percentage of People in the Labor Force in Hannibal?
56.9% of People are in the Labor Force in Hannibal.
What is the Unemployment Rate in Hannibal?
Unemployment Rate in Hannibal is 3.9%.