Hale, MO Map & Demographics
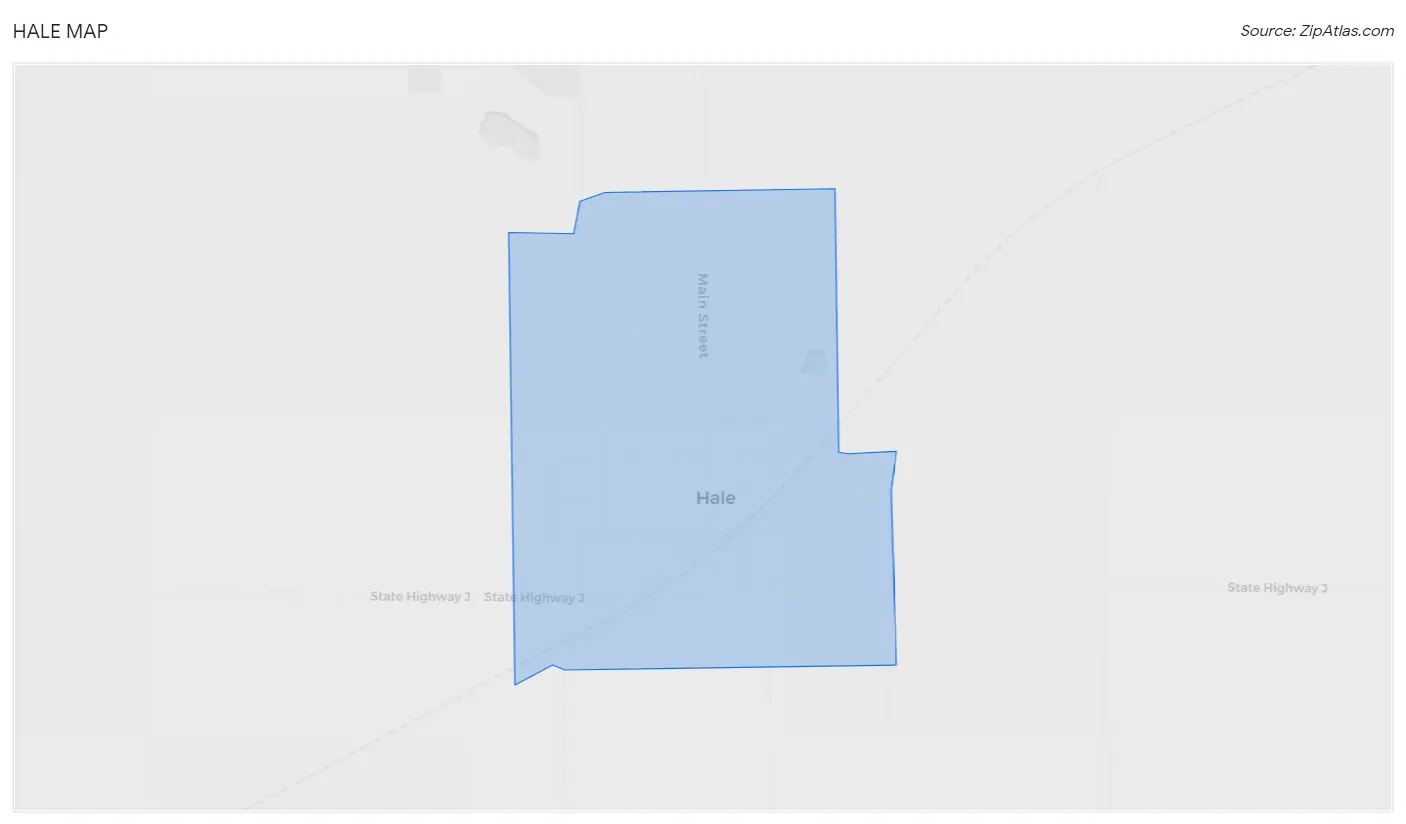
Hale Map
Hale Overview
$27,602
PER CAPITA INCOME
$55,500
AVG FAMILY INCOME
$51,071
AVG HOUSEHOLD INCOME
0.40
INEQUALITY / GINI INDEX
543
TOTAL POPULATION
272
MALE POPULATION
271
FEMALE POPULATION
100.37
MALES / 100 FEMALES
99.63
FEMALES / 100 MALES
42.1
MEDIAN AGE
3.6
AVG FAMILY SIZE
2.6
AVG HOUSEHOLD SIZE
234
LABOR FORCE [ PEOPLE ]
50.6%
PERCENT IN LABOR FORCE
0.4%
UNEMPLOYMENT RATE
Hale Zip Codes
Hale Area Codes
Income in Hale
Income Overview in Hale
Per Capita Income in Hale is $27,602, while median incomes of families and households are $55,500 and $51,071 respectively.
| Characteristic | Number | Measure |
| Per Capita Income | 543 | $27,602 |
| Median Family Income | 126 | $55,500 |
| Mean Family Income | 126 | $73,831 |
| Median Household Income | 212 | $51,071 |
| Mean Household Income | 212 | $58,610 |
| Income Deficit | 126 | $0 |
| Wage / Income Gap (%) | 543 | 0.00% |
| Wage / Income Gap ($) | 543 | 100.00¢ per $1 |
| Gini / Inequality Index | 543 | 0.40 |
Earnings by Sex in Hale
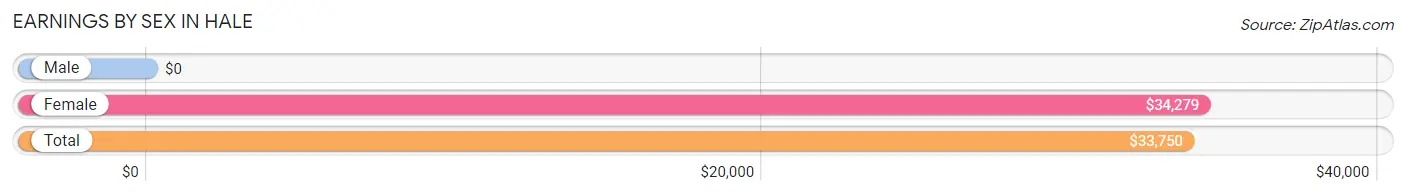
| Sex | Number | Average Earnings |
| Male | 115 (47.5%) | $0 |
| Female | 127 (52.5%) | $34,279 |
| Total | 242 (100.0%) | $33,750 |
Earnings by Sex by Income Bracket in Hale
The most common earnings brackets in Hale are $15,000 to $17,499 for men (27 | 23.5%) and $30,000 to $34,999 for women (44 | 34.6%).
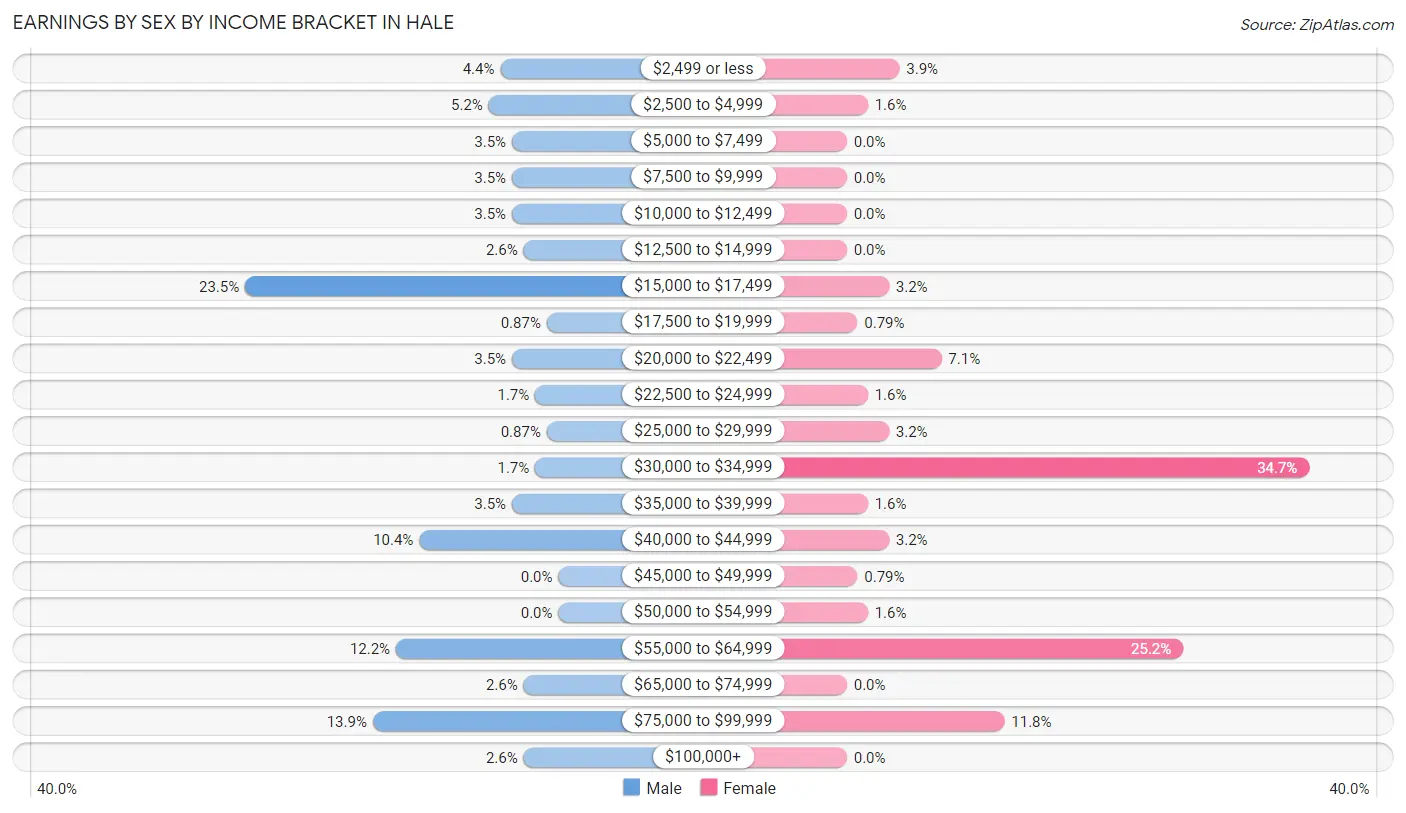
| Income | Male | Female |
| $2,499 or less | 5 (4.3%) | 5 (3.9%) |
| $2,500 to $4,999 | 6 (5.2%) | 2 (1.6%) |
| $5,000 to $7,499 | 4 (3.5%) | 0 (0.0%) |
| $7,500 to $9,999 | 4 (3.5%) | 0 (0.0%) |
| $10,000 to $12,499 | 4 (3.5%) | 0 (0.0%) |
| $12,500 to $14,999 | 3 (2.6%) | 0 (0.0%) |
| $15,000 to $17,499 | 27 (23.5%) | 4 (3.2%) |
| $17,500 to $19,999 | 1 (0.9%) | 1 (0.8%) |
| $20,000 to $22,499 | 4 (3.5%) | 9 (7.1%) |
| $22,500 to $24,999 | 2 (1.7%) | 2 (1.6%) |
| $25,000 to $29,999 | 1 (0.9%) | 4 (3.2%) |
| $30,000 to $34,999 | 2 (1.7%) | 44 (34.6%) |
| $35,000 to $39,999 | 4 (3.5%) | 2 (1.6%) |
| $40,000 to $44,999 | 12 (10.4%) | 4 (3.2%) |
| $45,000 to $49,999 | 0 (0.0%) | 1 (0.8%) |
| $50,000 to $54,999 | 0 (0.0%) | 2 (1.6%) |
| $55,000 to $64,999 | 14 (12.2%) | 32 (25.2%) |
| $65,000 to $74,999 | 3 (2.6%) | 0 (0.0%) |
| $75,000 to $99,999 | 16 (13.9%) | 15 (11.8%) |
| $100,000+ | 3 (2.6%) | 0 (0.0%) |
| Total | 115 (100.0%) | 127 (100.0%) |
Earnings by Sex by Educational Attainment in Hale
Average earnings in Hale are $35,417 for men and $34,615 for women, a difference of 2.3%. Men with an educational attainment of college or associate's degree enjoy the highest average annual earnings of $56,389, while those with less than high school education earn the least with $16,250. Women with an educational attainment of high school diploma earn the most with the average annual earnings of $62,740, while those with college or associate's degree education have the smallest earnings of $33,958.
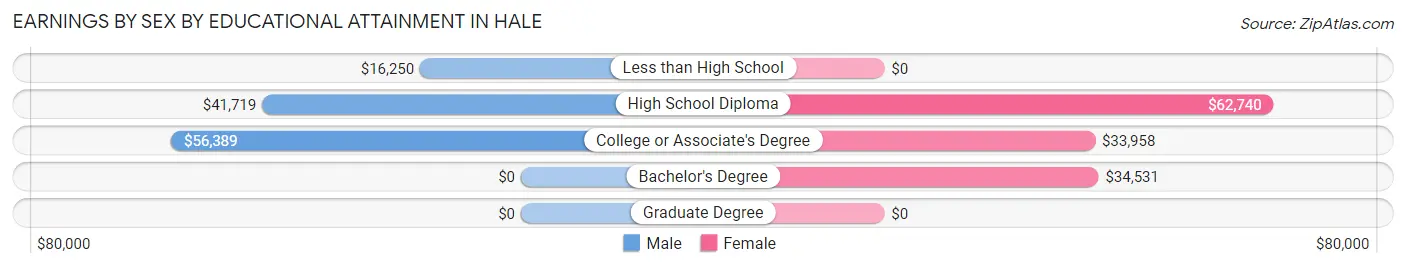
| Educational Attainment | Male Income | Female Income |
| Less than High School | $16,250 | $0 |
| High School Diploma | $41,719 | $62,740 |
| College or Associate's Degree | $56,389 | $33,958 |
| Bachelor's Degree | - | - |
| Graduate Degree | - | - |
| Total | $35,417 | $34,615 |
Family Income in Hale
Family Income Brackets in Hale
According to the Hale family income data, there are 40 families falling into the $50,000 to $74,999 income range, which is the most common income bracket and makes up 31.8% of all families.
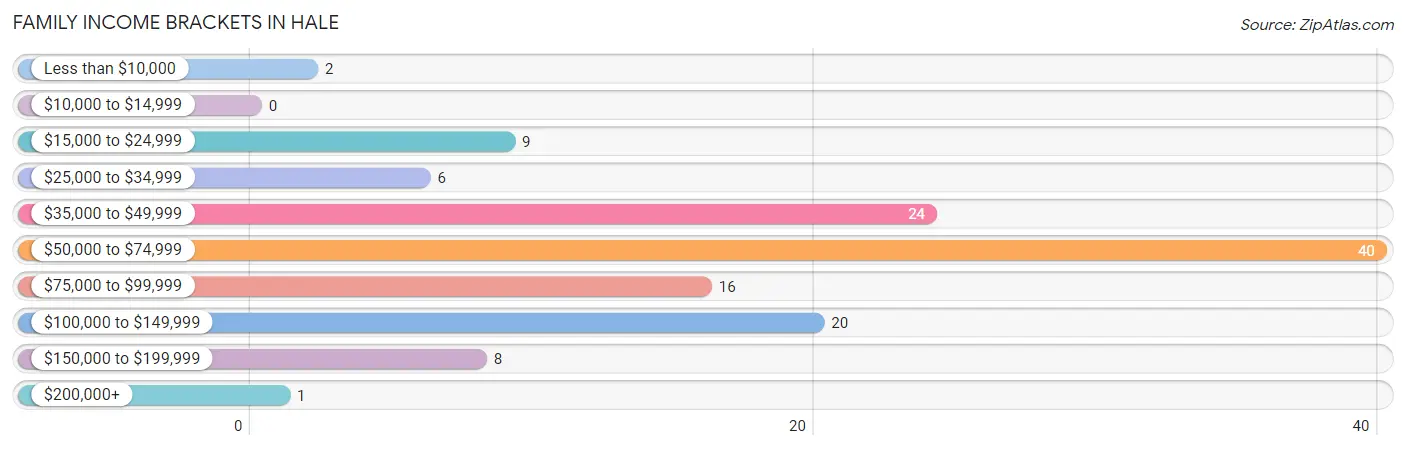
| Income Bracket | # Families | % Families |
| Less than $10,000 | 2 | 1.6% |
| $10,000 to $14,999 | 0 | 0.0% |
| $15,000 to $24,999 | 9 | 7.1% |
| $25,000 to $34,999 | 6 | 4.8% |
| $35,000 to $49,999 | 24 | 19.0% |
| $50,000 to $74,999 | 40 | 31.7% |
| $75,000 to $99,999 | 16 | 12.7% |
| $100,000 to $149,999 | 20 | 15.9% |
| $150,000 to $199,999 | 8 | 6.3% |
| $200,000+ | 1 | 0.8% |
Family Income by Famaliy Size in Hale
4-person families (25 | 19.8%) account for the highest median family income in Hale with $132,083 per family, while 4-person families (25 | 19.8%) have the highest median income of $33,021 per family member.
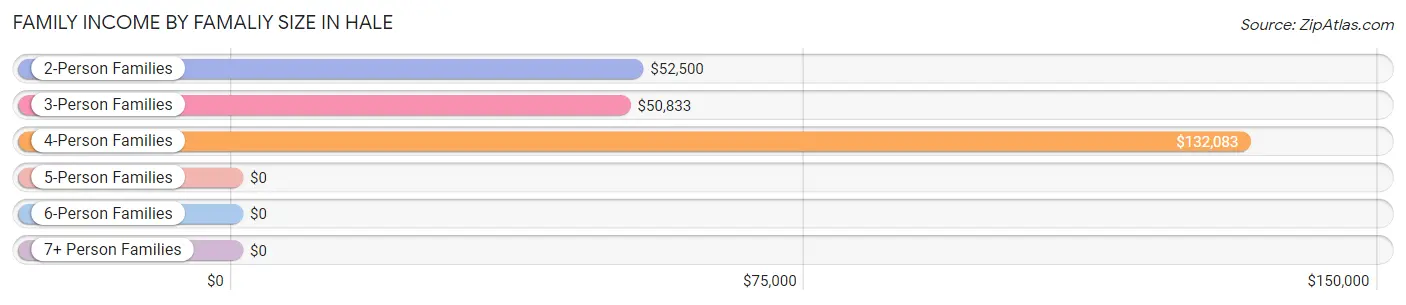
| Income Bracket | # Families | Median Income |
| 2-Person Families | 70 (55.6%) | $52,500 |
| 3-Person Families | 16 (12.7%) | $50,833 |
| 4-Person Families | 25 (19.8%) | $132,083 |
| 5-Person Families | 13 (10.3%) | $0 |
| 6-Person Families | 2 (1.6%) | $0 |
| 7+ Person Families | 0 (0.0%) | $0 |
| Total | 126 (100.0%) | $55,500 |
Family Income by Number of Earners in Hale
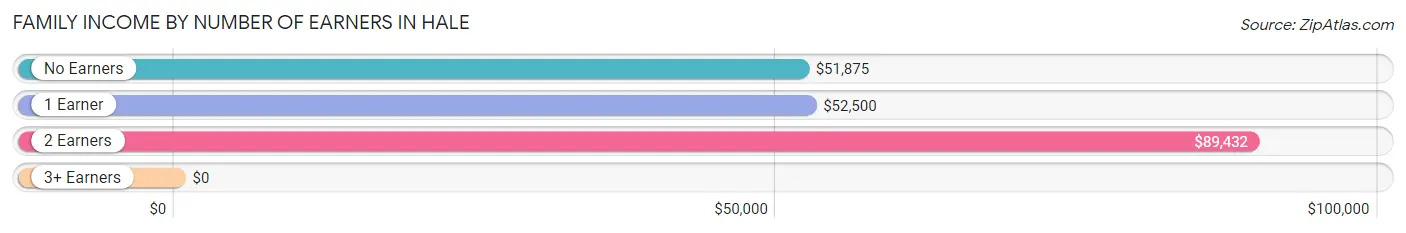
| Number of Earners | # Families | Median Income |
| No Earners | 26 (20.6%) | $51,875 |
| 1 Earner | 46 (36.5%) | $52,500 |
| 2 Earners | 43 (34.1%) | $89,432 |
| 3+ Earners | 11 (8.7%) | $0 |
| Total | 126 (100.0%) | $55,500 |
Household Income in Hale
Household Income Brackets in Hale
With 49 households falling in the category, the $50,000 to $74,999 income range is the most frequent in Hale, accounting for 23.1% of all households. In contrast, only 1 households (0.5%) fall into the $200,000+ income bracket, making it the least populous group.
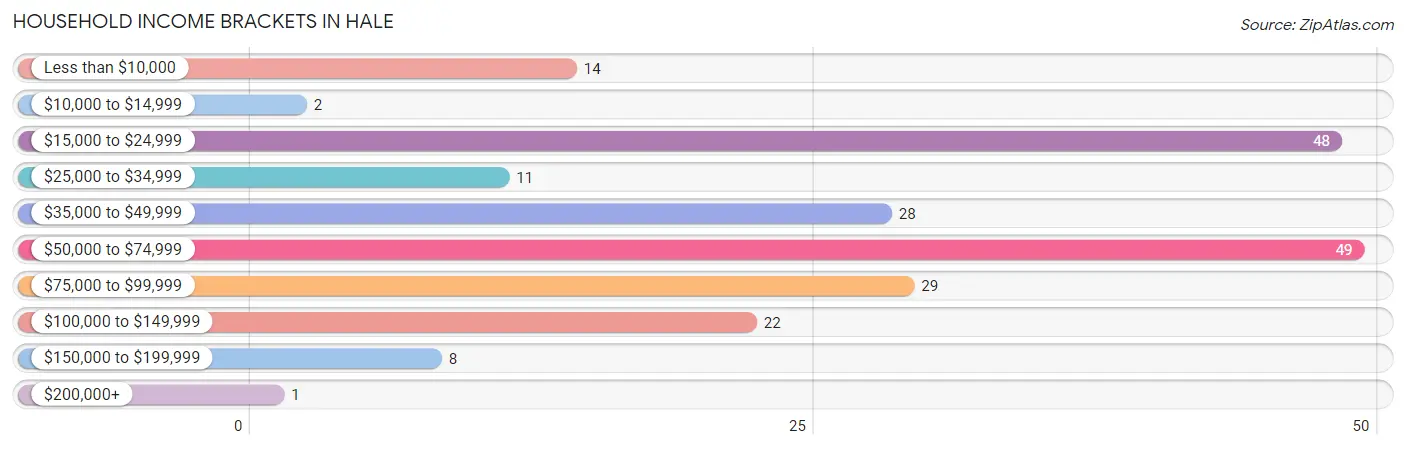
| Income Bracket | # Households | % Households |
| Less than $10,000 | 14 | 6.6% |
| $10,000 to $14,999 | 2 | 0.9% |
| $15,000 to $24,999 | 48 | 22.6% |
| $25,000 to $34,999 | 11 | 5.2% |
| $35,000 to $49,999 | 28 | 13.2% |
| $50,000 to $74,999 | 49 | 23.1% |
| $75,000 to $99,999 | 29 | 13.7% |
| $100,000 to $149,999 | 22 | 10.4% |
| $150,000 to $199,999 | 8 | 3.8% |
| $200,000+ | 1 | 0.5% |
Household Income by Householder Age in Hale
The median household income in Hale is $51,071, with the highest median household income of $83,750 found in the 25 to 44 years age bracket for the primary householder. A total of 46 households (21.7%) fall into this category. Meanwhile, the 15 to 24 years age bracket for the primary householder has the lowest median household income of $0, with 6 households (2.8%) in this group.
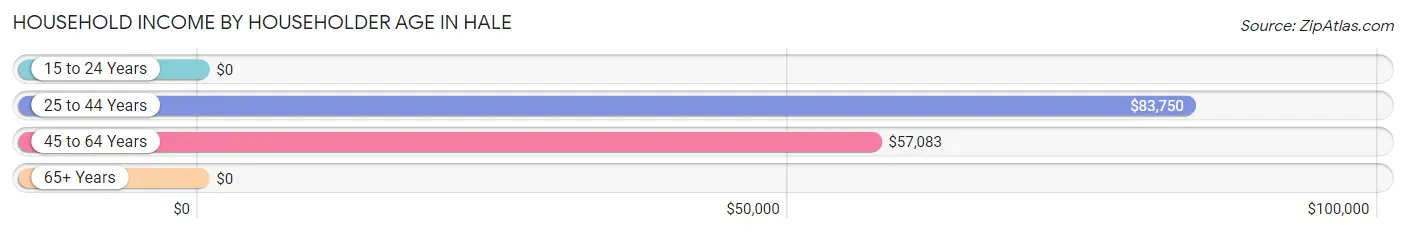
| Income Bracket | # Households | Median Income |
| 15 to 24 Years | 6 (2.8%) | $0 |
| 25 to 44 Years | 46 (21.7%) | $83,750 |
| 45 to 64 Years | 69 (32.6%) | $57,083 |
| 65+ Years | 91 (42.9%) | $0 |
| Total | 212 (100.0%) | $51,071 |
Poverty in Hale
Income Below Poverty by Sex and Age in Hale
With 5.9% poverty level for males and 3.3% for females among the residents of Hale, 45 to 54 year old males and 75 year old and over females are the most vulnerable to poverty, with 3 males (13.6%) and 4 females (18.2%) in their respective age groups living below the poverty level.
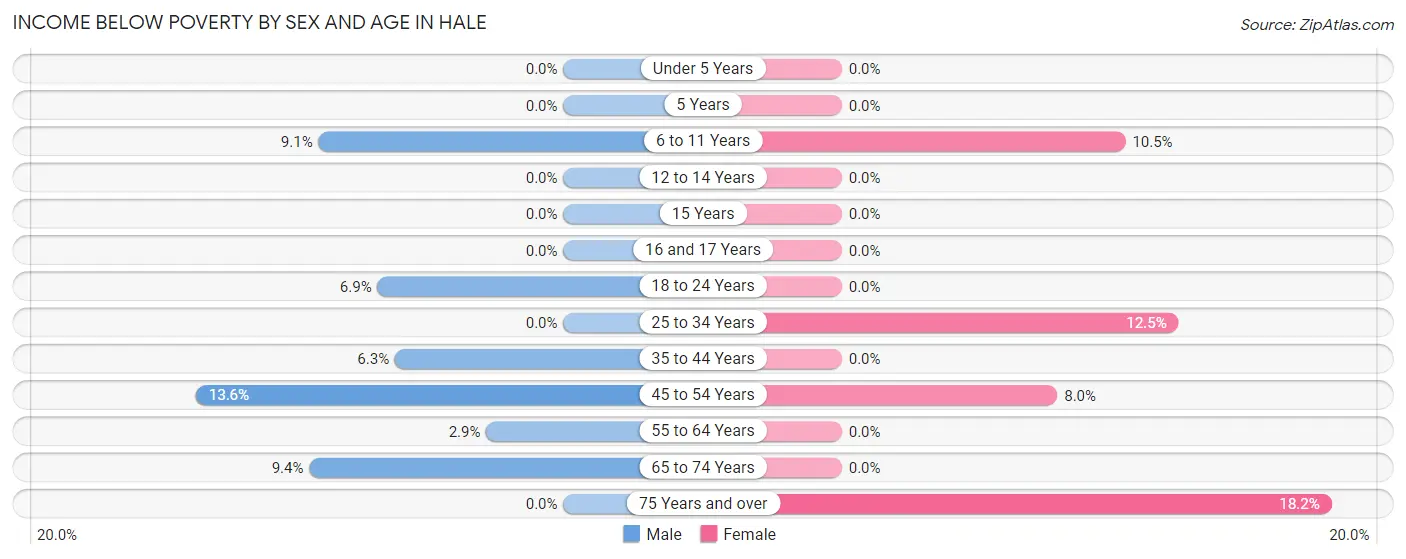
| Age Bracket | Male | Female |
| Under 5 Years | 0 (0.0%) | 0 (0.0%) |
| 5 Years | 0 (0.0%) | 0 (0.0%) |
| 6 to 11 Years | 2 (9.1%) | 2 (10.5%) |
| 12 to 14 Years | 0 (0.0%) | 0 (0.0%) |
| 15 Years | 0 (0.0%) | 0 (0.0%) |
| 16 and 17 Years | 0 (0.0%) | 0 (0.0%) |
| 18 to 24 Years | 2 (6.9%) | 0 (0.0%) |
| 25 to 34 Years | 0 (0.0%) | 1 (12.5%) |
| 35 to 44 Years | 3 (6.2%) | 0 (0.0%) |
| 45 to 54 Years | 3 (13.6%) | 2 (8.0%) |
| 55 to 64 Years | 1 (2.9%) | 0 (0.0%) |
| 65 to 74 Years | 5 (9.4%) | 0 (0.0%) |
| 75 Years and over | 0 (0.0%) | 4 (18.2%) |
| Total | 16 (5.9%) | 9 (3.3%) |
Income Above Poverty by Sex and Age in Hale
According to the poverty statistics in Hale, males aged under 5 years and females aged under 5 years are the age groups that are most secure financially, with 100.0% of males and 100.0% of females in these age groups living above the poverty line.
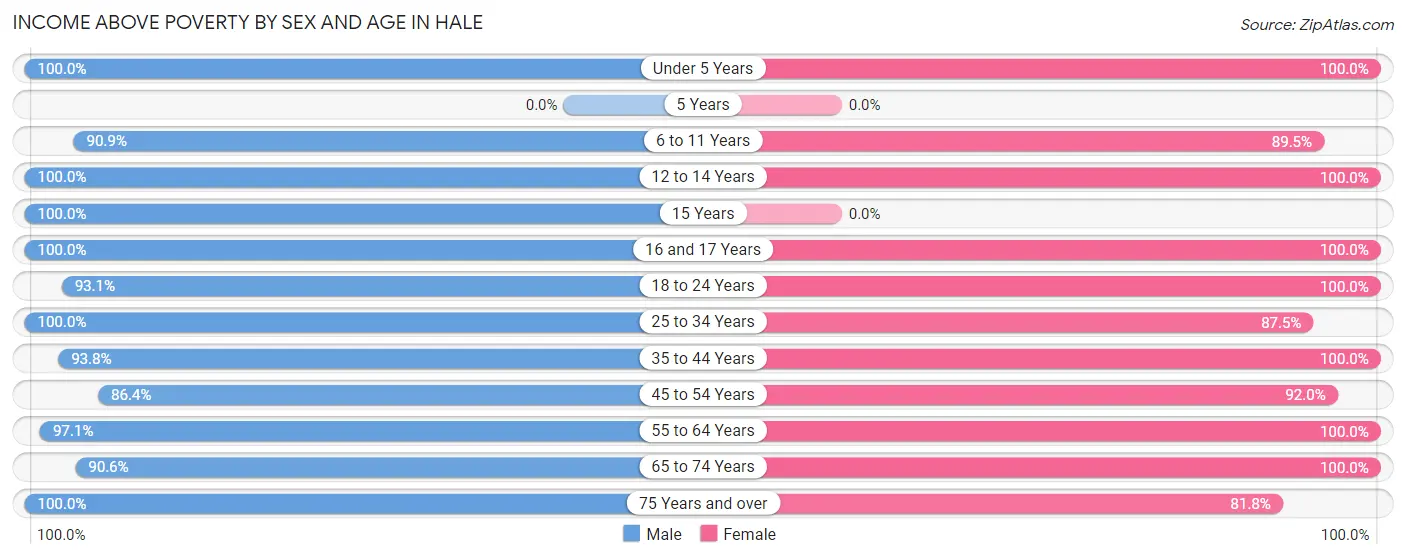
| Age Bracket | Male | Female |
| Under 5 Years | 4 (100.0%) | 5 (100.0%) |
| 5 Years | 0 (0.0%) | 0 (0.0%) |
| 6 to 11 Years | 20 (90.9%) | 17 (89.5%) |
| 12 to 14 Years | 21 (100.0%) | 7 (100.0%) |
| 15 Years | 3 (100.0%) | 0 (0.0%) |
| 16 and 17 Years | 6 (100.0%) | 9 (100.0%) |
| 18 to 24 Years | 27 (93.1%) | 59 (100.0%) |
| 25 to 34 Years | 21 (100.0%) | 7 (87.5%) |
| 35 to 44 Years | 45 (93.8%) | 37 (100.0%) |
| 45 to 54 Years | 19 (86.4%) | 23 (92.0%) |
| 55 to 64 Years | 34 (97.1%) | 45 (100.0%) |
| 65 to 74 Years | 48 (90.6%) | 35 (100.0%) |
| 75 Years and over | 8 (100.0%) | 18 (81.8%) |
| Total | 256 (94.1%) | 262 (96.7%) |
Income Below Poverty Among Married-Couple Families in Hale
The poverty statistics for married-couple families in Hale show that 1.0% or 1 of the total 102 families live below the poverty line. Families with no children have the highest poverty rate of 1.4%, comprising of 1 families. On the other hand, families with 1 or 2 children have the lowest poverty rate of 0.0%, which includes 0 families.
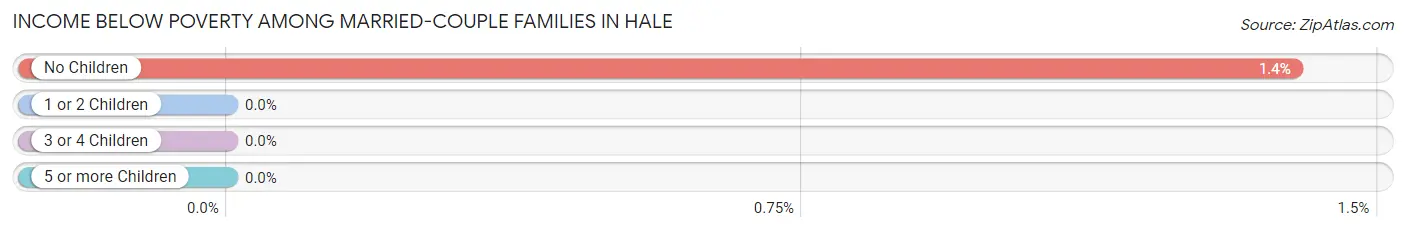
| Children | Above Poverty | Below Poverty |
| No Children | 71 (98.6%) | 1 (1.4%) |
| 1 or 2 Children | 19 (100.0%) | 0 (0.0%) |
| 3 or 4 Children | 11 (100.0%) | 0 (0.0%) |
| 5 or more Children | 0 (0.0%) | 0 (0.0%) |
| Total | 101 (99.0%) | 1 (1.0%) |
Income Below Poverty Among Single-Parent Households in Hale
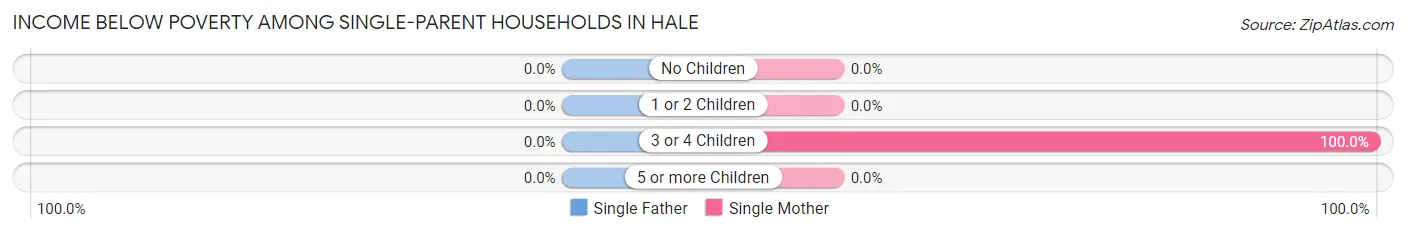
| Children | Single Father | Single Mother |
| No Children | 0 (0.0%) | 0 (0.0%) |
| 1 or 2 Children | 0 (0.0%) | 0 (0.0%) |
| 3 or 4 Children | 0 (0.0%) | 1 (100.0%) |
| 5 or more Children | 0 (0.0%) | 0 (0.0%) |
| Total | 0 (0.0%) | 1 (6.7%) |
Income Below Poverty Among Married-Couple vs Single-Parent Households in Hale
The poverty data for Hale shows that 1 of the married-couple family households (1.0%) and 1 of the single-parent households (4.2%) are living below the poverty level. Within the married-couple family households, those with no children have the highest poverty rate, with 1 households (1.4%) falling below the poverty line. Among the single-parent households, those with 3 or 4 children have the highest poverty rate, with 1 household (100.0%) living below poverty.
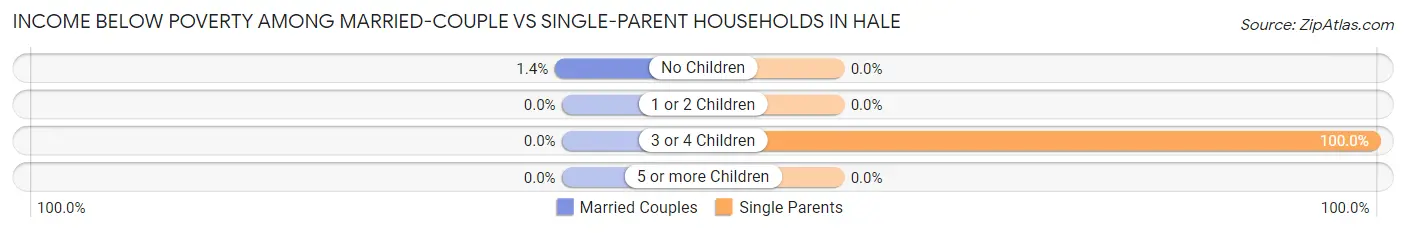
| Children | Married-Couple Families | Single-Parent Households |
| No Children | 1 (1.4%) | 0 (0.0%) |
| 1 or 2 Children | 0 (0.0%) | 0 (0.0%) |
| 3 or 4 Children | 0 (0.0%) | 1 (100.0%) |
| 5 or more Children | 0 (0.0%) | 0 (0.0%) |
| Total | 1 (1.0%) | 1 (4.2%) |
Race in Hale
The most populous races in Hale are White / Caucasian (503 | 92.6%), Black / African American (37 | 6.8%), and Hispanic or Latino (3 | 0.5%).
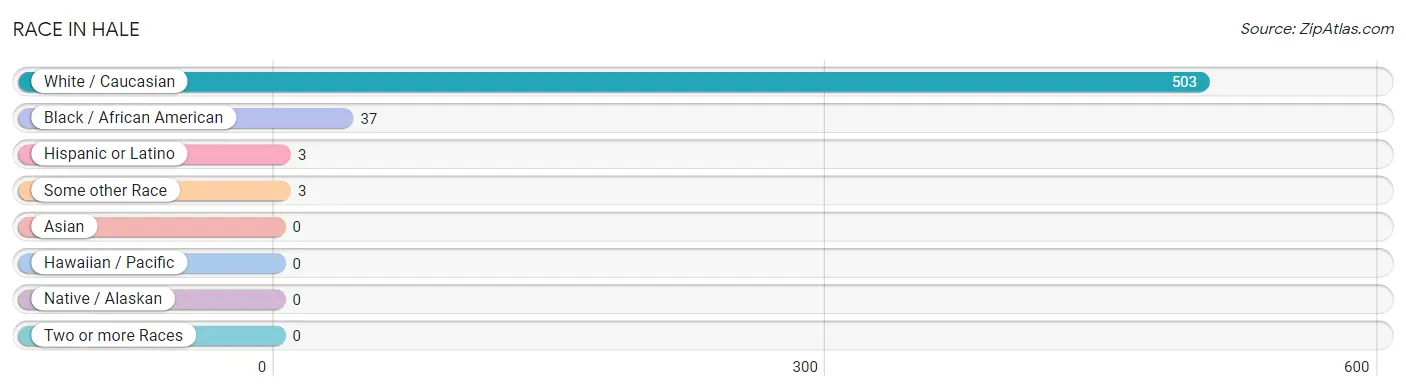
| Race | # Population | % Population |
| Asian | 0 | 0.0% |
| Black / African American | 37 | 6.8% |
| Hawaiian / Pacific | 0 | 0.0% |
| Hispanic or Latino | 3 | 0.5% |
| Native / Alaskan | 0 | 0.0% |
| White / Caucasian | 503 | 92.6% |
| Two or more Races | 0 | 0.0% |
| Some other Race | 3 | 0.5% |
| Total | 543 | 100.0% |
Ancestry in Hale
The most populous ancestries reported in Hale are German (81 | 14.9%), American (45 | 8.3%), Irish (30 | 5.5%), Scottish (16 | 2.9%), and English (9 | 1.7%), together accounting for 33.3% of all Hale residents.
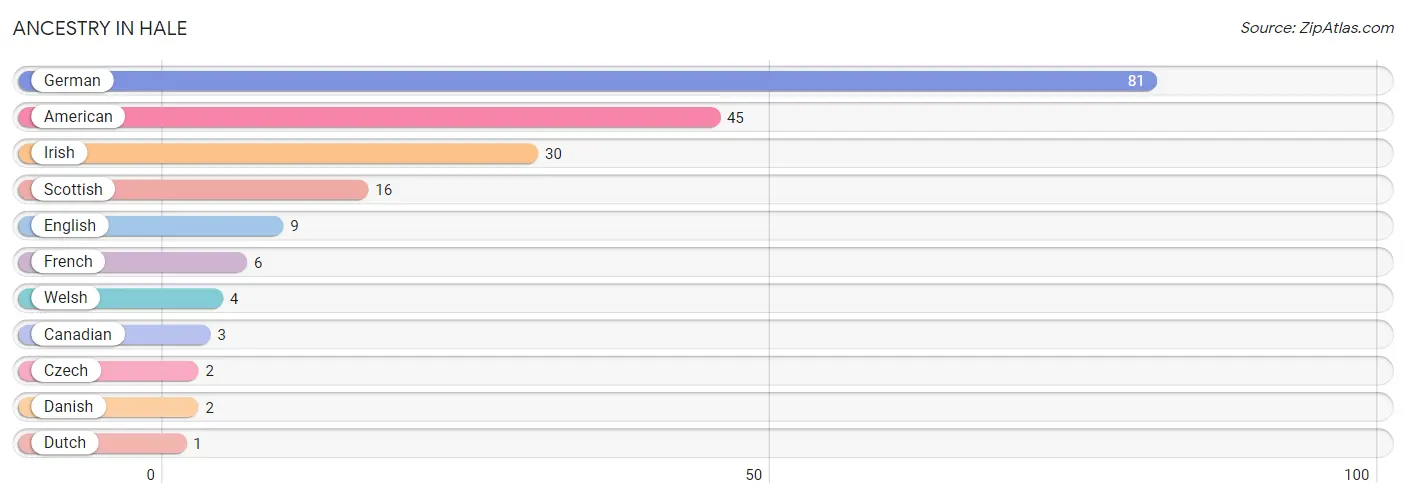
| Ancestry | # Population | % Population |
| American | 45 | 8.3% |
| Canadian | 3 | 0.5% |
| Czech | 2 | 0.4% |
| Danish | 2 | 0.4% |
| Dutch | 1 | 0.2% |
| English | 9 | 1.7% |
| French | 6 | 1.1% |
| German | 81 | 14.9% |
| Irish | 30 | 5.5% |
| Scottish | 16 | 2.9% |
| Welsh | 4 | 0.7% | View All 11 Rows |
Immigrants in Hale
The most numerous immigrant groups reported in Hale came from Central America (3 | 0.5%), El Salvador (3 | 0.5%), and Latin America (3 | 0.5%), together accounting for 1.7% of all Hale residents.
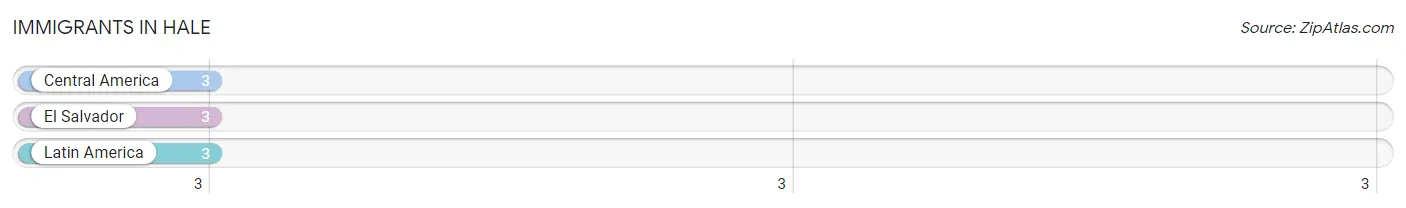
| Immigration Origin | # Population | % Population |
| Central America | 3 | 0.5% |
| El Salvador | 3 | 0.5% |
| Latin America | 3 | 0.5% | View All 3 Rows |
Sex and Age in Hale
Sex and Age in Hale
The most populous age groups in Hale are 65 to 69 Years (49 | 18.0%) for men and 20 to 24 Years (59 | 21.8%) for women.
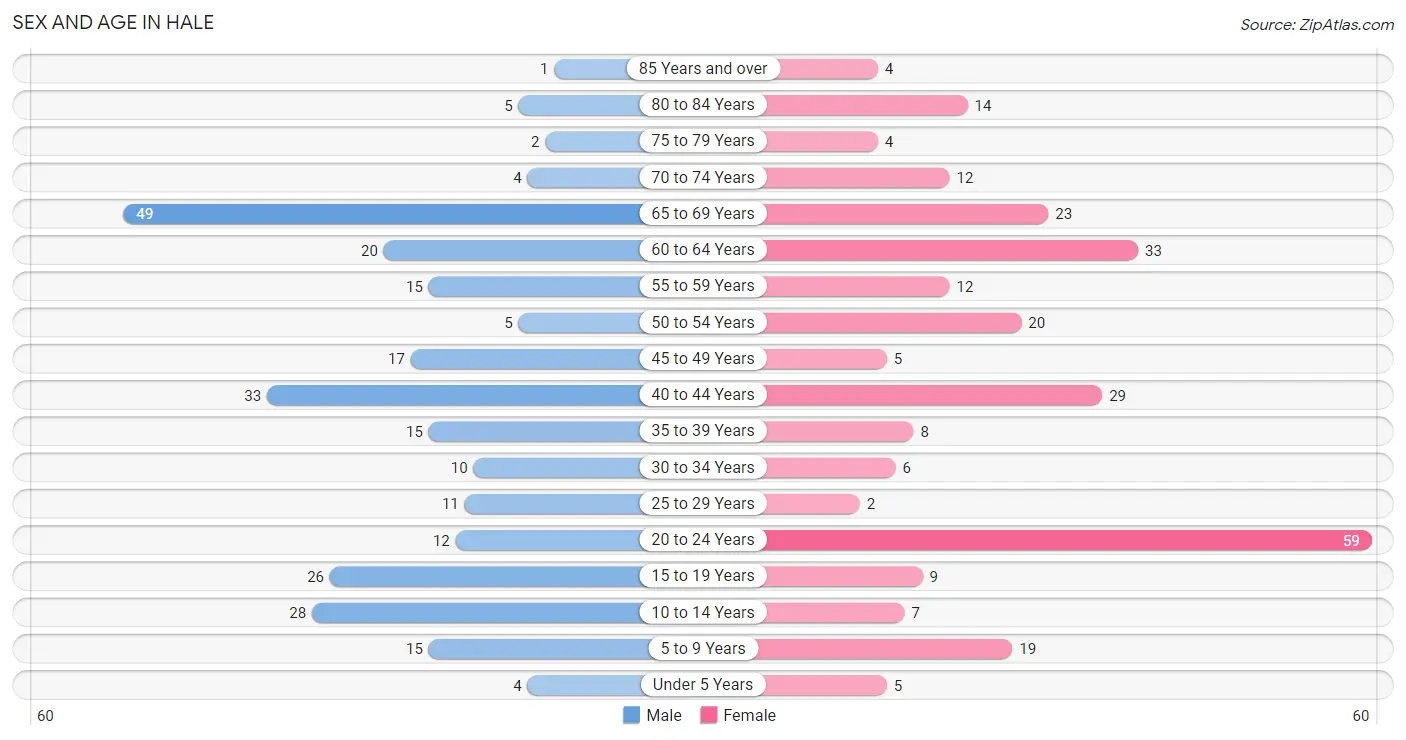
| Age Bracket | Male | Female |
| Under 5 Years | 4 (1.5%) | 5 (1.8%) |
| 5 to 9 Years | 15 (5.5%) | 19 (7.0%) |
| 10 to 14 Years | 28 (10.3%) | 7 (2.6%) |
| 15 to 19 Years | 26 (9.6%) | 9 (3.3%) |
| 20 to 24 Years | 12 (4.4%) | 59 (21.8%) |
| 25 to 29 Years | 11 (4.0%) | 2 (0.7%) |
| 30 to 34 Years | 10 (3.7%) | 6 (2.2%) |
| 35 to 39 Years | 15 (5.5%) | 8 (2.9%) |
| 40 to 44 Years | 33 (12.1%) | 29 (10.7%) |
| 45 to 49 Years | 17 (6.2%) | 5 (1.8%) |
| 50 to 54 Years | 5 (1.8%) | 20 (7.4%) |
| 55 to 59 Years | 15 (5.5%) | 12 (4.4%) |
| 60 to 64 Years | 20 (7.3%) | 33 (12.2%) |
| 65 to 69 Years | 49 (18.0%) | 23 (8.5%) |
| 70 to 74 Years | 4 (1.5%) | 12 (4.4%) |
| 75 to 79 Years | 2 (0.7%) | 4 (1.5%) |
| 80 to 84 Years | 5 (1.8%) | 14 (5.2%) |
| 85 Years and over | 1 (0.4%) | 4 (1.5%) |
| Total | 272 (100.0%) | 271 (100.0%) |
Families and Households in Hale
Median Family Size in Hale
The median family size in Hale is 3.60 persons per family, with single female/mother families (15 | 11.9%) accounting for the largest median family size of 7.93 persons per family. On the other hand, single male/father families (9 | 7.1%) represent the smallest median family size with 1.89 persons per family.
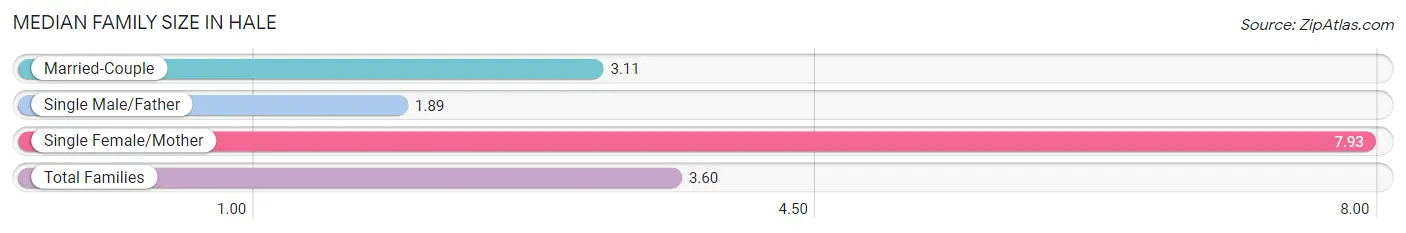
| Family Type | # Families | Family Size |
| Married-Couple | 102 (80.9%) | 3.11 |
| Single Male/Father | 9 (7.1%) | 1.89 |
| Single Female/Mother | 15 (11.9%) | 7.93 |
| Total Families | 126 (100.0%) | 3.60 |
Median Household Size in Hale
The median household size in Hale is 2.56 persons per household, with single female/mother households (15 | 7.1%) accounting for the largest median household size of 7.93 persons per household. non-family households (86 | 40.6%) represent the smallest median household size with 1.05 persons per household.
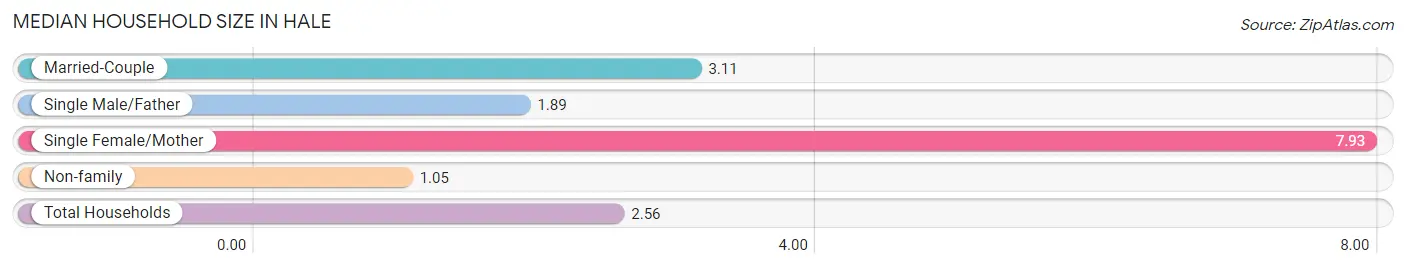
| Household Type | # Households | Household Size |
| Married-Couple | 102 (48.1%) | 3.11 |
| Single Male/Father | 9 (4.3%) | 1.89 |
| Single Female/Mother | 15 (7.1%) | 7.93 |
| Non-family | 86 (40.6%) | 1.05 |
| Total Households | 212 (100.0%) | 2.56 |
Household Size by Marriage Status in Hale
Out of a total of 212 households in Hale, 126 (59.4%) are family households, while 86 (40.6%) are nonfamily households. The most numerous type of family households are 2-person households, comprising 70, and the most common type of nonfamily households are 1-person households, comprising 82.
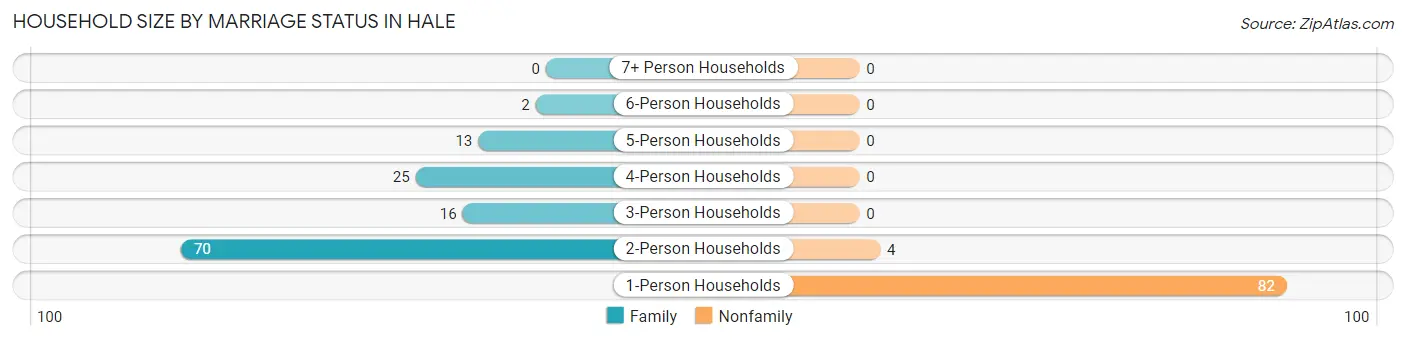
| Household Size | Family Households | Nonfamily Households |
| 1-Person Households | - | 82 (38.7%) |
| 2-Person Households | 70 (33.0%) | 4 (1.9%) |
| 3-Person Households | 16 (7.5%) | 0 (0.0%) |
| 4-Person Households | 25 (11.8%) | 0 (0.0%) |
| 5-Person Households | 13 (6.1%) | 0 (0.0%) |
| 6-Person Households | 2 (0.9%) | 0 (0.0%) |
| 7+ Person Households | 0 (0.0%) | 0 (0.0%) |
| Total | 126 (59.4%) | 86 (40.6%) |
Female Fertility in Hale
Fertility by Age in Hale
Average fertility rate in Hale is 25.0 births per 1,000 women. Women in the age bracket of 20 to 34 years have the highest fertility rate with 45.0 births per 1,000 women. Women in the age bracket of 20 to 34 years acount for 100.0% of all women with births.
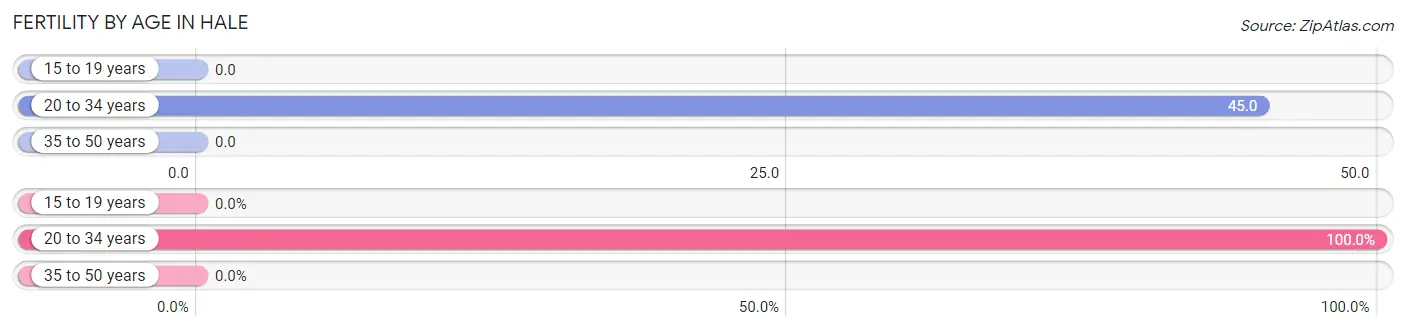
| Age Bracket | Women with Births | Births / 1,000 Women |
| 15 to 19 years | 0 (0.0%) | 0.0 |
| 20 to 34 years | 3 (100.0%) | 45.0 |
| 35 to 50 years | 0 (0.0%) | 0.0 |
| Total | 3 (100.0%) | 25.0 |
Fertility by Age by Marriage Status in Hale
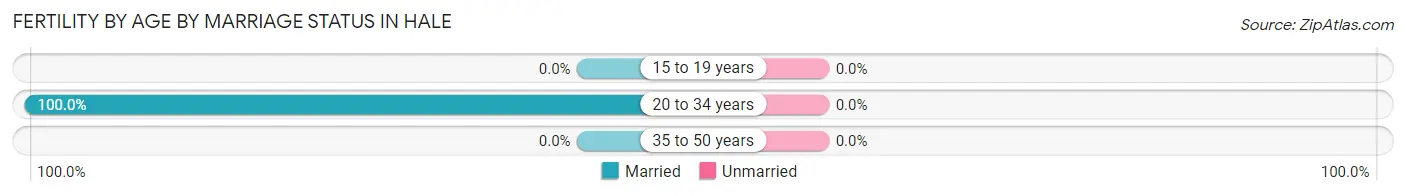
| Age Bracket | Married | Unmarried |
| 15 to 19 years | 0 (0.0%) | 0 (0.0%) |
| 20 to 34 years | 3 (100.0%) | 0 (0.0%) |
| 35 to 50 years | 0 (0.0%) | 0 (0.0%) |
| Total | 3 (100.0%) | 0 (0.0%) |
Fertility by Education in Hale
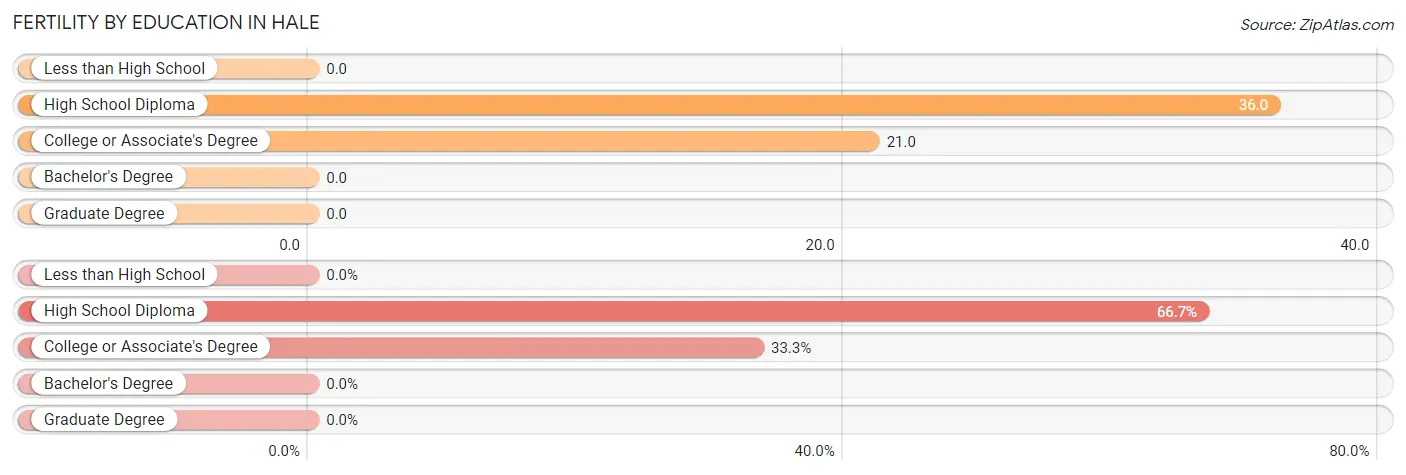
| Educational Attainment | Women with Births | Births / 1,000 Women |
| Less than High School | 0 (0.0%) | 0.0 |
| High School Diploma | 2 (66.7%) | 36.0 |
| College or Associate's Degree | 1 (33.3%) | 21.0 |
| Bachelor's Degree | 0 (0.0%) | 0.0 |
| Graduate Degree | 0 (0.0%) | 0.0 |
| Total | 3 (100.0%) | 25.0 |
Fertility by Education by Marriage Status in Hale
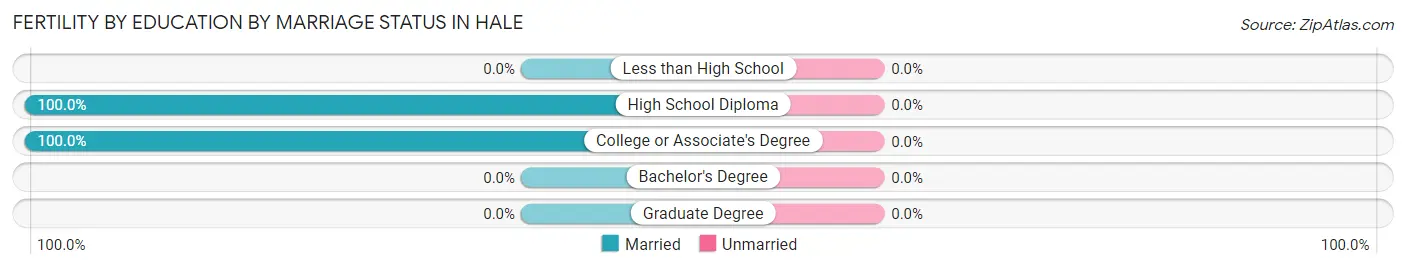
| Educational Attainment | Married | Unmarried |
| Less than High School | 0 (0.0%) | 0 (0.0%) |
| High School Diploma | 2 (100.0%) | 0 (0.0%) |
| College or Associate's Degree | 1 (100.0%) | 0 (0.0%) |
| Bachelor's Degree | 0 (0.0%) | 0 (0.0%) |
| Graduate Degree | 0 (0.0%) | 0 (0.0%) |
| Total | 3 (100.0%) | 0 (0.0%) |
Employment Characteristics in Hale
Employment by Class of Employer in Hale
Among the 233 employed individuals in Hale, private company employees (140 | 60.1%), self-employed (not incorporated) (33 | 14.2%), and state government employees (26 | 11.2%) make up the most common classes of employment.
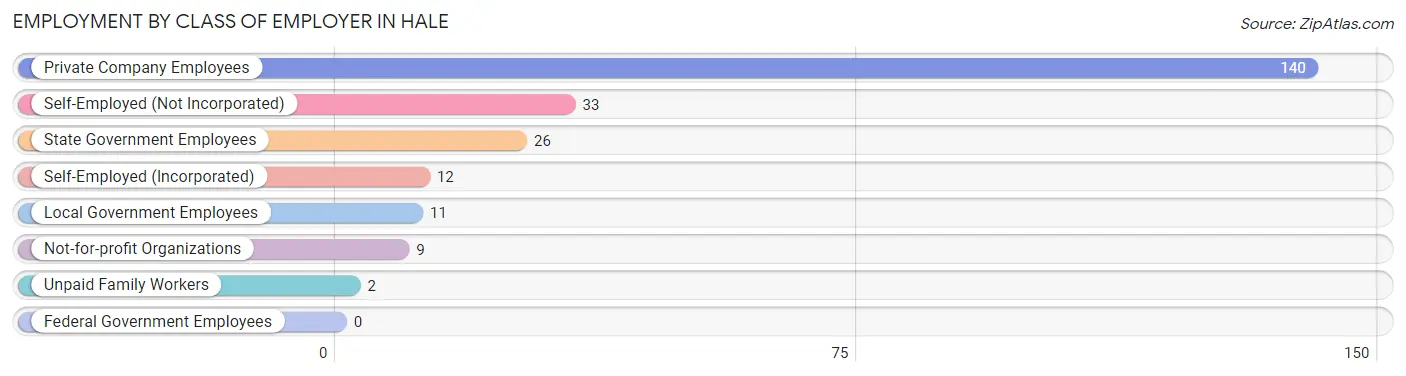
| Employer Class | # Employees | % Employees |
| Private Company Employees | 140 | 60.1% |
| Self-Employed (Incorporated) | 12 | 5.1% |
| Self-Employed (Not Incorporated) | 33 | 14.2% |
| Not-for-profit Organizations | 9 | 3.9% |
| Local Government Employees | 11 | 4.7% |
| State Government Employees | 26 | 11.2% |
| Federal Government Employees | 0 | 0.0% |
| Unpaid Family Workers | 2 | 0.9% |
| Total | 233 | 100.0% |
Employment Status by Age in Hale
According to the labor force statistics for Hale, out of the total population over 16 years of age (462), 50.6% or 234 individuals are in the labor force, with 0.4% or 1 of them unemployed. The age group with the highest labor force participation rate is 25 to 29 years, with 100.0% or 13 individuals in the labor force. Within the labor force, the 20 to 24 years age range has the highest percentage of unemployed individuals, with 5.9% or 1 of them being unemployed.
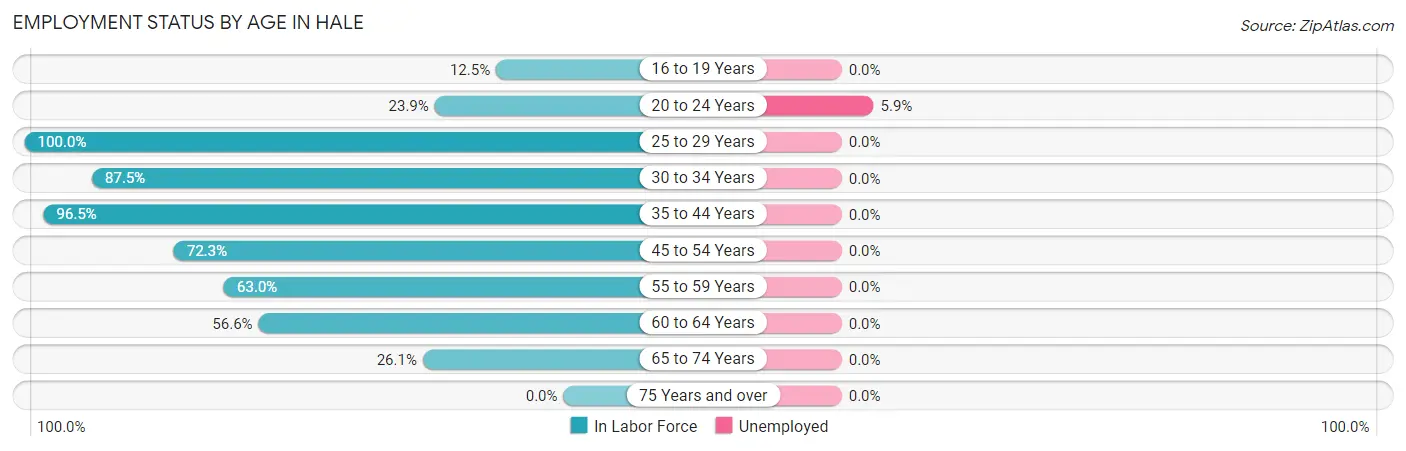
| Age Bracket | In Labor Force | Unemployed |
| 16 to 19 Years | 4 (12.5%) | 0 (0.0%) |
| 20 to 24 Years | 17 (23.9%) | 1 (5.9%) |
| 25 to 29 Years | 13 (100.0%) | 0 (0.0%) |
| 30 to 34 Years | 14 (87.5%) | 0 (0.0%) |
| 35 to 44 Years | 82 (96.5%) | 0 (0.0%) |
| 45 to 54 Years | 34 (72.3%) | 0 (0.0%) |
| 55 to 59 Years | 17 (63.0%) | 0 (0.0%) |
| 60 to 64 Years | 30 (56.6%) | 0 (0.0%) |
| 65 to 74 Years | 23 (26.1%) | 0 (0.0%) |
| 75 Years and over | 0 (0.0%) | 0 (0.0%) |
| Total | 234 (50.6%) | 1 (0.4%) |
Employment Status by Educational Attainment in Hale
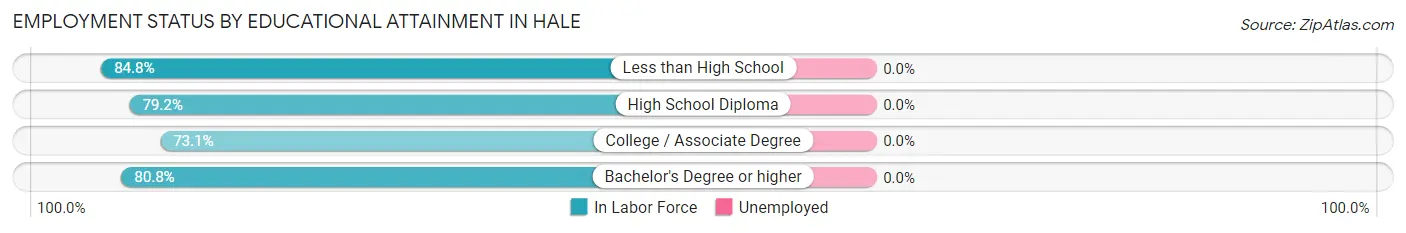
| Educational Attainment | In Labor Force | Unemployed |
| Less than High School | 28 (84.8%) | 0 (0.0%) |
| High School Diploma | 103 (79.2%) | 0 (0.0%) |
| College / Associate Degree | 38 (73.1%) | 0 (0.0%) |
| Bachelor's Degree or higher | 21 (80.8%) | 0 (0.0%) |
| Total | 190 (78.8%) | 0 (0.0%) |
Employment Occupations by Sex in Hale
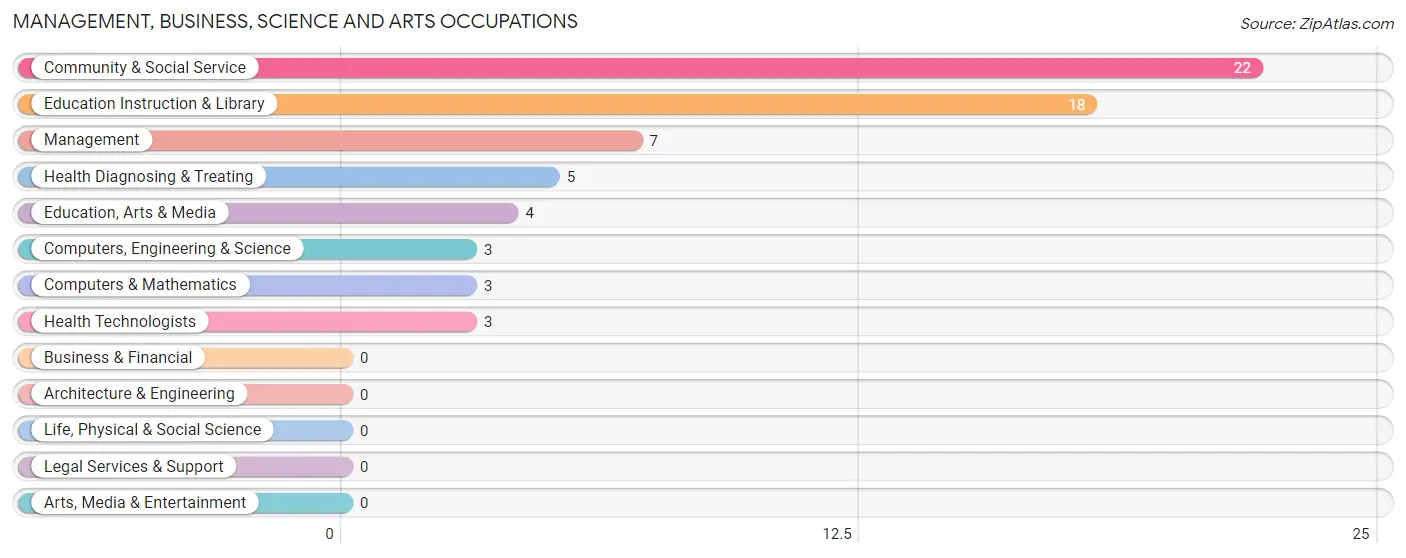
Management, Business, Science and Arts Occupations
The most common Management, Business, Science and Arts occupations in Hale are Community & Social Service (22 | 9.4%), Education Instruction & Library (18 | 7.7%), Management (7 | 3.0%), Health Diagnosing & Treating (5 | 2.1%), and Education, Arts & Media (4 | 1.7%).
Management, Business, Science and Arts Occupations by Sex
Within the Management, Business, Science and Arts occupations in Hale, the most male-oriented occupations are Computers, Engineering & Science (100.0%), Computers & Mathematics (100.0%), and Management (71.4%), while the most female-oriented occupations are Education, Arts & Media (100.0%), Community & Social Service (90.9%), and Education Instruction & Library (88.9%).
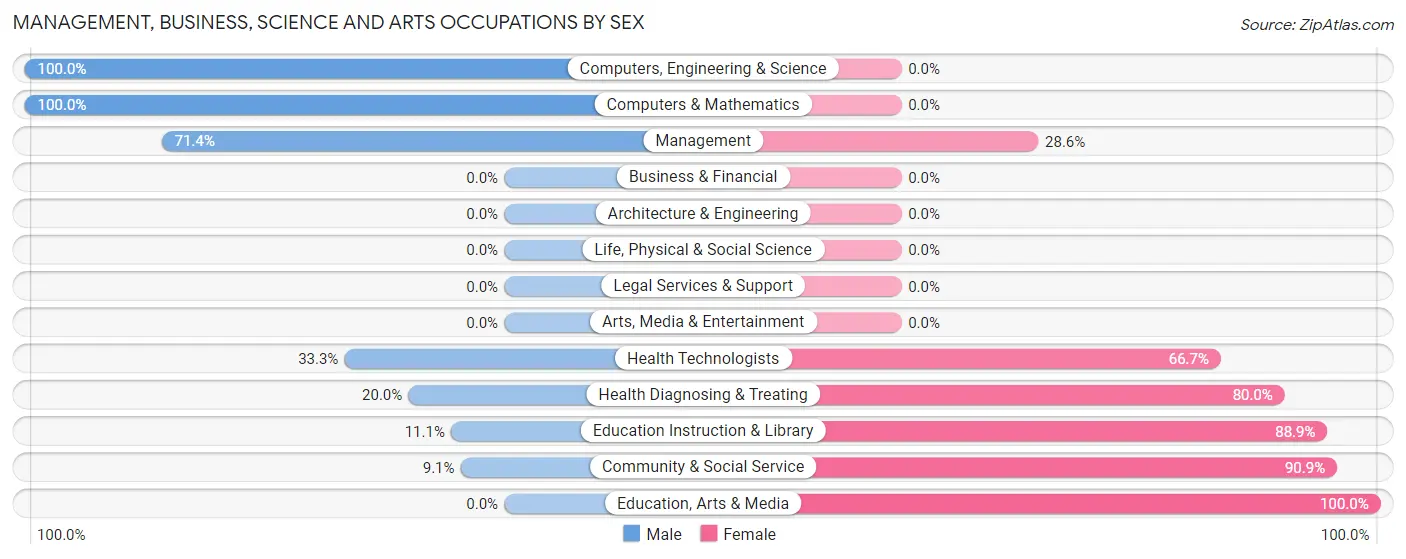
| Occupation | Male | Female |
| Management | 5 (71.4%) | 2 (28.6%) |
| Business & Financial | 0 (0.0%) | 0 (0.0%) |
| Computers, Engineering & Science | 3 (100.0%) | 0 (0.0%) |
| Computers & Mathematics | 3 (100.0%) | 0 (0.0%) |
| Architecture & Engineering | 0 (0.0%) | 0 (0.0%) |
| Life, Physical & Social Science | 0 (0.0%) | 0 (0.0%) |
| Community & Social Service | 2 (9.1%) | 20 (90.9%) |
| Education, Arts & Media | 0 (0.0%) | 4 (100.0%) |
| Legal Services & Support | 0 (0.0%) | 0 (0.0%) |
| Education Instruction & Library | 2 (11.1%) | 16 (88.9%) |
| Arts, Media & Entertainment | 0 (0.0%) | 0 (0.0%) |
| Health Diagnosing & Treating | 1 (20.0%) | 4 (80.0%) |
| Health Technologists | 1 (33.3%) | 2 (66.7%) |
| Total (Category) | 11 (29.7%) | 26 (70.3%) |
| Total (Overall) | 112 (48.1%) | 121 (51.9%) |
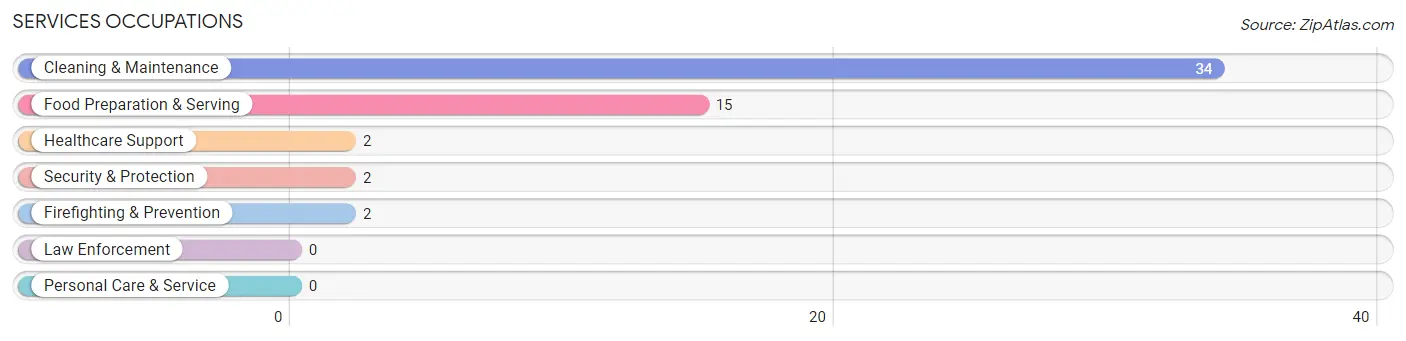
Services Occupations
The most common Services occupations in Hale are Cleaning & Maintenance (34 | 14.6%), Food Preparation & Serving (15 | 6.4%), Healthcare Support (2 | 0.9%), Security & Protection (2 | 0.9%), and Firefighting & Prevention (2 | 0.9%).
Services Occupations by Sex
Within the Services occupations in Hale, the most male-oriented occupations are Cleaning & Maintenance (100.0%), and Food Preparation & Serving (40.0%), while the most female-oriented occupations are Healthcare Support (100.0%), Security & Protection (100.0%), and Firefighting & Prevention (100.0%).
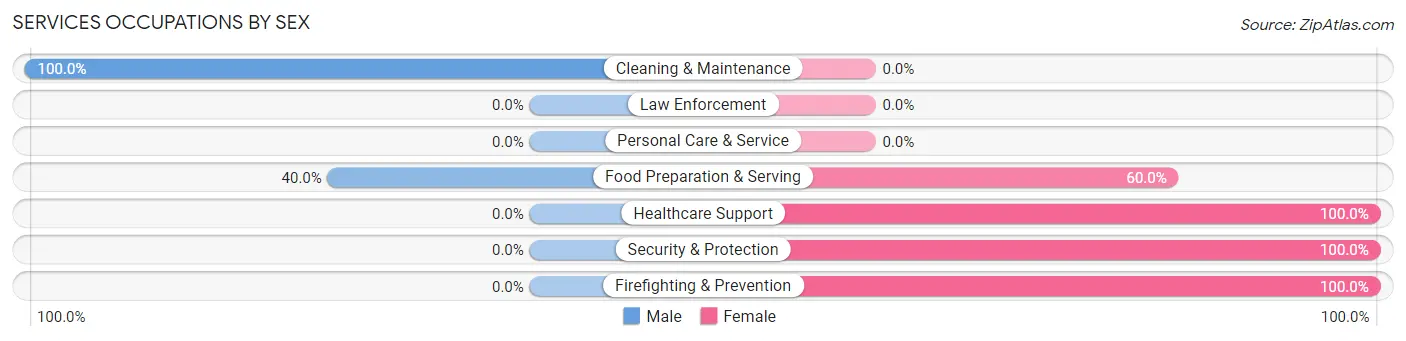
| Occupation | Male | Female |
| Healthcare Support | 0 (0.0%) | 2 (100.0%) |
| Security & Protection | 0 (0.0%) | 2 (100.0%) |
| Firefighting & Prevention | 0 (0.0%) | 2 (100.0%) |
| Law Enforcement | 0 (0.0%) | 0 (0.0%) |
| Food Preparation & Serving | 6 (40.0%) | 9 (60.0%) |
| Cleaning & Maintenance | 34 (100.0%) | 0 (0.0%) |
| Personal Care & Service | 0 (0.0%) | 0 (0.0%) |
| Total (Category) | 40 (75.5%) | 13 (24.5%) |
| Total (Overall) | 112 (48.1%) | 121 (51.9%) |
Sales and Office Occupations
The most common Sales and Office occupations in Hale are Sales & Related (32 | 13.7%), and Office & Administration (23 | 9.9%).

Sales and Office Occupations by Sex
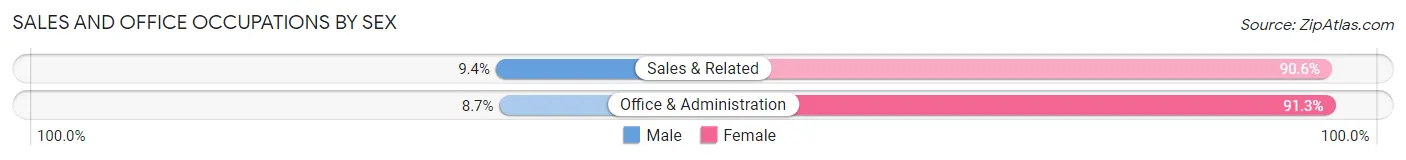
| Occupation | Male | Female |
| Sales & Related | 3 (9.4%) | 29 (90.6%) |
| Office & Administration | 2 (8.7%) | 21 (91.3%) |
| Total (Category) | 5 (9.1%) | 50 (90.9%) |
| Total (Overall) | 112 (48.1%) | 121 (51.9%) |
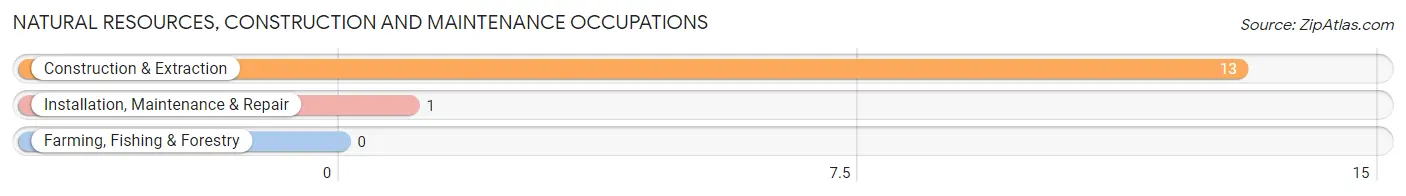
Natural Resources, Construction and Maintenance Occupations
The most common Natural Resources, Construction and Maintenance occupations in Hale are Construction & Extraction (13 | 5.6%), and Installation, Maintenance & Repair (1 | 0.4%).
Natural Resources, Construction and Maintenance Occupations by Sex
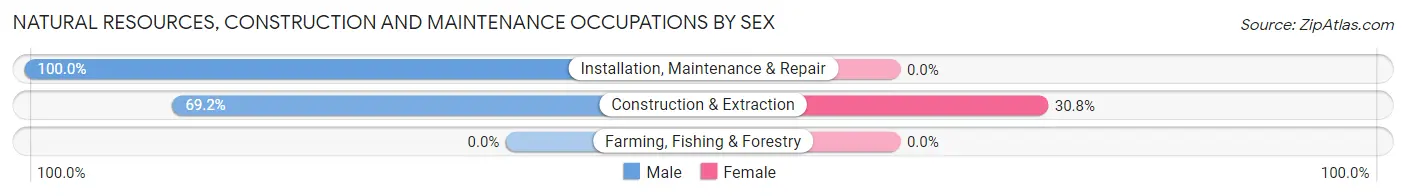
| Occupation | Male | Female |
| Farming, Fishing & Forestry | 0 (0.0%) | 0 (0.0%) |
| Construction & Extraction | 9 (69.2%) | 4 (30.8%) |
| Installation, Maintenance & Repair | 1 (100.0%) | 0 (0.0%) |
| Total (Category) | 10 (71.4%) | 4 (28.6%) |
| Total (Overall) | 112 (48.1%) | 121 (51.9%) |
Production, Transportation and Moving Occupations
The most common Production, Transportation and Moving occupations in Hale are Production (46 | 19.7%), Material Moving (15 | 6.4%), and Transportation (13 | 5.6%).
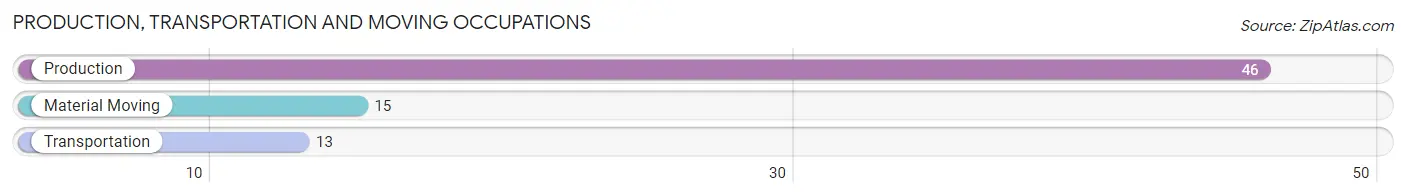
Production, Transportation and Moving Occupations by Sex
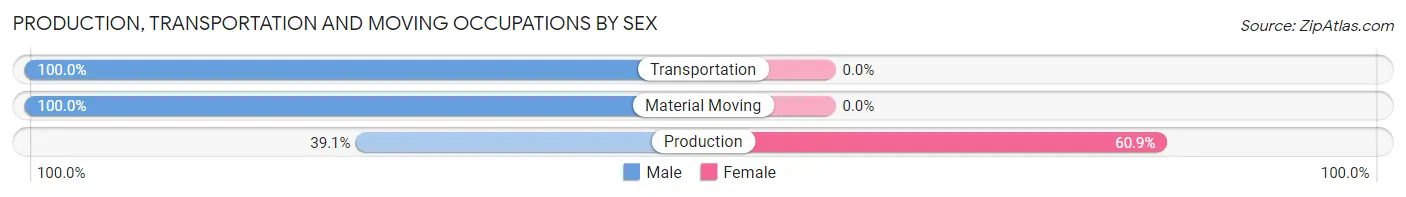
| Occupation | Male | Female |
| Production | 18 (39.1%) | 28 (60.9%) |
| Transportation | 13 (100.0%) | 0 (0.0%) |
| Material Moving | 15 (100.0%) | 0 (0.0%) |
| Total (Category) | 46 (62.2%) | 28 (37.8%) |
| Total (Overall) | 112 (48.1%) | 121 (51.9%) |
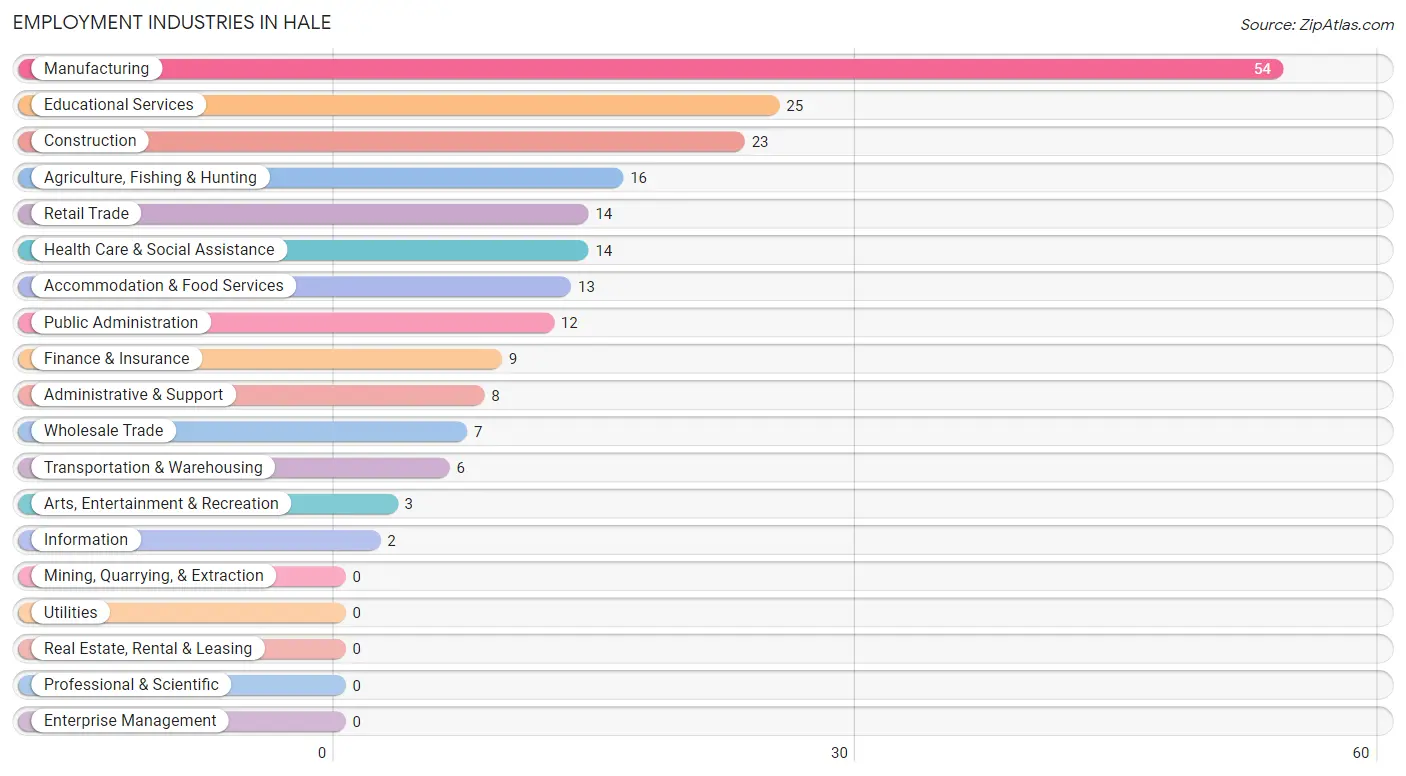
Employment Industries by Sex in Hale
Employment Industries in Hale
The major employment industries in Hale include Manufacturing (54 | 23.2%), Educational Services (25 | 10.7%), Construction (23 | 9.9%), Agriculture, Fishing & Hunting (16 | 6.9%), and Retail Trade (14 | 6.0%).
Employment Industries by Sex in Hale
The Hale industries that see more men than women are Agriculture, Fishing & Hunting (100.0%), Wholesale Trade (100.0%), and Information (100.0%), whereas the industries that tend to have a higher number of women are Finance & Insurance (100.0%), Health Care & Social Assistance (100.0%), and Arts, Entertainment & Recreation (100.0%).
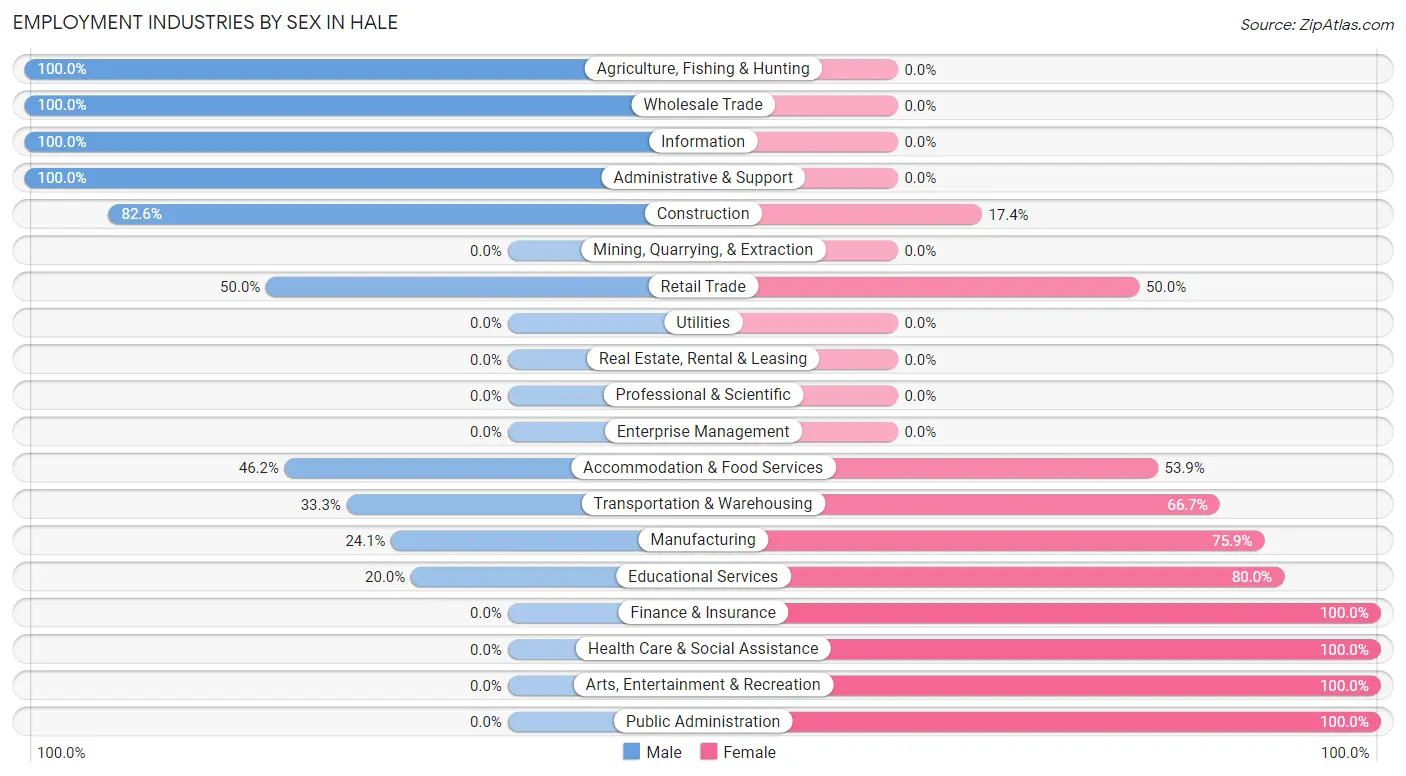
| Industry | Male | Female |
| Agriculture, Fishing & Hunting | 16 (100.0%) | 0 (0.0%) |
| Mining, Quarrying, & Extraction | 0 (0.0%) | 0 (0.0%) |
| Construction | 19 (82.6%) | 4 (17.4%) |
| Manufacturing | 13 (24.1%) | 41 (75.9%) |
| Wholesale Trade | 7 (100.0%) | 0 (0.0%) |
| Retail Trade | 7 (50.0%) | 7 (50.0%) |
| Transportation & Warehousing | 2 (33.3%) | 4 (66.7%) |
| Utilities | 0 (0.0%) | 0 (0.0%) |
| Information | 2 (100.0%) | 0 (0.0%) |
| Finance & Insurance | 0 (0.0%) | 9 (100.0%) |
| Real Estate, Rental & Leasing | 0 (0.0%) | 0 (0.0%) |
| Professional & Scientific | 0 (0.0%) | 0 (0.0%) |
| Enterprise Management | 0 (0.0%) | 0 (0.0%) |
| Administrative & Support | 8 (100.0%) | 0 (0.0%) |
| Educational Services | 5 (20.0%) | 20 (80.0%) |
| Health Care & Social Assistance | 0 (0.0%) | 14 (100.0%) |
| Arts, Entertainment & Recreation | 0 (0.0%) | 3 (100.0%) |
| Accommodation & Food Services | 6 (46.2%) | 7 (53.8%) |
| Public Administration | 0 (0.0%) | 12 (100.0%) |
| Total | 112 (48.1%) | 121 (51.9%) |
Education in Hale
School Enrollment in Hale
The most common levels of schooling among the 109 students in Hale are elementary school (32 | 29.4%), middle school (31 | 28.4%), and college / undergraduate (24 | 22.0%).
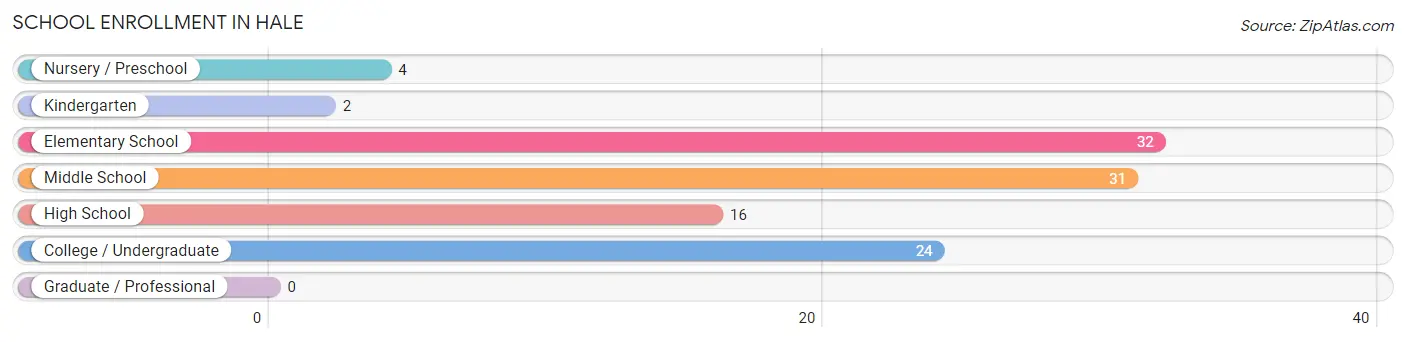
| School Level | # Students | % Students |
| Nursery / Preschool | 4 | 3.7% |
| Kindergarten | 2 | 1.8% |
| Elementary School | 32 | 29.4% |
| Middle School | 31 | 28.4% |
| High School | 16 | 14.7% |
| College / Undergraduate | 24 | 22.0% |
| Graduate / Professional | 0 | 0.0% |
| Total | 109 | 100.0% |
School Enrollment by Age by Funding Source in Hale
Out of a total of 109 students who are enrolled in schools in Hale, 5 (4.6%) attend a private institution, while the remaining 104 (95.4%) are enrolled in public schools. The age group of 3 to 4 year olds has the highest likelihood of being enrolled in private schools, with 3 (75.0% in the age bracket) enrolled. Conversely, the age group of 5 to 9 year old has the lowest likelihood of being enrolled in a private school, with 34 (100.0% in the age bracket) attending a public institution.
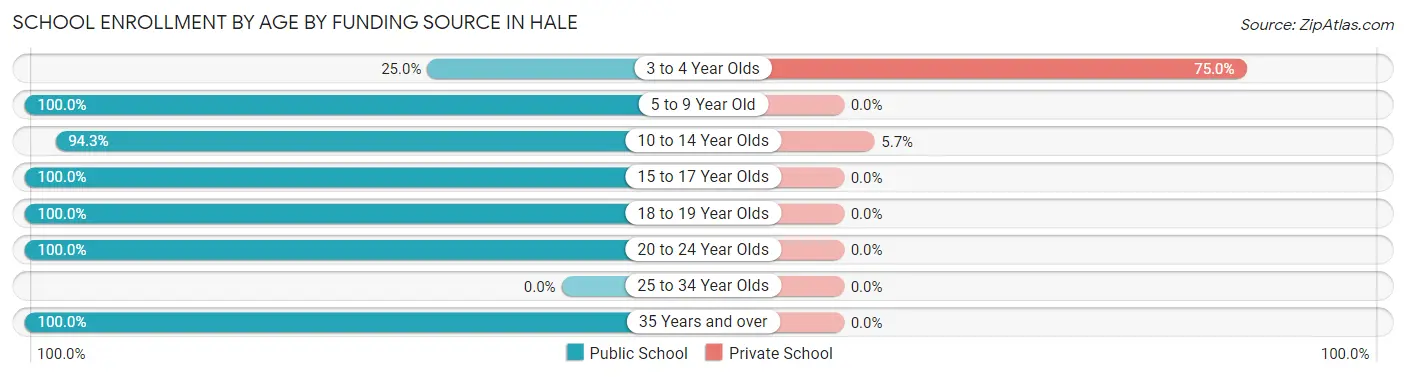
| Age Bracket | Public School | Private School |
| 3 to 4 Year Olds | 1 (25.0%) | 3 (75.0%) |
| 5 to 9 Year Old | 34 (100.0%) | 0 (0.0%) |
| 10 to 14 Year Olds | 33 (94.3%) | 2 (5.7%) |
| 15 to 17 Year Olds | 11 (100.0%) | 0 (0.0%) |
| 18 to 19 Year Olds | 17 (100.0%) | 0 (0.0%) |
| 20 to 24 Year Olds | 5 (100.0%) | 0 (0.0%) |
| 25 to 34 Year Olds | 0 (0.0%) | 0 (0.0%) |
| 35 Years and over | 3 (100.0%) | 0 (0.0%) |
| Total | 104 (95.4%) | 5 (4.6%) |
Educational Attainment by Field of Study in Hale
Education (16 | 43.2%), science & technology (13 | 35.1%), business (3 | 8.1%), arts & humanities (3 | 8.1%), and social sciences (1 | 2.7%) are the most common fields of study among 37 individuals in Hale who have obtained a bachelor's degree or higher.
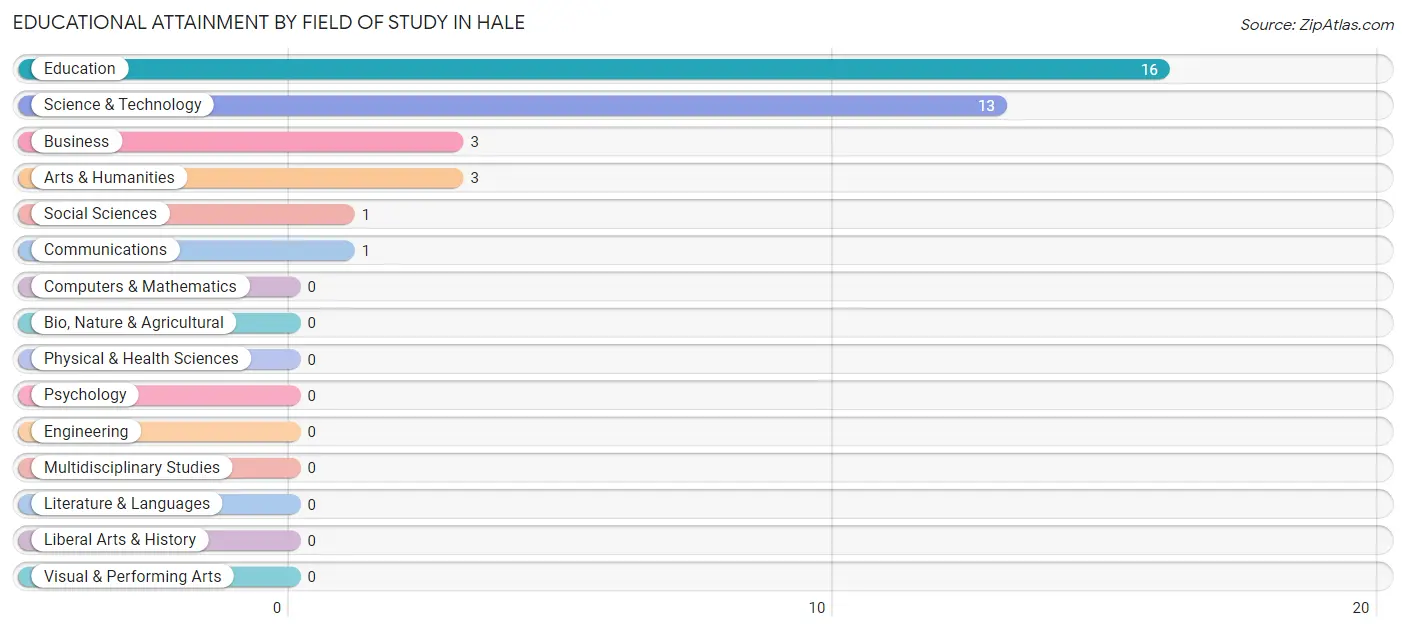
| Field of Study | # Graduates | % Graduates |
| Computers & Mathematics | 0 | 0.0% |
| Bio, Nature & Agricultural | 0 | 0.0% |
| Physical & Health Sciences | 0 | 0.0% |
| Psychology | 0 | 0.0% |
| Social Sciences | 1 | 2.7% |
| Engineering | 0 | 0.0% |
| Multidisciplinary Studies | 0 | 0.0% |
| Science & Technology | 13 | 35.1% |
| Business | 3 | 8.1% |
| Education | 16 | 43.2% |
| Literature & Languages | 0 | 0.0% |
| Liberal Arts & History | 0 | 0.0% |
| Visual & Performing Arts | 0 | 0.0% |
| Communications | 1 | 2.7% |
| Arts & Humanities | 3 | 8.1% |
| Total | 37 | 100.0% |
Transportation & Commute in Hale
Vehicle Availability by Sex in Hale
The most prevalent vehicle ownership categories in Hale are males with 4 vehicles (39, accounting for 34.8%) and females with 4 vehicles (38, making up 32.2%).
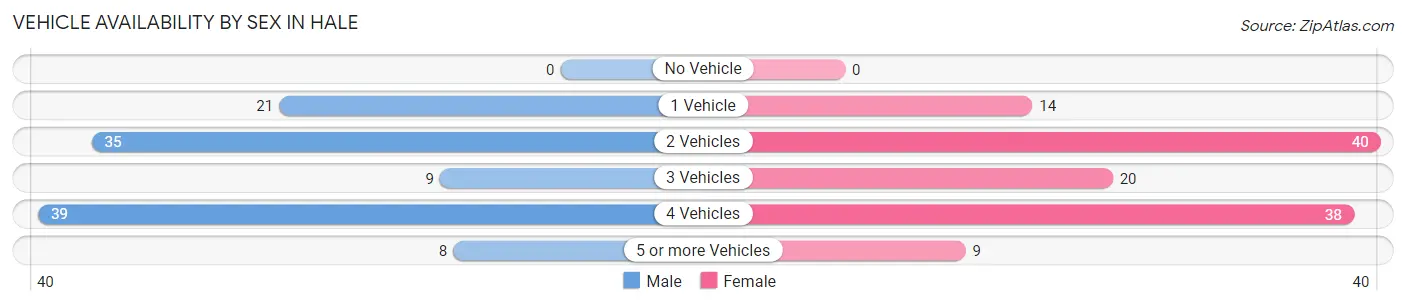
| Vehicles Available | Male | Female |
| No Vehicle | 0 (0.0%) | 0 (0.0%) |
| 1 Vehicle | 21 (18.8%) | 14 (11.6%) |
| 2 Vehicles | 35 (31.2%) | 40 (33.1%) |
| 3 Vehicles | 9 (8.0%) | 20 (16.5%) |
| 4 Vehicles | 39 (34.8%) | 38 (31.4%) |
| 5 or more Vehicles | 8 (7.1%) | 9 (7.4%) |
| Total | 112 (100.0%) | 121 (100.0%) |
Commute Time in Hale
The most frequently occuring commute durations in Hale are 30 to 34 minutes (62 commuters, 29.5%), 5 to 9 minutes (30 commuters, 14.3%), and 20 to 24 minutes (27 commuters, 12.9%).
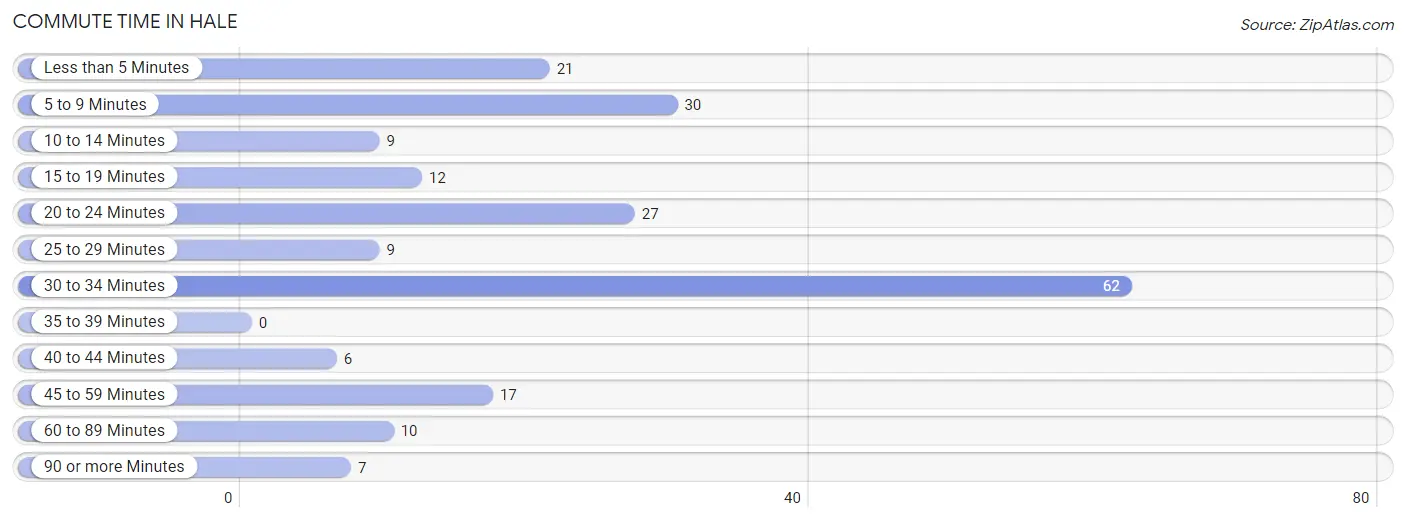
| Commute Time | # Commuters | % Commuters |
| Less than 5 Minutes | 21 | 10.0% |
| 5 to 9 Minutes | 30 | 14.3% |
| 10 to 14 Minutes | 9 | 4.3% |
| 15 to 19 Minutes | 12 | 5.7% |
| 20 to 24 Minutes | 27 | 12.9% |
| 25 to 29 Minutes | 9 | 4.3% |
| 30 to 34 Minutes | 62 | 29.5% |
| 35 to 39 Minutes | 0 | 0.0% |
| 40 to 44 Minutes | 6 | 2.9% |
| 45 to 59 Minutes | 17 | 8.1% |
| 60 to 89 Minutes | 10 | 4.8% |
| 90 or more Minutes | 7 | 3.3% |
Commute Time by Sex in Hale
The most common commute times in Hale are 5 to 9 minutes (30 commuters, 30.9%) for males and 30 to 34 minutes (40 commuters, 35.4%) for females.
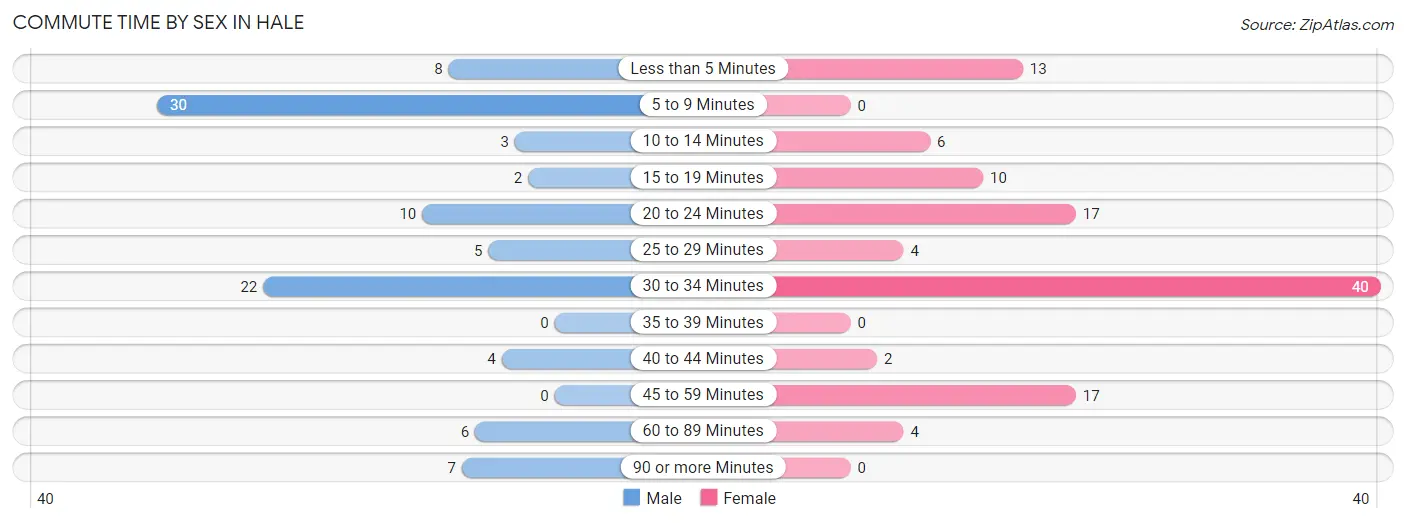
| Commute Time | Male | Female |
| Less than 5 Minutes | 8 (8.3%) | 13 (11.5%) |
| 5 to 9 Minutes | 30 (30.9%) | 0 (0.0%) |
| 10 to 14 Minutes | 3 (3.1%) | 6 (5.3%) |
| 15 to 19 Minutes | 2 (2.1%) | 10 (8.8%) |
| 20 to 24 Minutes | 10 (10.3%) | 17 (15.0%) |
| 25 to 29 Minutes | 5 (5.1%) | 4 (3.5%) |
| 30 to 34 Minutes | 22 (22.7%) | 40 (35.4%) |
| 35 to 39 Minutes | 0 (0.0%) | 0 (0.0%) |
| 40 to 44 Minutes | 4 (4.1%) | 2 (1.8%) |
| 45 to 59 Minutes | 0 (0.0%) | 17 (15.0%) |
| 60 to 89 Minutes | 6 (6.2%) | 4 (3.5%) |
| 90 or more Minutes | 7 (7.2%) | 0 (0.0%) |
Time of Departure to Work by Sex in Hale
The most frequent times of departure to work in Hale are 6:30 AM to 6:59 AM (32, 33.0%) for males and 8:00 AM to 8:29 AM (25, 22.1%) for females.
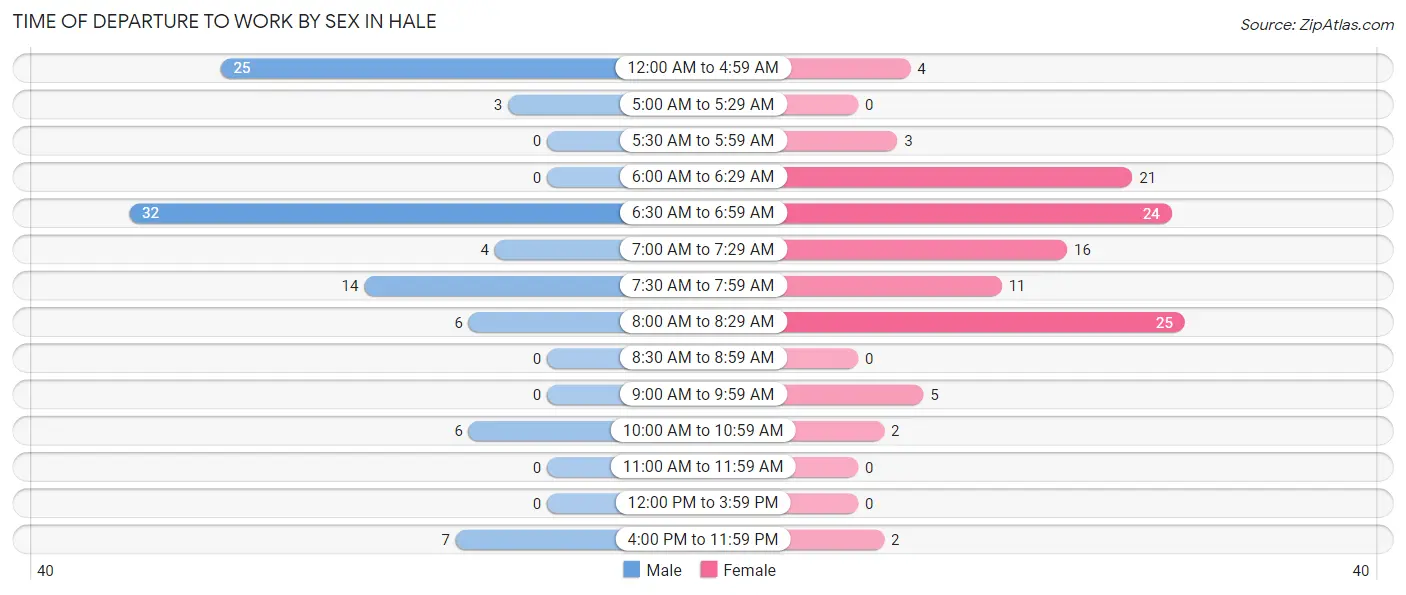
| Time of Departure | Male | Female |
| 12:00 AM to 4:59 AM | 25 (25.8%) | 4 (3.5%) |
| 5:00 AM to 5:29 AM | 3 (3.1%) | 0 (0.0%) |
| 5:30 AM to 5:59 AM | 0 (0.0%) | 3 (2.6%) |
| 6:00 AM to 6:29 AM | 0 (0.0%) | 21 (18.6%) |
| 6:30 AM to 6:59 AM | 32 (33.0%) | 24 (21.2%) |
| 7:00 AM to 7:29 AM | 4 (4.1%) | 16 (14.2%) |
| 7:30 AM to 7:59 AM | 14 (14.4%) | 11 (9.7%) |
| 8:00 AM to 8:29 AM | 6 (6.2%) | 25 (22.1%) |
| 8:30 AM to 8:59 AM | 0 (0.0%) | 0 (0.0%) |
| 9:00 AM to 9:59 AM | 0 (0.0%) | 5 (4.4%) |
| 10:00 AM to 10:59 AM | 6 (6.2%) | 2 (1.8%) |
| 11:00 AM to 11:59 AM | 0 (0.0%) | 0 (0.0%) |
| 12:00 PM to 3:59 PM | 0 (0.0%) | 0 (0.0%) |
| 4:00 PM to 11:59 PM | 7 (7.2%) | 2 (1.8%) |
| Total | 97 (100.0%) | 113 (100.0%) |
Housing Occupancy in Hale
Occupancy by Ownership in Hale
Of the total 212 dwellings in Hale, owner-occupied units account for 149 (70.3%), while renter-occupied units make up 63 (29.7%).
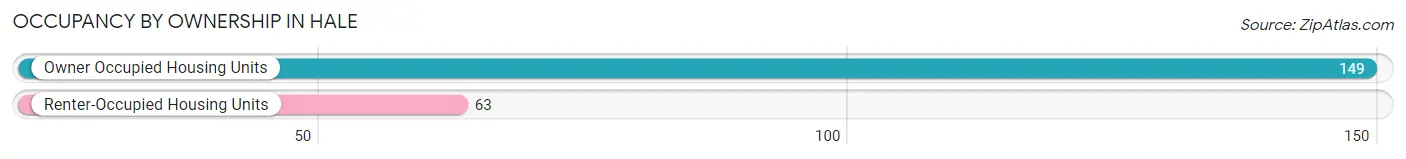
| Occupancy | # Housing Units | % Housing Units |
| Owner Occupied Housing Units | 149 | 70.3% |
| Renter-Occupied Housing Units | 63 | 29.7% |
| Total Occupied Housing Units | 212 | 100.0% |
Occupancy by Household Size in Hale
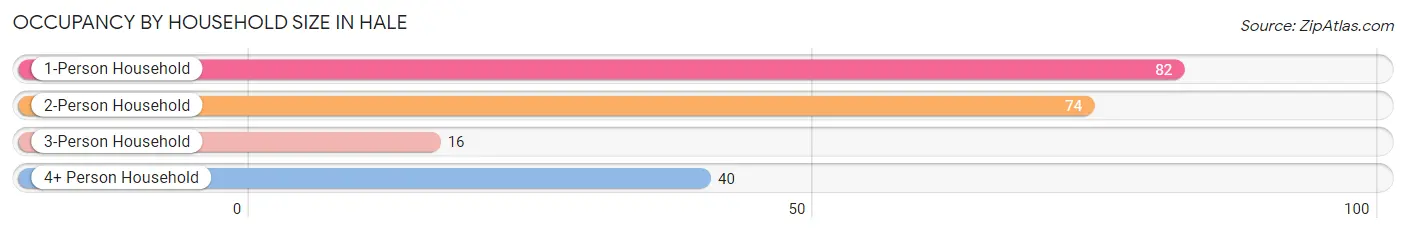
| Household Size | # Housing Units | % Housing Units |
| 1-Person Household | 82 | 38.7% |
| 2-Person Household | 74 | 34.9% |
| 3-Person Household | 16 | 7.5% |
| 4+ Person Household | 40 | 18.9% |
| Total Housing Units | 212 | 100.0% |
Occupancy by Ownership by Household Size in Hale
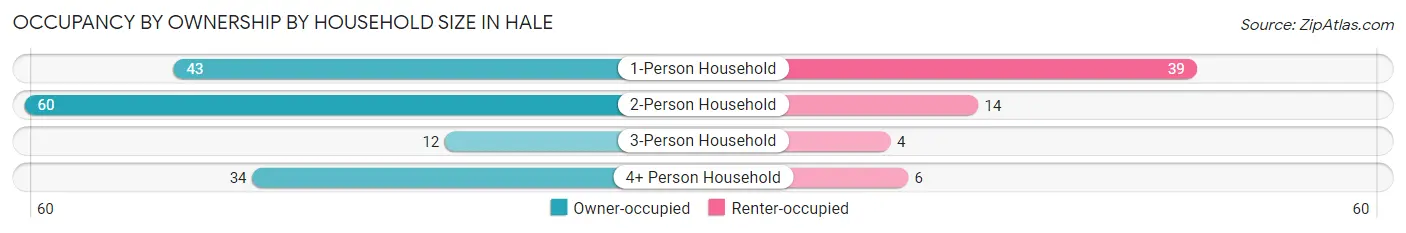
| Household Size | Owner-occupied | Renter-occupied |
| 1-Person Household | 43 (52.4%) | 39 (47.6%) |
| 2-Person Household | 60 (81.1%) | 14 (18.9%) |
| 3-Person Household | 12 (75.0%) | 4 (25.0%) |
| 4+ Person Household | 34 (85.0%) | 6 (15.0%) |
| Total Housing Units | 149 (70.3%) | 63 (29.7%) |
Occupancy by Educational Attainment in Hale
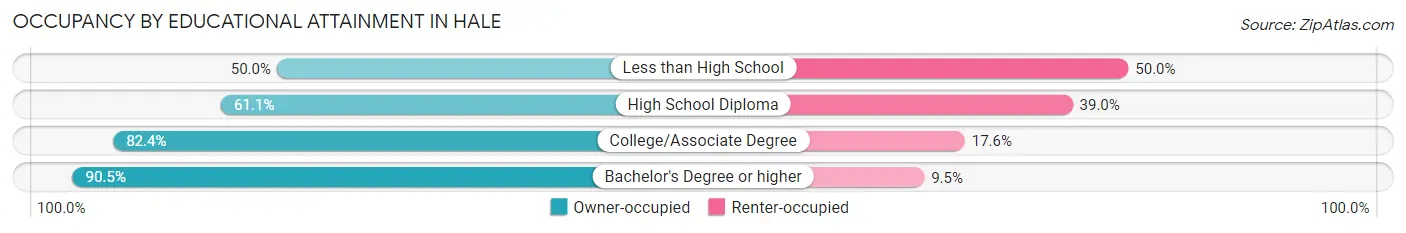
| Household Size | Owner-occupied | Renter-occupied |
| Less than High School | 11 (50.0%) | 11 (50.0%) |
| High School Diploma | 58 (61.1%) | 37 (39.0%) |
| College/Associate Degree | 61 (82.4%) | 13 (17.6%) |
| Bachelor's Degree or higher | 19 (90.5%) | 2 (9.5%) |
Occupancy by Age of Householder in Hale
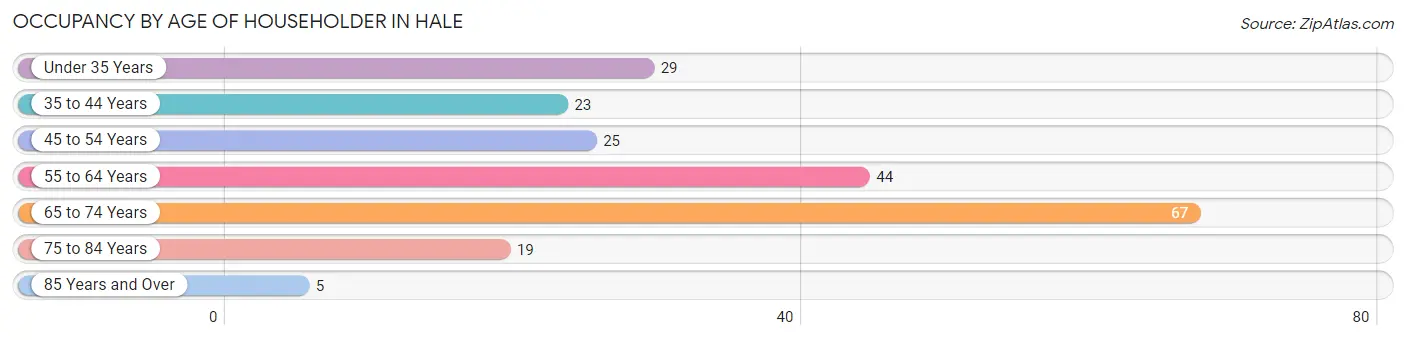
| Age Bracket | # Households | % Households |
| Under 35 Years | 29 | 13.7% |
| 35 to 44 Years | 23 | 10.8% |
| 45 to 54 Years | 25 | 11.8% |
| 55 to 64 Years | 44 | 20.7% |
| 65 to 74 Years | 67 | 31.6% |
| 75 to 84 Years | 19 | 9.0% |
| 85 Years and Over | 5 | 2.4% |
| Total | 212 | 100.0% |
Housing Finances in Hale
Median Income by Occupancy in Hale
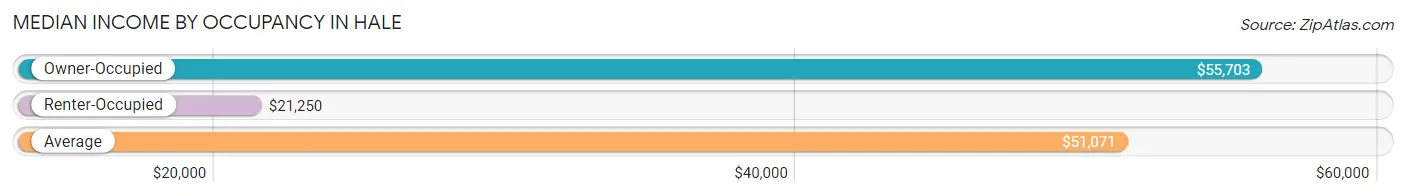
| Occupancy Type | # Households | Median Income |
| Owner-Occupied | 149 (70.3%) | $55,703 |
| Renter-Occupied | 63 (29.7%) | $21,250 |
| Average | 212 (100.0%) | $51,071 |
Occupancy by Householder Income Bracket in Hale
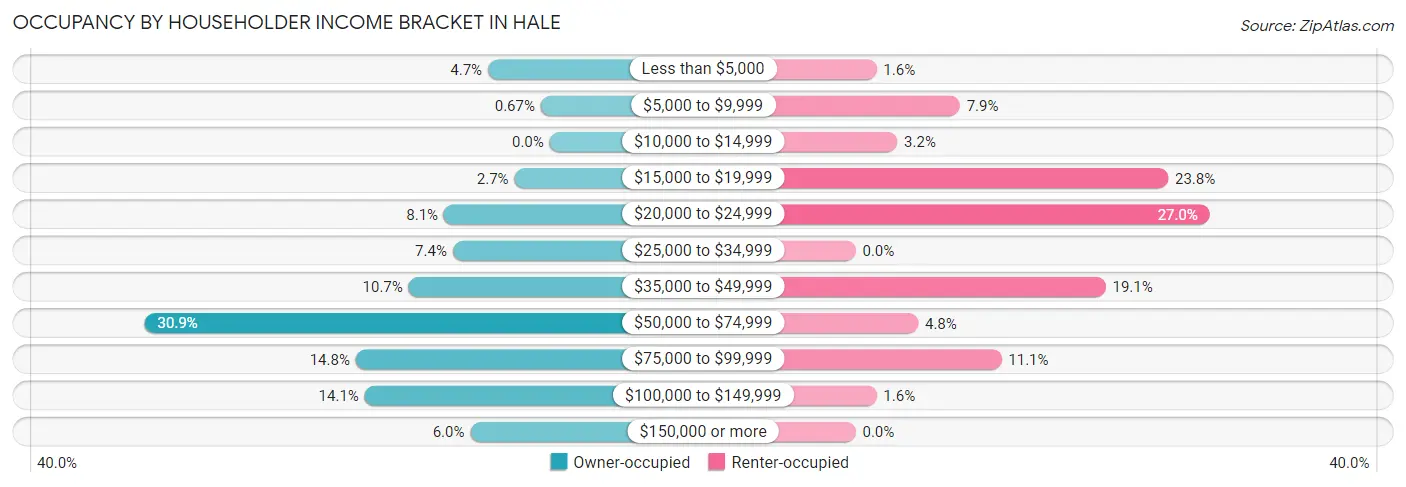
| Income Bracket | Owner-occupied | Renter-occupied |
| Less than $5,000 | 7 (4.7%) | 1 (1.6%) |
| $5,000 to $9,999 | 1 (0.7%) | 5 (7.9%) |
| $10,000 to $14,999 | 0 (0.0%) | 2 (3.2%) |
| $15,000 to $19,999 | 4 (2.7%) | 15 (23.8%) |
| $20,000 to $24,999 | 12 (8.1%) | 17 (27.0%) |
| $25,000 to $34,999 | 11 (7.4%) | 0 (0.0%) |
| $35,000 to $49,999 | 16 (10.7%) | 12 (19.1%) |
| $50,000 to $74,999 | 46 (30.9%) | 3 (4.8%) |
| $75,000 to $99,999 | 22 (14.8%) | 7 (11.1%) |
| $100,000 to $149,999 | 21 (14.1%) | 1 (1.6%) |
| $150,000 or more | 9 (6.0%) | 0 (0.0%) |
| Total | 149 (100.0%) | 63 (100.0%) |
Monthly Housing Cost Tiers in Hale
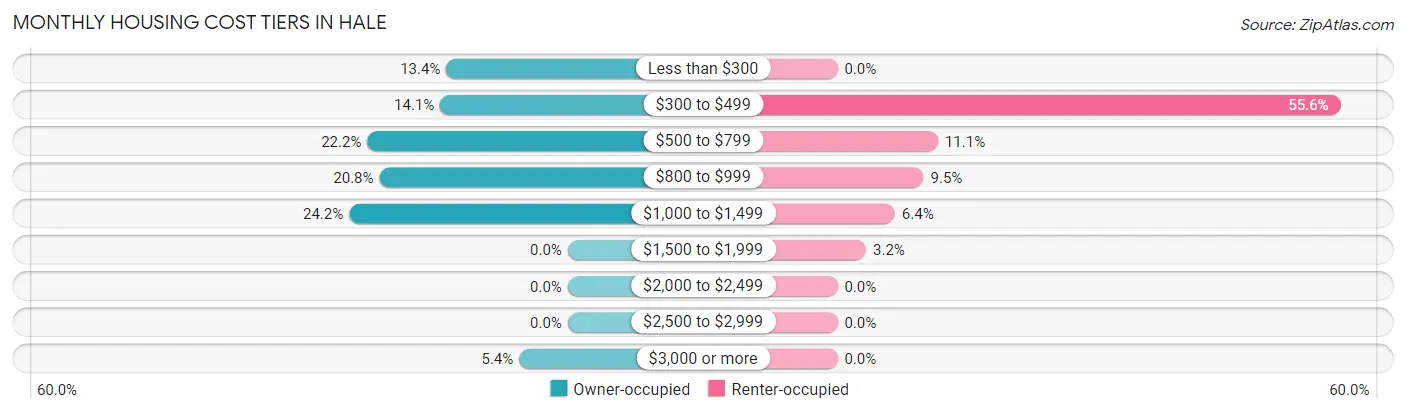
| Monthly Cost | Owner-occupied | Renter-occupied |
| Less than $300 | 20 (13.4%) | 0 (0.0%) |
| $300 to $499 | 21 (14.1%) | 35 (55.6%) |
| $500 to $799 | 33 (22.2%) | 7 (11.1%) |
| $800 to $999 | 31 (20.8%) | 6 (9.5%) |
| $1,000 to $1,499 | 36 (24.2%) | 4 (6.4%) |
| $1,500 to $1,999 | 0 (0.0%) | 2 (3.2%) |
| $2,000 to $2,499 | 0 (0.0%) | 0 (0.0%) |
| $2,500 to $2,999 | 0 (0.0%) | 0 (0.0%) |
| $3,000 or more | 8 (5.4%) | 0 (0.0%) |
| Total | 149 (100.0%) | 63 (100.0%) |
Physical Housing Characteristics in Hale
Housing Structures in Hale
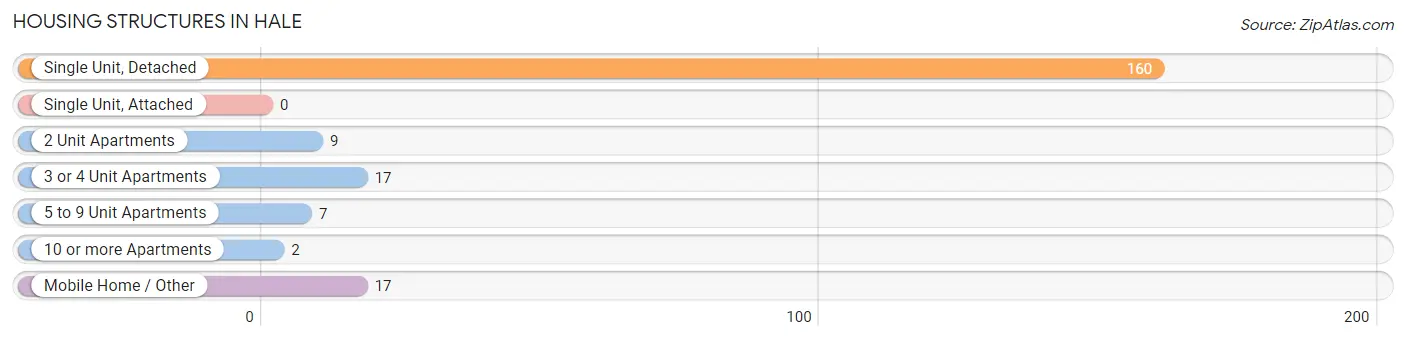
| Structure Type | # Housing Units | % Housing Units |
| Single Unit, Detached | 160 | 75.5% |
| Single Unit, Attached | 0 | 0.0% |
| 2 Unit Apartments | 9 | 4.3% |
| 3 or 4 Unit Apartments | 17 | 8.0% |
| 5 to 9 Unit Apartments | 7 | 3.3% |
| 10 or more Apartments | 2 | 0.9% |
| Mobile Home / Other | 17 | 8.0% |
| Total | 212 | 100.0% |
Housing Structures by Occupancy in Hale
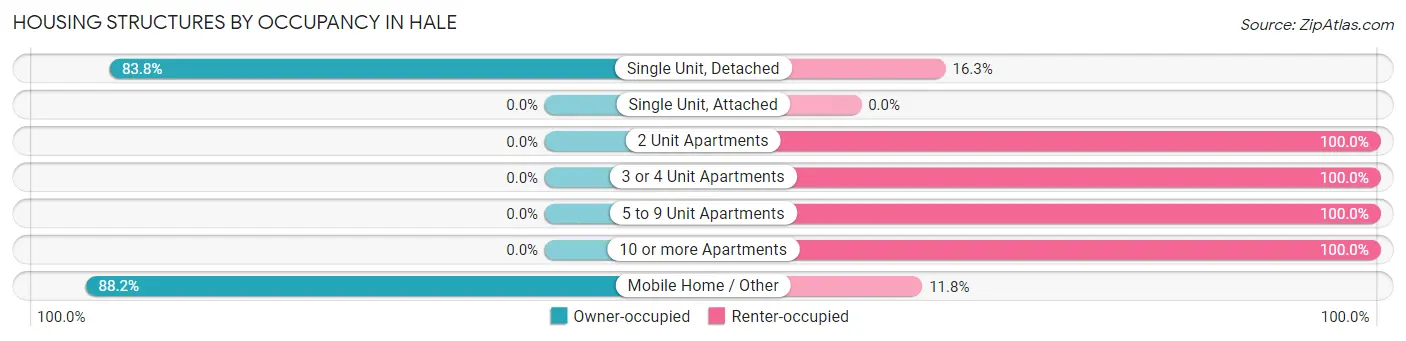
| Structure Type | Owner-occupied | Renter-occupied |
| Single Unit, Detached | 134 (83.8%) | 26 (16.3%) |
| Single Unit, Attached | 0 (0.0%) | 0 (0.0%) |
| 2 Unit Apartments | 0 (0.0%) | 9 (100.0%) |
| 3 or 4 Unit Apartments | 0 (0.0%) | 17 (100.0%) |
| 5 to 9 Unit Apartments | 0 (0.0%) | 7 (100.0%) |
| 10 or more Apartments | 0 (0.0%) | 2 (100.0%) |
| Mobile Home / Other | 15 (88.2%) | 2 (11.8%) |
| Total | 149 (70.3%) | 63 (29.7%) |
Housing Structures by Number of Rooms in Hale
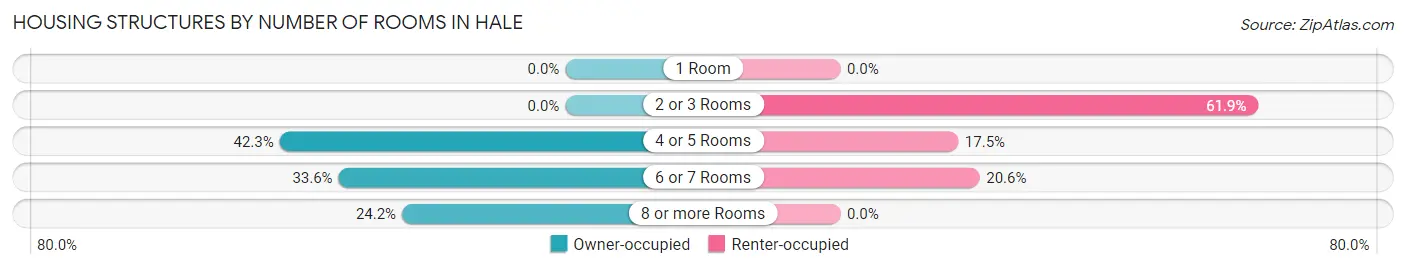
| Number of Rooms | Owner-occupied | Renter-occupied |
| 1 Room | 0 (0.0%) | 0 (0.0%) |
| 2 or 3 Rooms | 0 (0.0%) | 39 (61.9%) |
| 4 or 5 Rooms | 63 (42.3%) | 11 (17.5%) |
| 6 or 7 Rooms | 50 (33.6%) | 13 (20.6%) |
| 8 or more Rooms | 36 (24.2%) | 0 (0.0%) |
| Total | 149 (100.0%) | 63 (100.0%) |
Housing Structure by Heating Type in Hale
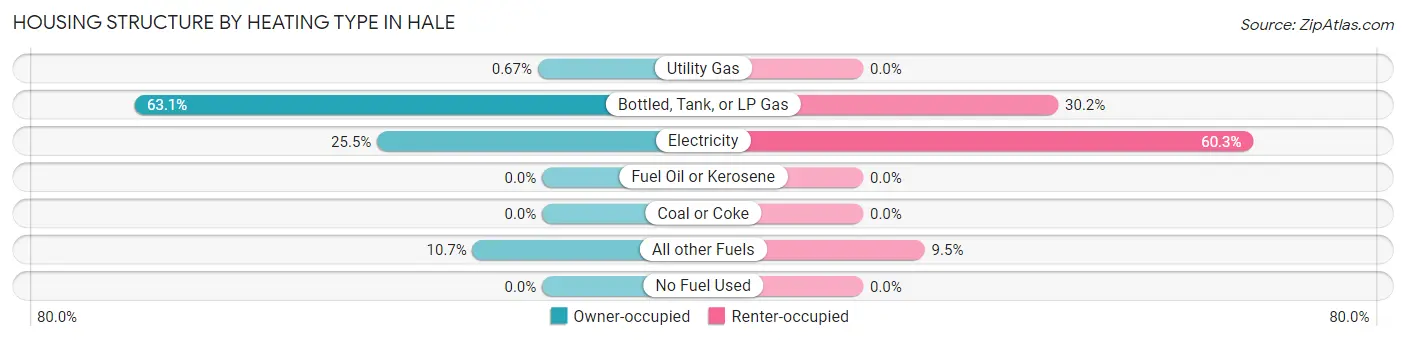
| Heating Type | Owner-occupied | Renter-occupied |
| Utility Gas | 1 (0.7%) | 0 (0.0%) |
| Bottled, Tank, or LP Gas | 94 (63.1%) | 19 (30.2%) |
| Electricity | 38 (25.5%) | 38 (60.3%) |
| Fuel Oil or Kerosene | 0 (0.0%) | 0 (0.0%) |
| Coal or Coke | 0 (0.0%) | 0 (0.0%) |
| All other Fuels | 16 (10.7%) | 6 (9.5%) |
| No Fuel Used | 0 (0.0%) | 0 (0.0%) |
| Total | 149 (100.0%) | 63 (100.0%) |
Household Vehicle Usage in Hale
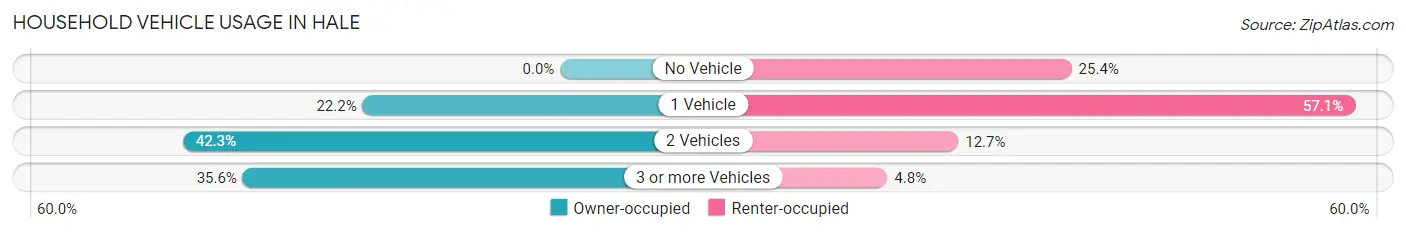
| Vehicles per Household | Owner-occupied | Renter-occupied |
| No Vehicle | 0 (0.0%) | 16 (25.4%) |
| 1 Vehicle | 33 (22.2%) | 36 (57.1%) |
| 2 Vehicles | 63 (42.3%) | 8 (12.7%) |
| 3 or more Vehicles | 53 (35.6%) | 3 (4.8%) |
| Total | 149 (100.0%) | 63 (100.0%) |
Real Estate & Mortgages in Hale
Real Estate and Mortgage Overview in Hale
| Characteristic | Without Mortgage | With Mortgage |
| Housing Units | 65 | 84 |
| Median Property Value | $71,900 | $90,000 |
| Median Household Income | $53,875 | $4 |
| Monthly Housing Costs | $519 | $0 |
| Real Estate Taxes | $675 | $0 |
Property Value by Mortgage Status in Hale
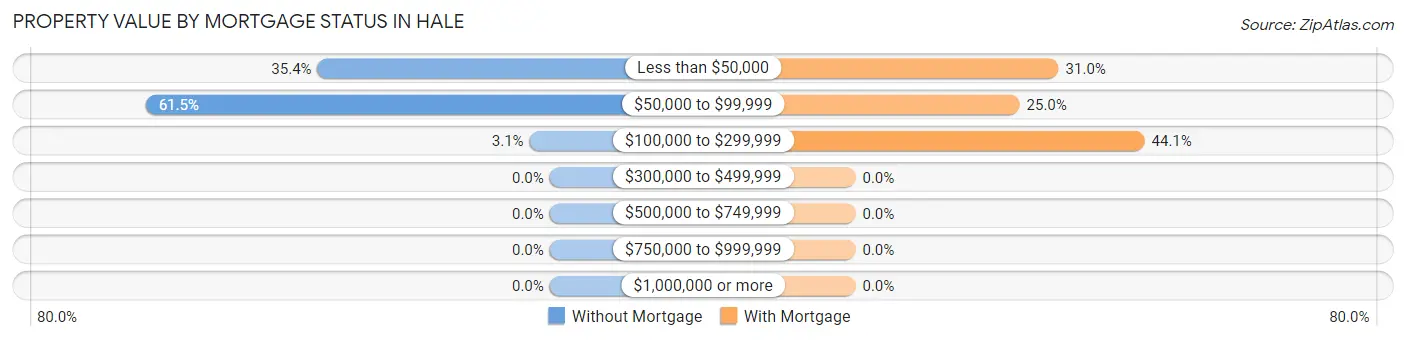
| Property Value | Without Mortgage | With Mortgage |
| Less than $50,000 | 23 (35.4%) | 26 (30.9%) |
| $50,000 to $99,999 | 40 (61.5%) | 21 (25.0%) |
| $100,000 to $299,999 | 2 (3.1%) | 37 (44.1%) |
| $300,000 to $499,999 | 0 (0.0%) | 0 (0.0%) |
| $500,000 to $749,999 | 0 (0.0%) | 0 (0.0%) |
| $750,000 to $999,999 | 0 (0.0%) | 0 (0.0%) |
| $1,000,000 or more | 0 (0.0%) | 0 (0.0%) |
| Total | 65 (100.0%) | 84 (100.0%) |
Household Income by Mortgage Status in Hale
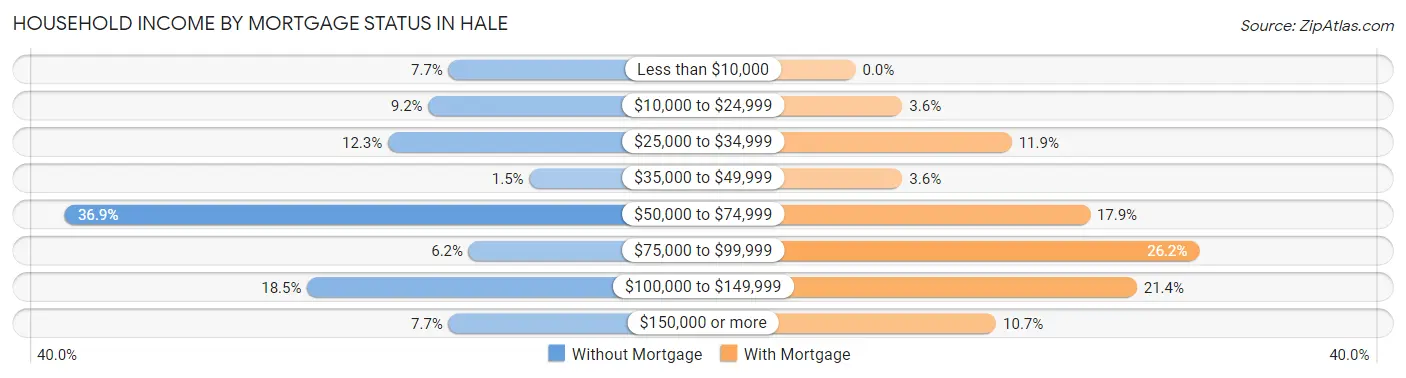
| Household Income | Without Mortgage | With Mortgage |
| Less than $10,000 | 5 (7.7%) | 0 (0.0%) |
| $10,000 to $24,999 | 6 (9.2%) | 3 (3.6%) |
| $25,000 to $34,999 | 8 (12.3%) | 10 (11.9%) |
| $35,000 to $49,999 | 1 (1.5%) | 3 (3.6%) |
| $50,000 to $74,999 | 24 (36.9%) | 15 (17.9%) |
| $75,000 to $99,999 | 4 (6.1%) | 22 (26.2%) |
| $100,000 to $149,999 | 12 (18.5%) | 18 (21.4%) |
| $150,000 or more | 5 (7.7%) | 9 (10.7%) |
| Total | 65 (100.0%) | 84 (100.0%) |
Property Value to Household Income Ratio in Hale
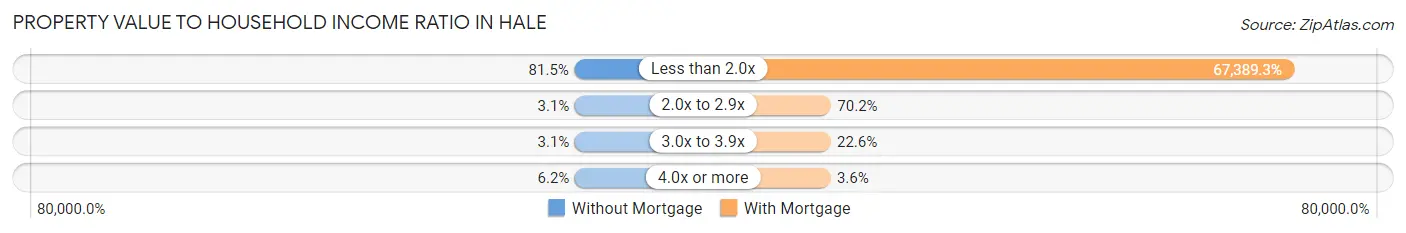
| Value-to-Income Ratio | Without Mortgage | With Mortgage |
| Less than 2.0x | 53 (81.5%) | 56,607 (67,389.3%) |
| 2.0x to 2.9x | 2 (3.1%) | 59 (70.2%) |
| 3.0x to 3.9x | 2 (3.1%) | 19 (22.6%) |
| 4.0x or more | 4 (6.1%) | 3 (3.6%) |
| Total | 65 (100.0%) | 84 (100.0%) |
Real Estate Taxes by Mortgage Status in Hale
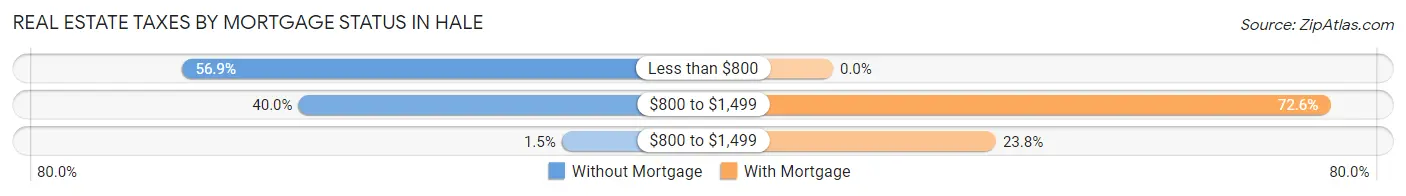
| Property Taxes | Without Mortgage | With Mortgage |
| Less than $800 | 37 (56.9%) | 0 (0.0%) |
| $800 to $1,499 | 26 (40.0%) | 61 (72.6%) |
| $800 to $1,499 | 1 (1.5%) | 20 (23.8%) |
| Total | 65 (100.0%) | 84 (100.0%) |
Health & Disability in Hale
Health Insurance Coverage by Age in Hale
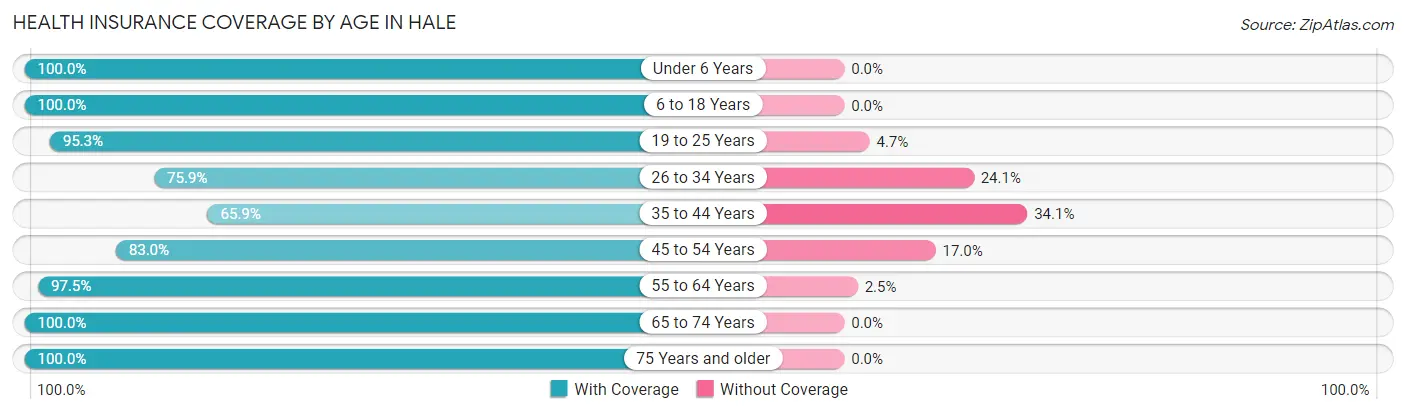
| Age Bracket | With Coverage | Without Coverage |
| Under 6 Years | 9 (100.0%) | 0 (0.0%) |
| 6 to 18 Years | 90 (100.0%) | 0 (0.0%) |
| 19 to 25 Years | 81 (95.3%) | 4 (4.7%) |
| 26 to 34 Years | 22 (75.9%) | 7 (24.1%) |
| 35 to 44 Years | 56 (65.9%) | 29 (34.1%) |
| 45 to 54 Years | 39 (83.0%) | 8 (17.0%) |
| 55 to 64 Years | 78 (97.5%) | 2 (2.5%) |
| 65 to 74 Years | 88 (100.0%) | 0 (0.0%) |
| 75 Years and older | 30 (100.0%) | 0 (0.0%) |
| Total | 493 (90.8%) | 50 (9.2%) |
Health Insurance Coverage by Citizenship Status in Hale
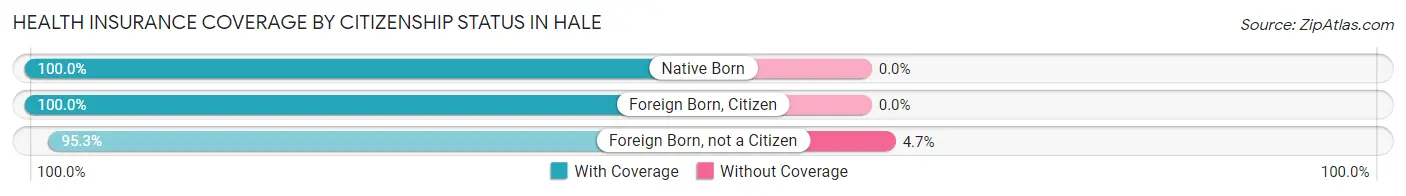
| Citizenship Status | With Coverage | Without Coverage |
| Native Born | 9 (100.0%) | 0 (0.0%) |
| Foreign Born, Citizen | 90 (100.0%) | 0 (0.0%) |
| Foreign Born, not a Citizen | 81 (95.3%) | 4 (4.7%) |
Health Insurance Coverage by Household Income in Hale
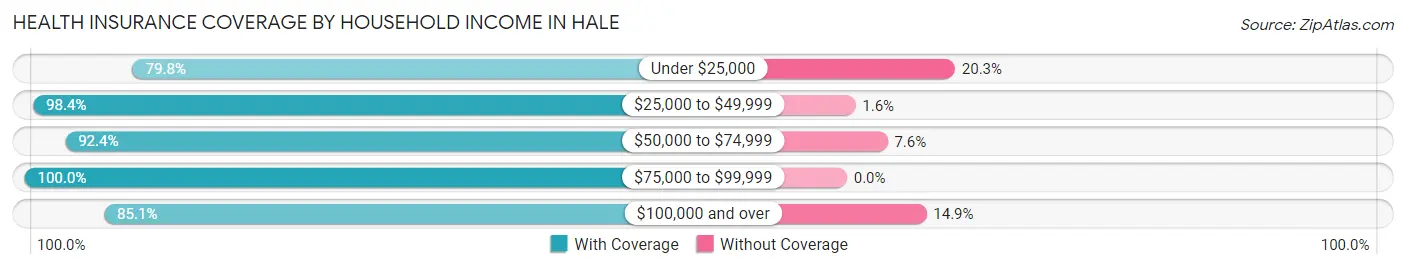
| Household Income | With Coverage | Without Coverage |
| Under $25,000 | 63 (79.7%) | 16 (20.3%) |
| $25,000 to $49,999 | 122 (98.4%) | 2 (1.6%) |
| $50,000 to $74,999 | 97 (92.4%) | 8 (7.6%) |
| $75,000 to $99,999 | 74 (100.0%) | 0 (0.0%) |
| $100,000 and over | 137 (85.1%) | 24 (14.9%) |
Public vs Private Health Insurance Coverage by Age in Hale
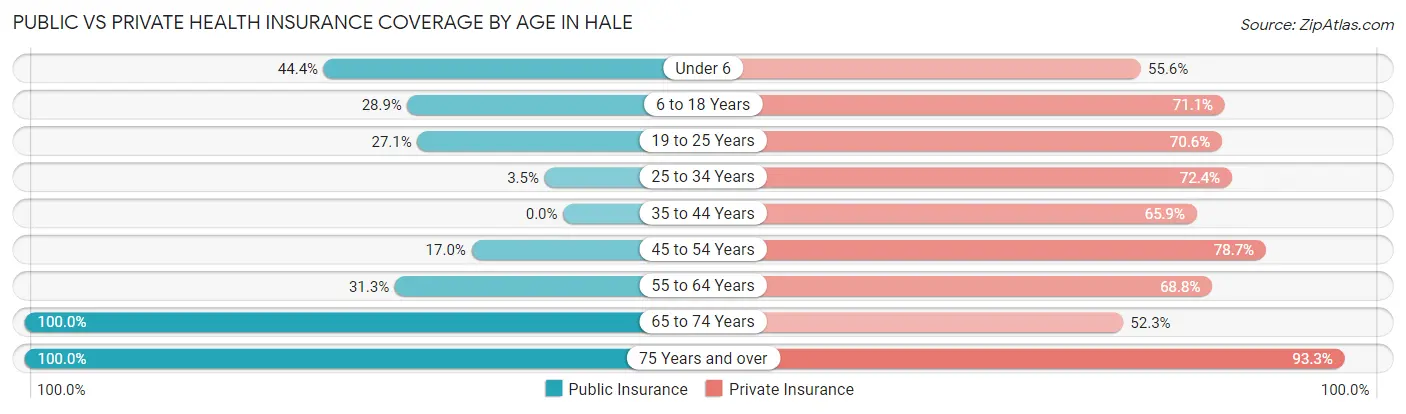
| Age Bracket | Public Insurance | Private Insurance |
| Under 6 | 4 (44.4%) | 5 (55.6%) |
| 6 to 18 Years | 26 (28.9%) | 64 (71.1%) |
| 19 to 25 Years | 23 (27.1%) | 60 (70.6%) |
| 25 to 34 Years | 1 (3.5%) | 21 (72.4%) |
| 35 to 44 Years | 0 (0.0%) | 56 (65.9%) |
| 45 to 54 Years | 8 (17.0%) | 37 (78.7%) |
| 55 to 64 Years | 25 (31.2%) | 55 (68.8%) |
| 65 to 74 Years | 88 (100.0%) | 46 (52.3%) |
| 75 Years and over | 30 (100.0%) | 28 (93.3%) |
| Total | 205 (37.8%) | 372 (68.5%) |
Disability Status by Sex by Age in Hale
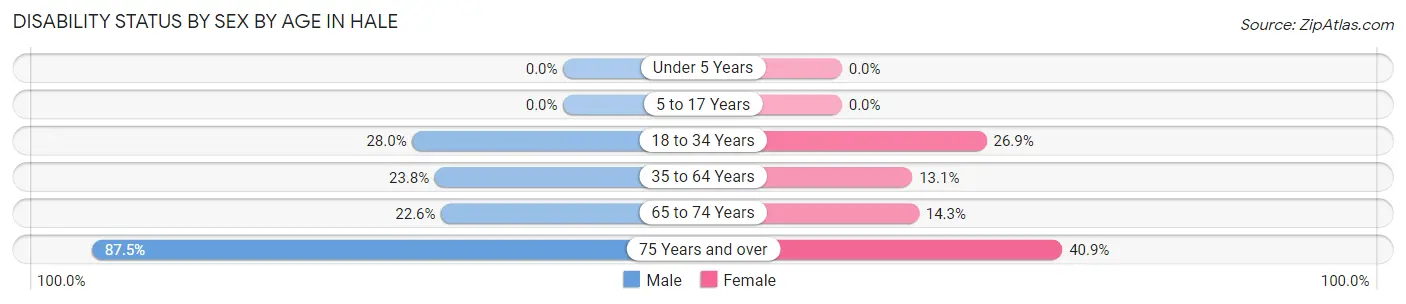
| Age Bracket | Male | Female |
| Under 5 Years | 0 (0.0%) | 0 (0.0%) |
| 5 to 17 Years | 0 (0.0%) | 0 (0.0%) |
| 18 to 34 Years | 14 (28.0%) | 18 (26.9%) |
| 35 to 64 Years | 25 (23.8%) | 14 (13.1%) |
| 65 to 74 Years | 12 (22.6%) | 5 (14.3%) |
| 75 Years and over | 7 (87.5%) | 9 (40.9%) |
Disability Class by Sex by Age in Hale
Disability Class: Hearing Difficulty
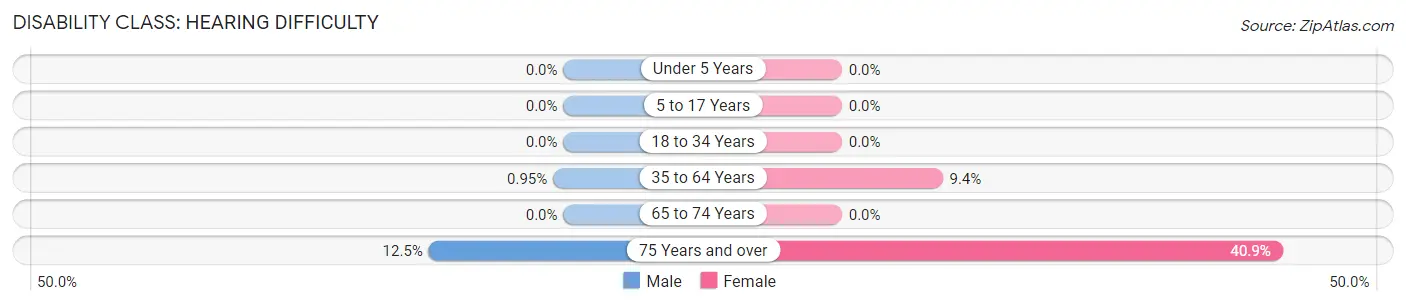
| Age Bracket | Male | Female |
| Under 5 Years | 0 (0.0%) | 0 (0.0%) |
| 5 to 17 Years | 0 (0.0%) | 0 (0.0%) |
| 18 to 34 Years | 0 (0.0%) | 0 (0.0%) |
| 35 to 64 Years | 1 (0.9%) | 10 (9.3%) |
| 65 to 74 Years | 0 (0.0%) | 0 (0.0%) |
| 75 Years and over | 1 (12.5%) | 9 (40.9%) |
Disability Class: Vision Difficulty
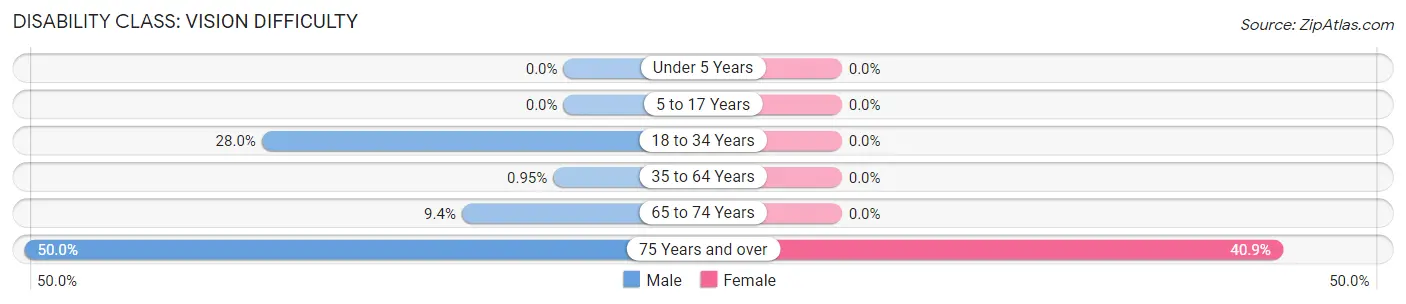
| Age Bracket | Male | Female |
| Under 5 Years | 0 (0.0%) | 0 (0.0%) |
| 5 to 17 Years | 0 (0.0%) | 0 (0.0%) |
| 18 to 34 Years | 14 (28.0%) | 0 (0.0%) |
| 35 to 64 Years | 1 (0.9%) | 0 (0.0%) |
| 65 to 74 Years | 5 (9.4%) | 0 (0.0%) |
| 75 Years and over | 4 (50.0%) | 9 (40.9%) |
Disability Class: Cognitive Difficulty
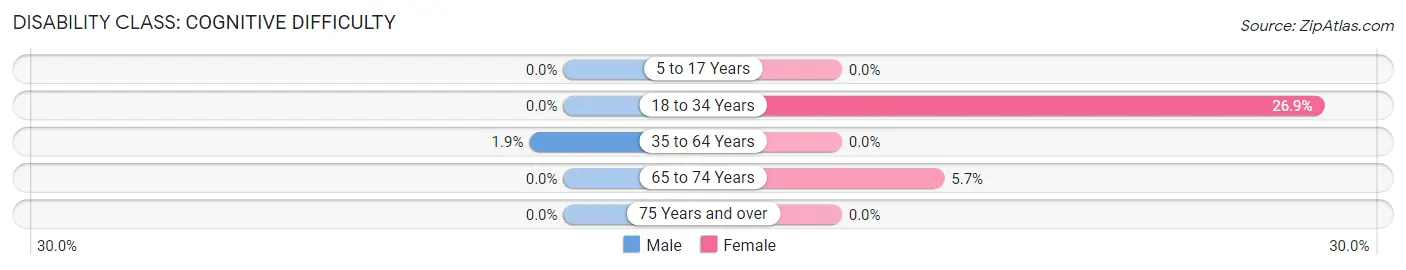
| Age Bracket | Male | Female |
| 5 to 17 Years | 0 (0.0%) | 0 (0.0%) |
| 18 to 34 Years | 0 (0.0%) | 18 (26.9%) |
| 35 to 64 Years | 2 (1.9%) | 0 (0.0%) |
| 65 to 74 Years | 0 (0.0%) | 2 (5.7%) |
| 75 Years and over | 0 (0.0%) | 0 (0.0%) |
Disability Class: Ambulatory Difficulty
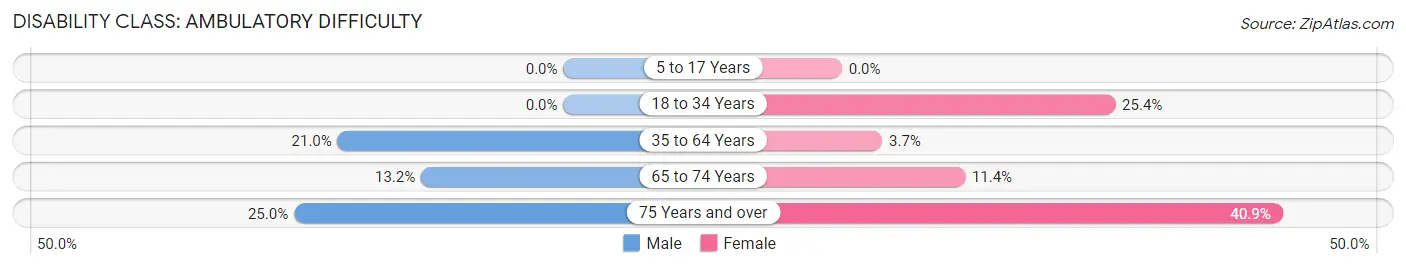
| Age Bracket | Male | Female |
| 5 to 17 Years | 0 (0.0%) | 0 (0.0%) |
| 18 to 34 Years | 0 (0.0%) | 17 (25.4%) |
| 35 to 64 Years | 22 (20.9%) | 4 (3.7%) |
| 65 to 74 Years | 7 (13.2%) | 4 (11.4%) |
| 75 Years and over | 2 (25.0%) | 9 (40.9%) |
Disability Class: Self-Care Difficulty
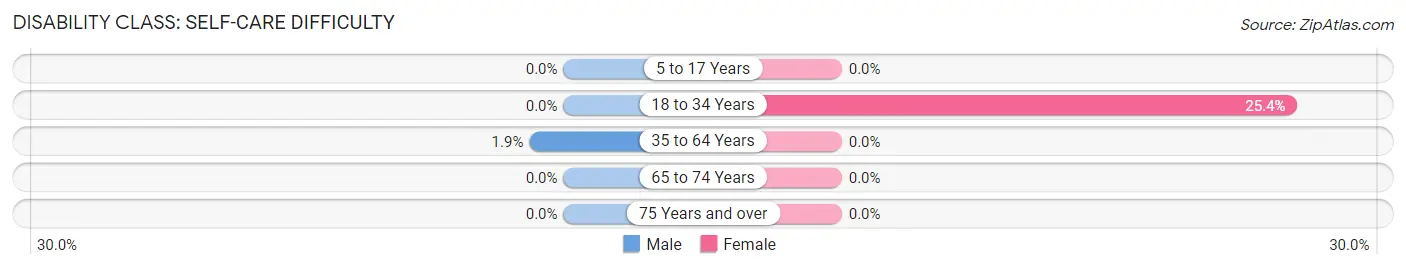
| Age Bracket | Male | Female |
| 5 to 17 Years | 0 (0.0%) | 0 (0.0%) |
| 18 to 34 Years | 0 (0.0%) | 17 (25.4%) |
| 35 to 64 Years | 2 (1.9%) | 0 (0.0%) |
| 65 to 74 Years | 0 (0.0%) | 0 (0.0%) |
| 75 Years and over | 0 (0.0%) | 0 (0.0%) |
Technology Access in Hale
Computing Device Access in Hale
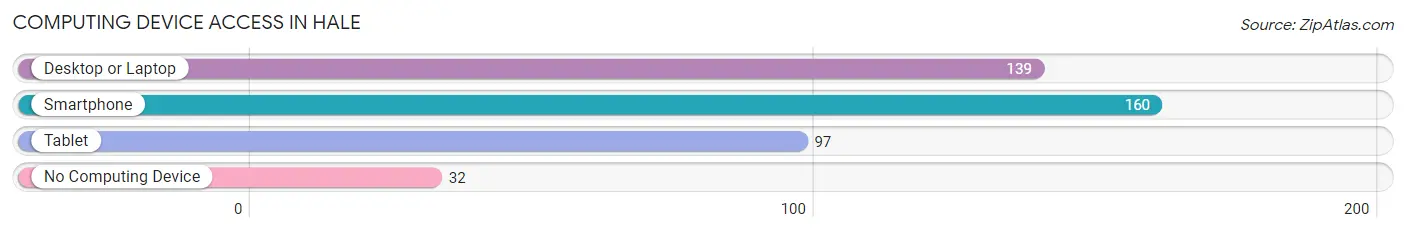
| Device Type | # Households | % Households |
| Desktop or Laptop | 139 | 65.6% |
| Smartphone | 160 | 75.5% |
| Tablet | 97 | 45.8% |
| No Computing Device | 32 | 15.1% |
| Total | 212 | 100.0% |
Internet Access in Hale
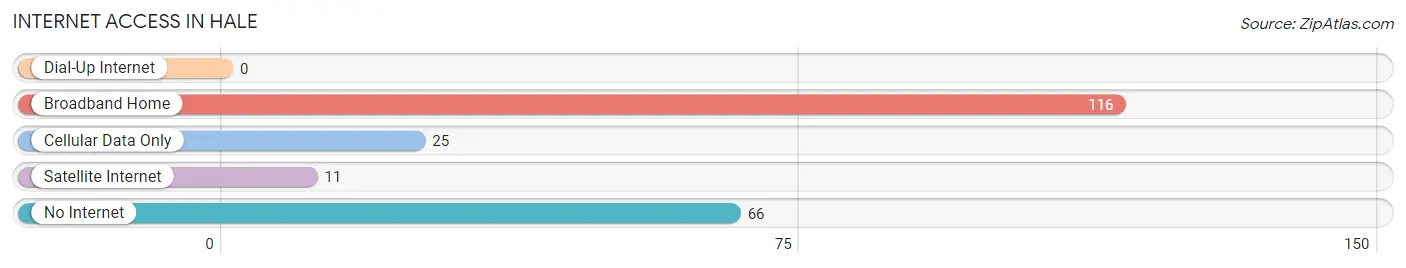
| Internet Type | # Households | % Households |
| Dial-Up Internet | 0 | 0.0% |
| Broadband Home | 116 | 54.7% |
| Cellular Data Only | 25 | 11.8% |
| Satellite Internet | 11 | 5.2% |
| No Internet | 66 | 31.1% |
| Total | 212 | 100.0% |
Hale Summary
Hale is a small city located in Carroll County, Missouri. It is situated in the northwest corner of the state, approximately 40 miles from the Iowa border. The city has a population of approximately 1,000 people and is part of the larger Kansas City metropolitan area.
Geography
Hale is located in the northwest corner of Missouri, approximately 40 miles from the Iowa border. The city is situated in the Missouri River Valley, which is part of the larger Missouri River Basin. The city is surrounded by rolling hills and is located near the Missouri River. The city is also located near the Grand River, which is a tributary of the Missouri River. The city is located at an elevation of 845 feet above sea level.
The climate in Hale is classified as humid continental, with hot summers and cold winters. The average annual temperature is around 54 degrees Fahrenheit, with an average high of around 79 degrees Fahrenheit in the summer and an average low of around 30 degrees Fahrenheit in the winter. The average annual precipitation is around 40 inches.
Economy
Hale’s economy is largely based on agriculture and manufacturing. The city is home to several large agricultural operations, including a large hog farm and a large dairy farm. The city is also home to several manufacturing companies, including a plastics manufacturer and a metal fabrication company.
The city is also home to several small businesses, including restaurants, retail stores, and service providers. The city is also home to a small airport, which serves the surrounding area.
Demographics
As of the 2010 census, the population of Hale was 1,000 people. The racial makeup of the city was 97.2% White, 0.7% African American, 0.2% Native American, 0.2% Asian, 0.2% from other races, and 1.7% from two or more races. Hispanic or Latino of any race were 0.7% of the population.
The median income for a household in Hale was $37,500, and the median income for a family was $45,000. The per capita income for the city was $18,000. About 11.2% of families and 14.2% of the population were below the poverty line, including 18.2% of those under age 18 and 8.2% of those age 65 or over.
Conclusion
Hale is a small city located in Carroll County, Missouri. It is situated in the northwest corner of the state, approximately 40 miles from the Iowa border. The city has a population of approximately 1,000 people and is part of the larger Kansas City metropolitan area. The city’s economy is largely based on agriculture and manufacturing, and the city is home to several small businesses. The racial makeup of the city is predominantly White, with a small percentage of African American, Native American, and Asian residents. The median income for a household in Hale is $37,500, and the per capita income for the city is $18,000.
Common Questions
What is Per Capita Income in Hale?
Per Capita income in Hale is $27,602.
What is the Median Family Income in Hale?
Median Family Income in Hale is $55,500.
What is the Median Household income in Hale?
Median Household Income in Hale is $51,071.
What is Inequality or Gini Index in Hale?
Inequality or Gini Index in Hale is 0.40.
What is the Total Population of Hale?
Total Population of Hale is 543.
What is the Total Male Population of Hale?
Total Male Population of Hale is 272.
What is the Total Female Population of Hale?
Total Female Population of Hale is 271.
What is the Ratio of Males per 100 Females in Hale?
There are 100.37 Males per 100 Females in Hale.
What is the Ratio of Females per 100 Males in Hale?
There are 99.63 Females per 100 Males in Hale.
What is the Median Population Age in Hale?
Median Population Age in Hale is 42.1 Years.
What is the Average Family Size in Hale
Average Family Size in Hale is 3.6 People.
What is the Average Household Size in Hale
Average Household Size in Hale is 2.6 People.
How Large is the Labor Force in Hale?
There are 234 People in the Labor Forcein in Hale.
What is the Percentage of People in the Labor Force in Hale?
50.6% of People are in the Labor Force in Hale.
What is the Unemployment Rate in Hale?
Unemployment Rate in Hale is 0.4%.