Greenville, MO Map & Demographics
Greenville Map
Greenville Overview
$18,110
PER CAPITA INCOME
$52,833
AVG FAMILY INCOME
$39,276
AVG HOUSEHOLD INCOME
68.6%
WAGE / INCOME GAP [ % ]
31.4¢/ $1
WAGE / INCOME GAP [ $ ]
0.36
INEQUALITY / GINI INDEX
444
TOTAL POPULATION
230
MALE POPULATION
214
FEMALE POPULATION
107.48
MALES / 100 FEMALES
93.04
FEMALES / 100 MALES
40.2
MEDIAN AGE
3.7
AVG FAMILY SIZE
2.9
AVG HOUSEHOLD SIZE
126
LABOR FORCE [ PEOPLE ]
35.4%
PERCENT IN LABOR FORCE
4.0%
UNEMPLOYMENT RATE
Greenville Zip Codes
Greenville Area Codes
Income in Greenville
Income Overview in Greenville
Per Capita Income in Greenville is $18,110, while median incomes of families and households are $52,833 and $39,276 respectively.
| Characteristic | Number | Measure |
| Per Capita Income | 444 | $18,110 |
| Median Family Income | 80 | $52,833 |
| Mean Family Income | 80 | $59,630 |
| Median Household Income | 127 | $39,276 |
| Mean Household Income | 127 | $51,004 |
| Income Deficit | 80 | $0 |
| Wage / Income Gap (%) | 444 | 68.65% |
| Wage / Income Gap ($) | 444 | 31.35¢ per $1 |
| Gini / Inequality Index | 444 | 0.36 |
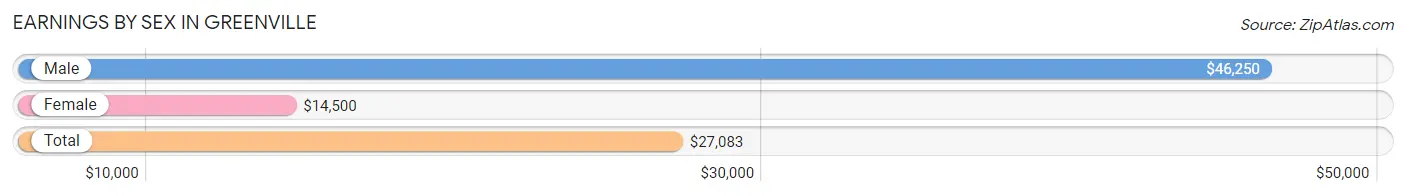
Earnings by Sex in Greenville
Average Earnings in Greenville are $27,083, $46,250 for men and $14,500 for women, a difference of 68.6%.
| Sex | Number | Average Earnings |
| Male | 80 (57.1%) | $46,250 |
| Female | 60 (42.9%) | $14,500 |
| Total | 140 (100.0%) | $27,083 |
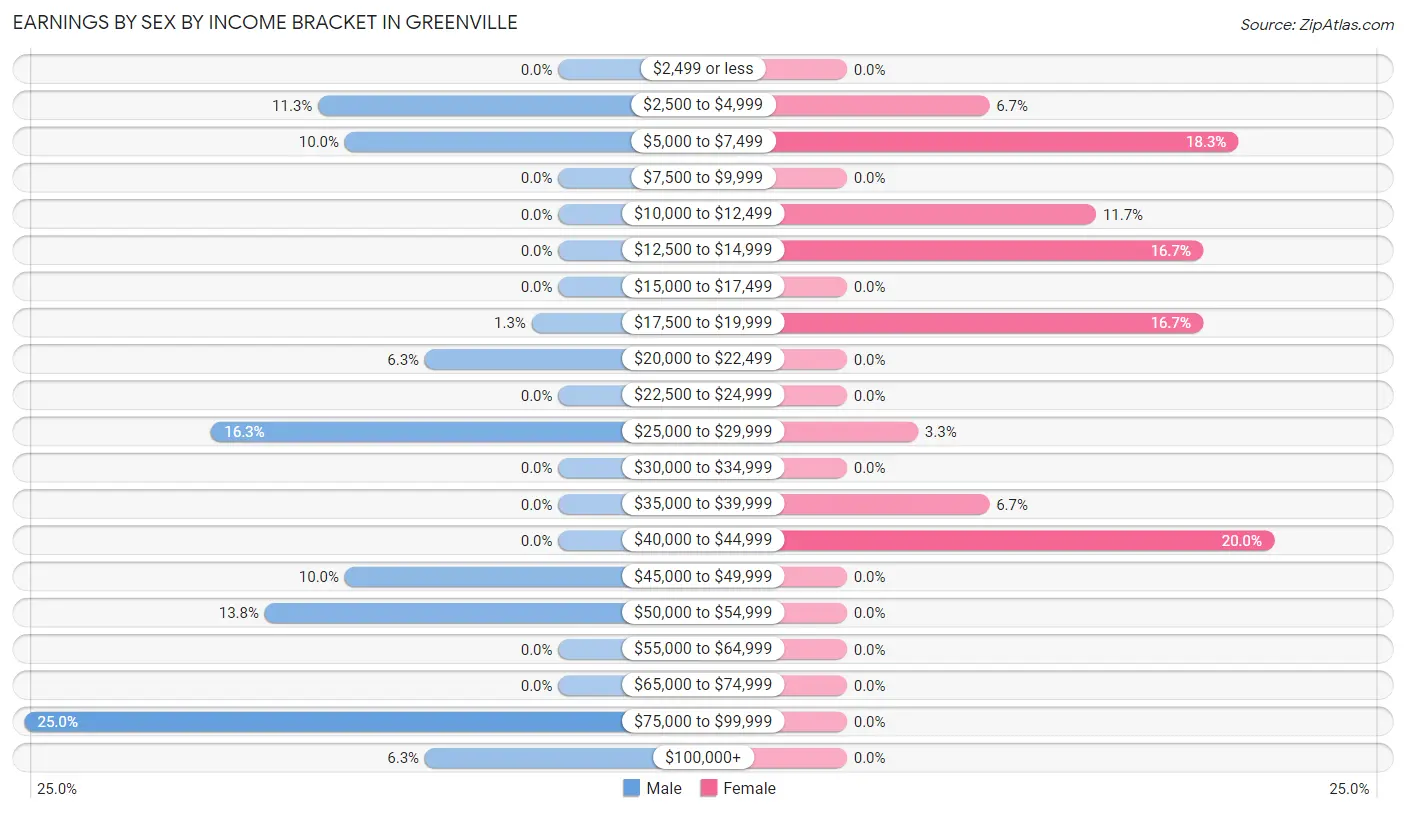
Earnings by Sex by Income Bracket in Greenville
The most common earnings brackets in Greenville are $75,000 to $99,999 for men (20 | 25.0%) and $40,000 to $44,999 for women (12 | 20.0%).
| Income | Male | Female |
| $2,499 or less | 0 (0.0%) | 0 (0.0%) |
| $2,500 to $4,999 | 9 (11.3%) | 4 (6.7%) |
| $5,000 to $7,499 | 8 (10.0%) | 11 (18.3%) |
| $7,500 to $9,999 | 0 (0.0%) | 0 (0.0%) |
| $10,000 to $12,499 | 0 (0.0%) | 7 (11.7%) |
| $12,500 to $14,999 | 0 (0.0%) | 10 (16.7%) |
| $15,000 to $17,499 | 0 (0.0%) | 0 (0.0%) |
| $17,500 to $19,999 | 1 (1.3%) | 10 (16.7%) |
| $20,000 to $22,499 | 5 (6.2%) | 0 (0.0%) |
| $22,500 to $24,999 | 0 (0.0%) | 0 (0.0%) |
| $25,000 to $29,999 | 13 (16.3%) | 2 (3.3%) |
| $30,000 to $34,999 | 0 (0.0%) | 0 (0.0%) |
| $35,000 to $39,999 | 0 (0.0%) | 4 (6.7%) |
| $40,000 to $44,999 | 0 (0.0%) | 12 (20.0%) |
| $45,000 to $49,999 | 8 (10.0%) | 0 (0.0%) |
| $50,000 to $54,999 | 11 (13.8%) | 0 (0.0%) |
| $55,000 to $64,999 | 0 (0.0%) | 0 (0.0%) |
| $65,000 to $74,999 | 0 (0.0%) | 0 (0.0%) |
| $75,000 to $99,999 | 20 (25.0%) | 0 (0.0%) |
| $100,000+ | 5 (6.2%) | 0 (0.0%) |
| Total | 80 (100.0%) | 60 (100.0%) |
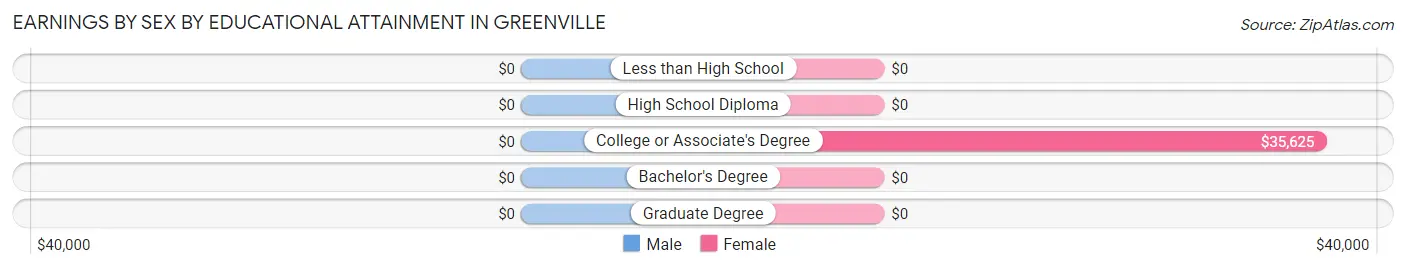
Earnings by Sex by Educational Attainment in Greenville
| Educational Attainment | Male Income | Female Income |
| Less than High School | - | - |
| High School Diploma | - | - |
| College or Associate's Degree | - | - |
| Bachelor's Degree | - | - |
| Graduate Degree | - | - |
| Total | $46,406 | $18,875 |
Family Income in Greenville
Family Income Brackets in Greenville
According to the Greenville family income data, there are 28 families falling into the $50,000 to $74,999 income range, which is the most common income bracket and makes up 35.0% of all families.
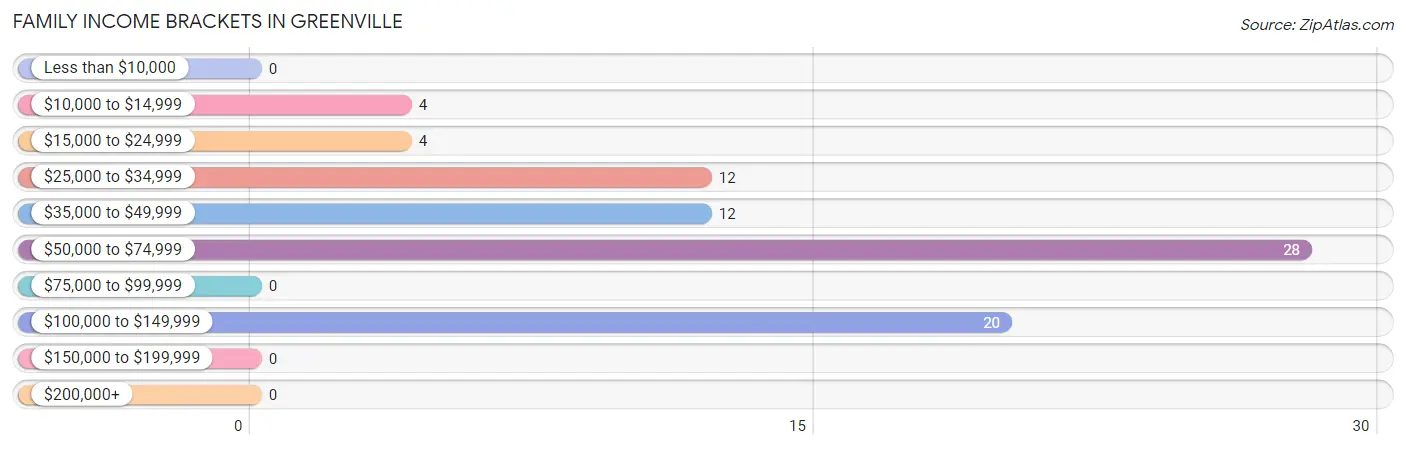
| Income Bracket | # Families | % Families |
| Less than $10,000 | 0 | 0.0% |
| $10,000 to $14,999 | 4 | 5.0% |
| $15,000 to $24,999 | 4 | 5.0% |
| $25,000 to $34,999 | 12 | 15.0% |
| $35,000 to $49,999 | 12 | 15.0% |
| $50,000 to $74,999 | 28 | 35.0% |
| $75,000 to $99,999 | 0 | 0.0% |
| $100,000 to $149,999 | 20 | 25.0% |
| $150,000 to $199,999 | 0 | 0.0% |
| $200,000+ | 0 | 0.0% |
Family Income by Famaliy Size in Greenville
2-person families (40 | 50.0%) account for the highest median family income in Greenville with $50,833 per family, while 2-person families (40 | 50.0%) have the highest median income of $25,416 per family member.
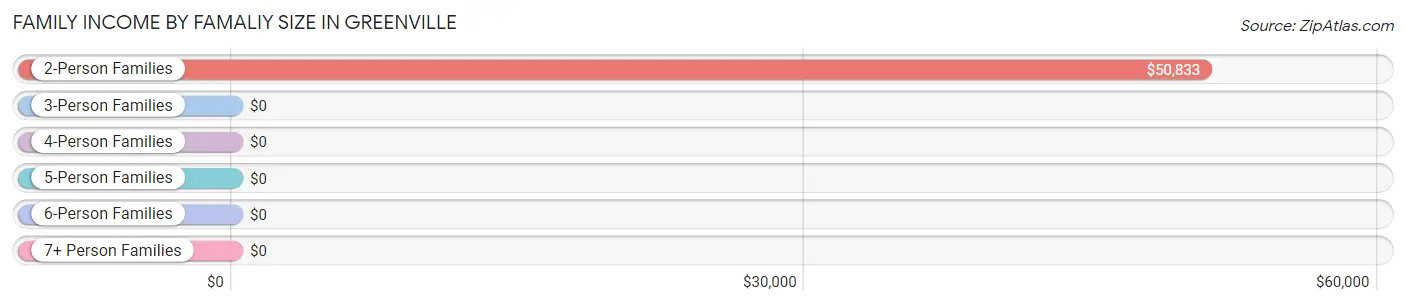
| Income Bracket | # Families | Median Income |
| 2-Person Families | 40 (50.0%) | $50,833 |
| 3-Person Families | 21 (26.3%) | $0 |
| 4-Person Families | 5 (6.2%) | $0 |
| 5-Person Families | 5 (6.2%) | $0 |
| 6-Person Families | 0 (0.0%) | $0 |
| 7+ Person Families | 9 (11.3%) | $0 |
| Total | 80 (100.0%) | $52,833 |
Family Income by Number of Earners in Greenville
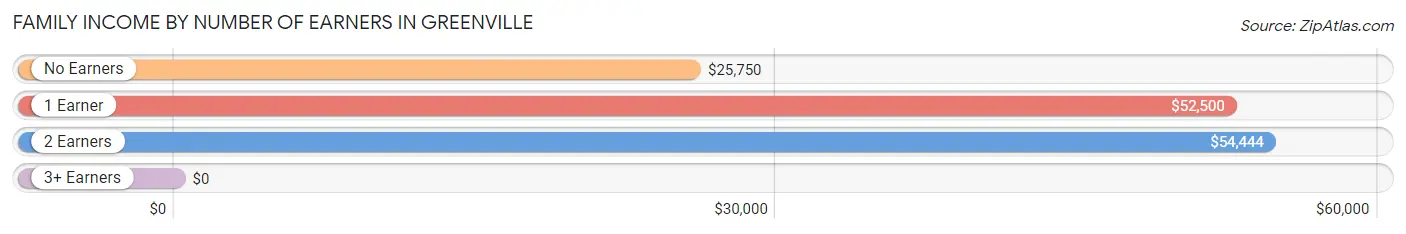
| Number of Earners | # Families | Median Income |
| No Earners | 19 (23.7%) | $25,750 |
| 1 Earner | 28 (35.0%) | $52,500 |
| 2 Earners | 30 (37.5%) | $54,444 |
| 3+ Earners | 3 (3.7%) | $0 |
| Total | 80 (100.0%) | $52,833 |
Household Income in Greenville
Household Income Brackets in Greenville
With 39 households falling in the category, the $35,000 to $49,999 income range is the most frequent in Greenville, accounting for 30.7% of all households.
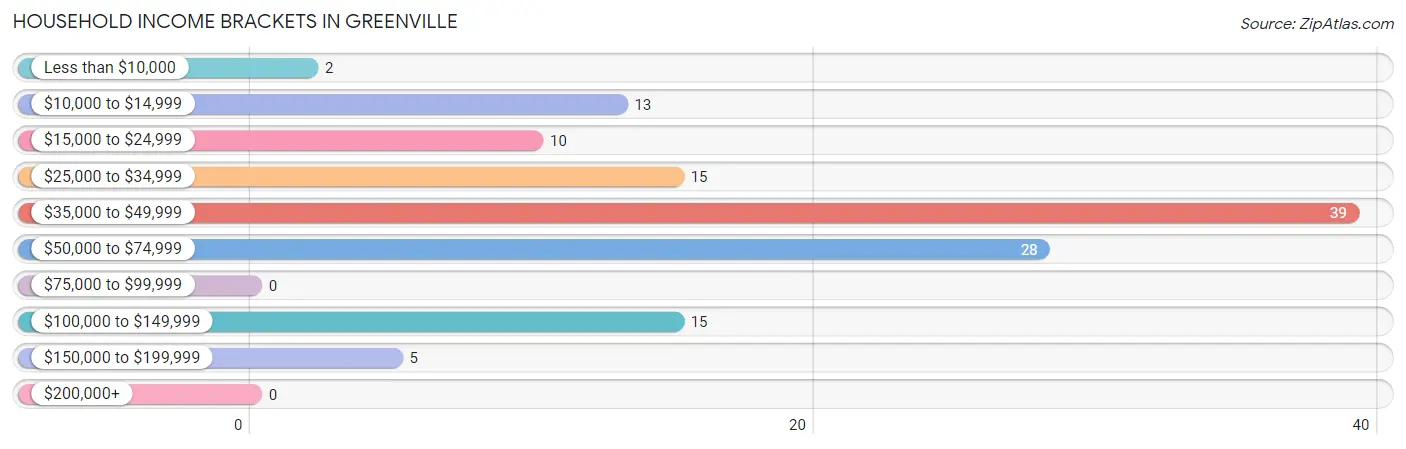
| Income Bracket | # Households | % Households |
| Less than $10,000 | 2 | 1.6% |
| $10,000 to $14,999 | 13 | 10.2% |
| $15,000 to $24,999 | 10 | 7.9% |
| $25,000 to $34,999 | 15 | 11.8% |
| $35,000 to $49,999 | 39 | 30.7% |
| $50,000 to $74,999 | 28 | 22.0% |
| $75,000 to $99,999 | 0 | 0.0% |
| $100,000 to $149,999 | 15 | 11.8% |
| $150,000 to $199,999 | 5 | 3.9% |
| $200,000+ | 0 | 0.0% |
Household Income by Householder Age in Greenville
The median household income in Greenville is $39,276, with the highest median household income of $65,417 found in the 25 to 44 years age bracket for the primary householder. A total of 25 households (19.7%) fall into this category. Meanwhile, the 15 to 24 years age bracket for the primary householder has the lowest median household income of $0, with 1 households (0.8%) in this group.
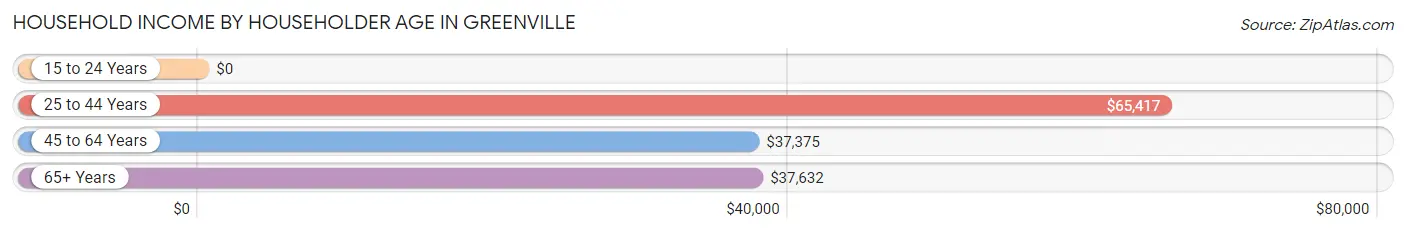
| Income Bracket | # Households | Median Income |
| 15 to 24 Years | 1 (0.8%) | $0 |
| 25 to 44 Years | 25 (19.7%) | $65,417 |
| 45 to 64 Years | 43 (33.9%) | $37,375 |
| 65+ Years | 58 (45.7%) | $37,632 |
| Total | 127 (100.0%) | $39,276 |
Poverty in Greenville
Income Below Poverty by Sex and Age in Greenville
With 5.9% poverty level for males and 11.3% for females among the residents of Greenville, 75 year old and over males and 18 to 24 year old females are the most vulnerable to poverty, with 5 males (55.6%) and 10 females (37.0%) in their respective age groups living below the poverty level.
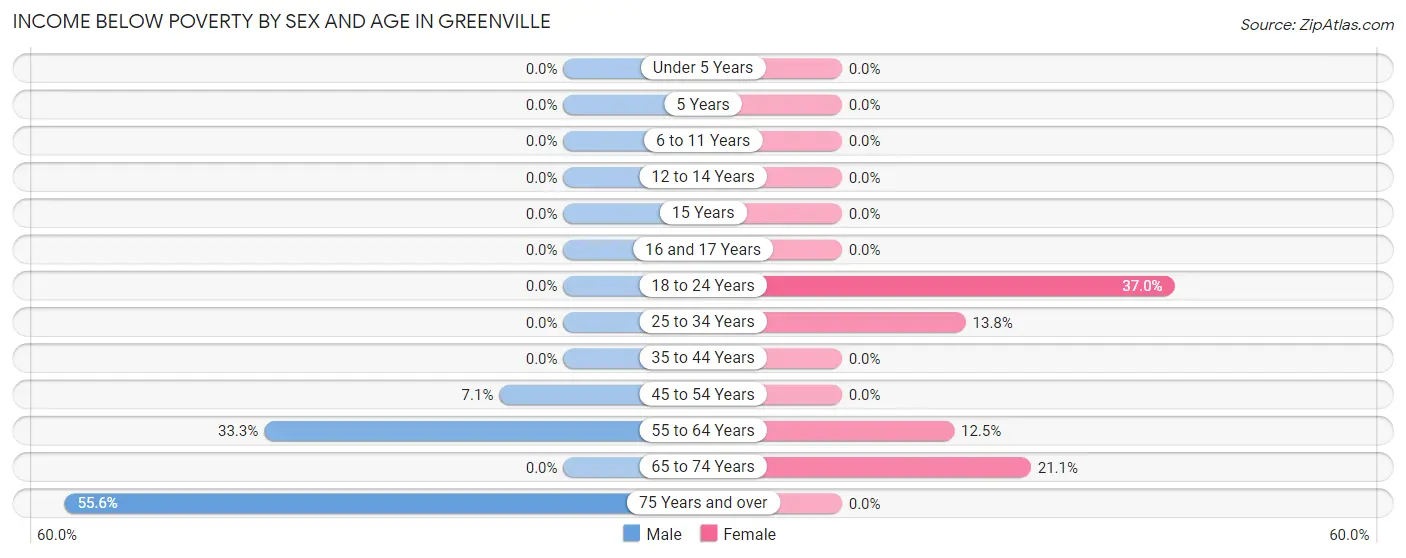
| Age Bracket | Male | Female |
| Under 5 Years | 0 (0.0%) | 0 (0.0%) |
| 5 Years | 0 (0.0%) | 0 (0.0%) |
| 6 to 11 Years | 0 (0.0%) | 0 (0.0%) |
| 12 to 14 Years | 0 (0.0%) | 0 (0.0%) |
| 15 Years | 0 (0.0%) | 0 (0.0%) |
| 16 and 17 Years | 0 (0.0%) | 0 (0.0%) |
| 18 to 24 Years | 0 (0.0%) | 10 (37.0%) |
| 25 to 34 Years | 0 (0.0%) | 4 (13.8%) |
| 35 to 44 Years | 0 (0.0%) | 0 (0.0%) |
| 45 to 54 Years | 2 (7.1%) | 0 (0.0%) |
| 55 to 64 Years | 3 (33.3%) | 4 (12.5%) |
| 65 to 74 Years | 0 (0.0%) | 4 (21.0%) |
| 75 Years and over | 5 (55.6%) | 0 (0.0%) |
| Total | 10 (5.9%) | 22 (11.3%) |
Income Above Poverty by Sex and Age in Greenville
According to the poverty statistics in Greenville, males aged under 5 years and females aged under 5 years are the age groups that are most secure financially, with 100.0% of males and 100.0% of females in these age groups living above the poverty line.
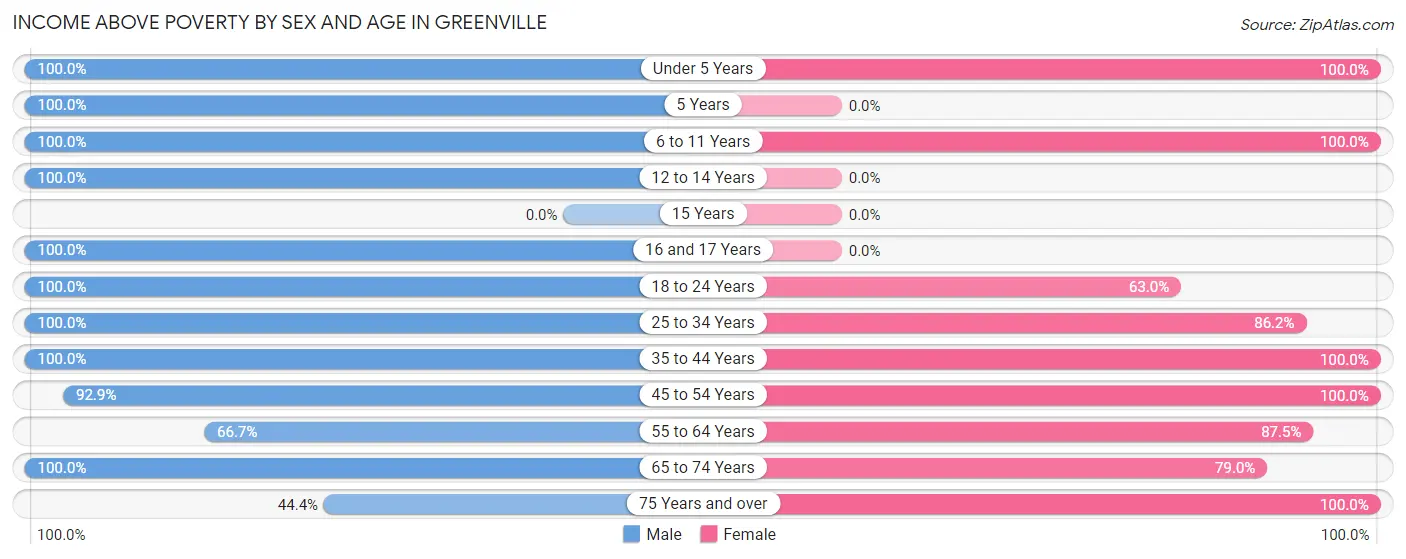
| Age Bracket | Male | Female |
| Under 5 Years | 8 (100.0%) | 6 (100.0%) |
| 5 Years | 13 (100.0%) | 0 (0.0%) |
| 6 to 11 Years | 20 (100.0%) | 28 (100.0%) |
| 12 to 14 Years | 13 (100.0%) | 0 (0.0%) |
| 15 Years | 0 (0.0%) | 0 (0.0%) |
| 16 and 17 Years | 1 (100.0%) | 0 (0.0%) |
| 18 to 24 Years | 16 (100.0%) | 17 (63.0%) |
| 25 to 34 Years | 16 (100.0%) | 25 (86.2%) |
| 35 to 44 Years | 18 (100.0%) | 5 (100.0%) |
| 45 to 54 Years | 26 (92.9%) | 15 (100.0%) |
| 55 to 64 Years | 6 (66.7%) | 28 (87.5%) |
| 65 to 74 Years | 18 (100.0%) | 15 (78.9%) |
| 75 Years and over | 4 (44.4%) | 34 (100.0%) |
| Total | 159 (94.1%) | 173 (88.7%) |
Income Below Poverty Among Married-Couple Families in Greenville
The poverty statistics for married-couple families in Greenville show that 7.0% or 4 of the total 57 families live below the poverty line. Families with no children have the highest poverty rate of 10.5%, comprising of 4 families. On the other hand, families with 1 or 2 children have the lowest poverty rate of 0.0%, which includes 0 families.
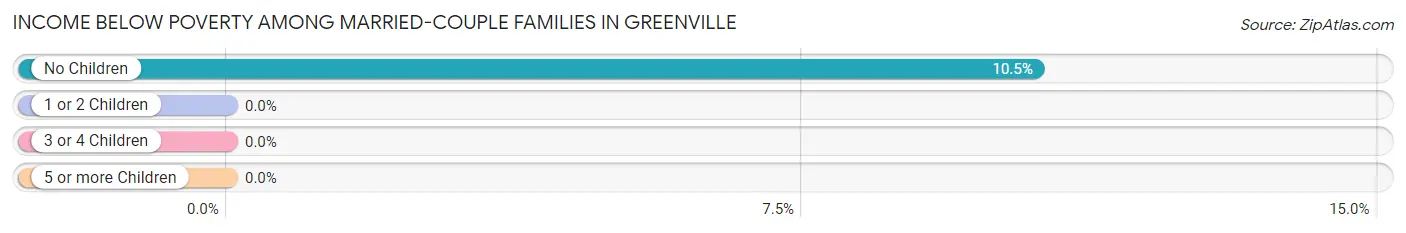
| Children | Above Poverty | Below Poverty |
| No Children | 34 (89.5%) | 4 (10.5%) |
| 1 or 2 Children | 10 (100.0%) | 0 (0.0%) |
| 3 or 4 Children | 9 (100.0%) | 0 (0.0%) |
| 5 or more Children | 0 (0.0%) | 0 (0.0%) |
| Total | 53 (93.0%) | 4 (7.0%) |
Income Below Poverty Among Single-Parent Households in Greenville
| Children | Single Father | Single Mother |
| No Children | 0 (0.0%) | 0 (0.0%) |
| 1 or 2 Children | 0 (0.0%) | 0 (0.0%) |
| 3 or 4 Children | 0 (0.0%) | 0 (0.0%) |
| 5 or more Children | 0 (0.0%) | 0 (0.0%) |
| Total | 0 (0.0%) | 0 (0.0%) |
Income Below Poverty Among Married-Couple vs Single-Parent Households in Greenville
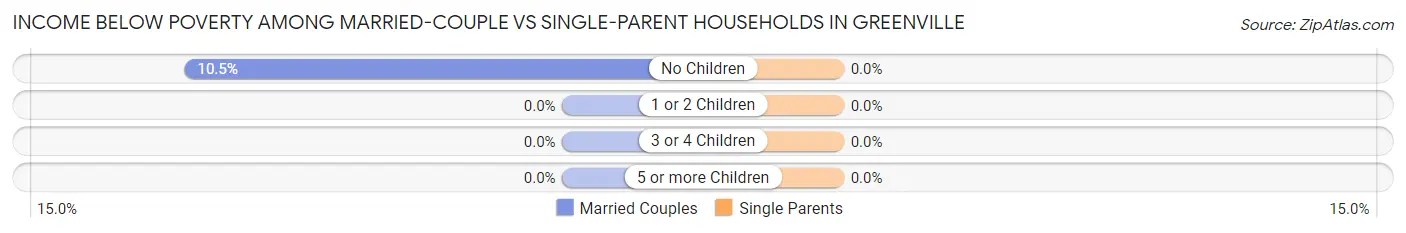
| Children | Married-Couple Families | Single-Parent Households |
| No Children | 4 (10.5%) | 0 (0.0%) |
| 1 or 2 Children | 0 (0.0%) | 0 (0.0%) |
| 3 or 4 Children | 0 (0.0%) | 0 (0.0%) |
| 5 or more Children | 0 (0.0%) | 0 (0.0%) |
| Total | 4 (7.0%) | 0 (0.0%) |
Race in Greenville
The most populous races in Greenville are White / Caucasian (431 | 97.1%), Hispanic or Latino (69 | 15.5%), and Two or more Races (11 | 2.5%).
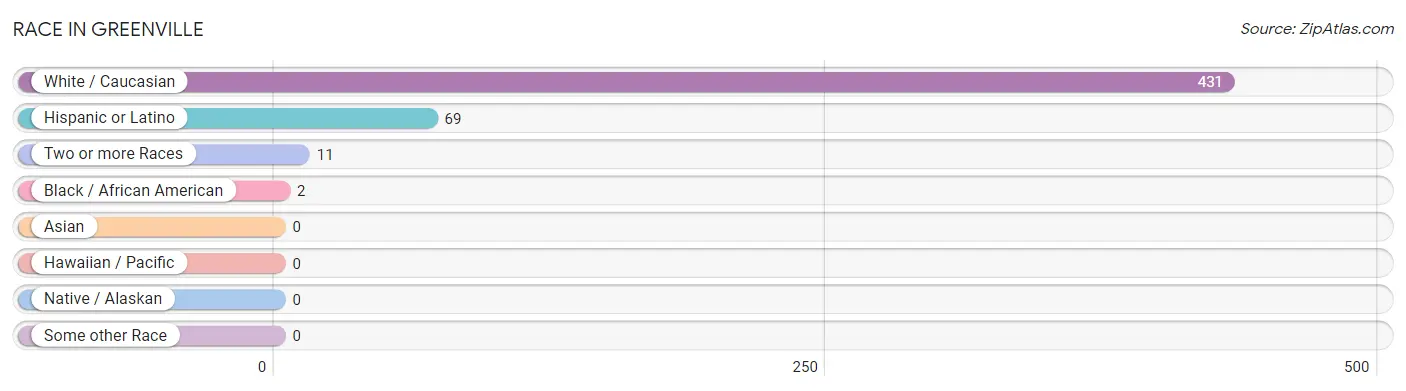
| Race | # Population | % Population |
| Asian | 0 | 0.0% |
| Black / African American | 2 | 0.4% |
| Hawaiian / Pacific | 0 | 0.0% |
| Hispanic or Latino | 69 | 15.5% |
| Native / Alaskan | 0 | 0.0% |
| White / Caucasian | 431 | 97.1% |
| Two or more Races | 11 | 2.5% |
| Some other Race | 0 | 0.0% |
| Total | 444 | 100.0% |
Ancestry in Greenville
The most populous ancestries reported in Greenville are Mexican (69 | 15.5%), American (52 | 11.7%), Irish (50 | 11.3%), German (35 | 7.9%), and Italian (13 | 2.9%), together accounting for 49.3% of all Greenville residents.
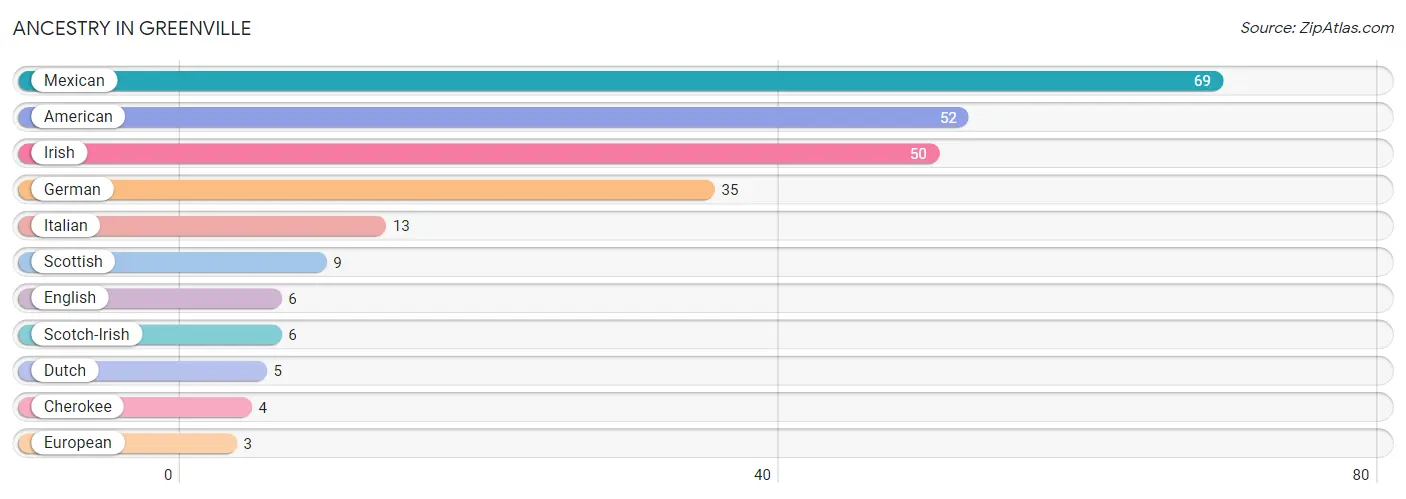
| Ancestry | # Population | % Population |
| American | 52 | 11.7% |
| Cherokee | 4 | 0.9% |
| Dutch | 5 | 1.1% |
| English | 6 | 1.3% |
| European | 3 | 0.7% |
| German | 35 | 7.9% |
| Irish | 50 | 11.3% |
| Italian | 13 | 2.9% |
| Mexican | 69 | 15.5% |
| Scotch-Irish | 6 | 1.3% |
| Scottish | 9 | 2.0% | View All 11 Rows |
Immigrants in Greenville

| Immigration Origin | # Population | % Population | View All 0 Rows |
Sex and Age in Greenville
Sex and Age in Greenville
The most populous age groups in Greenville are 35 to 39 Years (28 | 12.2%) for men and 85 Years and over (30 | 14.0%) for women.
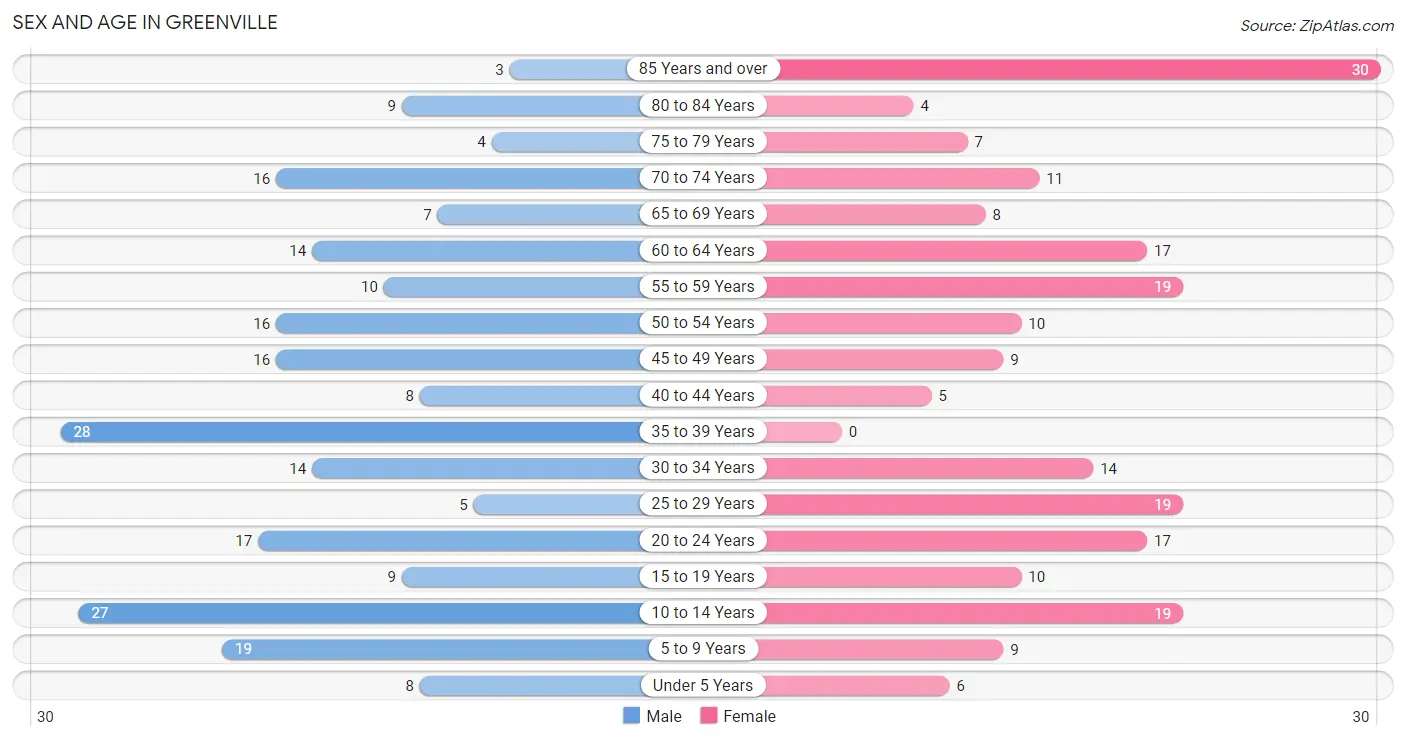
| Age Bracket | Male | Female |
| Under 5 Years | 8 (3.5%) | 6 (2.8%) |
| 5 to 9 Years | 19 (8.3%) | 9 (4.2%) |
| 10 to 14 Years | 27 (11.7%) | 19 (8.9%) |
| 15 to 19 Years | 9 (3.9%) | 10 (4.7%) |
| 20 to 24 Years | 17 (7.4%) | 17 (7.9%) |
| 25 to 29 Years | 5 (2.2%) | 19 (8.9%) |
| 30 to 34 Years | 14 (6.1%) | 14 (6.5%) |
| 35 to 39 Years | 28 (12.2%) | 0 (0.0%) |
| 40 to 44 Years | 8 (3.5%) | 5 (2.3%) |
| 45 to 49 Years | 16 (7.0%) | 9 (4.2%) |
| 50 to 54 Years | 16 (7.0%) | 10 (4.7%) |
| 55 to 59 Years | 10 (4.3%) | 19 (8.9%) |
| 60 to 64 Years | 14 (6.1%) | 17 (7.9%) |
| 65 to 69 Years | 7 (3.0%) | 8 (3.7%) |
| 70 to 74 Years | 16 (7.0%) | 11 (5.1%) |
| 75 to 79 Years | 4 (1.7%) | 7 (3.3%) |
| 80 to 84 Years | 9 (3.9%) | 4 (1.9%) |
| 85 Years and over | 3 (1.3%) | 30 (14.0%) |
| Total | 230 (100.0%) | 214 (100.0%) |
Families and Households in Greenville
Median Family Size in Greenville
The median family size in Greenville is 3.71 persons per family, with married-couple families (57 | 71.3%) accounting for the largest median family size of 4.18 persons per family. On the other hand, single male/father families (12 | 15.0%) represent the smallest median family size with 2.08 persons per family.
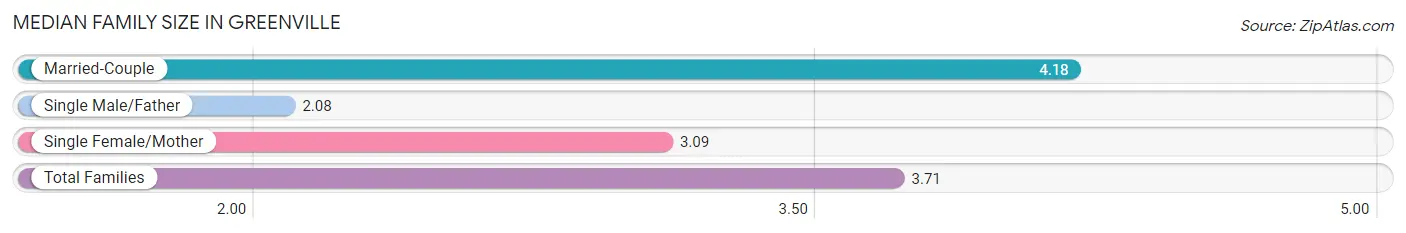
| Family Type | # Families | Family Size |
| Married-Couple | 57 (71.3%) | 4.18 |
| Single Male/Father | 12 (15.0%) | 2.08 |
| Single Female/Mother | 11 (13.8%) | 3.09 |
| Total Families | 80 (100.0%) | 3.71 |
Median Household Size in Greenville
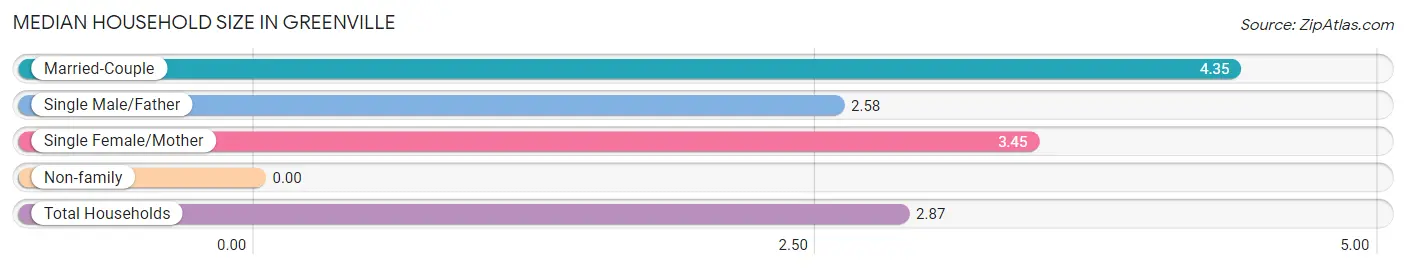
| Household Type | # Households | Household Size |
| Married-Couple | 57 (44.9%) | 4.35 |
| Single Male/Father | 12 (9.5%) | 2.58 |
| Single Female/Mother | 11 (8.7%) | 3.45 |
| Non-family | 47 (37.0%) | - |
| Total Households | 127 (100.0%) | 2.87 |
Household Size by Marriage Status in Greenville
Out of a total of 127 households in Greenville, 80 (63.0%) are family households, while 47 (37.0%) are nonfamily households. The most numerous type of family households are 2-person households, comprising 33, and the most common type of nonfamily households are 1-person households, comprising 47.
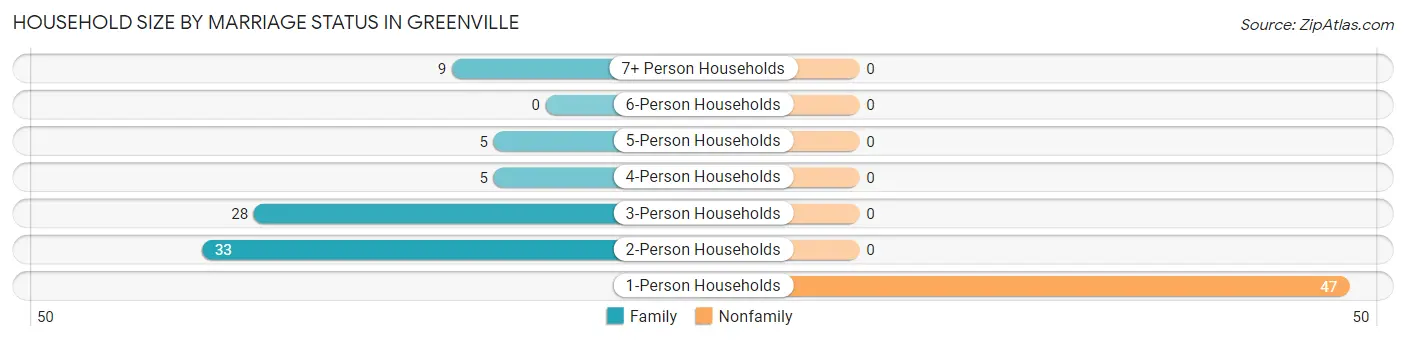
| Household Size | Family Households | Nonfamily Households |
| 1-Person Households | - | 47 (37.0%) |
| 2-Person Households | 33 (26.0%) | 0 (0.0%) |
| 3-Person Households | 28 (22.1%) | 0 (0.0%) |
| 4-Person Households | 5 (3.9%) | 0 (0.0%) |
| 5-Person Households | 5 (3.9%) | 0 (0.0%) |
| 6-Person Households | 0 (0.0%) | 0 (0.0%) |
| 7+ Person Households | 9 (7.1%) | 0 (0.0%) |
| Total | 80 (63.0%) | 47 (37.0%) |
Female Fertility in Greenville
Fertility by Age in Greenville
| Age Bracket | Women with Births | Births / 1,000 Women |
| 15 to 19 years | 0 (0.0%) | 0.0 |
| 20 to 34 years | 0 (0.0%) | 0.0 |
| 35 to 50 years | 0 (0.0%) | 0.0 |
| Total | 0 (0.0%) | 0.0 |
Fertility by Age by Marriage Status in Greenville
| Age Bracket | Married | Unmarried |
| 15 to 19 years | 0 (0.0%) | 0 (0.0%) |
| 20 to 34 years | 0 (0.0%) | 0 (0.0%) |
| 35 to 50 years | 0 (0.0%) | 0 (0.0%) |
| Total | 0 (0.0%) | 0 (0.0%) |
Fertility by Education in Greenville
| Educational Attainment | Women with Births | Births / 1,000 Women |
| Less than High School | 0 (0.0%) | 0.0 |
| High School Diploma | 0 (0.0%) | 0.0 |
| College or Associate's Degree | 0 (0.0%) | 0.0 |
| Bachelor's Degree | 0 (0.0%) | 0.0 |
| Graduate Degree | 0 (0.0%) | 0.0 |
| Total | 0 (0.0%) | 0.0 |
Fertility by Education by Marriage Status in Greenville
| Educational Attainment | Married | Unmarried |
| Less than High School | 0 (0.0%) | 0 (0.0%) |
| High School Diploma | 0 (0.0%) | 0 (0.0%) |
| College or Associate's Degree | 0 (0.0%) | 0 (0.0%) |
| Bachelor's Degree | 0 (0.0%) | 0 (0.0%) |
| Graduate Degree | 0 (0.0%) | 0 (0.0%) |
| Total | 0 (0.0%) | 0 (0.0%) |
Employment Characteristics in Greenville
Employment by Class of Employer in Greenville
Among the 117 employed individuals in Greenville, private company employees (91 | 77.8%), not-for-profit organizations (11 | 9.4%), and self-employed (incorporated) (9 | 7.7%) make up the most common classes of employment.
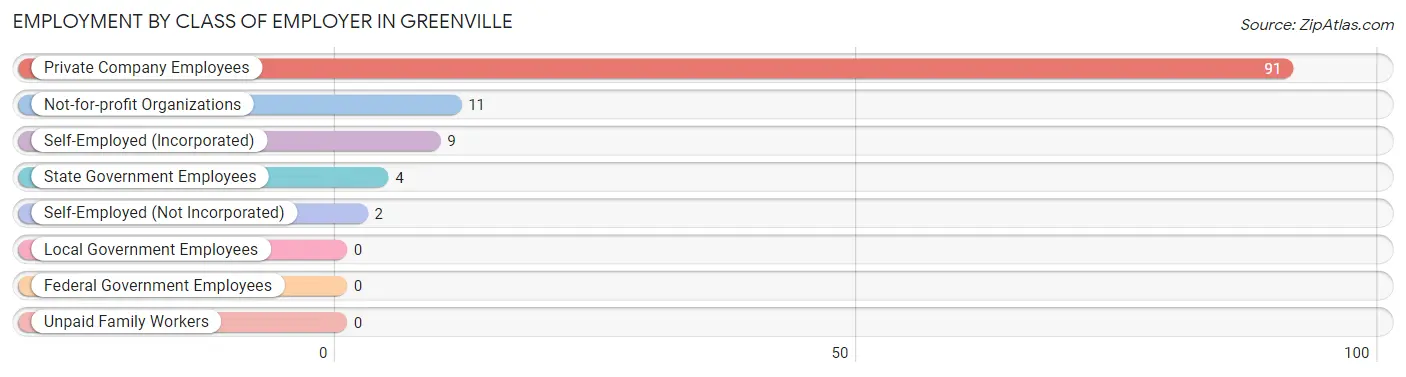
| Employer Class | # Employees | % Employees |
| Private Company Employees | 91 | 77.8% |
| Self-Employed (Incorporated) | 9 | 7.7% |
| Self-Employed (Not Incorporated) | 2 | 1.7% |
| Not-for-profit Organizations | 11 | 9.4% |
| Local Government Employees | 0 | 0.0% |
| State Government Employees | 4 | 3.4% |
| Federal Government Employees | 0 | 0.0% |
| Unpaid Family Workers | 0 | 0.0% |
| Total | 117 | 100.0% |
Employment Status by Age in Greenville
According to the labor force statistics for Greenville, out of the total population over 16 years of age (356), 35.4% or 126 individuals are in the labor force, with 4.0% or 5 of them unemployed. The age group with the highest labor force participation rate is 16 to 19 years, with 78.9% or 15 individuals in the labor force. Within the labor force, the 16 to 19 years age range has the highest percentage of unemployed individuals, with 33.3% or 5 of them being unemployed.
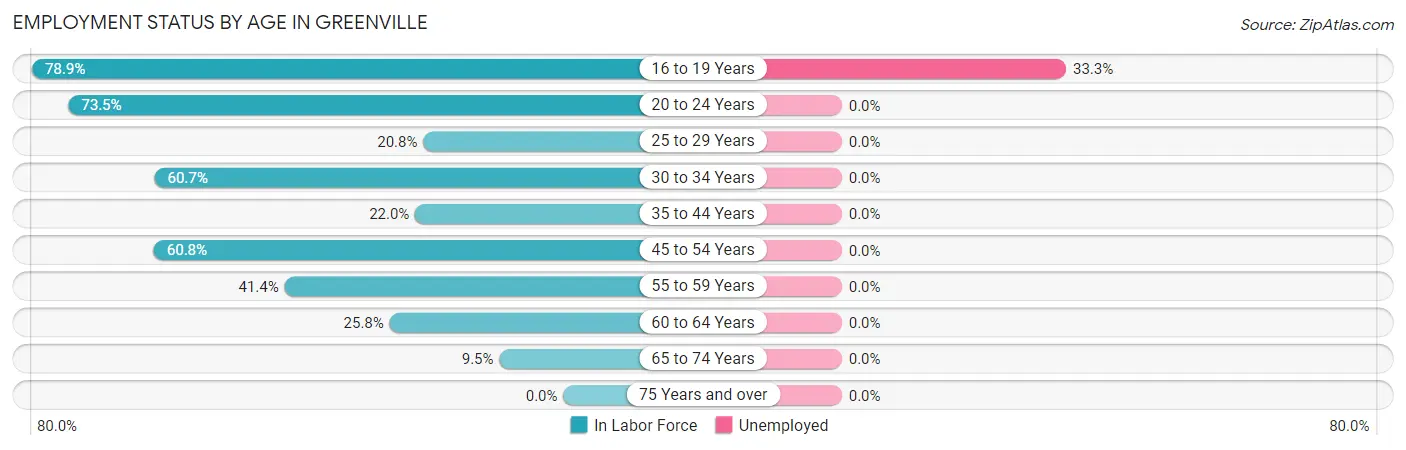
| Age Bracket | In Labor Force | Unemployed |
| 16 to 19 Years | 15 (78.9%) | 5 (33.3%) |
| 20 to 24 Years | 25 (73.5%) | 0 (0.0%) |
| 25 to 29 Years | 5 (20.8%) | 0 (0.0%) |
| 30 to 34 Years | 17 (60.7%) | 0 (0.0%) |
| 35 to 44 Years | 9 (22.0%) | 0 (0.0%) |
| 45 to 54 Years | 31 (60.8%) | 0 (0.0%) |
| 55 to 59 Years | 12 (41.4%) | 0 (0.0%) |
| 60 to 64 Years | 8 (25.8%) | 0 (0.0%) |
| 65 to 74 Years | 4 (9.5%) | 0 (0.0%) |
| 75 Years and over | 0 (0.0%) | 0 (0.0%) |
| Total | 126 (35.4%) | 5 (4.0%) |
Employment Status by Educational Attainment in Greenville
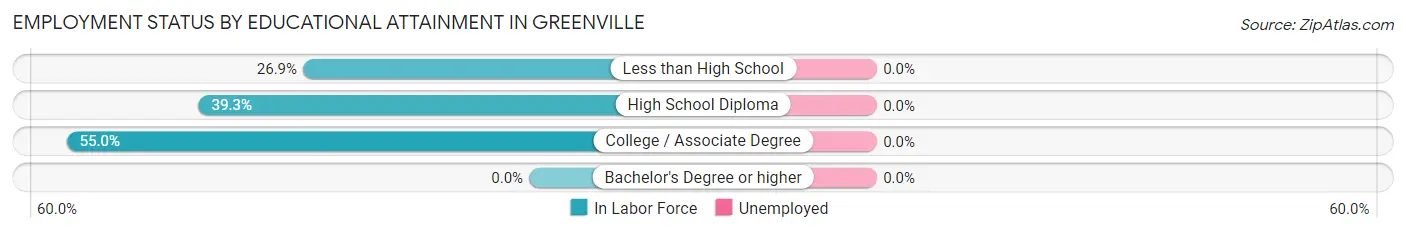
| Educational Attainment | In Labor Force | Unemployed |
| Less than High School | 14 (26.9%) | 0 (0.0%) |
| High School Diploma | 35 (39.3%) | 0 (0.0%) |
| College / Associate Degree | 33 (55.0%) | 0 (0.0%) |
| Bachelor's Degree or higher | 0 (0.0%) | 0 (0.0%) |
| Total | 82 (40.2%) | 0 (0.0%) |
Employment Occupations by Sex in Greenville
Management, Business, Science and Arts Occupations
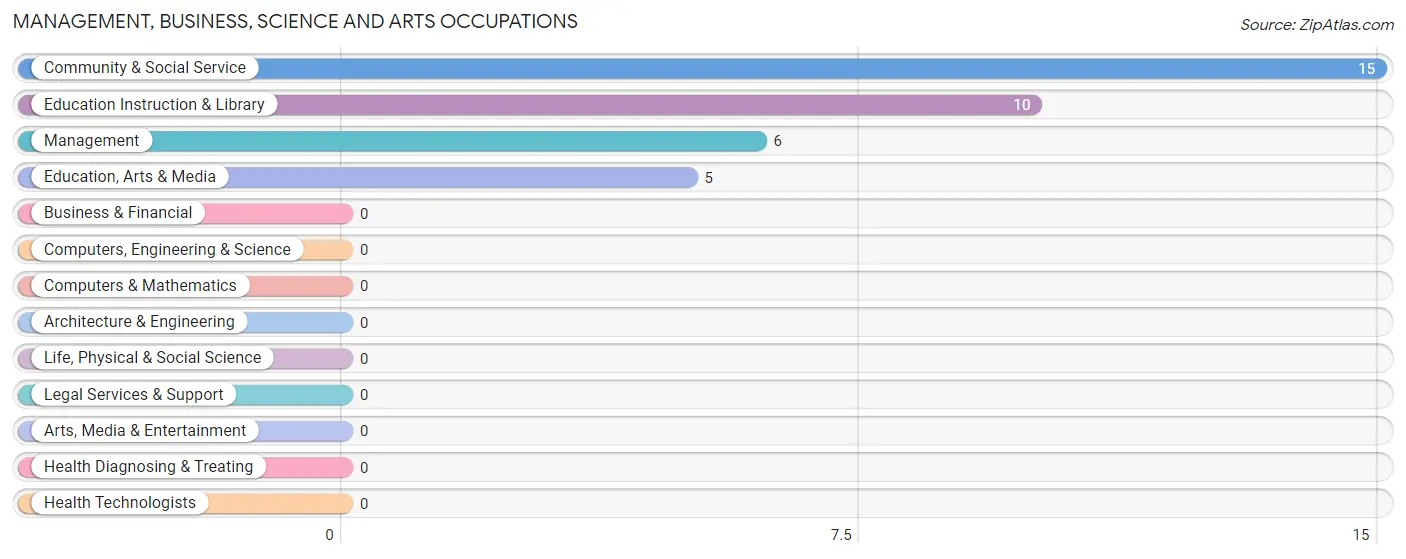
The most common Management, Business, Science and Arts occupations in Greenville are Community & Social Service (15 | 12.4%), Education Instruction & Library (10 | 8.3%), Management (6 | 5.0%), and Education, Arts & Media (5 | 4.1%).
Management, Business, Science and Arts Occupations by Sex
Within the Management, Business, Science and Arts occupations in Greenville, the most male-oriented occupations are Management (100.0%), Education Instruction & Library (40.0%), and Community & Social Service (26.7%), while the most female-oriented occupations are Education, Arts & Media (100.0%), Community & Social Service (73.3%), and Education Instruction & Library (60.0%).
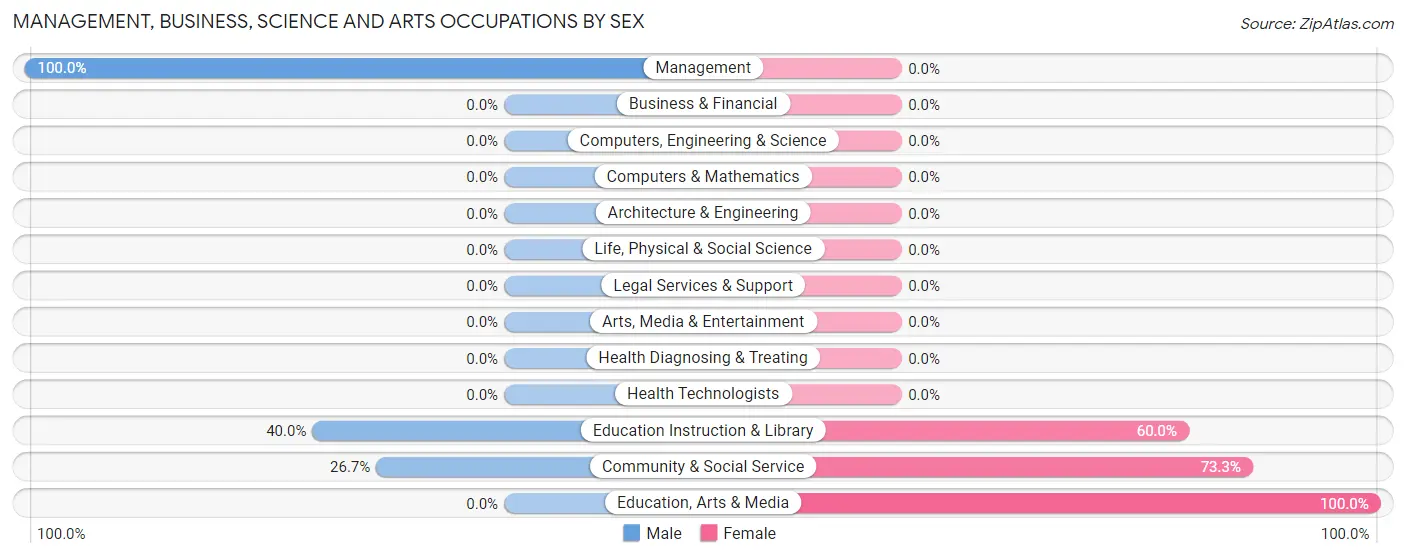
| Occupation | Male | Female |
| Management | 6 (100.0%) | 0 (0.0%) |
| Business & Financial | 0 (0.0%) | 0 (0.0%) |
| Computers, Engineering & Science | 0 (0.0%) | 0 (0.0%) |
| Computers & Mathematics | 0 (0.0%) | 0 (0.0%) |
| Architecture & Engineering | 0 (0.0%) | 0 (0.0%) |
| Life, Physical & Social Science | 0 (0.0%) | 0 (0.0%) |
| Community & Social Service | 4 (26.7%) | 11 (73.3%) |
| Education, Arts & Media | 0 (0.0%) | 5 (100.0%) |
| Legal Services & Support | 0 (0.0%) | 0 (0.0%) |
| Education Instruction & Library | 4 (40.0%) | 6 (60.0%) |
| Arts, Media & Entertainment | 0 (0.0%) | 0 (0.0%) |
| Health Diagnosing & Treating | 0 (0.0%) | 0 (0.0%) |
| Health Technologists | 0 (0.0%) | 0 (0.0%) |
| Total (Category) | 10 (47.6%) | 11 (52.4%) |
| Total (Overall) | 61 (50.4%) | 60 (49.6%) |
Services Occupations
The most common Services occupations in Greenville are Healthcare Support (16 | 13.2%), Cleaning & Maintenance (6 | 5.0%), and Personal Care & Service (4 | 3.3%).
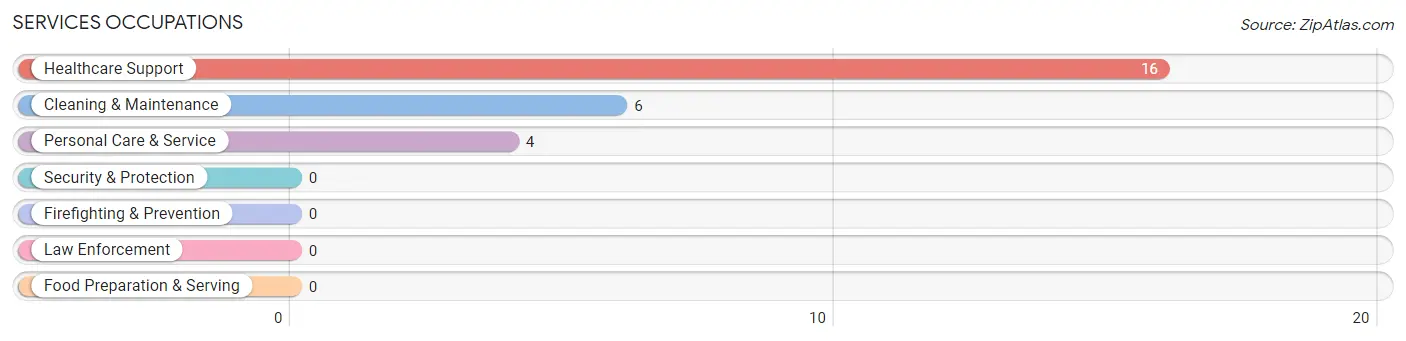
Services Occupations by Sex
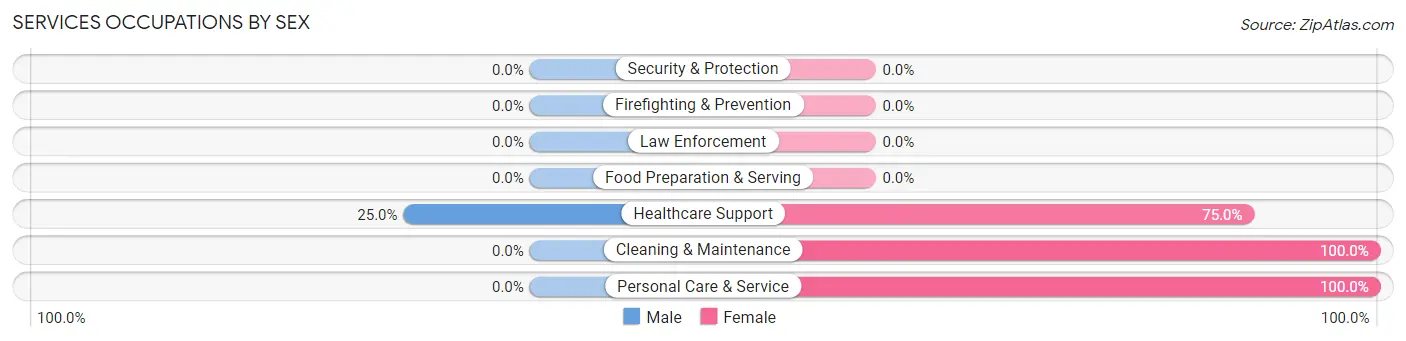
| Occupation | Male | Female |
| Healthcare Support | 4 (25.0%) | 12 (75.0%) |
| Security & Protection | 0 (0.0%) | 0 (0.0%) |
| Firefighting & Prevention | 0 (0.0%) | 0 (0.0%) |
| Law Enforcement | 0 (0.0%) | 0 (0.0%) |
| Food Preparation & Serving | 0 (0.0%) | 0 (0.0%) |
| Cleaning & Maintenance | 0 (0.0%) | 6 (100.0%) |
| Personal Care & Service | 0 (0.0%) | 4 (100.0%) |
| Total (Category) | 4 (15.4%) | 22 (84.6%) |
| Total (Overall) | 61 (50.4%) | 60 (49.6%) |
Sales and Office Occupations
The most common Sales and Office occupations in Greenville are , and Sales & Related (14 | 11.6%).
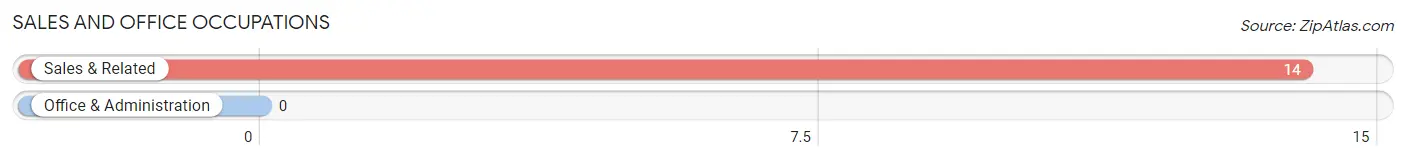
Sales and Office Occupations by Sex
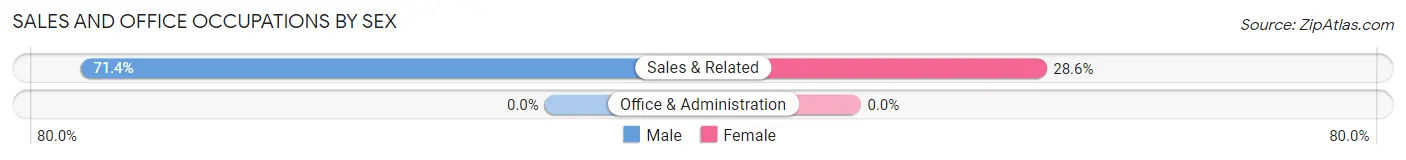
| Occupation | Male | Female |
| Sales & Related | 10 (71.4%) | 4 (28.6%) |
| Office & Administration | 0 (0.0%) | 0 (0.0%) |
| Total (Category) | 10 (71.4%) | 4 (28.6%) |
| Total (Overall) | 61 (50.4%) | 60 (49.6%) |
Natural Resources, Construction and Maintenance Occupations
The most common Natural Resources, Construction and Maintenance occupations in Greenville are Installation, Maintenance & Repair (15 | 12.4%), and Construction & Extraction (13 | 10.7%).

Natural Resources, Construction and Maintenance Occupations by Sex
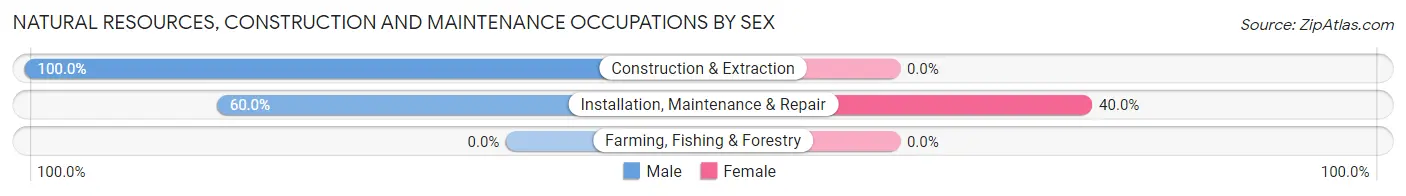
| Occupation | Male | Female |
| Farming, Fishing & Forestry | 0 (0.0%) | 0 (0.0%) |
| Construction & Extraction | 13 (100.0%) | 0 (0.0%) |
| Installation, Maintenance & Repair | 9 (60.0%) | 6 (40.0%) |
| Total (Category) | 22 (78.6%) | 6 (21.4%) |
| Total (Overall) | 61 (50.4%) | 60 (49.6%) |
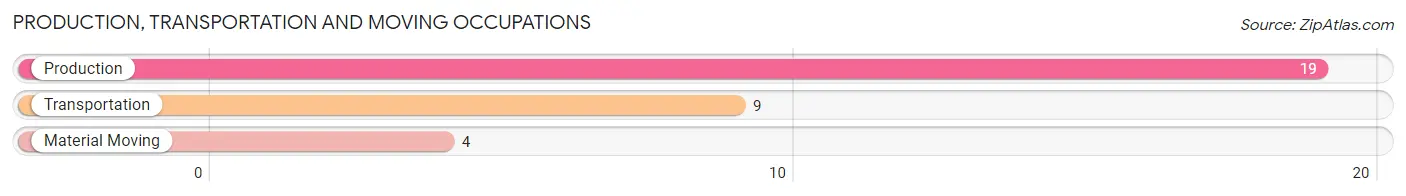
Production, Transportation and Moving Occupations
The most common Production, Transportation and Moving occupations in Greenville are Production (19 | 15.7%), Transportation (9 | 7.4%), and Material Moving (4 | 3.3%).
Production, Transportation and Moving Occupations by Sex
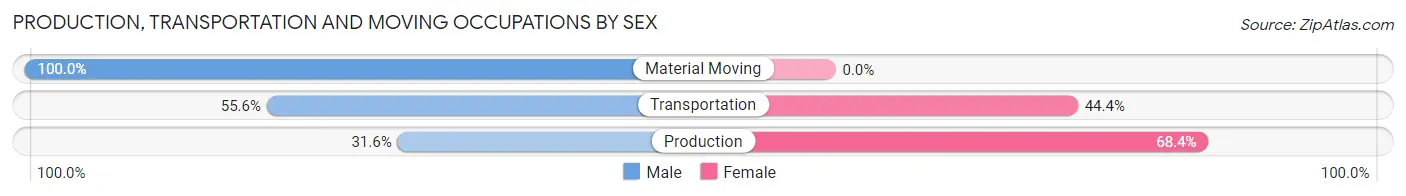
| Occupation | Male | Female |
| Production | 6 (31.6%) | 13 (68.4%) |
| Transportation | 5 (55.6%) | 4 (44.4%) |
| Material Moving | 4 (100.0%) | 0 (0.0%) |
| Total (Category) | 15 (46.9%) | 17 (53.1%) |
| Total (Overall) | 61 (50.4%) | 60 (49.6%) |
Employment Industries by Sex in Greenville
Employment Industries in Greenville
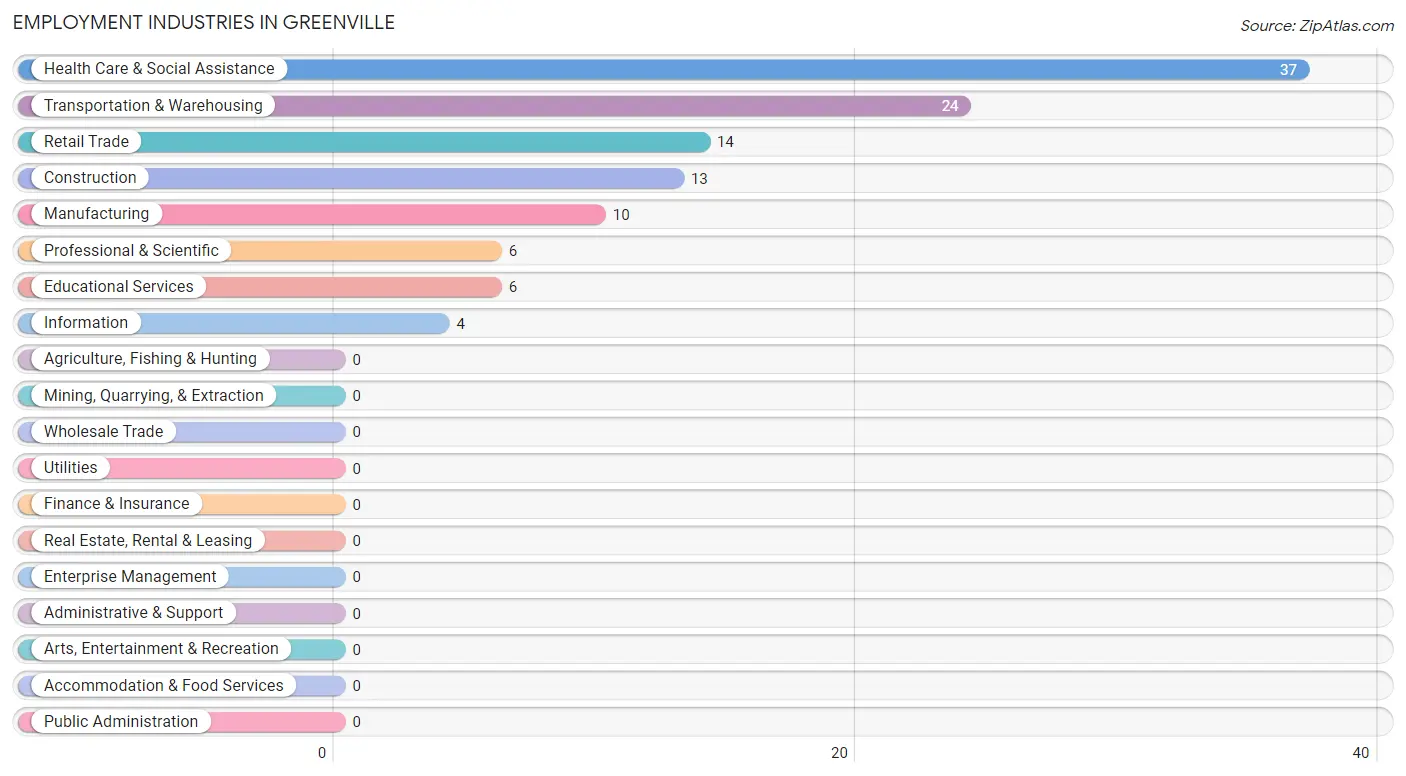
The major employment industries in Greenville include Health Care & Social Assistance (37 | 30.6%), Transportation & Warehousing (24 | 19.8%), Retail Trade (14 | 11.6%), Construction (13 | 10.7%), and Manufacturing (10 | 8.3%).
Employment Industries by Sex in Greenville
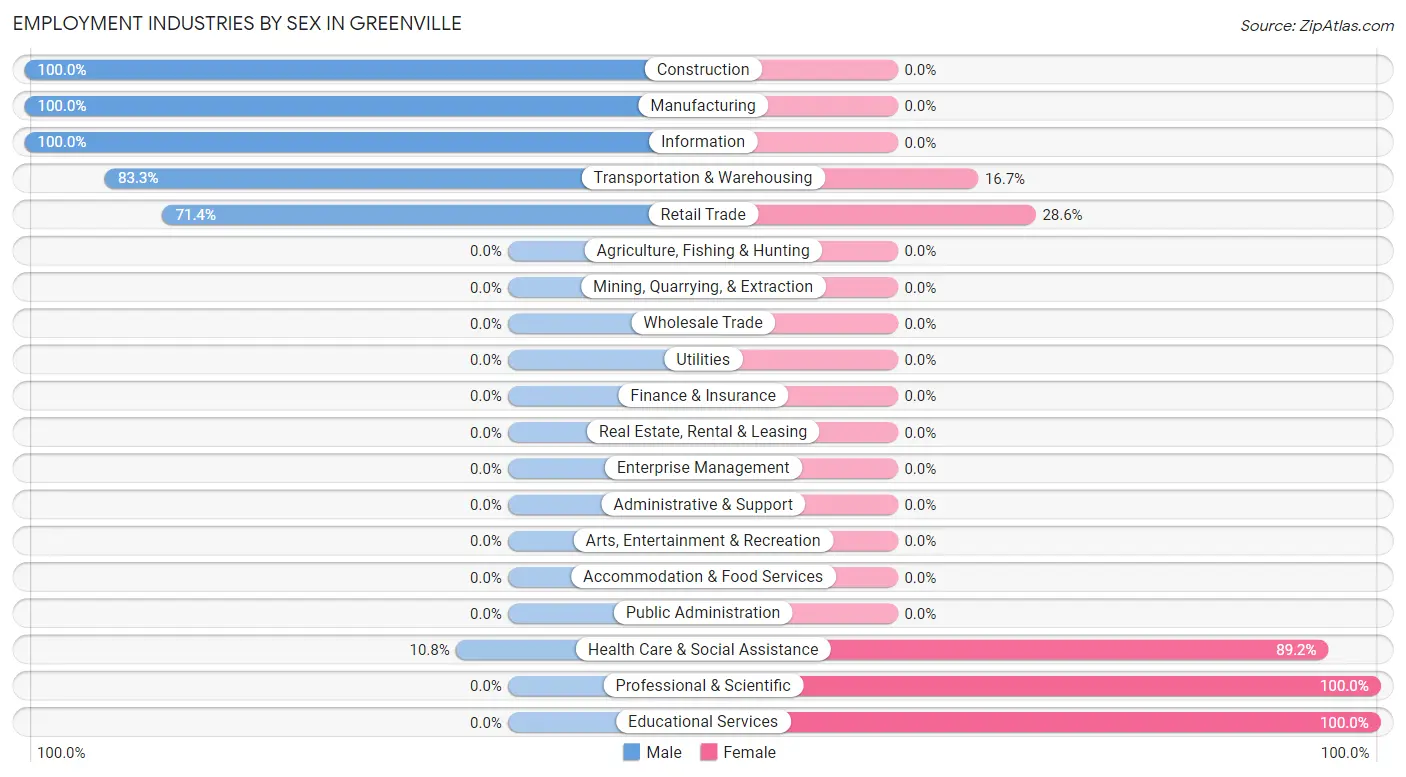
The Greenville industries that see more men than women are Construction (100.0%), Manufacturing (100.0%), and Information (100.0%), whereas the industries that tend to have a higher number of women are Professional & Scientific (100.0%), Educational Services (100.0%), and Health Care & Social Assistance (89.2%).
| Industry | Male | Female |
| Agriculture, Fishing & Hunting | 0 (0.0%) | 0 (0.0%) |
| Mining, Quarrying, & Extraction | 0 (0.0%) | 0 (0.0%) |
| Construction | 13 (100.0%) | 0 (0.0%) |
| Manufacturing | 10 (100.0%) | 0 (0.0%) |
| Wholesale Trade | 0 (0.0%) | 0 (0.0%) |
| Retail Trade | 10 (71.4%) | 4 (28.6%) |
| Transportation & Warehousing | 20 (83.3%) | 4 (16.7%) |
| Utilities | 0 (0.0%) | 0 (0.0%) |
| Information | 4 (100.0%) | 0 (0.0%) |
| Finance & Insurance | 0 (0.0%) | 0 (0.0%) |
| Real Estate, Rental & Leasing | 0 (0.0%) | 0 (0.0%) |
| Professional & Scientific | 0 (0.0%) | 6 (100.0%) |
| Enterprise Management | 0 (0.0%) | 0 (0.0%) |
| Administrative & Support | 0 (0.0%) | 0 (0.0%) |
| Educational Services | 0 (0.0%) | 6 (100.0%) |
| Health Care & Social Assistance | 4 (10.8%) | 33 (89.2%) |
| Arts, Entertainment & Recreation | 0 (0.0%) | 0 (0.0%) |
| Accommodation & Food Services | 0 (0.0%) | 0 (0.0%) |
| Public Administration | 0 (0.0%) | 0 (0.0%) |
| Total | 61 (50.4%) | 60 (49.6%) |
Education in Greenville
School Enrollment in Greenville
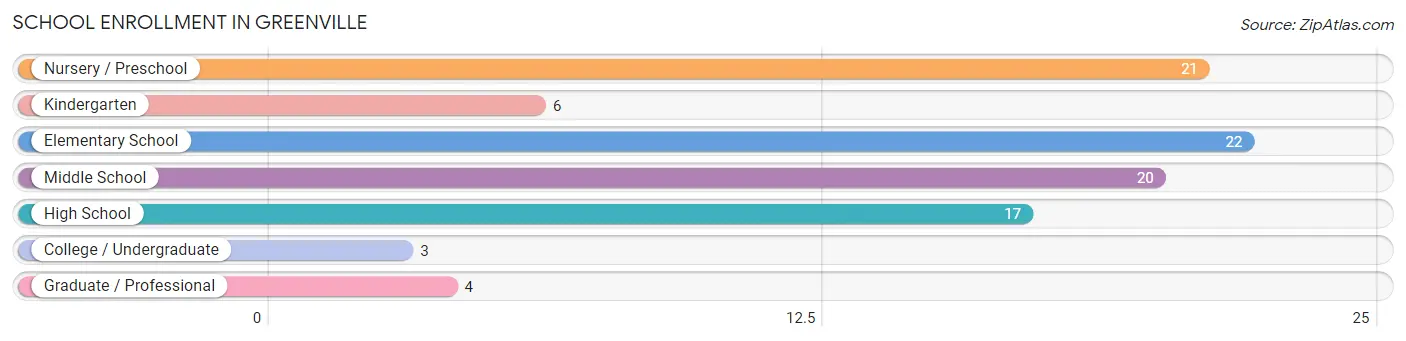
The most common levels of schooling among the 93 students in Greenville are elementary school (22 | 23.7%), nursery / preschool (21 | 22.6%), and middle school (20 | 21.5%).
| School Level | # Students | % Students |
| Nursery / Preschool | 21 | 22.6% |
| Kindergarten | 6 | 6.5% |
| Elementary School | 22 | 23.7% |
| Middle School | 20 | 21.5% |
| High School | 17 | 18.3% |
| College / Undergraduate | 3 | 3.2% |
| Graduate / Professional | 4 | 4.3% |
| Total | 93 | 100.0% |
School Enrollment by Age by Funding Source in Greenville
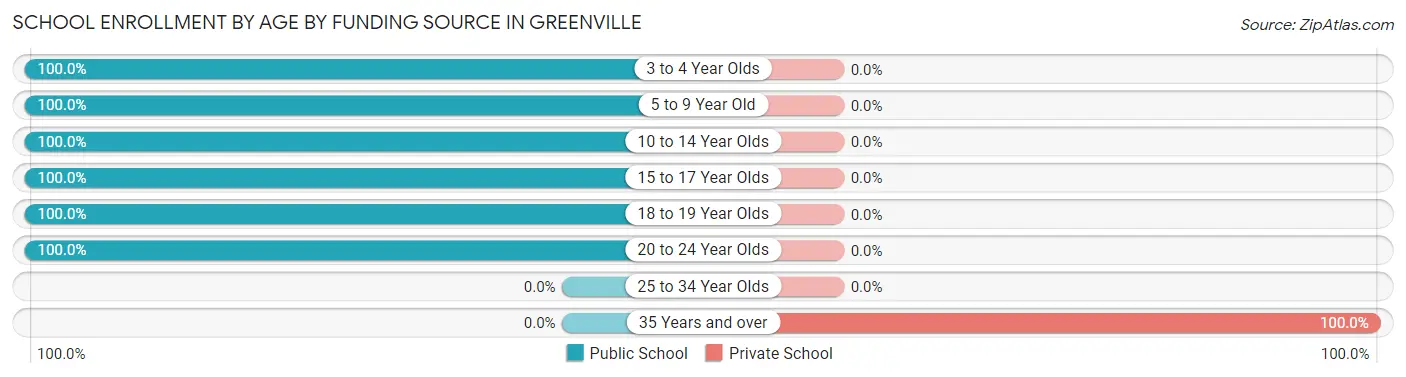
Out of a total of 93 students who are enrolled in schools in Greenville, 3 (3.2%) attend a private institution, while the remaining 90 (96.8%) are enrolled in public schools. The age group of 35 years and over has the highest likelihood of being enrolled in private schools, with 3 (100.0% in the age bracket) enrolled. Conversely, the age group of 3 to 4 year olds has the lowest likelihood of being enrolled in a private school, with 8 (100.0% in the age bracket) attending a public institution.
| Age Bracket | Public School | Private School |
| 3 to 4 Year Olds | 8 (100.0%) | 0 (0.0%) |
| 5 to 9 Year Old | 28 (100.0%) | 0 (0.0%) |
| 10 to 14 Year Olds | 46 (100.0%) | 0 (0.0%) |
| 15 to 17 Year Olds | 1 (100.0%) | 0 (0.0%) |
| 18 to 19 Year Olds | 3 (100.0%) | 0 (0.0%) |
| 20 to 24 Year Olds | 4 (100.0%) | 0 (0.0%) |
| 25 to 34 Year Olds | 0 (0.0%) | 0 (0.0%) |
| 35 Years and over | 0 (0.0%) | 3 (100.0%) |
| Total | 90 (96.8%) | 3 (3.2%) |
Educational Attainment by Field of Study in Greenville
Education (4 | 57.1%), and business (3 | 42.9%) are the most common fields of study among 7 individuals in Greenville who have obtained a bachelor's degree or higher.
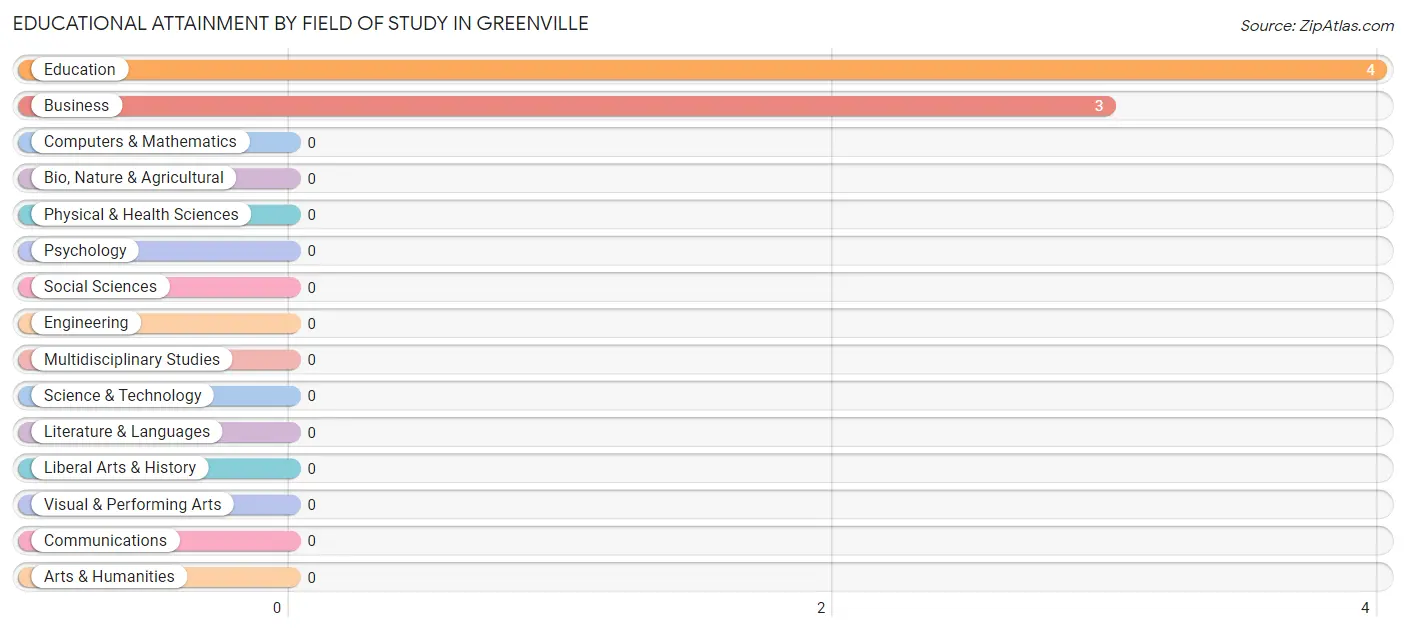
| Field of Study | # Graduates | % Graduates |
| Computers & Mathematics | 0 | 0.0% |
| Bio, Nature & Agricultural | 0 | 0.0% |
| Physical & Health Sciences | 0 | 0.0% |
| Psychology | 0 | 0.0% |
| Social Sciences | 0 | 0.0% |
| Engineering | 0 | 0.0% |
| Multidisciplinary Studies | 0 | 0.0% |
| Science & Technology | 0 | 0.0% |
| Business | 3 | 42.9% |
| Education | 4 | 57.1% |
| Literature & Languages | 0 | 0.0% |
| Liberal Arts & History | 0 | 0.0% |
| Visual & Performing Arts | 0 | 0.0% |
| Communications | 0 | 0.0% |
| Arts & Humanities | 0 | 0.0% |
| Total | 7 | 100.0% |
Transportation & Commute in Greenville
Vehicle Availability by Sex in Greenville
The most prevalent vehicle ownership categories in Greenville are males with 2 vehicles (40, accounting for 65.6%) and females with 2 vehicles (47, making up 71.4%).
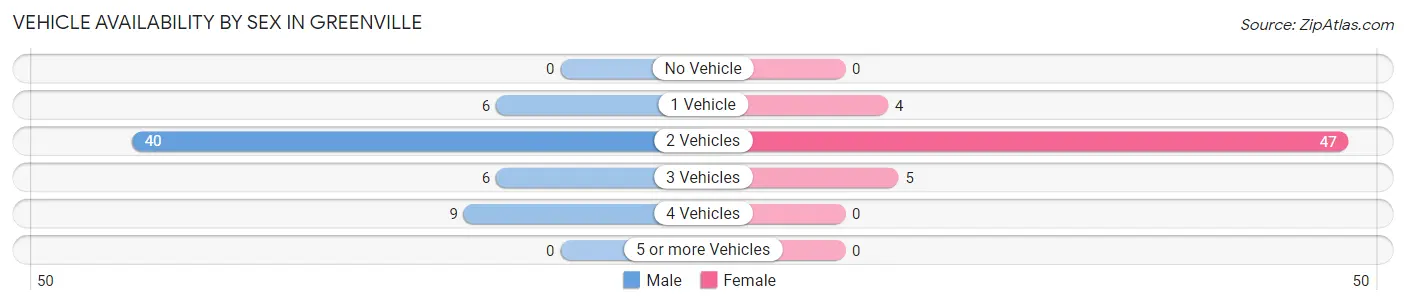
| Vehicles Available | Male | Female |
| No Vehicle | 0 (0.0%) | 0 (0.0%) |
| 1 Vehicle | 6 (9.8%) | 4 (7.1%) |
| 2 Vehicles | 40 (65.6%) | 47 (83.9%) |
| 3 Vehicles | 6 (9.8%) | 5 (8.9%) |
| 4 Vehicles | 9 (14.7%) | 0 (0.0%) |
| 5 or more Vehicles | 0 (0.0%) | 0 (0.0%) |
| Total | 61 (100.0%) | 56 (100.0%) |
Commute Time in Greenville
The most frequently occuring commute durations in Greenville are 30 to 34 minutes (29 commuters, 26.9%), less than 5 minutes (28 commuters, 25.9%), and 5 to 9 minutes (18 commuters, 16.7%).
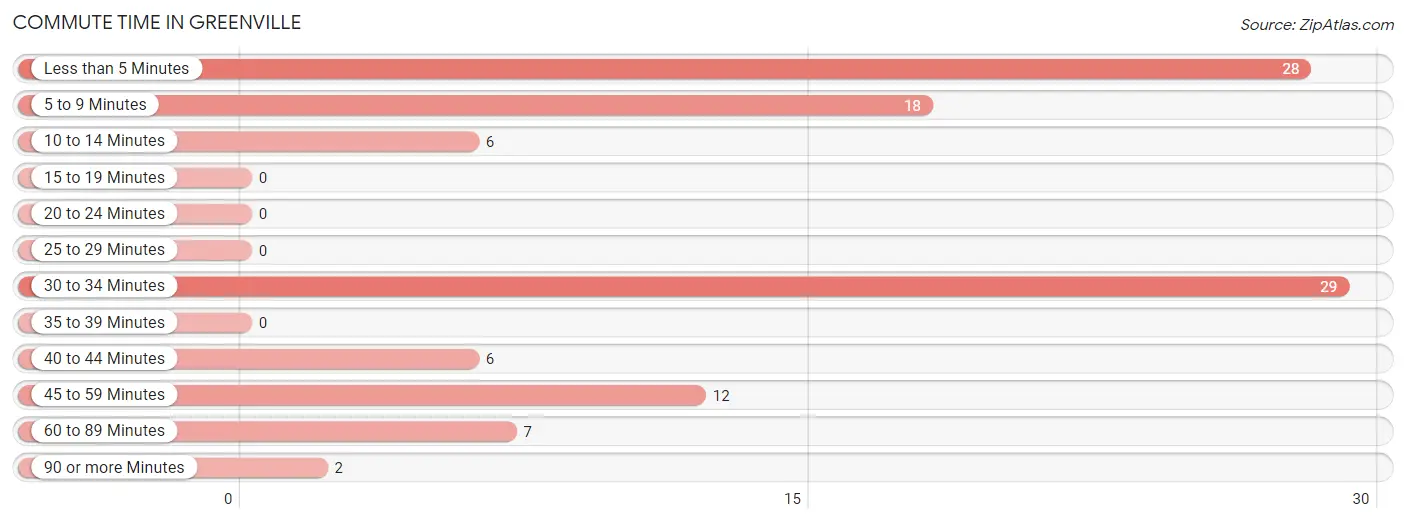
| Commute Time | # Commuters | % Commuters |
| Less than 5 Minutes | 28 | 25.9% |
| 5 to 9 Minutes | 18 | 16.7% |
| 10 to 14 Minutes | 6 | 5.6% |
| 15 to 19 Minutes | 0 | 0.0% |
| 20 to 24 Minutes | 0 | 0.0% |
| 25 to 29 Minutes | 0 | 0.0% |
| 30 to 34 Minutes | 29 | 26.9% |
| 35 to 39 Minutes | 0 | 0.0% |
| 40 to 44 Minutes | 6 | 5.6% |
| 45 to 59 Minutes | 12 | 11.1% |
| 60 to 89 Minutes | 7 | 6.5% |
| 90 or more Minutes | 2 | 1.8% |
Commute Time by Sex in Greenville
The most common commute times in Greenville are less than 5 minutes (19 commuters, 32.8%) for males and 5 to 9 minutes (17 commuters, 34.0%) for females.
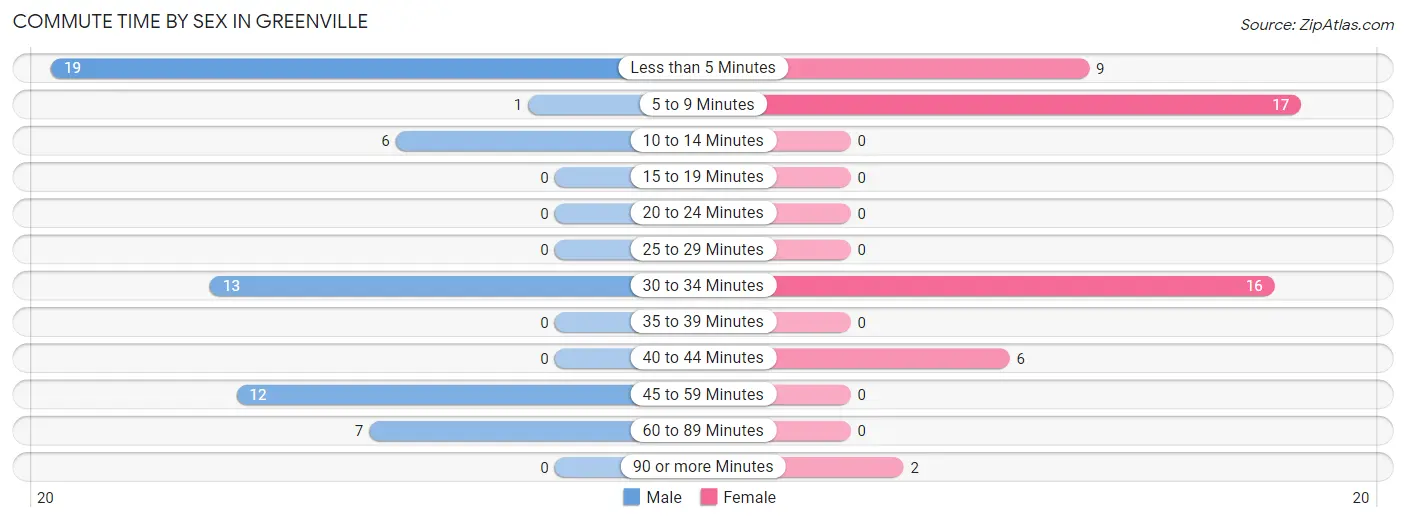
| Commute Time | Male | Female |
| Less than 5 Minutes | 19 (32.8%) | 9 (18.0%) |
| 5 to 9 Minutes | 1 (1.7%) | 17 (34.0%) |
| 10 to 14 Minutes | 6 (10.3%) | 0 (0.0%) |
| 15 to 19 Minutes | 0 (0.0%) | 0 (0.0%) |
| 20 to 24 Minutes | 0 (0.0%) | 0 (0.0%) |
| 25 to 29 Minutes | 0 (0.0%) | 0 (0.0%) |
| 30 to 34 Minutes | 13 (22.4%) | 16 (32.0%) |
| 35 to 39 Minutes | 0 (0.0%) | 0 (0.0%) |
| 40 to 44 Minutes | 0 (0.0%) | 6 (12.0%) |
| 45 to 59 Minutes | 12 (20.7%) | 0 (0.0%) |
| 60 to 89 Minutes | 7 (12.1%) | 0 (0.0%) |
| 90 or more Minutes | 0 (0.0%) | 2 (4.0%) |
Time of Departure to Work by Sex in Greenville
The most frequent times of departure to work in Greenville are 6:30 AM to 6:59 AM (17, 29.3%) for males and 6:30 AM to 6:59 AM (13, 26.0%) for females.
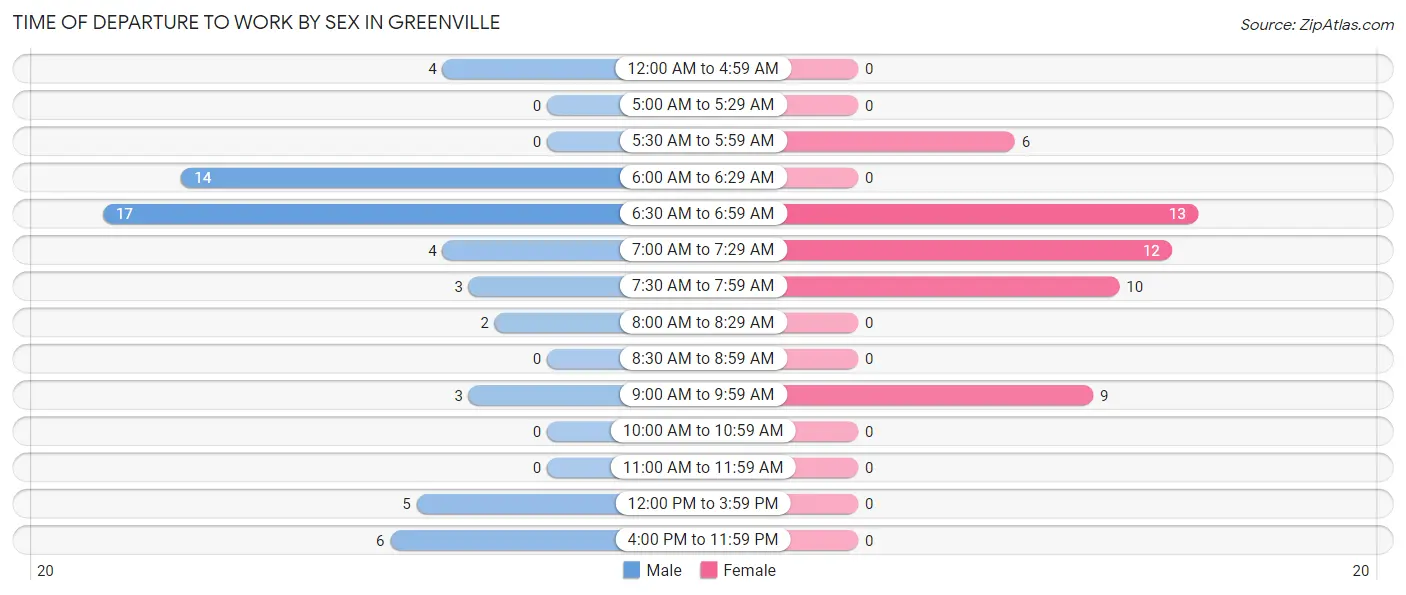
| Time of Departure | Male | Female |
| 12:00 AM to 4:59 AM | 4 (6.9%) | 0 (0.0%) |
| 5:00 AM to 5:29 AM | 0 (0.0%) | 0 (0.0%) |
| 5:30 AM to 5:59 AM | 0 (0.0%) | 6 (12.0%) |
| 6:00 AM to 6:29 AM | 14 (24.1%) | 0 (0.0%) |
| 6:30 AM to 6:59 AM | 17 (29.3%) | 13 (26.0%) |
| 7:00 AM to 7:29 AM | 4 (6.9%) | 12 (24.0%) |
| 7:30 AM to 7:59 AM | 3 (5.2%) | 10 (20.0%) |
| 8:00 AM to 8:29 AM | 2 (3.5%) | 0 (0.0%) |
| 8:30 AM to 8:59 AM | 0 (0.0%) | 0 (0.0%) |
| 9:00 AM to 9:59 AM | 3 (5.2%) | 9 (18.0%) |
| 10:00 AM to 10:59 AM | 0 (0.0%) | 0 (0.0%) |
| 11:00 AM to 11:59 AM | 0 (0.0%) | 0 (0.0%) |
| 12:00 PM to 3:59 PM | 5 (8.6%) | 0 (0.0%) |
| 4:00 PM to 11:59 PM | 6 (10.3%) | 0 (0.0%) |
| Total | 58 (100.0%) | 50 (100.0%) |
Housing Occupancy in Greenville
Occupancy by Ownership in Greenville
Of the total 127 dwellings in Greenville, owner-occupied units account for 102 (80.3%), while renter-occupied units make up 25 (19.7%).
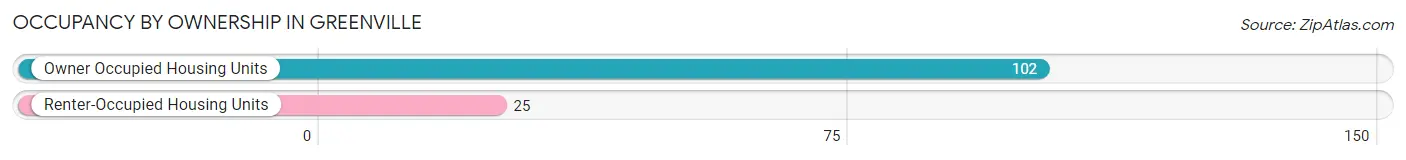
| Occupancy | # Housing Units | % Housing Units |
| Owner Occupied Housing Units | 102 | 80.3% |
| Renter-Occupied Housing Units | 25 | 19.7% |
| Total Occupied Housing Units | 127 | 100.0% |
Occupancy by Household Size in Greenville
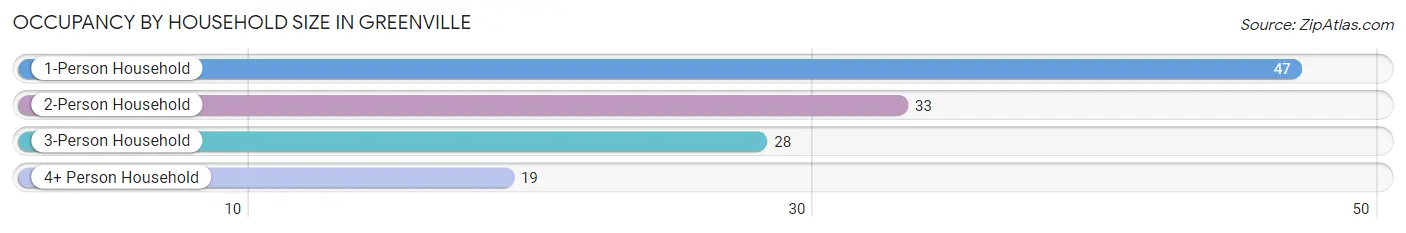
| Household Size | # Housing Units | % Housing Units |
| 1-Person Household | 47 | 37.0% |
| 2-Person Household | 33 | 26.0% |
| 3-Person Household | 28 | 22.1% |
| 4+ Person Household | 19 | 15.0% |
| Total Housing Units | 127 | 100.0% |
Occupancy by Ownership by Household Size in Greenville
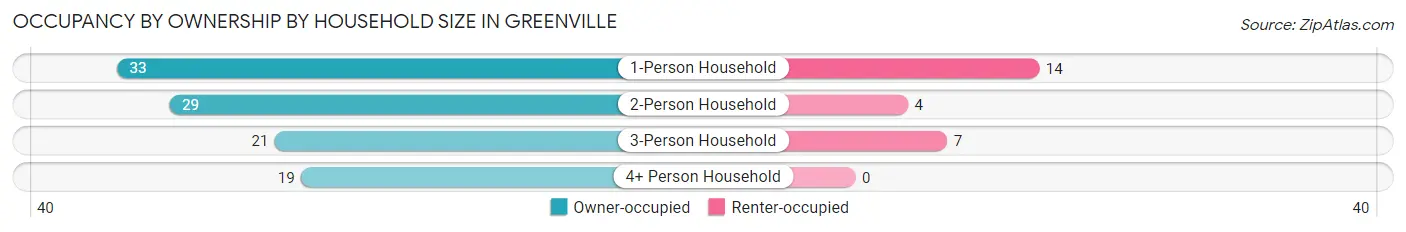
| Household Size | Owner-occupied | Renter-occupied |
| 1-Person Household | 33 (70.2%) | 14 (29.8%) |
| 2-Person Household | 29 (87.9%) | 4 (12.1%) |
| 3-Person Household | 21 (75.0%) | 7 (25.0%) |
| 4+ Person Household | 19 (100.0%) | 0 (0.0%) |
| Total Housing Units | 102 (80.3%) | 25 (19.7%) |
Occupancy by Educational Attainment in Greenville
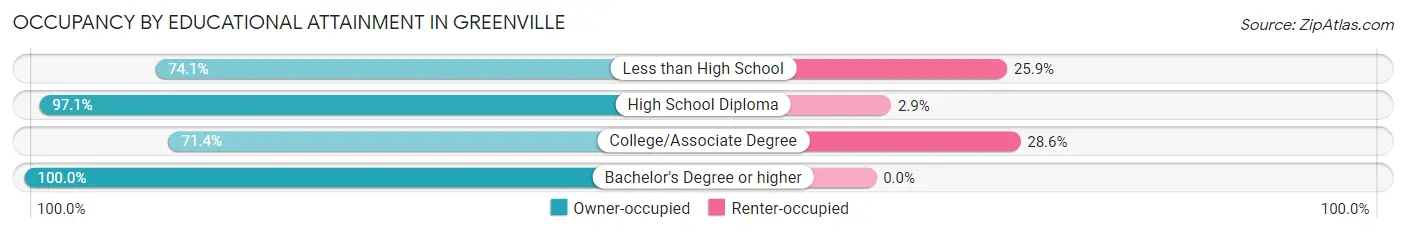
| Household Size | Owner-occupied | Renter-occupied |
| Less than High School | 40 (74.1%) | 14 (25.9%) |
| High School Diploma | 33 (97.1%) | 1 (2.9%) |
| College/Associate Degree | 25 (71.4%) | 10 (28.6%) |
| Bachelor's Degree or higher | 4 (100.0%) | 0 (0.0%) |
Occupancy by Age of Householder in Greenville
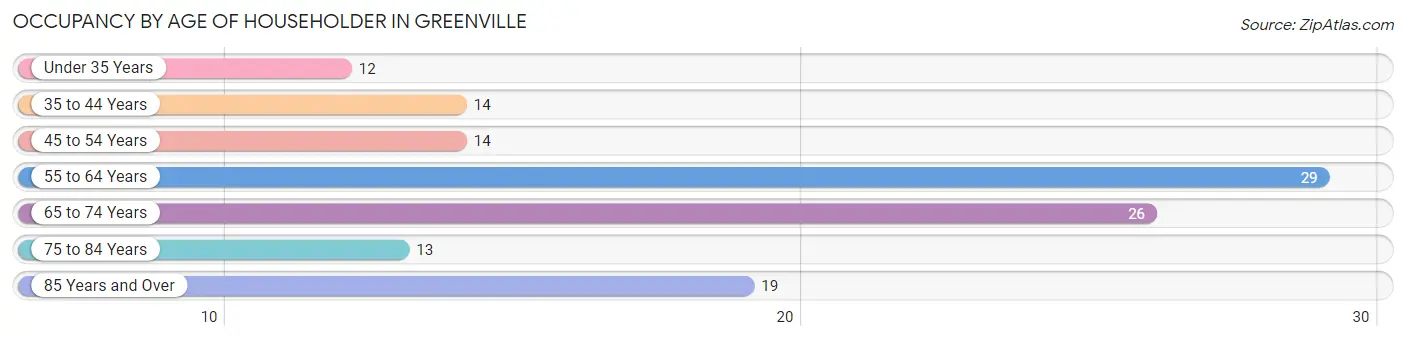
| Age Bracket | # Households | % Households |
| Under 35 Years | 12 | 9.5% |
| 35 to 44 Years | 14 | 11.0% |
| 45 to 54 Years | 14 | 11.0% |
| 55 to 64 Years | 29 | 22.8% |
| 65 to 74 Years | 26 | 20.5% |
| 75 to 84 Years | 13 | 10.2% |
| 85 Years and Over | 19 | 15.0% |
| Total | 127 | 100.0% |
Housing Finances in Greenville
Median Income by Occupancy in Greenville
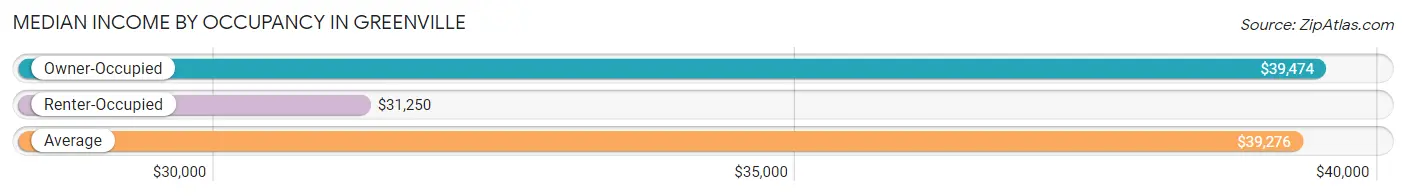
| Occupancy Type | # Households | Median Income |
| Owner-Occupied | 102 (80.3%) | $39,474 |
| Renter-Occupied | 25 (19.7%) | $31,250 |
| Average | 127 (100.0%) | $39,276 |
Occupancy by Householder Income Bracket in Greenville
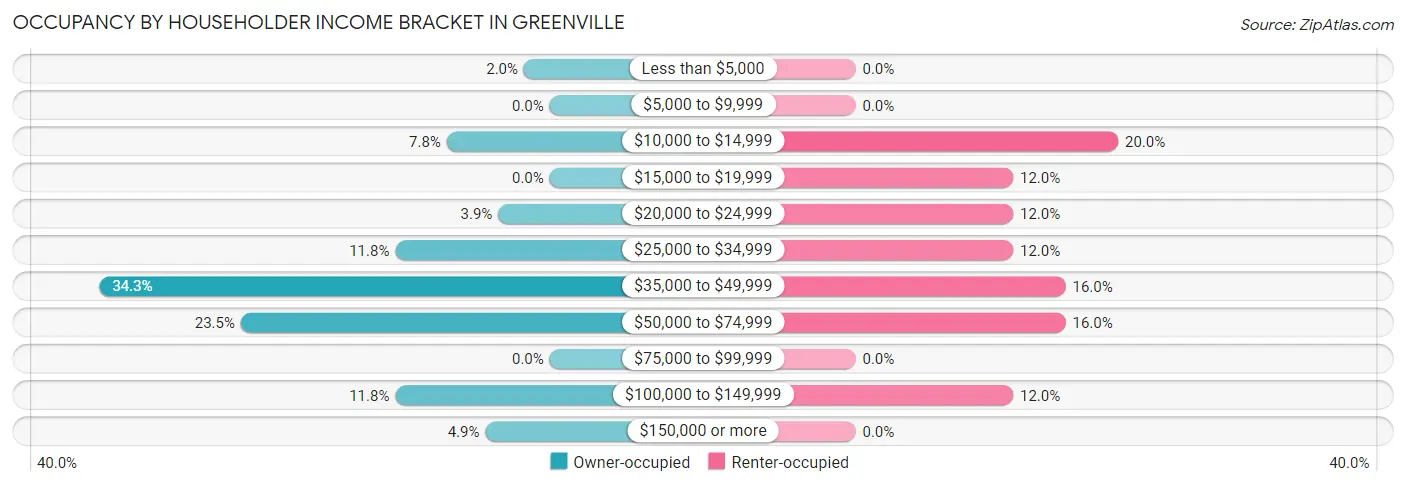
| Income Bracket | Owner-occupied | Renter-occupied |
| Less than $5,000 | 2 (2.0%) | 0 (0.0%) |
| $5,000 to $9,999 | 0 (0.0%) | 0 (0.0%) |
| $10,000 to $14,999 | 8 (7.8%) | 5 (20.0%) |
| $15,000 to $19,999 | 0 (0.0%) | 3 (12.0%) |
| $20,000 to $24,999 | 4 (3.9%) | 3 (12.0%) |
| $25,000 to $34,999 | 12 (11.8%) | 3 (12.0%) |
| $35,000 to $49,999 | 35 (34.3%) | 4 (16.0%) |
| $50,000 to $74,999 | 24 (23.5%) | 4 (16.0%) |
| $75,000 to $99,999 | 0 (0.0%) | 0 (0.0%) |
| $100,000 to $149,999 | 12 (11.8%) | 3 (12.0%) |
| $150,000 or more | 5 (4.9%) | 0 (0.0%) |
| Total | 102 (100.0%) | 25 (100.0%) |
Monthly Housing Cost Tiers in Greenville
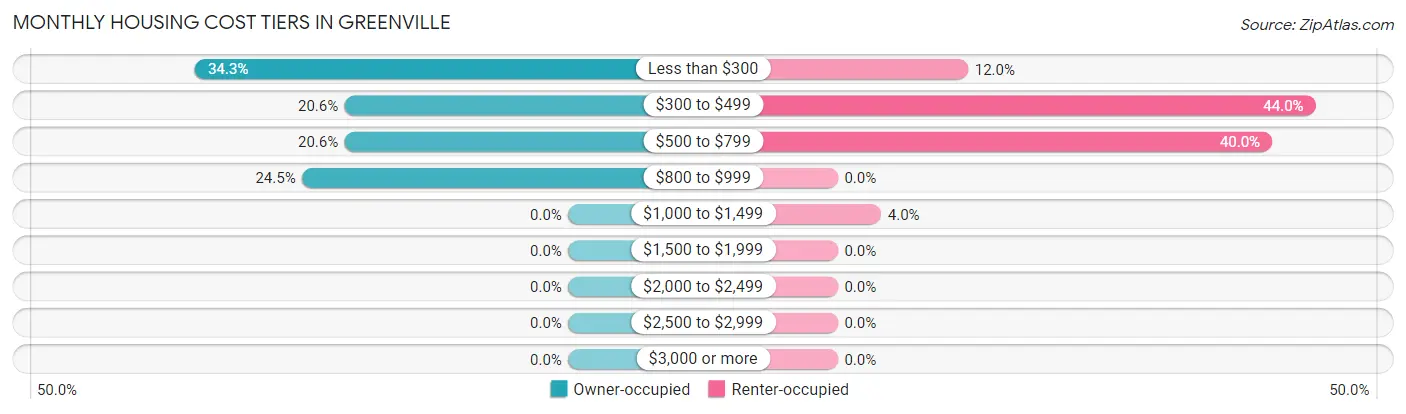
| Monthly Cost | Owner-occupied | Renter-occupied |
| Less than $300 | 35 (34.3%) | 3 (12.0%) |
| $300 to $499 | 21 (20.6%) | 11 (44.0%) |
| $500 to $799 | 21 (20.6%) | 10 (40.0%) |
| $800 to $999 | 25 (24.5%) | 0 (0.0%) |
| $1,000 to $1,499 | 0 (0.0%) | 1 (4.0%) |
| $1,500 to $1,999 | 0 (0.0%) | 0 (0.0%) |
| $2,000 to $2,499 | 0 (0.0%) | 0 (0.0%) |
| $2,500 to $2,999 | 0 (0.0%) | 0 (0.0%) |
| $3,000 or more | 0 (0.0%) | 0 (0.0%) |
| Total | 102 (100.0%) | 25 (100.0%) |
Physical Housing Characteristics in Greenville
Housing Structures in Greenville
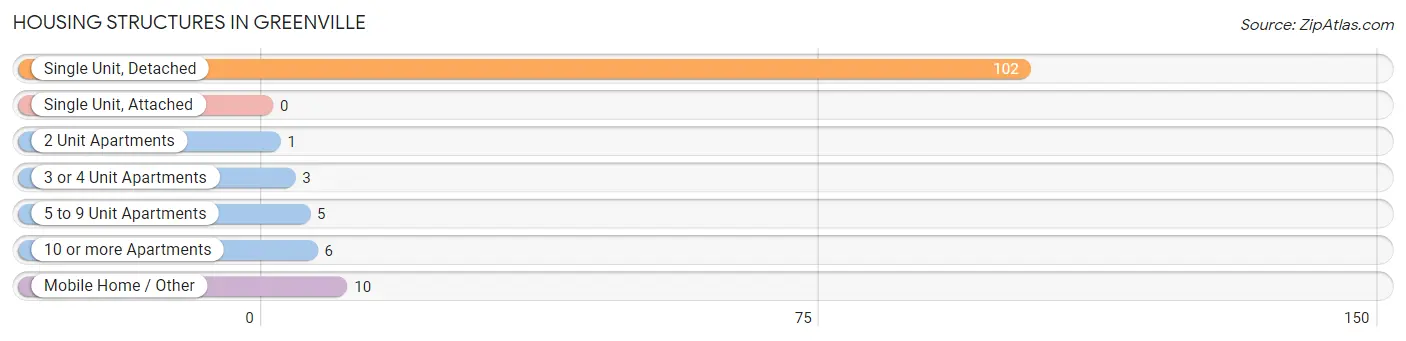
| Structure Type | # Housing Units | % Housing Units |
| Single Unit, Detached | 102 | 80.3% |
| Single Unit, Attached | 0 | 0.0% |
| 2 Unit Apartments | 1 | 0.8% |
| 3 or 4 Unit Apartments | 3 | 2.4% |
| 5 to 9 Unit Apartments | 5 | 3.9% |
| 10 or more Apartments | 6 | 4.7% |
| Mobile Home / Other | 10 | 7.9% |
| Total | 127 | 100.0% |
Housing Structures by Occupancy in Greenville
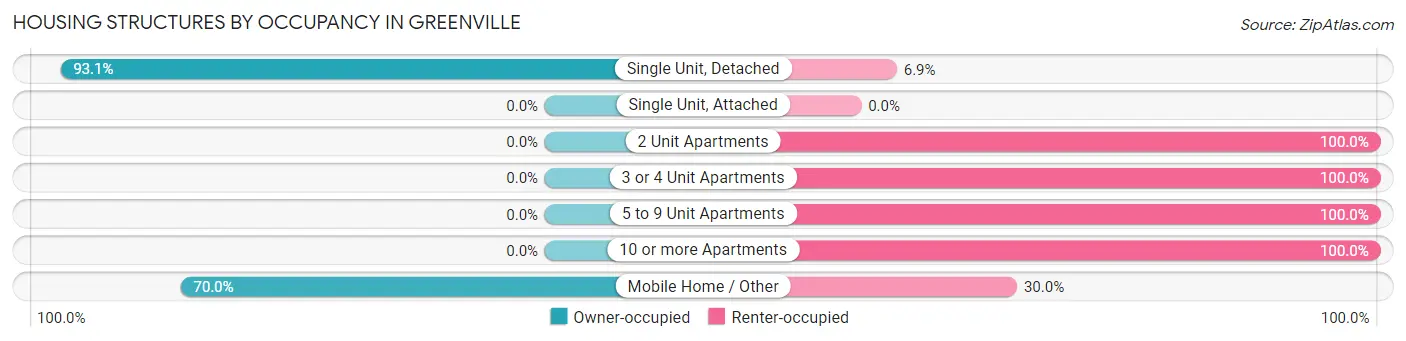
| Structure Type | Owner-occupied | Renter-occupied |
| Single Unit, Detached | 95 (93.1%) | 7 (6.9%) |
| Single Unit, Attached | 0 (0.0%) | 0 (0.0%) |
| 2 Unit Apartments | 0 (0.0%) | 1 (100.0%) |
| 3 or 4 Unit Apartments | 0 (0.0%) | 3 (100.0%) |
| 5 to 9 Unit Apartments | 0 (0.0%) | 5 (100.0%) |
| 10 or more Apartments | 0 (0.0%) | 6 (100.0%) |
| Mobile Home / Other | 7 (70.0%) | 3 (30.0%) |
| Total | 102 (80.3%) | 25 (19.7%) |
Housing Structures by Number of Rooms in Greenville
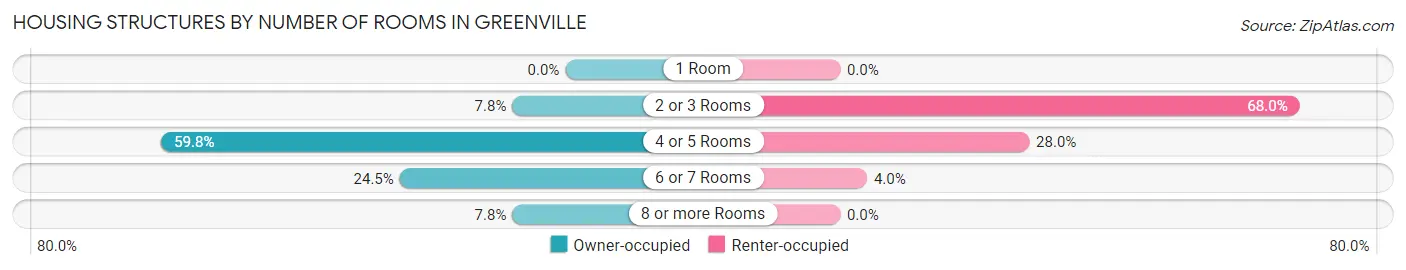
| Number of Rooms | Owner-occupied | Renter-occupied |
| 1 Room | 0 (0.0%) | 0 (0.0%) |
| 2 or 3 Rooms | 8 (7.8%) | 17 (68.0%) |
| 4 or 5 Rooms | 61 (59.8%) | 7 (28.0%) |
| 6 or 7 Rooms | 25 (24.5%) | 1 (4.0%) |
| 8 or more Rooms | 8 (7.8%) | 0 (0.0%) |
| Total | 102 (100.0%) | 25 (100.0%) |
Housing Structure by Heating Type in Greenville
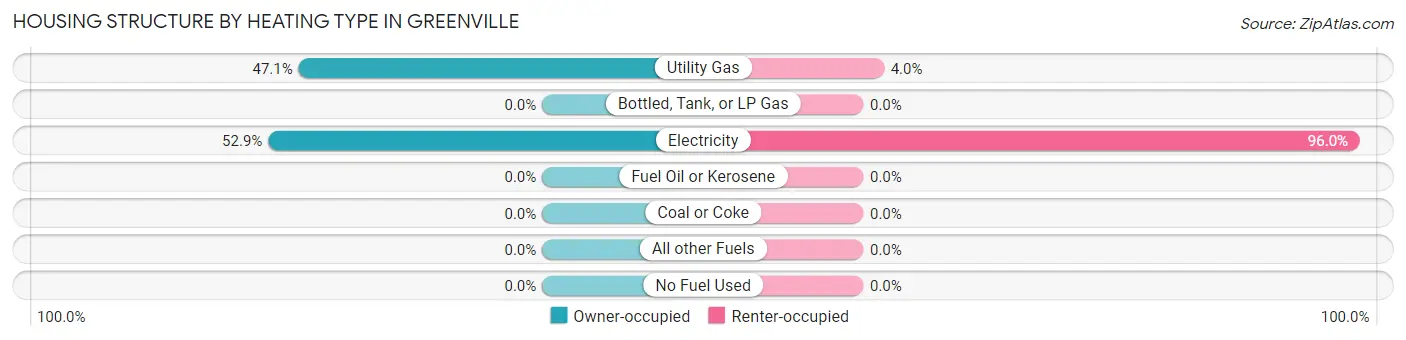
| Heating Type | Owner-occupied | Renter-occupied |
| Utility Gas | 48 (47.1%) | 1 (4.0%) |
| Bottled, Tank, or LP Gas | 0 (0.0%) | 0 (0.0%) |
| Electricity | 54 (52.9%) | 24 (96.0%) |
| Fuel Oil or Kerosene | 0 (0.0%) | 0 (0.0%) |
| Coal or Coke | 0 (0.0%) | 0 (0.0%) |
| All other Fuels | 0 (0.0%) | 0 (0.0%) |
| No Fuel Used | 0 (0.0%) | 0 (0.0%) |
| Total | 102 (100.0%) | 25 (100.0%) |
Household Vehicle Usage in Greenville
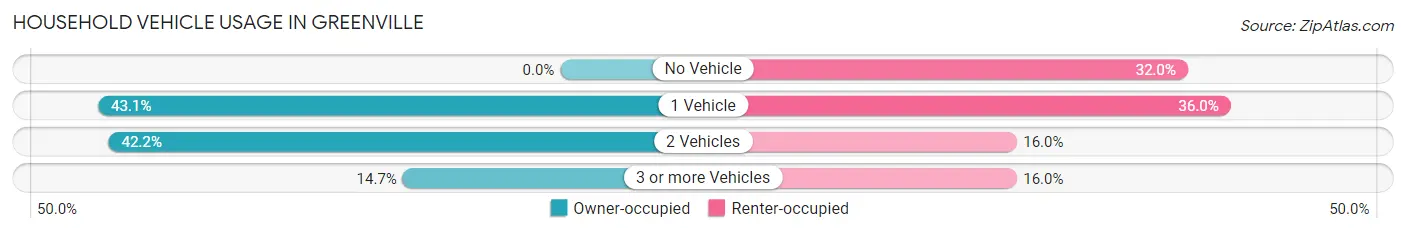
| Vehicles per Household | Owner-occupied | Renter-occupied |
| No Vehicle | 0 (0.0%) | 8 (32.0%) |
| 1 Vehicle | 44 (43.1%) | 9 (36.0%) |
| 2 Vehicles | 43 (42.2%) | 4 (16.0%) |
| 3 or more Vehicles | 15 (14.7%) | 4 (16.0%) |
| Total | 102 (100.0%) | 25 (100.0%) |
Real Estate & Mortgages in Greenville
Real Estate and Mortgage Overview in Greenville
| Characteristic | Without Mortgage | With Mortgage |
| Housing Units | 62 | 40 |
| Median Property Value | $131,500 | $94,000 |
| Median Household Income | $37,632 | $5 |
| Monthly Housing Costs | $291 | $0 |
| Real Estate Taxes | $1,083 | $0 |
Property Value by Mortgage Status in Greenville
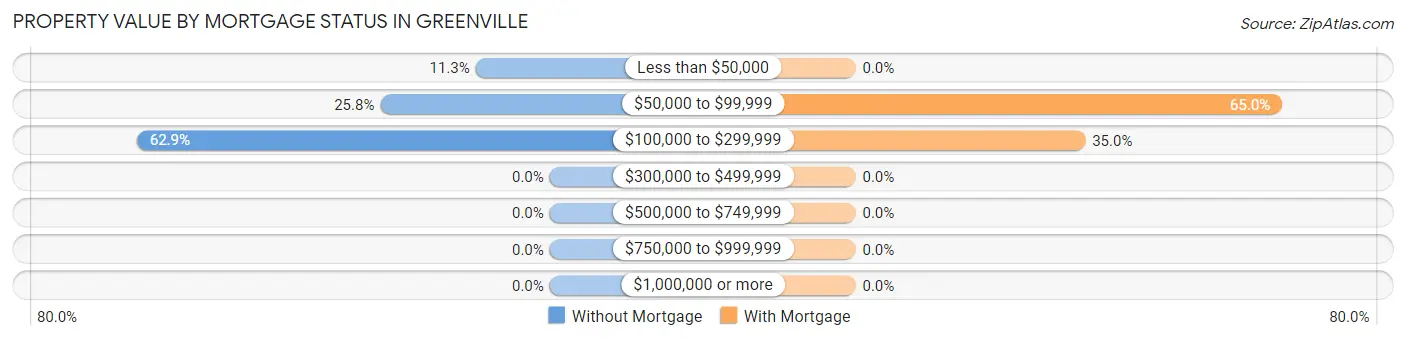
| Property Value | Without Mortgage | With Mortgage |
| Less than $50,000 | 7 (11.3%) | 0 (0.0%) |
| $50,000 to $99,999 | 16 (25.8%) | 26 (65.0%) |
| $100,000 to $299,999 | 39 (62.9%) | 14 (35.0%) |
| $300,000 to $499,999 | 0 (0.0%) | 0 (0.0%) |
| $500,000 to $749,999 | 0 (0.0%) | 0 (0.0%) |
| $750,000 to $999,999 | 0 (0.0%) | 0 (0.0%) |
| $1,000,000 or more | 0 (0.0%) | 0 (0.0%) |
| Total | 62 (100.0%) | 40 (100.0%) |
Household Income by Mortgage Status in Greenville
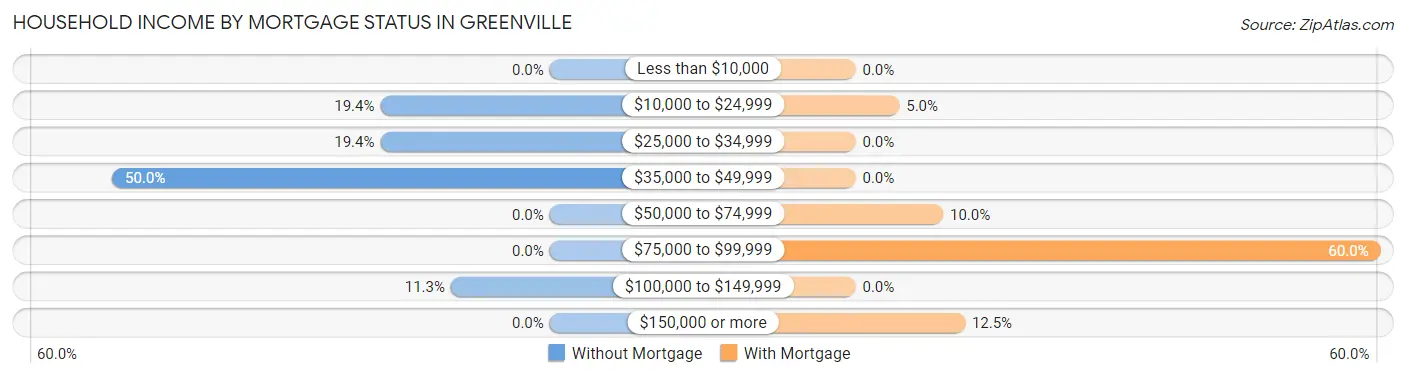
| Household Income | Without Mortgage | With Mortgage |
| Less than $10,000 | 0 (0.0%) | 0 (0.0%) |
| $10,000 to $24,999 | 12 (19.4%) | 2 (5.0%) |
| $25,000 to $34,999 | 12 (19.4%) | 0 (0.0%) |
| $35,000 to $49,999 | 31 (50.0%) | 0 (0.0%) |
| $50,000 to $74,999 | 0 (0.0%) | 4 (10.0%) |
| $75,000 to $99,999 | 0 (0.0%) | 24 (60.0%) |
| $100,000 to $149,999 | 7 (11.3%) | 0 (0.0%) |
| $150,000 or more | 0 (0.0%) | 5 (12.5%) |
| Total | 62 (100.0%) | 40 (100.0%) |
Property Value to Household Income Ratio in Greenville
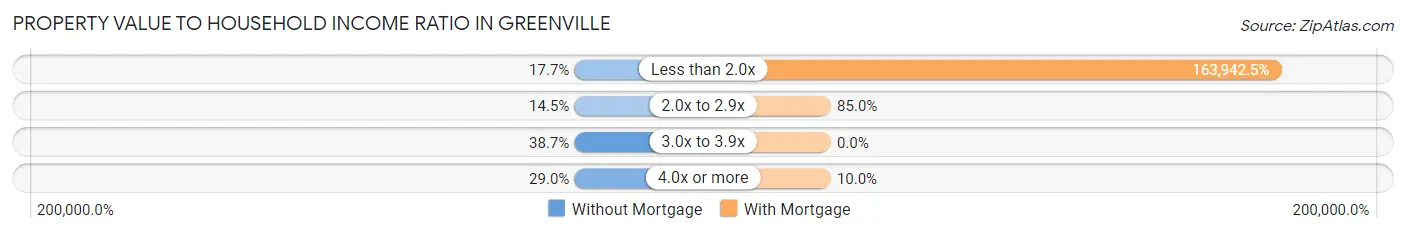
| Value-to-Income Ratio | Without Mortgage | With Mortgage |
| Less than 2.0x | 11 (17.7%) | 65,577 (163,942.5%) |
| 2.0x to 2.9x | 9 (14.5%) | 34 (85.0%) |
| 3.0x to 3.9x | 24 (38.7%) | 0 (0.0%) |
| 4.0x or more | 18 (29.0%) | 4 (10.0%) |
| Total | 62 (100.0%) | 40 (100.0%) |
Real Estate Taxes by Mortgage Status in Greenville
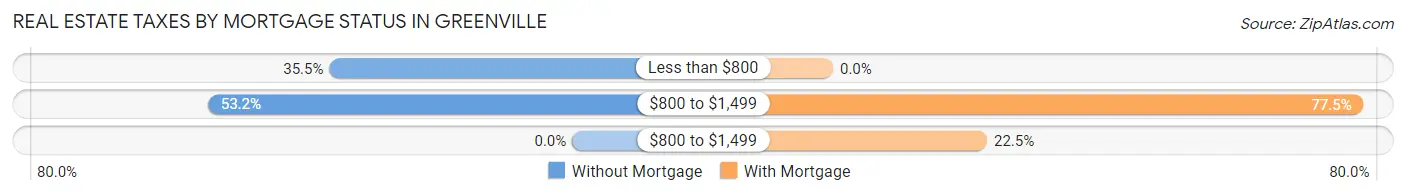
| Property Taxes | Without Mortgage | With Mortgage |
| Less than $800 | 22 (35.5%) | 0 (0.0%) |
| $800 to $1,499 | 33 (53.2%) | 31 (77.5%) |
| $800 to $1,499 | 0 (0.0%) | 9 (22.5%) |
| Total | 62 (100.0%) | 40 (100.0%) |
Health & Disability in Greenville
Health Insurance Coverage by Age in Greenville
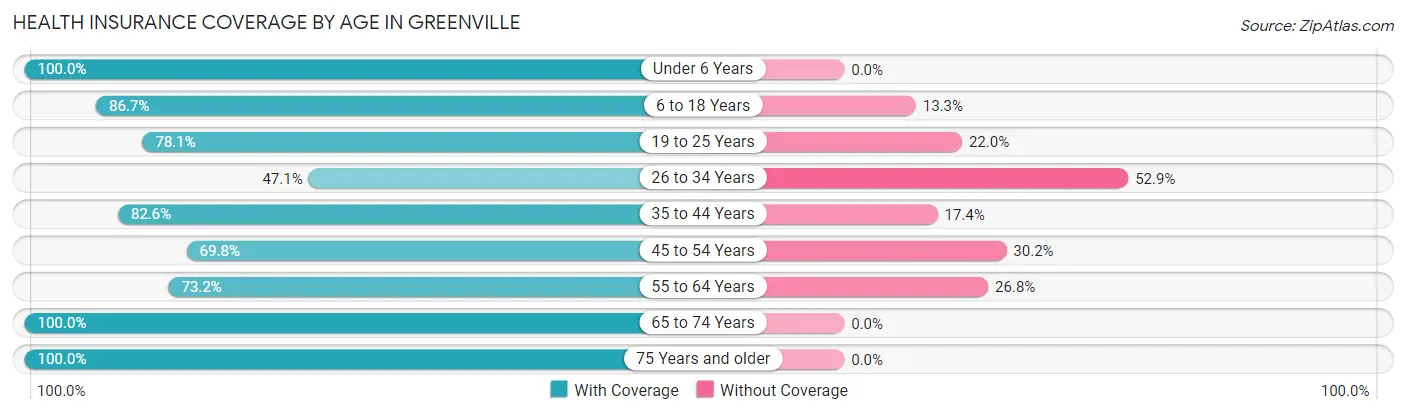
| Age Bracket | With Coverage | Without Coverage |
| Under 6 Years | 27 (100.0%) | 0 (0.0%) |
| 6 to 18 Years | 65 (86.7%) | 10 (13.3%) |
| 19 to 25 Years | 32 (78.0%) | 9 (22.0%) |
| 26 to 34 Years | 16 (47.1%) | 18 (52.9%) |
| 35 to 44 Years | 19 (82.6%) | 4 (17.4%) |
| 45 to 54 Years | 30 (69.8%) | 13 (30.2%) |
| 55 to 64 Years | 30 (73.2%) | 11 (26.8%) |
| 65 to 74 Years | 37 (100.0%) | 0 (0.0%) |
| 75 Years and older | 43 (100.0%) | 0 (0.0%) |
| Total | 299 (82.1%) | 65 (17.9%) |
Health Insurance Coverage by Citizenship Status in Greenville
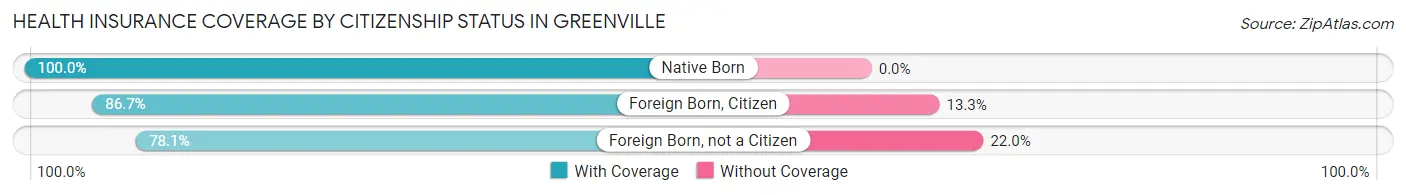
| Citizenship Status | With Coverage | Without Coverage |
| Native Born | 27 (100.0%) | 0 (0.0%) |
| Foreign Born, Citizen | 65 (86.7%) | 10 (13.3%) |
| Foreign Born, not a Citizen | 32 (78.0%) | 9 (22.0%) |
Health Insurance Coverage by Household Income in Greenville
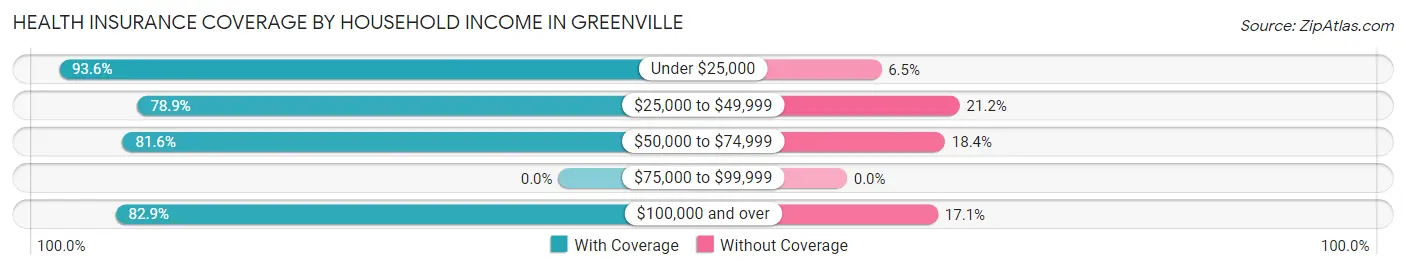
| Household Income | With Coverage | Without Coverage |
| Under $25,000 | 29 (93.5%) | 2 (6.5%) |
| $25,000 to $49,999 | 82 (78.8%) | 22 (21.1%) |
| $50,000 to $74,999 | 120 (81.6%) | 27 (18.4%) |
| $75,000 to $99,999 | 0 (0.0%) | 0 (0.0%) |
| $100,000 and over | 68 (82.9%) | 14 (17.1%) |
Public vs Private Health Insurance Coverage by Age in Greenville
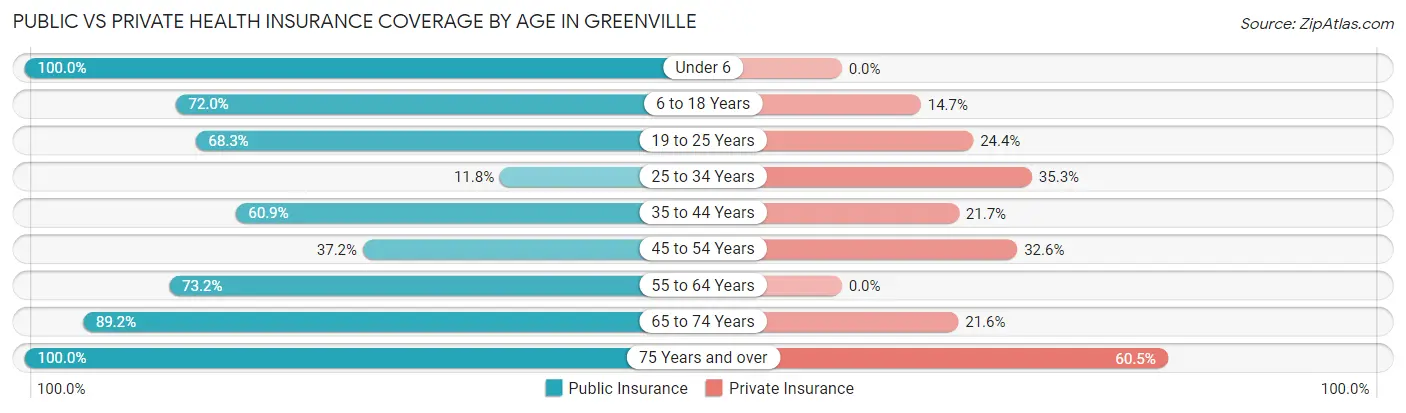
| Age Bracket | Public Insurance | Private Insurance |
| Under 6 | 27 (100.0%) | 0 (0.0%) |
| 6 to 18 Years | 54 (72.0%) | 11 (14.7%) |
| 19 to 25 Years | 28 (68.3%) | 10 (24.4%) |
| 25 to 34 Years | 4 (11.8%) | 12 (35.3%) |
| 35 to 44 Years | 14 (60.9%) | 5 (21.7%) |
| 45 to 54 Years | 16 (37.2%) | 14 (32.6%) |
| 55 to 64 Years | 30 (73.2%) | 0 (0.0%) |
| 65 to 74 Years | 33 (89.2%) | 8 (21.6%) |
| 75 Years and over | 43 (100.0%) | 26 (60.5%) |
| Total | 249 (68.4%) | 86 (23.6%) |
Disability Status by Sex by Age in Greenville
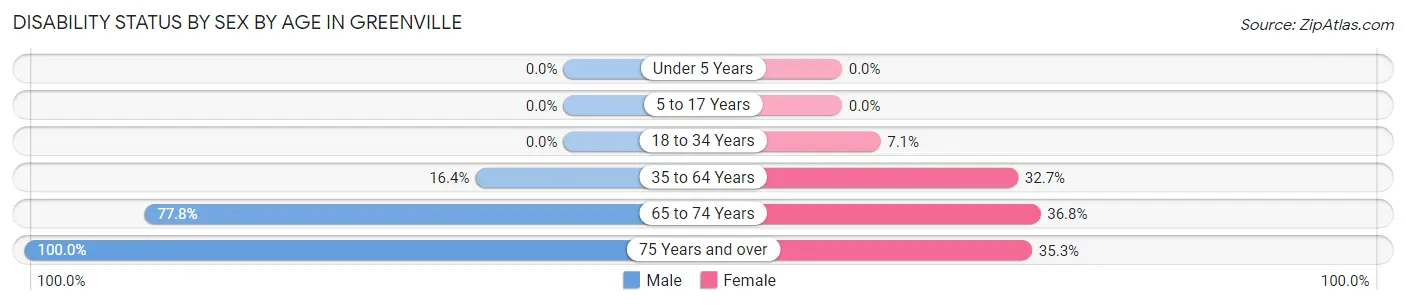
| Age Bracket | Male | Female |
| Under 5 Years | 0 (0.0%) | 0 (0.0%) |
| 5 to 17 Years | 0 (0.0%) | 0 (0.0%) |
| 18 to 34 Years | 0 (0.0%) | 4 (7.1%) |
| 35 to 64 Years | 9 (16.4%) | 17 (32.7%) |
| 65 to 74 Years | 14 (77.8%) | 7 (36.8%) |
| 75 Years and over | 9 (100.0%) | 12 (35.3%) |
Disability Class by Sex by Age in Greenville
Disability Class: Hearing Difficulty
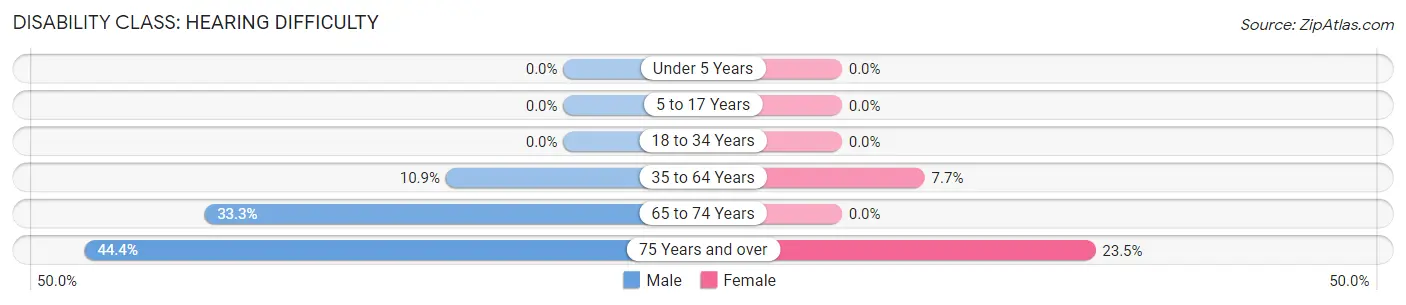
| Age Bracket | Male | Female |
| Under 5 Years | 0 (0.0%) | 0 (0.0%) |
| 5 to 17 Years | 0 (0.0%) | 0 (0.0%) |
| 18 to 34 Years | 0 (0.0%) | 0 (0.0%) |
| 35 to 64 Years | 6 (10.9%) | 4 (7.7%) |
| 65 to 74 Years | 6 (33.3%) | 0 (0.0%) |
| 75 Years and over | 4 (44.4%) | 8 (23.5%) |
Disability Class: Vision Difficulty
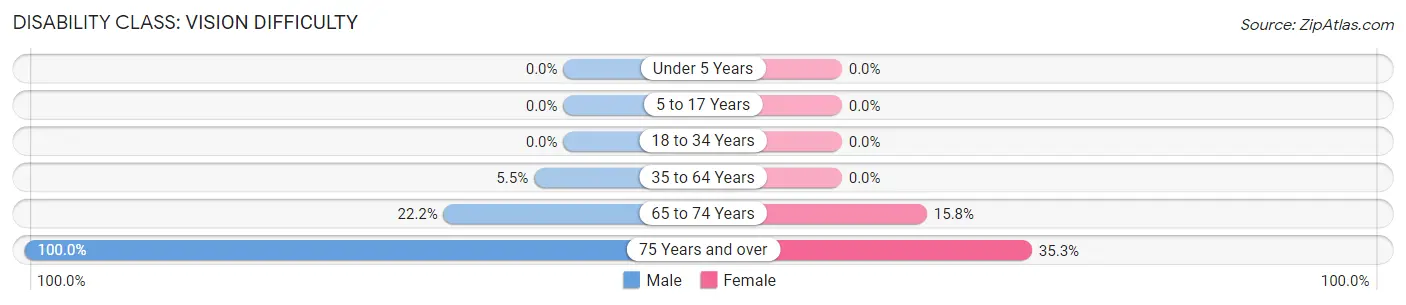
| Age Bracket | Male | Female |
| Under 5 Years | 0 (0.0%) | 0 (0.0%) |
| 5 to 17 Years | 0 (0.0%) | 0 (0.0%) |
| 18 to 34 Years | 0 (0.0%) | 0 (0.0%) |
| 35 to 64 Years | 3 (5.4%) | 0 (0.0%) |
| 65 to 74 Years | 4 (22.2%) | 3 (15.8%) |
| 75 Years and over | 9 (100.0%) | 12 (35.3%) |
Disability Class: Cognitive Difficulty
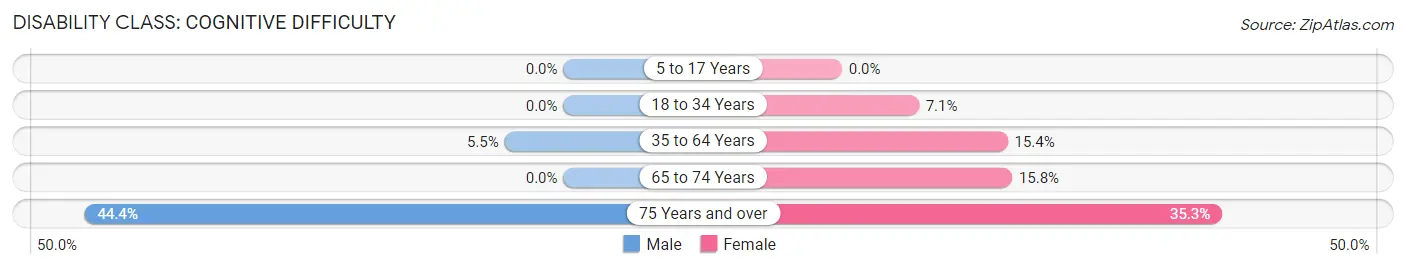
| Age Bracket | Male | Female |
| 5 to 17 Years | 0 (0.0%) | 0 (0.0%) |
| 18 to 34 Years | 0 (0.0%) | 4 (7.1%) |
| 35 to 64 Years | 3 (5.4%) | 8 (15.4%) |
| 65 to 74 Years | 0 (0.0%) | 3 (15.8%) |
| 75 Years and over | 4 (44.4%) | 12 (35.3%) |
Disability Class: Ambulatory Difficulty
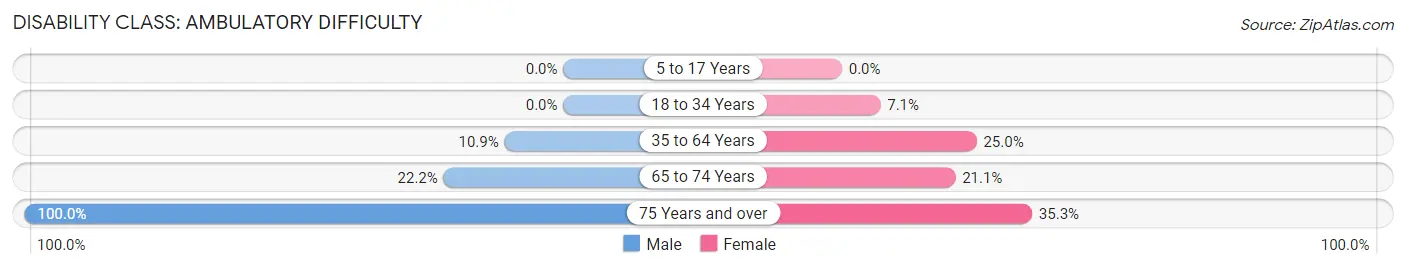
| Age Bracket | Male | Female |
| 5 to 17 Years | 0 (0.0%) | 0 (0.0%) |
| 18 to 34 Years | 0 (0.0%) | 4 (7.1%) |
| 35 to 64 Years | 6 (10.9%) | 13 (25.0%) |
| 65 to 74 Years | 4 (22.2%) | 4 (21.0%) |
| 75 Years and over | 9 (100.0%) | 12 (35.3%) |
Disability Class: Self-Care Difficulty
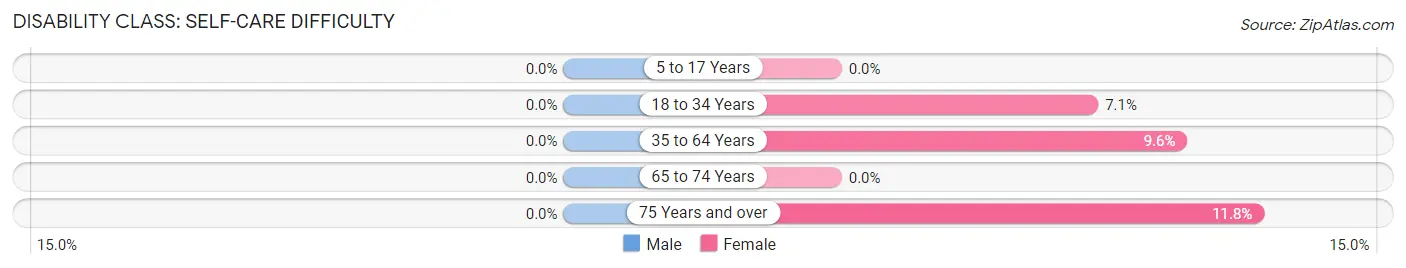
| Age Bracket | Male | Female |
| 5 to 17 Years | 0 (0.0%) | 0 (0.0%) |
| 18 to 34 Years | 0 (0.0%) | 4 (7.1%) |
| 35 to 64 Years | 0 (0.0%) | 5 (9.6%) |
| 65 to 74 Years | 0 (0.0%) | 0 (0.0%) |
| 75 Years and over | 0 (0.0%) | 4 (11.8%) |
Technology Access in Greenville
Computing Device Access in Greenville
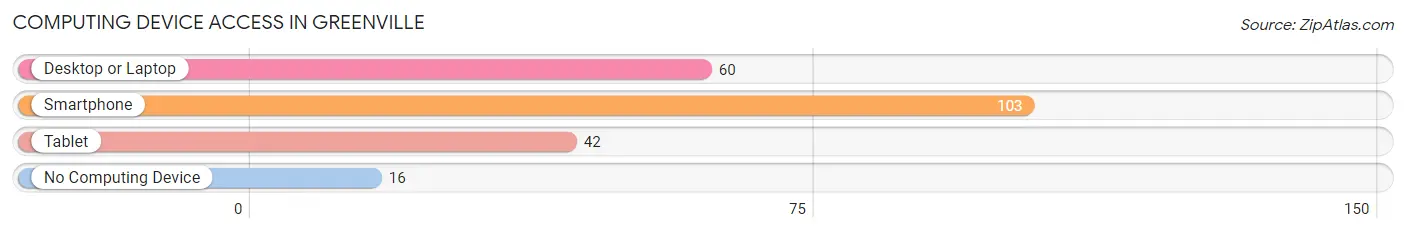
| Device Type | # Households | % Households |
| Desktop or Laptop | 60 | 47.2% |
| Smartphone | 103 | 81.1% |
| Tablet | 42 | 33.1% |
| No Computing Device | 16 | 12.6% |
| Total | 127 | 100.0% |
Internet Access in Greenville
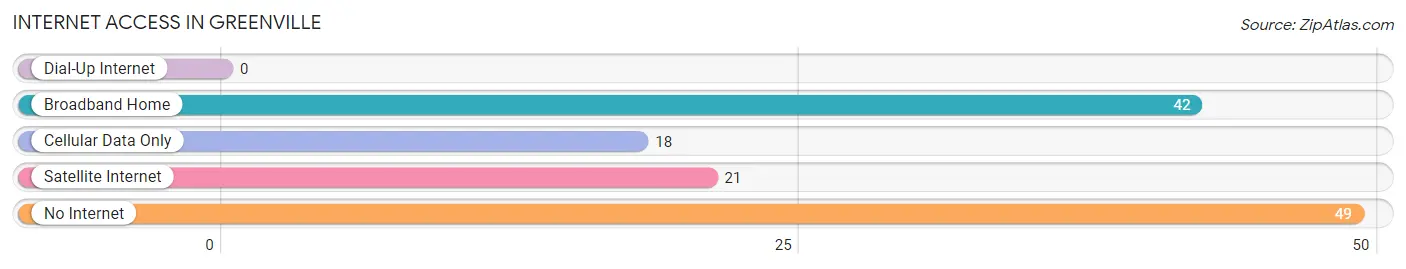
| Internet Type | # Households | % Households |
| Dial-Up Internet | 0 | 0.0% |
| Broadband Home | 42 | 33.1% |
| Cellular Data Only | 18 | 14.2% |
| Satellite Internet | 21 | 16.5% |
| No Internet | 49 | 38.6% |
| Total | 127 | 100.0% |
Greenville Summary
Geography
Greenville, Missouri is located in the southeastern corner of Wayne County, Missouri. It is situated on the banks of the St. Francis River, which is a tributary of the Mississippi River. The city is located approximately 80 miles south of St. Louis and is part of the St. Louis Metropolitan Statistical Area. The city has a total area of 1.2 square miles, all of which is land.
History
Greenville was founded in 1819 by William and Mary Green, who were among the first settlers in the area. The city was originally known as Green’s Settlement, but was later changed to Greenville. The city was incorporated in 1872 and has since grown to become the largest city in Wayne County.
Greenville has a rich history of industry and agriculture. The city was once home to a large lumber mill, which was the largest employer in the area for many years. The mill closed in the late 1970s, but the city has since seen a resurgence in industry, with several manufacturing and agricultural businesses now operating in the area.
Economy
Greenville’s economy is largely based on agriculture and manufacturing. The city is home to several large agricultural businesses, including a large poultry processing plant and a large dairy farm. The city also has several manufacturing businesses, including a furniture factory and a plastics factory.
The city also has a thriving retail sector, with several large stores and restaurants located in the downtown area. The city also has a large tourism industry, with several popular attractions located in the area, including the St. Francis River, the Wayne County Historical Museum, and the Greenville Country Club.
Demographics
As of the 2010 census, Greenville had a population of 2,845. The population is largely white (94.2%), with a small percentage of African Americans (2.3%) and Hispanics (2.1%). The median household income in the city is $37,917, and the median age is 41.7 years.
Conclusion
Greenville, Missouri is a small city located in the southeastern corner of Wayne County. The city has a rich history of industry and agriculture, and is now home to several large agricultural and manufacturing businesses. The city also has a thriving retail sector and a large tourism industry. The population of Greenville is largely white, with a small percentage of African Americans and Hispanics. The median household income in the city is $37,917, and the median age is 41.7 years.
Common Questions
What is Per Capita Income in Greenville?
Per Capita income in Greenville is $18,110.
What is the Median Family Income in Greenville?
Median Family Income in Greenville is $52,833.
What is the Median Household income in Greenville?
Median Household Income in Greenville is $39,276.
What is Income or Wage Gap in Greenville?
Income or Wage Gap in Greenville is 68.6%.
Women in Greenville earn 31.4 cents for every dollar earned by a man.
What is Inequality or Gini Index in Greenville?
Inequality or Gini Index in Greenville is 0.36.
What is the Total Population of Greenville?
Total Population of Greenville is 444.
What is the Total Male Population of Greenville?
Total Male Population of Greenville is 230.
What is the Total Female Population of Greenville?
Total Female Population of Greenville is 214.
What is the Ratio of Males per 100 Females in Greenville?
There are 107.48 Males per 100 Females in Greenville.
What is the Ratio of Females per 100 Males in Greenville?
There are 93.04 Females per 100 Males in Greenville.
What is the Median Population Age in Greenville?
Median Population Age in Greenville is 40.2 Years.
What is the Average Family Size in Greenville
Average Family Size in Greenville is 3.7 People.
What is the Average Household Size in Greenville
Average Household Size in Greenville is 2.9 People.
How Large is the Labor Force in Greenville?
There are 126 People in the Labor Forcein in Greenville.
What is the Percentage of People in the Labor Force in Greenville?
35.4% of People are in the Labor Force in Greenville.
What is the Unemployment Rate in Greenville?
Unemployment Rate in Greenville is 4.0%.