Grayridge, MO Map & Demographics
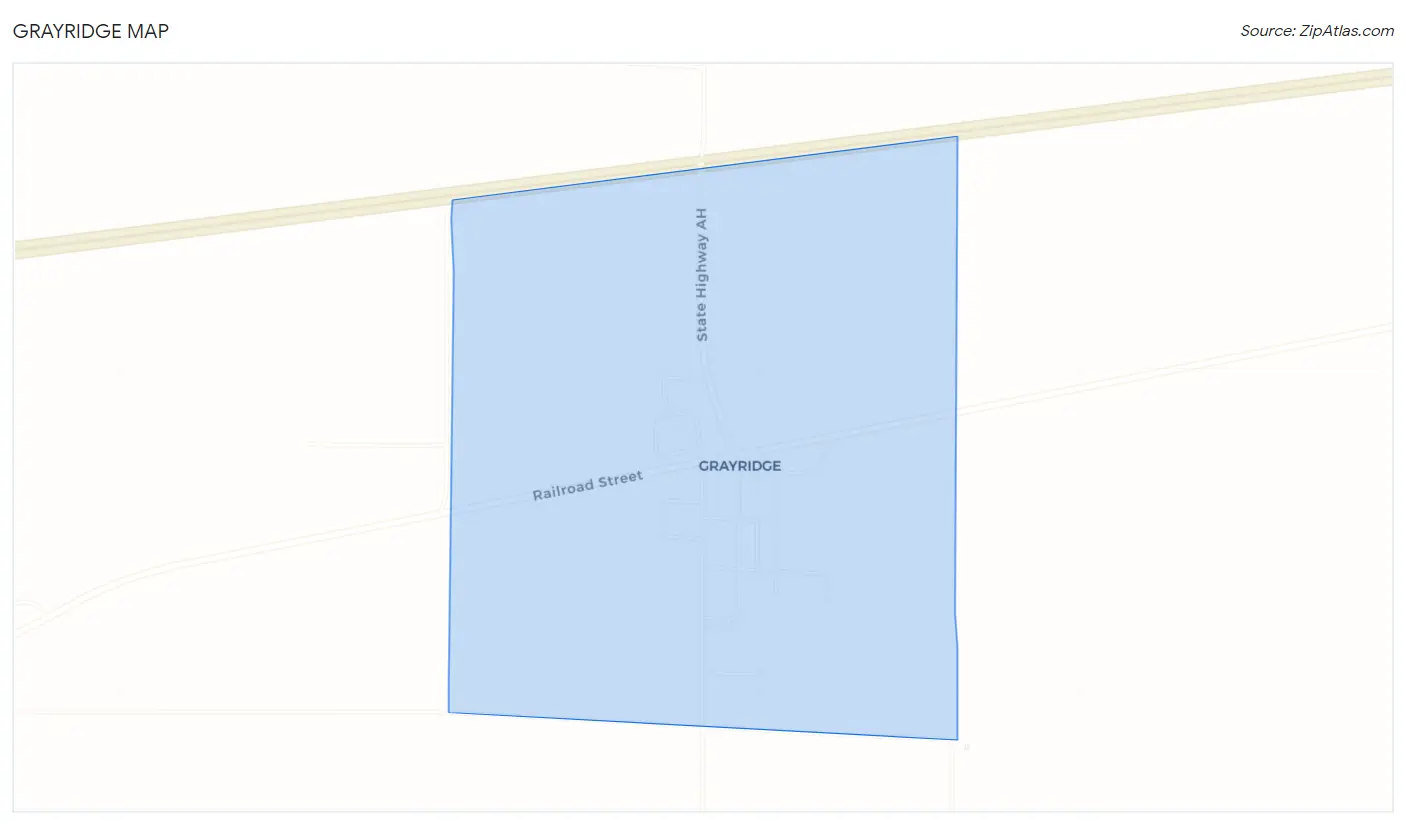
Grayridge Map
Grayridge Overview
$22,671
PER CAPITA INCOME
$54,583
AVG FAMILY INCOME
0.41
INEQUALITY / GINI INDEX
65
TOTAL POPULATION
36
MALE POPULATION
29
FEMALE POPULATION
124.14
MALES / 100 FEMALES
80.56
FEMALES / 100 MALES
49.8
MEDIAN AGE
2.9
AVG FAMILY SIZE
2.3
AVG HOUSEHOLD SIZE
30
LABOR FORCE [ PEOPLE ]
60.0%
PERCENT IN LABOR FORCE
13.3%
UNEMPLOYMENT RATE
Grayridge Area Codes
Income in Grayridge
Income Overview in Grayridge
| Characteristic | Number | Measure |
| Per Capita Income | 65 | $22,671 |
| Median Family Income | 19 | $54,583 |
| Mean Family Income | 19 | $57,432 |
| Median Household Income | 28 | $0 |
| Mean Household Income | 28 | $49,418 |
| Income Deficit | 19 | $0 |
| Wage / Income Gap (%) | 65 | 0.00% |
| Wage / Income Gap ($) | 65 | 100.00¢ per $1 |
| Gini / Inequality Index | 65 | 0.41 |
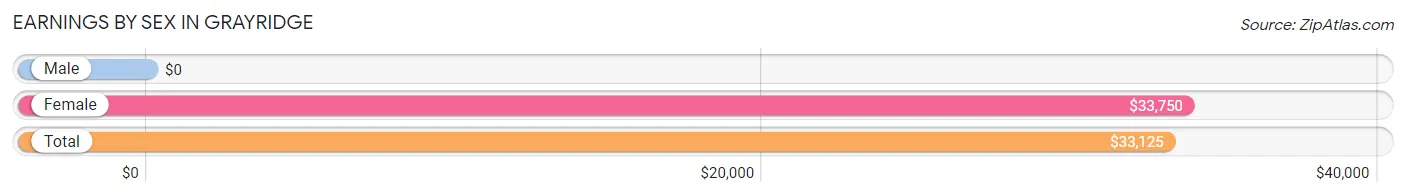
Earnings by Sex in Grayridge
| Sex | Number | Average Earnings |
| Male | 20 (66.7%) | $0 |
| Female | 10 (33.3%) | $33,750 |
| Total | 30 (100.0%) | $33,125 |
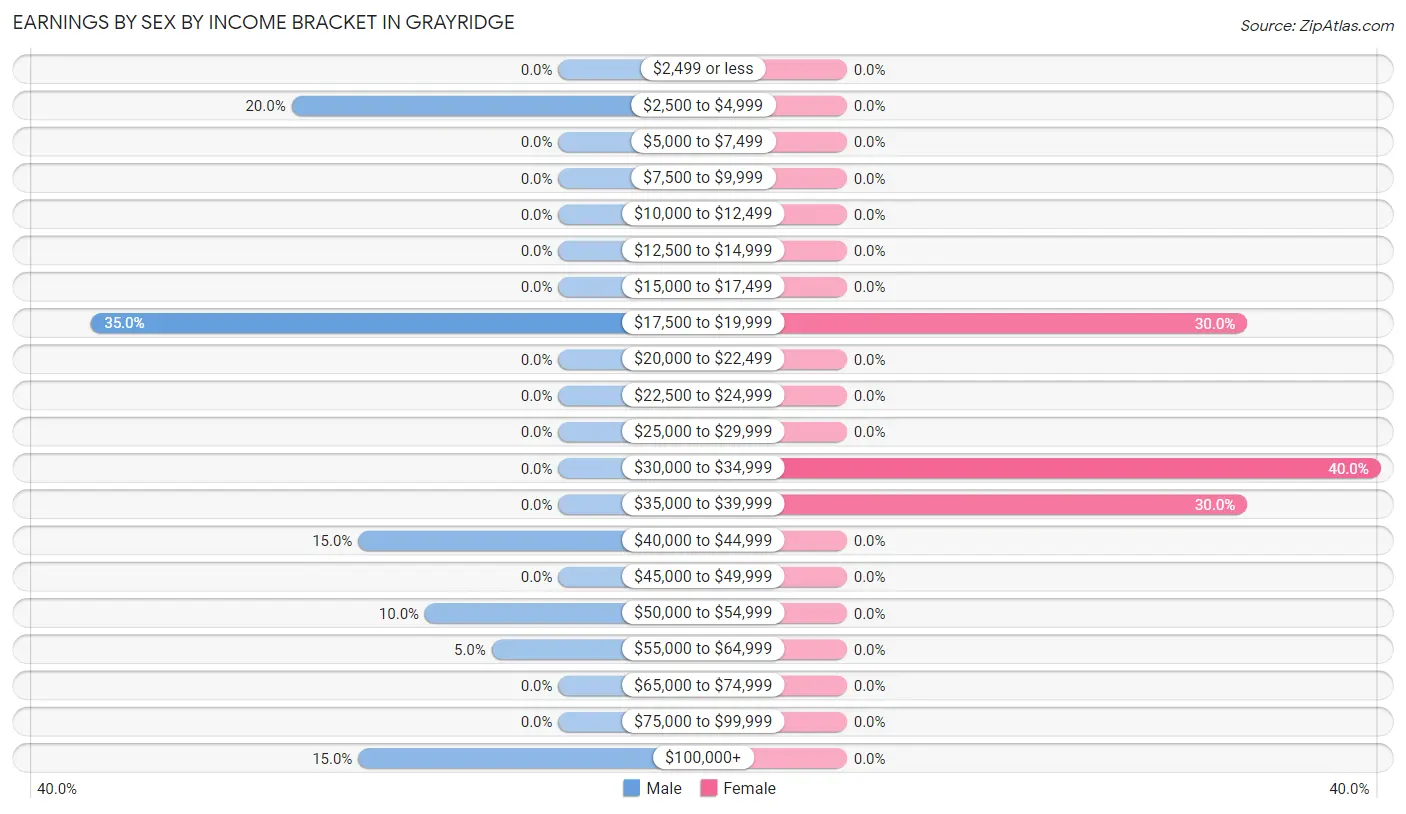
Earnings by Sex by Income Bracket in Grayridge
The most common earnings brackets in Grayridge are $17,500 to $19,999 for men (7 | 35.0%) and $30,000 to $34,999 for women (4 | 40.0%).
| Income | Male | Female |
| $2,499 or less | 0 (0.0%) | 0 (0.0%) |
| $2,500 to $4,999 | 4 (20.0%) | 0 (0.0%) |
| $5,000 to $7,499 | 0 (0.0%) | 0 (0.0%) |
| $7,500 to $9,999 | 0 (0.0%) | 0 (0.0%) |
| $10,000 to $12,499 | 0 (0.0%) | 0 (0.0%) |
| $12,500 to $14,999 | 0 (0.0%) | 0 (0.0%) |
| $15,000 to $17,499 | 0 (0.0%) | 0 (0.0%) |
| $17,500 to $19,999 | 7 (35.0%) | 3 (30.0%) |
| $20,000 to $22,499 | 0 (0.0%) | 0 (0.0%) |
| $22,500 to $24,999 | 0 (0.0%) | 0 (0.0%) |
| $25,000 to $29,999 | 0 (0.0%) | 0 (0.0%) |
| $30,000 to $34,999 | 0 (0.0%) | 4 (40.0%) |
| $35,000 to $39,999 | 0 (0.0%) | 3 (30.0%) |
| $40,000 to $44,999 | 3 (15.0%) | 0 (0.0%) |
| $45,000 to $49,999 | 0 (0.0%) | 0 (0.0%) |
| $50,000 to $54,999 | 2 (10.0%) | 0 (0.0%) |
| $55,000 to $64,999 | 1 (5.0%) | 0 (0.0%) |
| $65,000 to $74,999 | 0 (0.0%) | 0 (0.0%) |
| $75,000 to $99,999 | 0 (0.0%) | 0 (0.0%) |
| $100,000+ | 3 (15.0%) | 0 (0.0%) |
| Total | 20 (100.0%) | 10 (100.0%) |
Earnings by Sex by Educational Attainment in Grayridge
| Educational Attainment | Male Income | Female Income |
| Less than High School | - | - |
| High School Diploma | - | - |
| College or Associate's Degree | - | - |
| Bachelor's Degree | - | - |
| Graduate Degree | - | - |
| Total | - | - |
Family Income in Grayridge
Family Income Brackets in Grayridge
According to the Grayridge family income data, there are 6 families falling into the $50,000 to $74,999 income range, which is the most common income bracket and makes up 31.6% of all families.
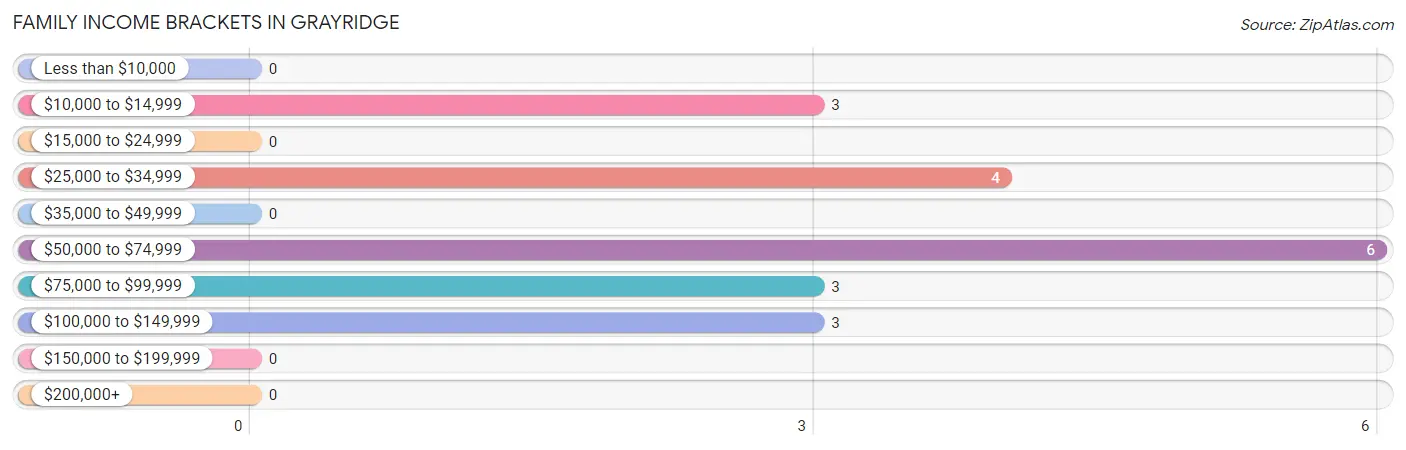
| Income Bracket | # Families | % Families |
| Less than $10,000 | 0 | 0.0% |
| $10,000 to $14,999 | 3 | 15.8% |
| $15,000 to $24,999 | 0 | 0.0% |
| $25,000 to $34,999 | 4 | 21.1% |
| $35,000 to $49,999 | 0 | 0.0% |
| $50,000 to $74,999 | 6 | 31.6% |
| $75,000 to $99,999 | 3 | 15.8% |
| $100,000 to $149,999 | 3 | 15.8% |
| $150,000 to $199,999 | 0 | 0.0% |
| $200,000+ | 0 | 0.0% |
Family Income by Famaliy Size in Grayridge
2-person families (15 | 78.9%) account for the highest median family income in Grayridge with $52,917 per family, while 2-person families (15 | 78.9%) have the highest median income of $26,458 per family member.
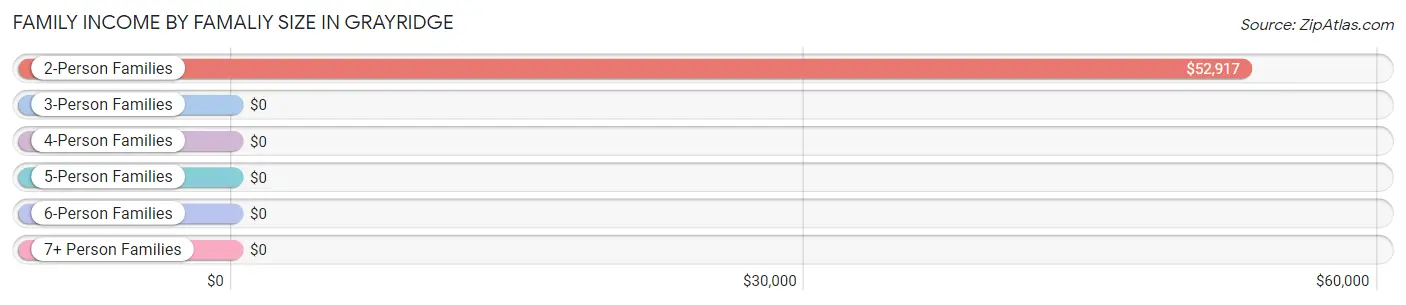
| Income Bracket | # Families | Median Income |
| 2-Person Families | 15 (78.9%) | $52,917 |
| 3-Person Families | 0 (0.0%) | $0 |
| 4-Person Families | 3 (15.8%) | $0 |
| 5-Person Families | 0 (0.0%) | $0 |
| 6-Person Families | 1 (5.3%) | $0 |
| 7+ Person Families | 0 (0.0%) | $0 |
| Total | 19 (100.0%) | $54,583 |
Family Income by Number of Earners in Grayridge
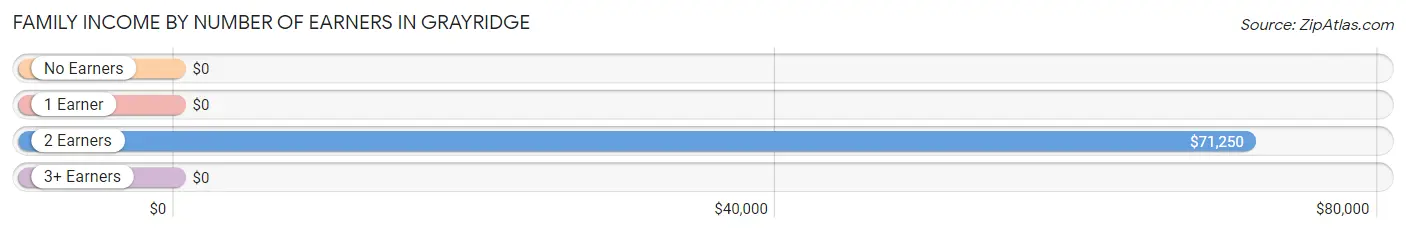
| Number of Earners | # Families | Median Income |
| No Earners | 7 (36.8%) | $0 |
| 1 Earner | 4 (21.0%) | $0 |
| 2 Earners | 8 (42.1%) | $71,250 |
| 3+ Earners | 0 (0.0%) | $0 |
| Total | 19 (100.0%) | $54,583 |
Household Income in Grayridge
Household Income Brackets in Grayridge
With 7 households falling in the category, the $25,000 to $34,999 income range is the most frequent in Grayridge, accounting for 25.0% of all households.
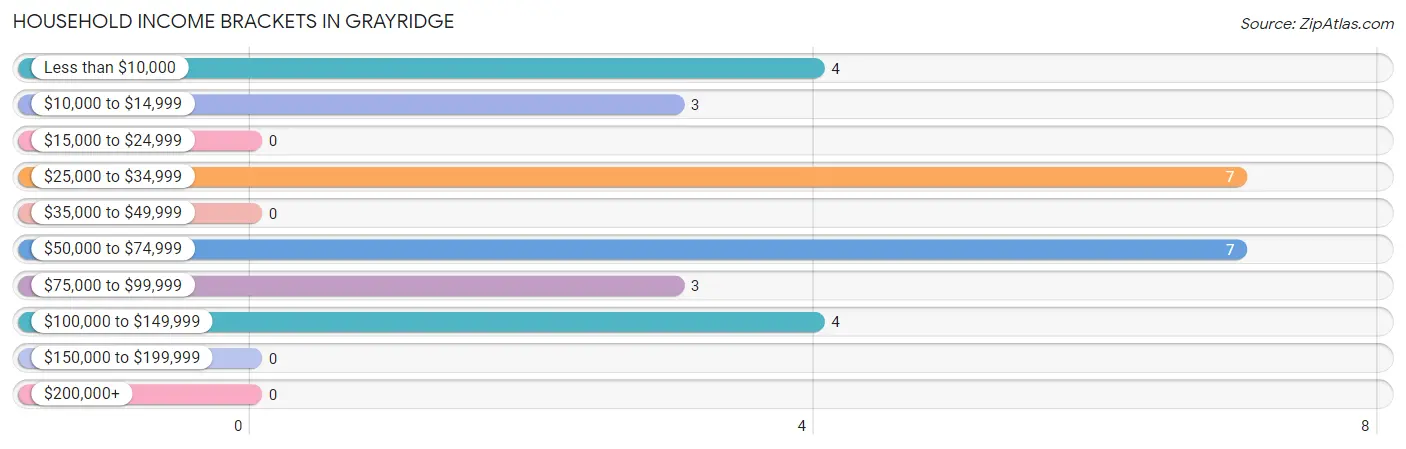
| Income Bracket | # Households | % Households |
| Less than $10,000 | 4 | 14.3% |
| $10,000 to $14,999 | 3 | 10.7% |
| $15,000 to $24,999 | 0 | 0.0% |
| $25,000 to $34,999 | 7 | 25.0% |
| $35,000 to $49,999 | 0 | 0.0% |
| $50,000 to $74,999 | 7 | 25.0% |
| $75,000 to $99,999 | 3 | 10.7% |
| $100,000 to $149,999 | 4 | 14.3% |
| $150,000 to $199,999 | 0 | 0.0% |
| $200,000+ | 0 | 0.0% |
Household Income by Householder Age in Grayridge
The median household income in Grayridge is $0, with the highest median household income of $54,167 found in the 45 to 64 years age bracket for the primary householder. A total of 18 households (64.3%) fall into this category.
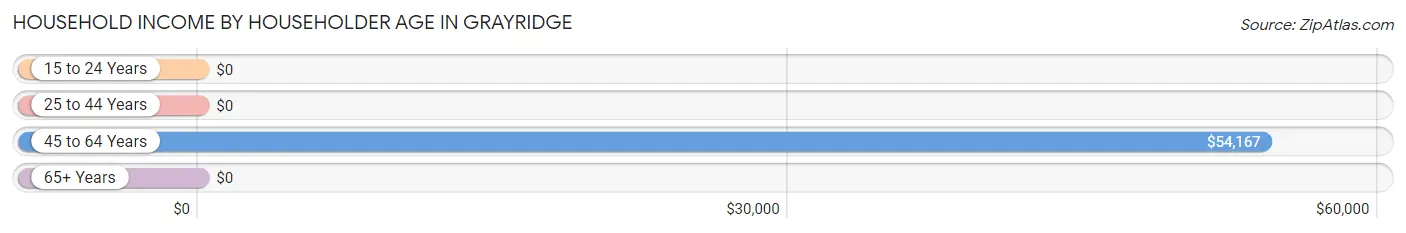
| Income Bracket | # Households | Median Income |
| 15 to 24 Years | 0 (0.0%) | $0 |
| 25 to 44 Years | 3 (10.7%) | $0 |
| 45 to 64 Years | 18 (64.3%) | $54,167 |
| 65+ Years | 7 (25.0%) | $0 |
| Total | 28 (100.0%) | $0 |
Poverty in Grayridge
Income Below Poverty by Sex and Age in Grayridge
With 19.4% poverty level for males and 10.3% for females among the residents of Grayridge, 55 to 64 year old males and 12 to 14 year old females are the most vulnerable to poverty, with 7 males (58.3%) and 3 females (75.0%) in their respective age groups living below the poverty level.
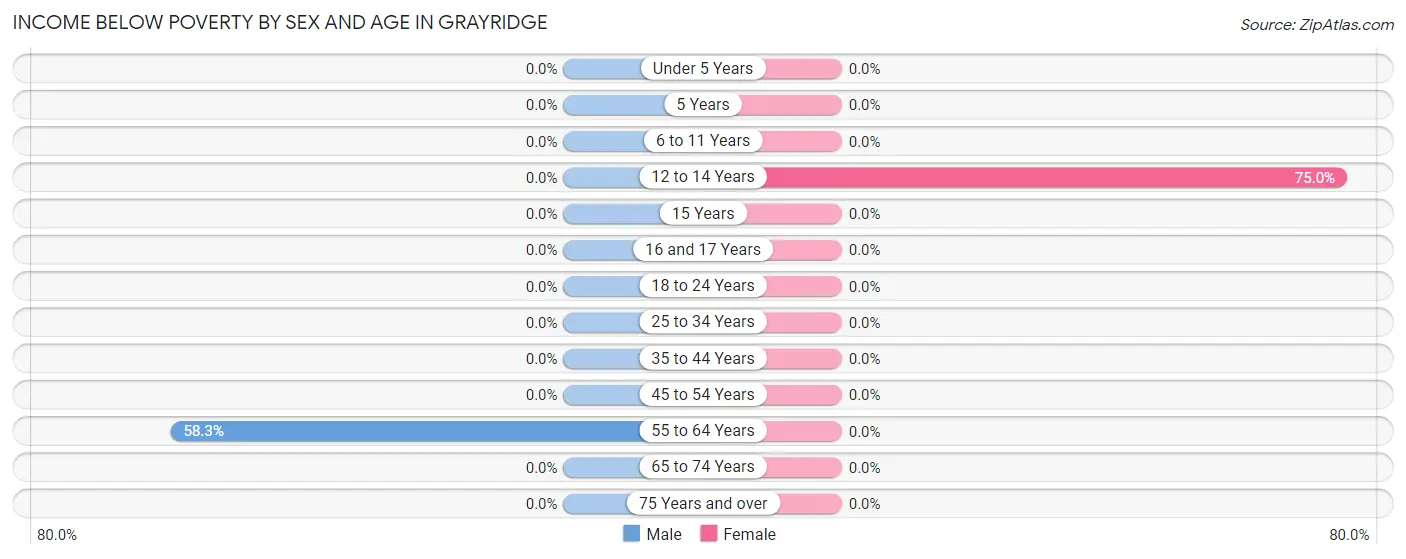
| Age Bracket | Male | Female |
| Under 5 Years | 0 (0.0%) | 0 (0.0%) |
| 5 Years | 0 (0.0%) | 0 (0.0%) |
| 6 to 11 Years | 0 (0.0%) | 0 (0.0%) |
| 12 to 14 Years | 0 (0.0%) | 3 (75.0%) |
| 15 Years | 0 (0.0%) | 0 (0.0%) |
| 16 and 17 Years | 0 (0.0%) | 0 (0.0%) |
| 18 to 24 Years | 0 (0.0%) | 0 (0.0%) |
| 25 to 34 Years | 0 (0.0%) | 0 (0.0%) |
| 35 to 44 Years | 0 (0.0%) | 0 (0.0%) |
| 45 to 54 Years | 0 (0.0%) | 0 (0.0%) |
| 55 to 64 Years | 7 (58.3%) | 0 (0.0%) |
| 65 to 74 Years | 0 (0.0%) | 0 (0.0%) |
| 75 Years and over | 0 (0.0%) | 0 (0.0%) |
| Total | 7 (19.4%) | 3 (10.3%) |
Income Above Poverty by Sex and Age in Grayridge
According to the poverty statistics in Grayridge, males aged under 5 years and females aged 6 to 11 years are the age groups that are most secure financially, with 100.0% of males and 100.0% of females in these age groups living above the poverty line.
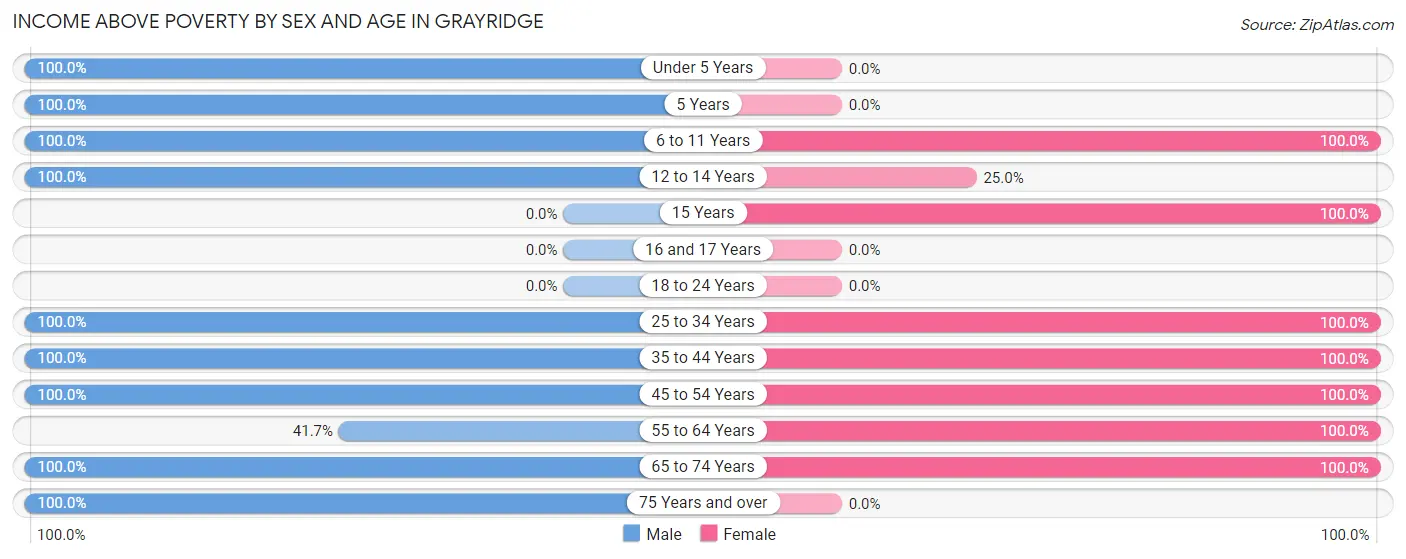
| Age Bracket | Male | Female |
| Under 5 Years | 3 (100.0%) | 0 (0.0%) |
| 5 Years | 1 (100.0%) | 0 (0.0%) |
| 6 to 11 Years | 1 (100.0%) | 3 (100.0%) |
| 12 to 14 Years | 1 (100.0%) | 1 (25.0%) |
| 15 Years | 0 (0.0%) | 2 (100.0%) |
| 16 and 17 Years | 0 (0.0%) | 0 (0.0%) |
| 18 to 24 Years | 0 (0.0%) | 0 (0.0%) |
| 25 to 34 Years | 7 (100.0%) | 4 (100.0%) |
| 35 to 44 Years | 3 (100.0%) | 1 (100.0%) |
| 45 to 54 Years | 1 (100.0%) | 3 (100.0%) |
| 55 to 64 Years | 5 (41.7%) | 8 (100.0%) |
| 65 to 74 Years | 4 (100.0%) | 4 (100.0%) |
| 75 Years and over | 3 (100.0%) | 0 (0.0%) |
| Total | 29 (80.6%) | 26 (89.7%) |
Income Below Poverty Among Married-Couple Families in Grayridge
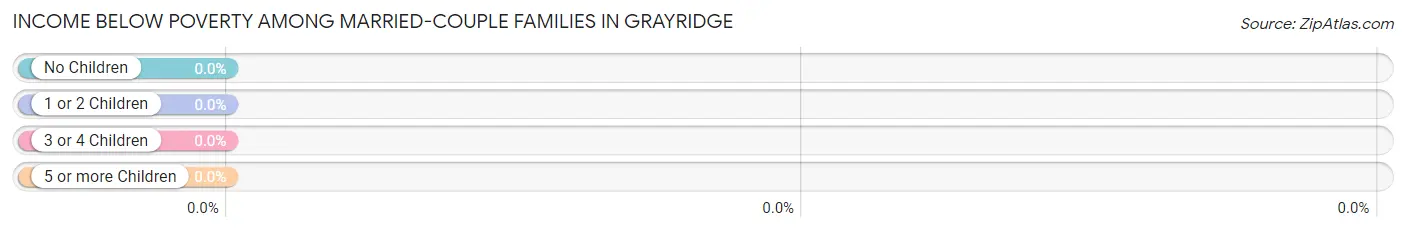
| Children | Above Poverty | Below Poverty |
| No Children | 9 (100.0%) | 0 (0.0%) |
| 1 or 2 Children | 3 (100.0%) | 0 (0.0%) |
| 3 or 4 Children | 0 (0.0%) | 0 (0.0%) |
| 5 or more Children | 0 (0.0%) | 0 (0.0%) |
| Total | 12 (100.0%) | 0 (0.0%) |
Income Below Poverty Among Single-Parent Households in Grayridge
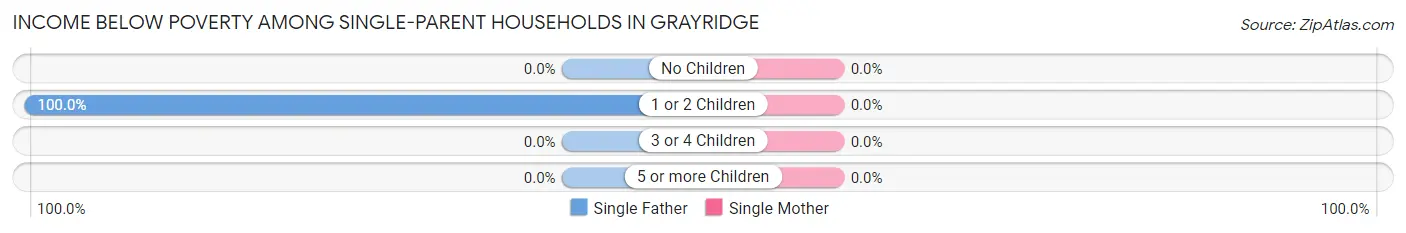
| Children | Single Father | Single Mother |
| No Children | 0 (0.0%) | 0 (0.0%) |
| 1 or 2 Children | 3 (100.0%) | 0 (0.0%) |
| 3 or 4 Children | 0 (0.0%) | 0 (0.0%) |
| 5 or more Children | 0 (0.0%) | 0 (0.0%) |
| Total | 3 (75.0%) | 0 (0.0%) |
Income Below Poverty Among Married-Couple vs Single-Parent Households in Grayridge
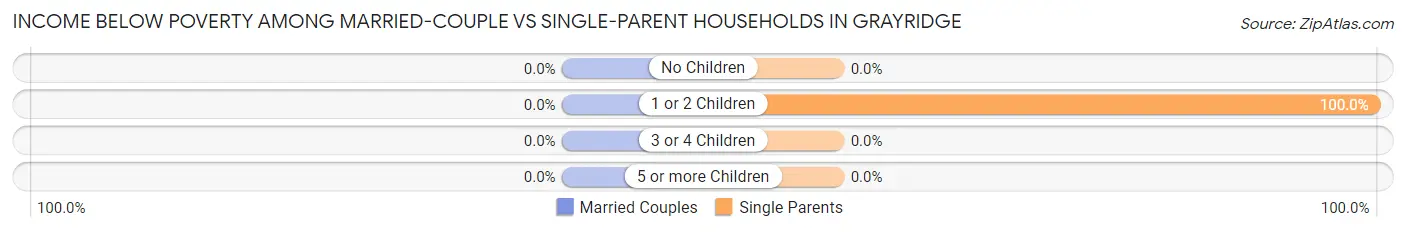
| Children | Married-Couple Families | Single-Parent Households |
| No Children | 0 (0.0%) | 0 (0.0%) |
| 1 or 2 Children | 0 (0.0%) | 3 (100.0%) |
| 3 or 4 Children | 0 (0.0%) | 0 (0.0%) |
| 5 or more Children | 0 (0.0%) | 0 (0.0%) |
| Total | 0 (0.0%) | 3 (42.9%) |
Race in Grayridge
The most populous races in Grayridge are White / Caucasian (65 | 100.0%), and Hispanic or Latino (3 | 4.6%).
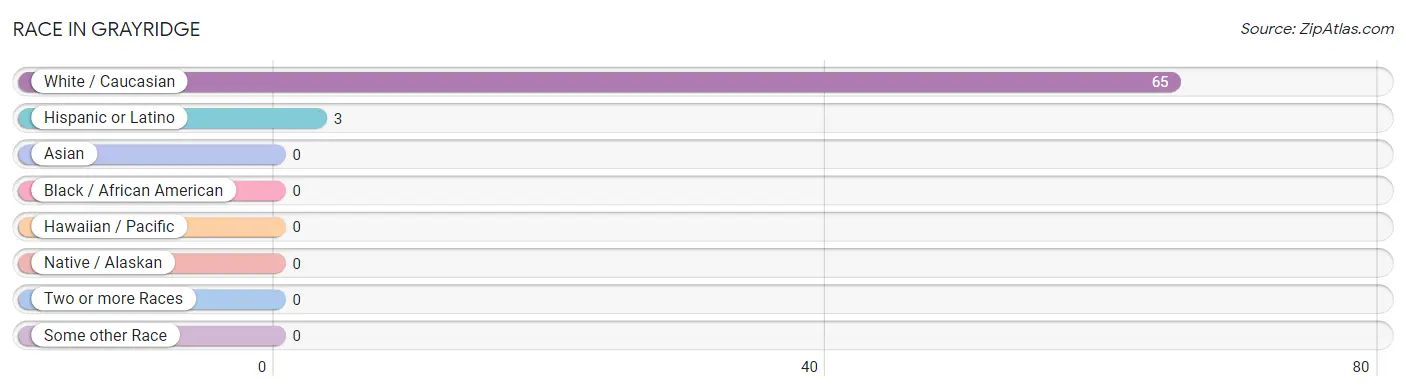
| Race | # Population | % Population |
| Asian | 0 | 0.0% |
| Black / African American | 0 | 0.0% |
| Hawaiian / Pacific | 0 | 0.0% |
| Hispanic or Latino | 3 | 4.6% |
| Native / Alaskan | 0 | 0.0% |
| White / Caucasian | 65 | 100.0% |
| Two or more Races | 0 | 0.0% |
| Some other Race | 0 | 0.0% |
| Total | 65 | 100.0% |
Ancestry in Grayridge
The most populous ancestries reported in Grayridge are English (11 | 16.9%), Irish (6 | 9.2%), German (5 | 7.7%), and Mexican (3 | 4.6%), together accounting for 38.5% of all Grayridge residents.
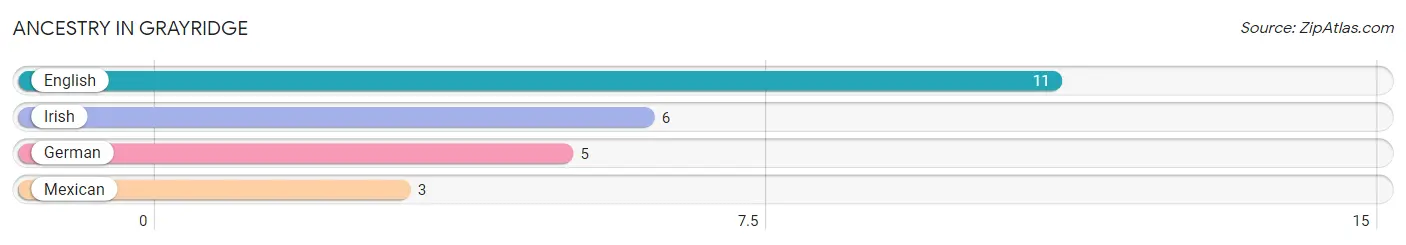
| Ancestry | # Population | % Population |
| English | 11 | 16.9% |
| German | 5 | 7.7% |
| Irish | 6 | 9.2% |
| Mexican | 3 | 4.6% | View All 4 Rows |
Immigrants in Grayridge

| Immigration Origin | # Population | % Population | View All 0 Rows |
Sex and Age in Grayridge
Sex and Age in Grayridge
The most populous age groups in Grayridge are 55 to 59 Years (9 | 25.0%) for men and 55 to 59 Years (8 | 27.6%) for women.
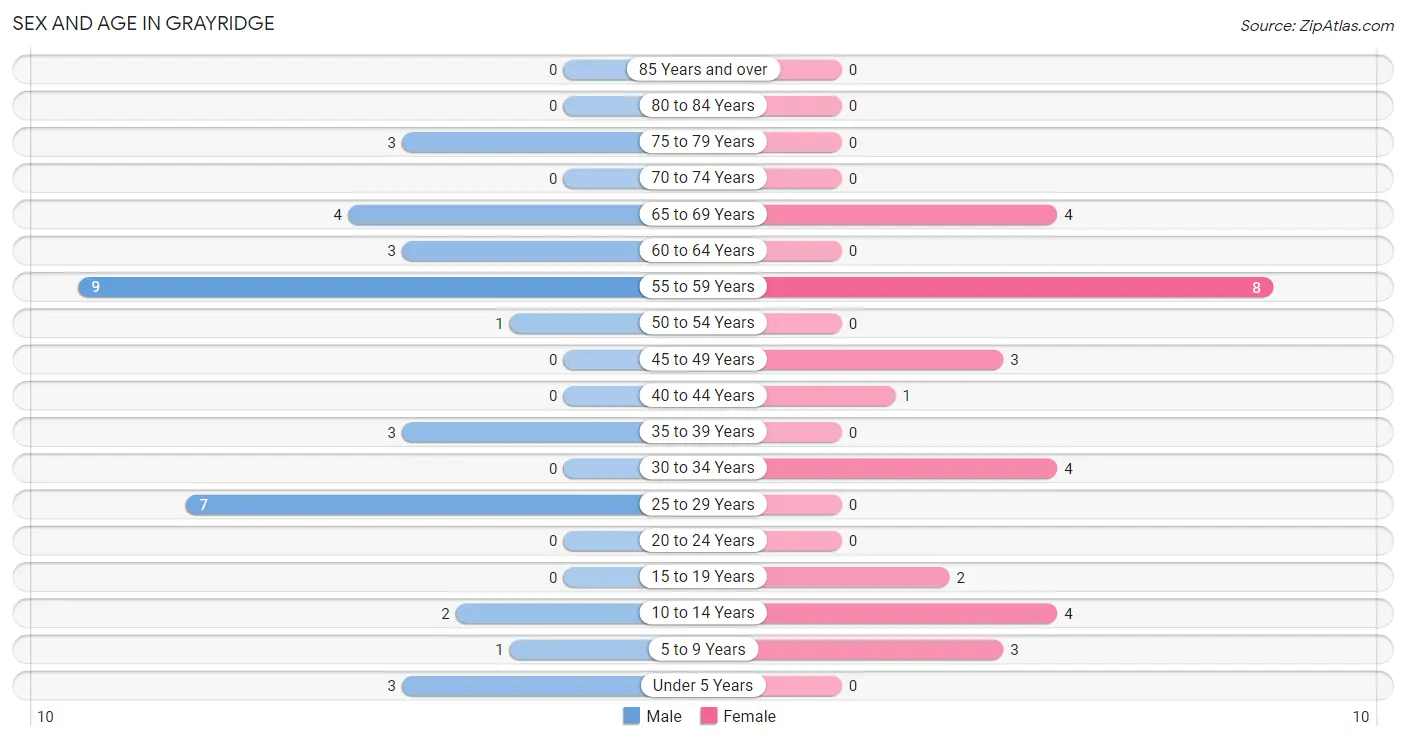
| Age Bracket | Male | Female |
| Under 5 Years | 3 (8.3%) | 0 (0.0%) |
| 5 to 9 Years | 1 (2.8%) | 3 (10.3%) |
| 10 to 14 Years | 2 (5.6%) | 4 (13.8%) |
| 15 to 19 Years | 0 (0.0%) | 2 (6.9%) |
| 20 to 24 Years | 0 (0.0%) | 0 (0.0%) |
| 25 to 29 Years | 7 (19.4%) | 0 (0.0%) |
| 30 to 34 Years | 0 (0.0%) | 4 (13.8%) |
| 35 to 39 Years | 3 (8.3%) | 0 (0.0%) |
| 40 to 44 Years | 0 (0.0%) | 1 (3.5%) |
| 45 to 49 Years | 0 (0.0%) | 3 (10.3%) |
| 50 to 54 Years | 1 (2.8%) | 0 (0.0%) |
| 55 to 59 Years | 9 (25.0%) | 8 (27.6%) |
| 60 to 64 Years | 3 (8.3%) | 0 (0.0%) |
| 65 to 69 Years | 4 (11.1%) | 4 (13.8%) |
| 70 to 74 Years | 0 (0.0%) | 0 (0.0%) |
| 75 to 79 Years | 3 (8.3%) | 0 (0.0%) |
| 80 to 84 Years | 0 (0.0%) | 0 (0.0%) |
| 85 Years and over | 0 (0.0%) | 0 (0.0%) |
| Total | 36 (100.0%) | 29 (100.0%) |
Families and Households in Grayridge
Median Family Size in Grayridge
The median family size in Grayridge is 2.89 persons per family, with single female/mother families (3 | 15.8%) accounting for the largest median family size of 3.33 persons per family. On the other hand, married-couple families (12 | 63.2%) represent the smallest median family size with 2.67 persons per family.
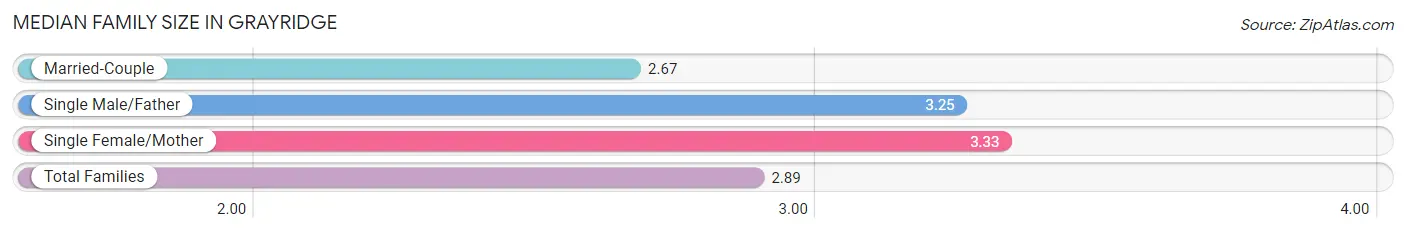
| Family Type | # Families | Family Size |
| Married-Couple | 12 (63.2%) | 2.67 |
| Single Male/Father | 4 (21.0%) | 3.25 |
| Single Female/Mother | 3 (15.8%) | 3.33 |
| Total Families | 19 (100.0%) | 2.89 |
Median Household Size in Grayridge
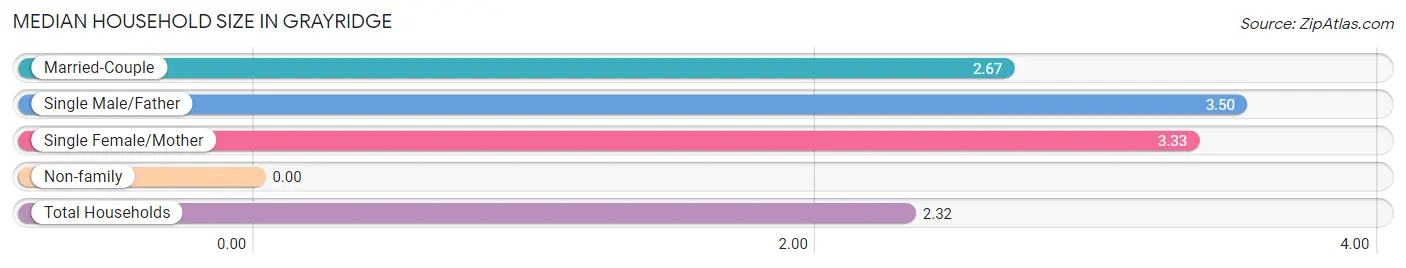
| Household Type | # Households | Household Size |
| Married-Couple | 12 (42.9%) | 2.67 |
| Single Male/Father | 4 (14.3%) | 3.50 |
| Single Female/Mother | 3 (10.7%) | 3.33 |
| Non-family | 9 (32.1%) | - |
| Total Households | 28 (100.0%) | 2.32 |
Household Size by Marriage Status in Grayridge
Out of a total of 28 households in Grayridge, 19 (67.9%) are family households, while 9 (32.1%) are nonfamily households. The most numerous type of family households are 2-person households, comprising 15, and the most common type of nonfamily households are 1-person households, comprising 9.
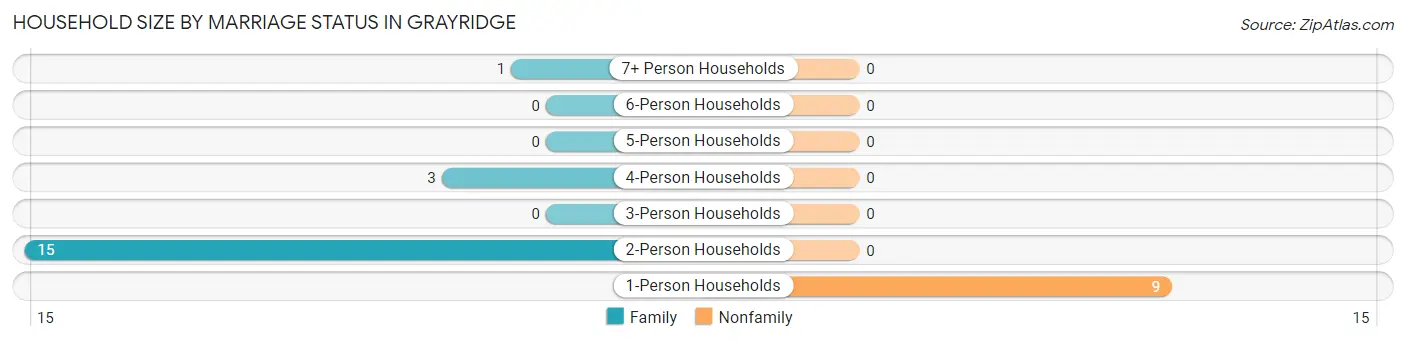
| Household Size | Family Households | Nonfamily Households |
| 1-Person Households | - | 9 (32.1%) |
| 2-Person Households | 15 (53.6%) | 0 (0.0%) |
| 3-Person Households | 0 (0.0%) | 0 (0.0%) |
| 4-Person Households | 3 (10.7%) | 0 (0.0%) |
| 5-Person Households | 0 (0.0%) | 0 (0.0%) |
| 6-Person Households | 0 (0.0%) | 0 (0.0%) |
| 7+ Person Households | 1 (3.6%) | 0 (0.0%) |
| Total | 19 (67.9%) | 9 (32.1%) |
Female Fertility in Grayridge
Fertility by Age in Grayridge
Average fertility rate in Grayridge is 400.0 births per 1,000 women. Women in the age bracket of 20 to 34 years have the highest fertility rate with 1,000.0 births per 1,000 women. Women in the age bracket of 20 to 34 years acount for 100.0% of all women with births.
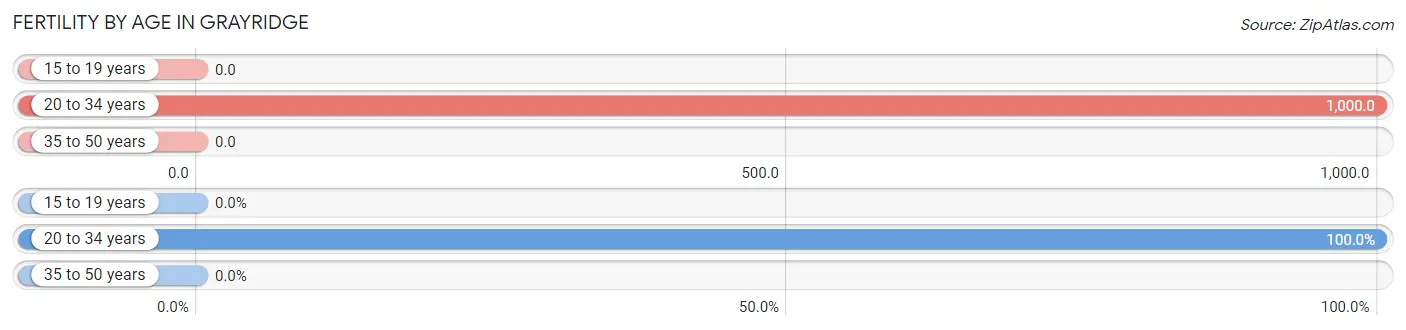
| Age Bracket | Women with Births | Births / 1,000 Women |
| 15 to 19 years | 0 (0.0%) | 0.0 |
| 20 to 34 years | 4 (100.0%) | 1,000.0 |
| 35 to 50 years | 0 (0.0%) | 0.0 |
| Total | 4 (100.0%) | 400.0 |
Fertility by Age by Marriage Status in Grayridge
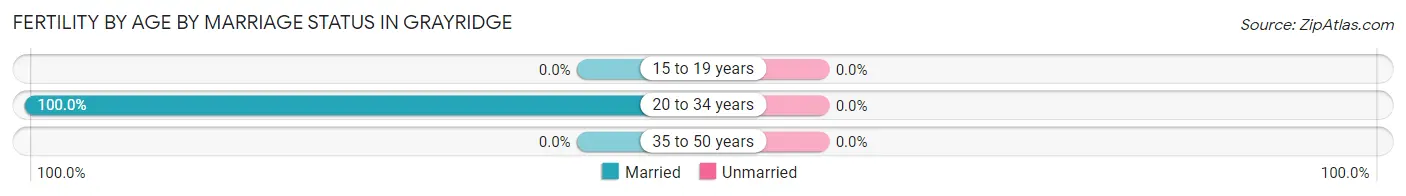
| Age Bracket | Married | Unmarried |
| 15 to 19 years | 0 (0.0%) | 0 (0.0%) |
| 20 to 34 years | 4 (100.0%) | 0 (0.0%) |
| 35 to 50 years | 0 (0.0%) | 0 (0.0%) |
| Total | 4 (100.0%) | 0 (0.0%) |
Fertility by Education in Grayridge
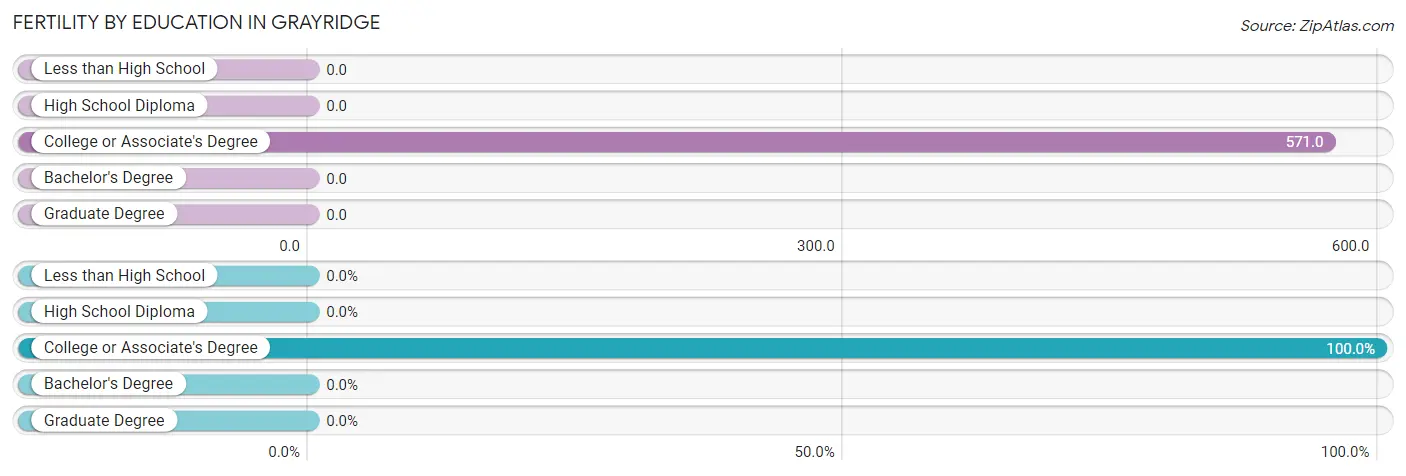
| Educational Attainment | Women with Births | Births / 1,000 Women |
| Less than High School | 0 (0.0%) | 0.0 |
| High School Diploma | 0 (0.0%) | 0.0 |
| College or Associate's Degree | 4 (100.0%) | 571.0 |
| Bachelor's Degree | 0 (0.0%) | 0.0 |
| Graduate Degree | 0 (0.0%) | 0.0 |
| Total | 4 (100.0%) | 400.0 |
Fertility by Education by Marriage Status in Grayridge
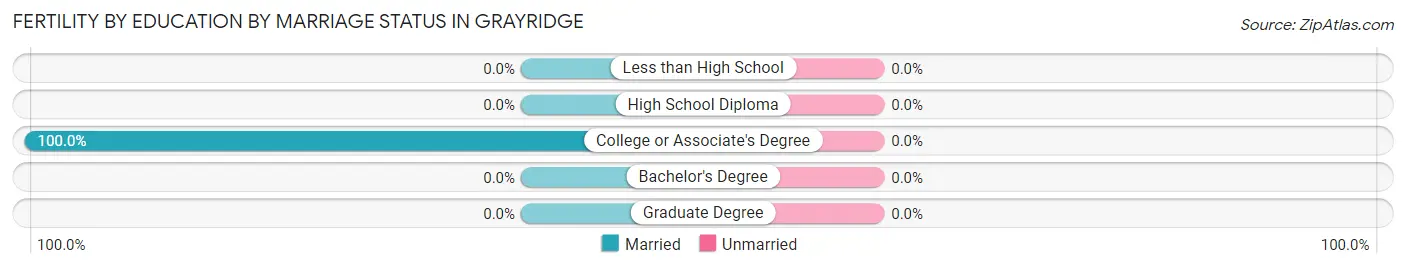
| Educational Attainment | Married | Unmarried |
| Less than High School | 0 (0.0%) | 0 (0.0%) |
| High School Diploma | 0 (0.0%) | 0 (0.0%) |
| College or Associate's Degree | 4 (100.0%) | 0 (0.0%) |
| Bachelor's Degree | 0 (0.0%) | 0 (0.0%) |
| Graduate Degree | 0 (0.0%) | 0 (0.0%) |
| Total | 4 (100.0%) | 0 (0.0%) |
Employment Characteristics in Grayridge
Employment by Class of Employer in Grayridge
Among the 26 employed individuals in Grayridge, private company employees (15 | 57.7%), self-employed (not incorporated) (5 | 19.2%), and self-employed (incorporated) (3 | 11.5%) make up the most common classes of employment.
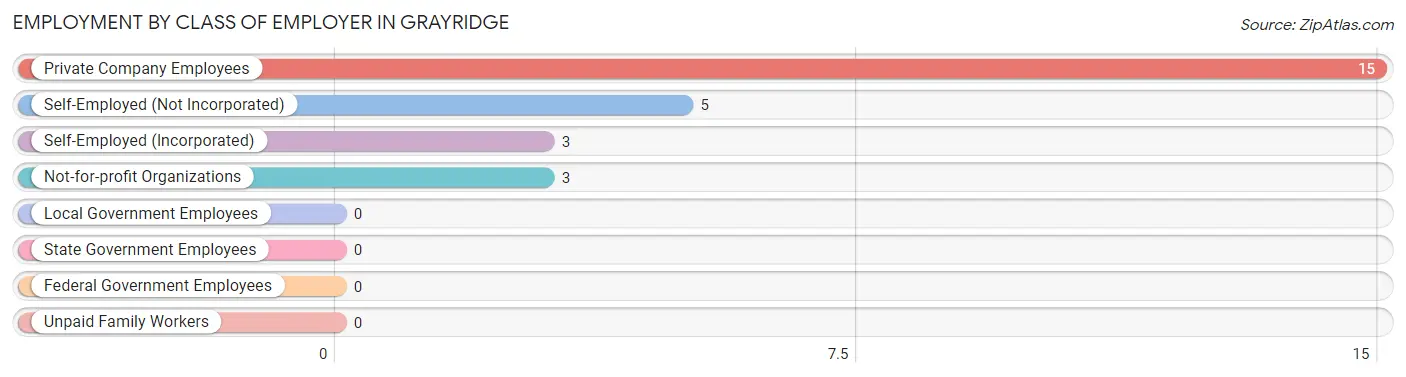
| Employer Class | # Employees | % Employees |
| Private Company Employees | 15 | 57.7% |
| Self-Employed (Incorporated) | 3 | 11.5% |
| Self-Employed (Not Incorporated) | 5 | 19.2% |
| Not-for-profit Organizations | 3 | 11.5% |
| Local Government Employees | 0 | 0.0% |
| State Government Employees | 0 | 0.0% |
| Federal Government Employees | 0 | 0.0% |
| Unpaid Family Workers | 0 | 0.0% |
| Total | 26 | 100.0% |
Employment Status by Age in Grayridge
According to the labor force statistics for Grayridge, out of the total population over 16 years of age (50), 60.0% or 30 individuals are in the labor force, with 13.3% or 4 of them unemployed. The age group with the highest labor force participation rate is 25 to 29 years, with 100.0% or 7 individuals in the labor force. Within the labor force, the 55 to 59 years age range has the highest percentage of unemployed individuals, with 26.7% or 4 of them being unemployed.
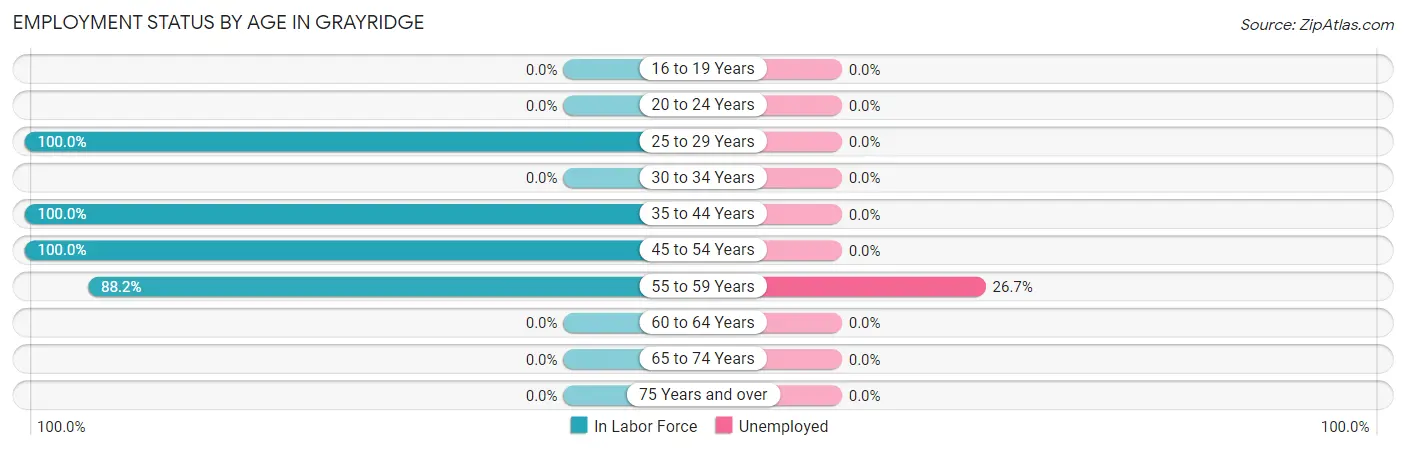
| Age Bracket | In Labor Force | Unemployed |
| 16 to 19 Years | 0 (0.0%) | 0 (0.0%) |
| 20 to 24 Years | 0 (0.0%) | 0 (0.0%) |
| 25 to 29 Years | 7 (100.0%) | 0 (0.0%) |
| 30 to 34 Years | 0 (0.0%) | 0 (0.0%) |
| 35 to 44 Years | 4 (100.0%) | 0 (0.0%) |
| 45 to 54 Years | 4 (100.0%) | 0 (0.0%) |
| 55 to 59 Years | 15 (88.2%) | 4 (26.7%) |
| 60 to 64 Years | 0 (0.0%) | 0 (0.0%) |
| 65 to 74 Years | 0 (0.0%) | 0 (0.0%) |
| 75 Years and over | 0 (0.0%) | 0 (0.0%) |
| Total | 30 (60.0%) | 4 (13.3%) |
Employment Status by Educational Attainment in Grayridge
According to labor force statistics for Grayridge, 76.9% of individuals (30) out of the total population between 25 and 64 years of age (39) are in the labor force, with 13.3% or 4 of them being unemployed. The group with the highest labor force participation rate are those with the educational attainment of less than high school, with 100.0% or 1 individuals in the labor force. Within the labor force, individuals with high school diploma education have the highest percentage of unemployment, with 26.7% or 4 of them being unemployed.
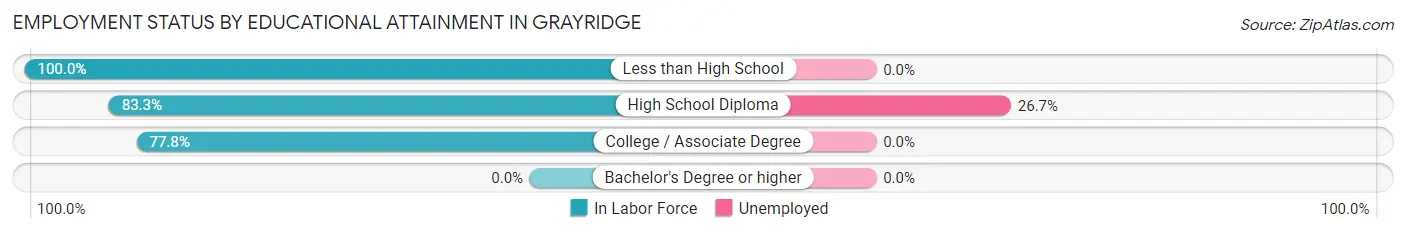
| Educational Attainment | In Labor Force | Unemployed |
| Less than High School | 1 (100.0%) | 0 (0.0%) |
| High School Diploma | 15 (83.3%) | 5 (26.7%) |
| College / Associate Degree | 14 (77.8%) | 0 (0.0%) |
| Bachelor's Degree or higher | 0 (0.0%) | 0 (0.0%) |
| Total | 30 (76.9%) | 5 (13.3%) |
Employment Occupations by Sex in Grayridge
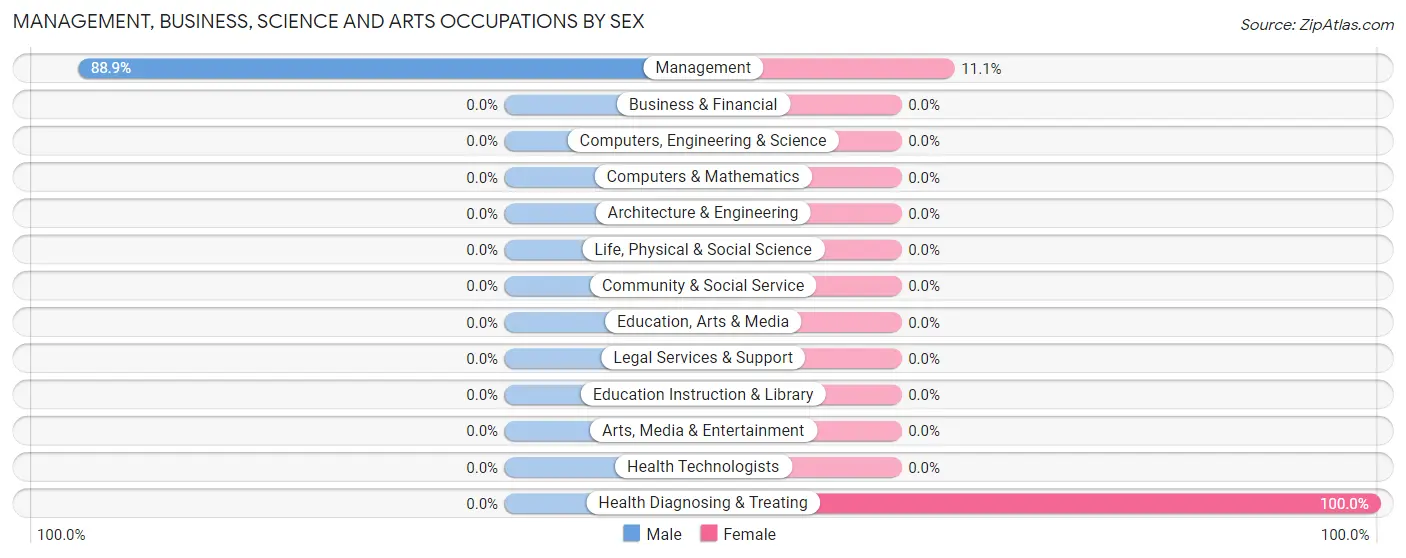
Management, Business, Science and Arts Occupations
The most common Management, Business, Science and Arts occupations in Grayridge are Management (9 | 34.6%), and Health Diagnosing & Treating (3 | 11.5%).
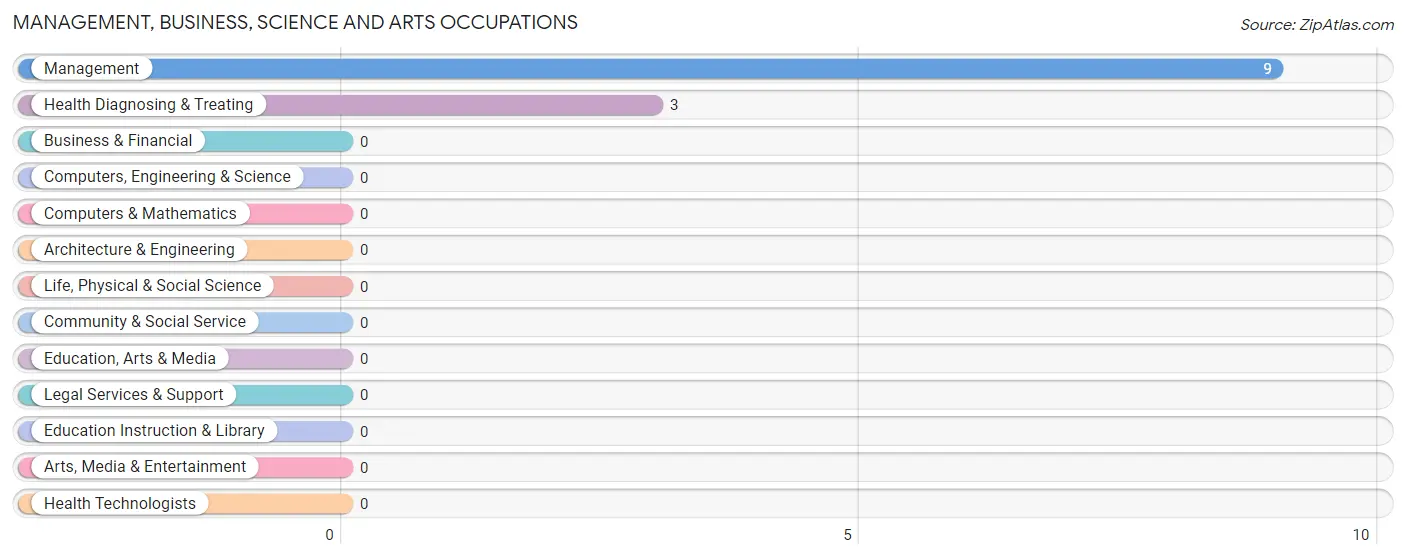
Management, Business, Science and Arts Occupations by Sex
| Occupation | Male | Female |
| Management | 8 (88.9%) | 1 (11.1%) |
| Business & Financial | 0 (0.0%) | 0 (0.0%) |
| Computers, Engineering & Science | 0 (0.0%) | 0 (0.0%) |
| Computers & Mathematics | 0 (0.0%) | 0 (0.0%) |
| Architecture & Engineering | 0 (0.0%) | 0 (0.0%) |
| Life, Physical & Social Science | 0 (0.0%) | 0 (0.0%) |
| Community & Social Service | 0 (0.0%) | 0 (0.0%) |
| Education, Arts & Media | 0 (0.0%) | 0 (0.0%) |
| Legal Services & Support | 0 (0.0%) | 0 (0.0%) |
| Education Instruction & Library | 0 (0.0%) | 0 (0.0%) |
| Arts, Media & Entertainment | 0 (0.0%) | 0 (0.0%) |
| Health Diagnosing & Treating | 0 (0.0%) | 3 (100.0%) |
| Health Technologists | 0 (0.0%) | 0 (0.0%) |
| Total (Category) | 8 (66.7%) | 4 (33.3%) |
| Total (Overall) | 16 (61.5%) | 10 (38.5%) |
Services Occupations
Services Occupations by Sex
| Occupation | Male | Female |
| Healthcare Support | 0 (0.0%) | 0 (0.0%) |
| Security & Protection | 0 (0.0%) | 0 (0.0%) |
| Firefighting & Prevention | 0 (0.0%) | 0 (0.0%) |
| Law Enforcement | 0 (0.0%) | 0 (0.0%) |
| Food Preparation & Serving | 0 (0.0%) | 0 (0.0%) |
| Cleaning & Maintenance | 0 (0.0%) | 0 (0.0%) |
| Personal Care & Service | 0 (0.0%) | 0 (0.0%) |
| Total (Category) | 0 (0.0%) | 0 (0.0%) |
| Total (Overall) | 16 (61.5%) | 10 (38.5%) |
Sales and Office Occupations
The most common Sales and Office occupations in Grayridge are , and Office & Administration (3 | 11.5%).
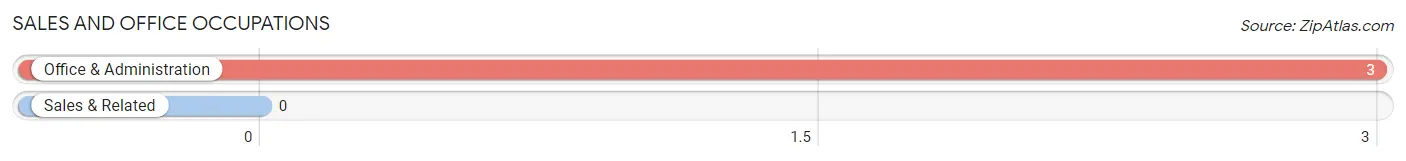
Sales and Office Occupations by Sex
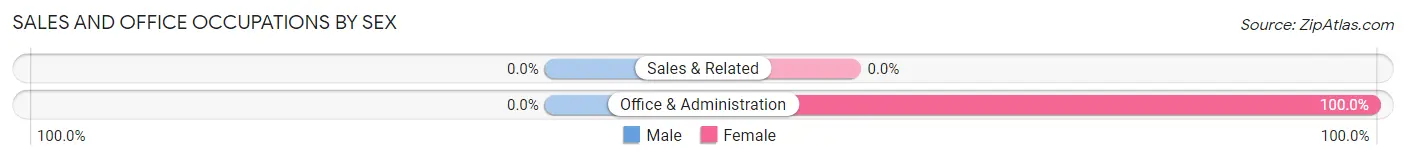
| Occupation | Male | Female |
| Sales & Related | 0 (0.0%) | 0 (0.0%) |
| Office & Administration | 0 (0.0%) | 3 (100.0%) |
| Total (Category) | 0 (0.0%) | 3 (100.0%) |
| Total (Overall) | 16 (61.5%) | 10 (38.5%) |
Natural Resources, Construction and Maintenance Occupations
The most common Natural Resources, Construction and Maintenance occupations in Grayridge are , and Construction & Extraction (7 | 26.9%).
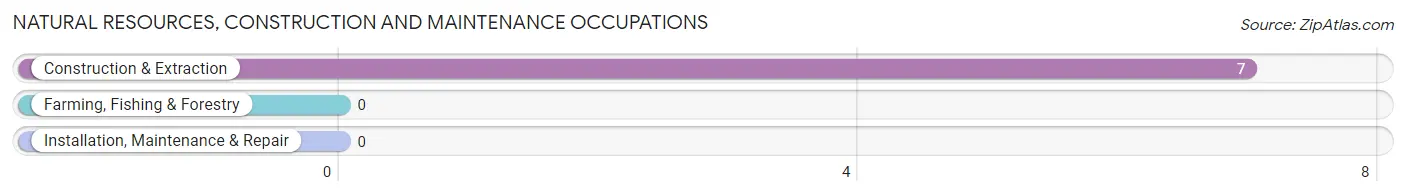
Natural Resources, Construction and Maintenance Occupations by Sex
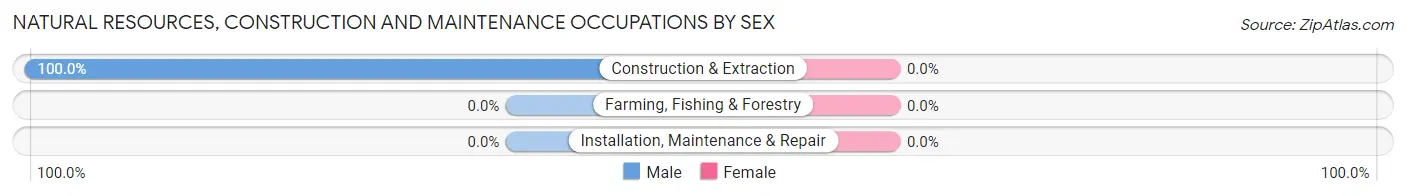
| Occupation | Male | Female |
| Farming, Fishing & Forestry | 0 (0.0%) | 0 (0.0%) |
| Construction & Extraction | 7 (100.0%) | 0 (0.0%) |
| Installation, Maintenance & Repair | 0 (0.0%) | 0 (0.0%) |
| Total (Category) | 7 (100.0%) | 0 (0.0%) |
| Total (Overall) | 16 (61.5%) | 10 (38.5%) |
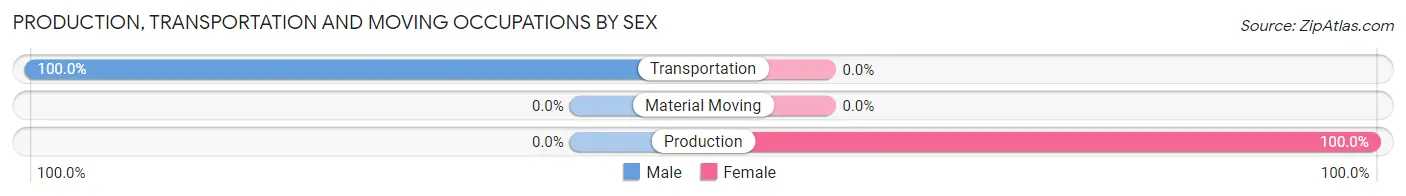
Production, Transportation and Moving Occupations
The most common Production, Transportation and Moving occupations in Grayridge are Production (3 | 11.5%), and Transportation (1 | 3.8%).
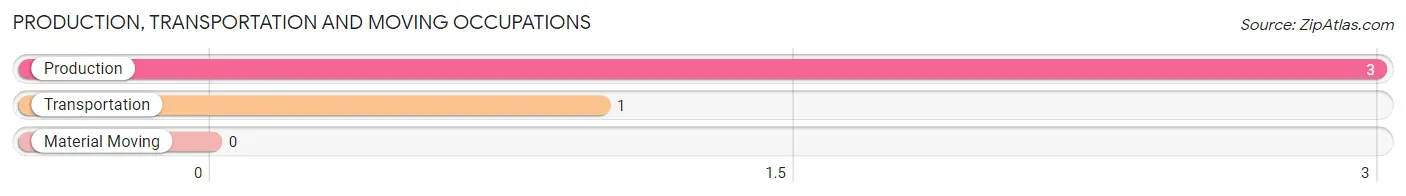
Production, Transportation and Moving Occupations by Sex
| Occupation | Male | Female |
| Production | 0 (0.0%) | 3 (100.0%) |
| Transportation | 1 (100.0%) | 0 (0.0%) |
| Material Moving | 0 (0.0%) | 0 (0.0%) |
| Total (Category) | 1 (25.0%) | 3 (75.0%) |
| Total (Overall) | 16 (61.5%) | 10 (38.5%) |
Employment Industries by Sex in Grayridge
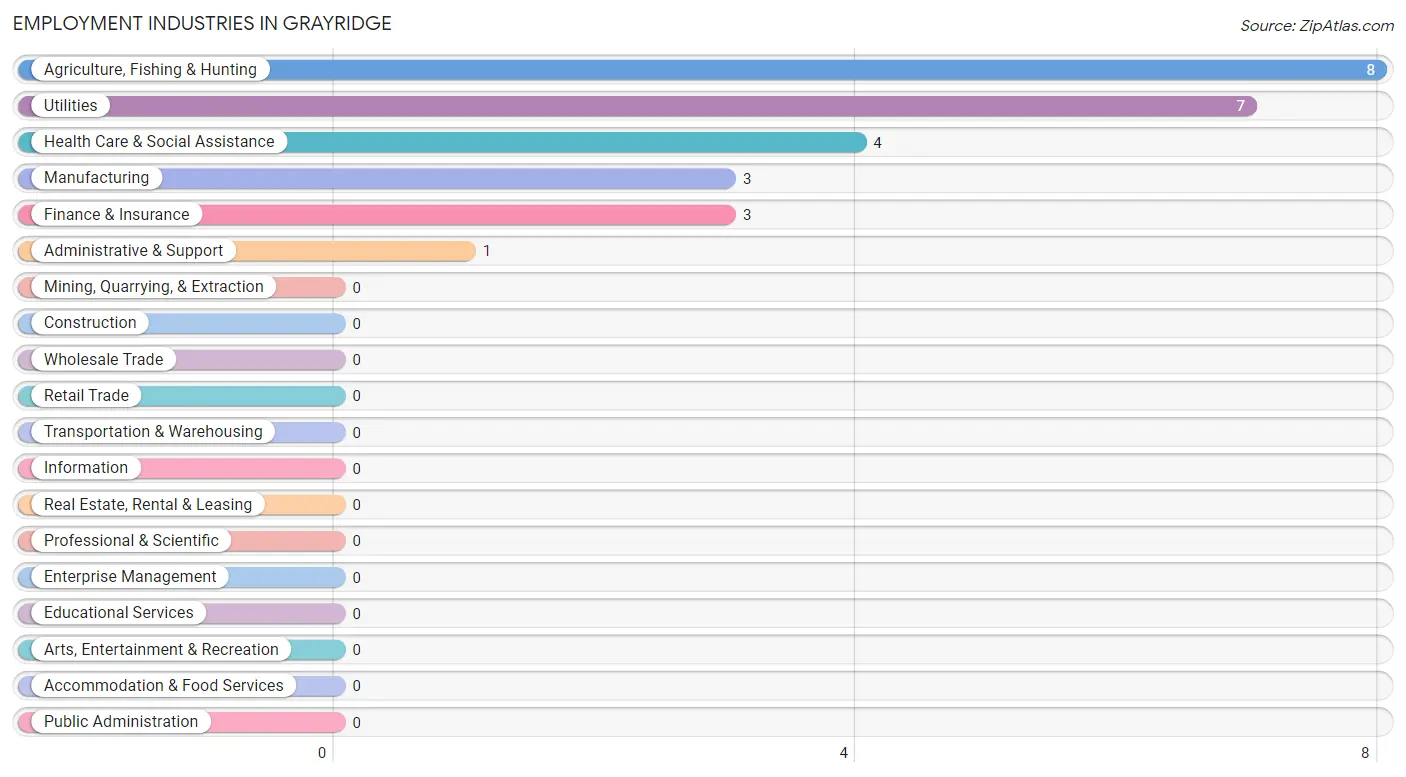
Employment Industries in Grayridge
The major employment industries in Grayridge include Agriculture, Fishing & Hunting (8 | 30.8%), Utilities (7 | 26.9%), Health Care & Social Assistance (4 | 15.4%), Manufacturing (3 | 11.5%), and Finance & Insurance (3 | 11.5%).
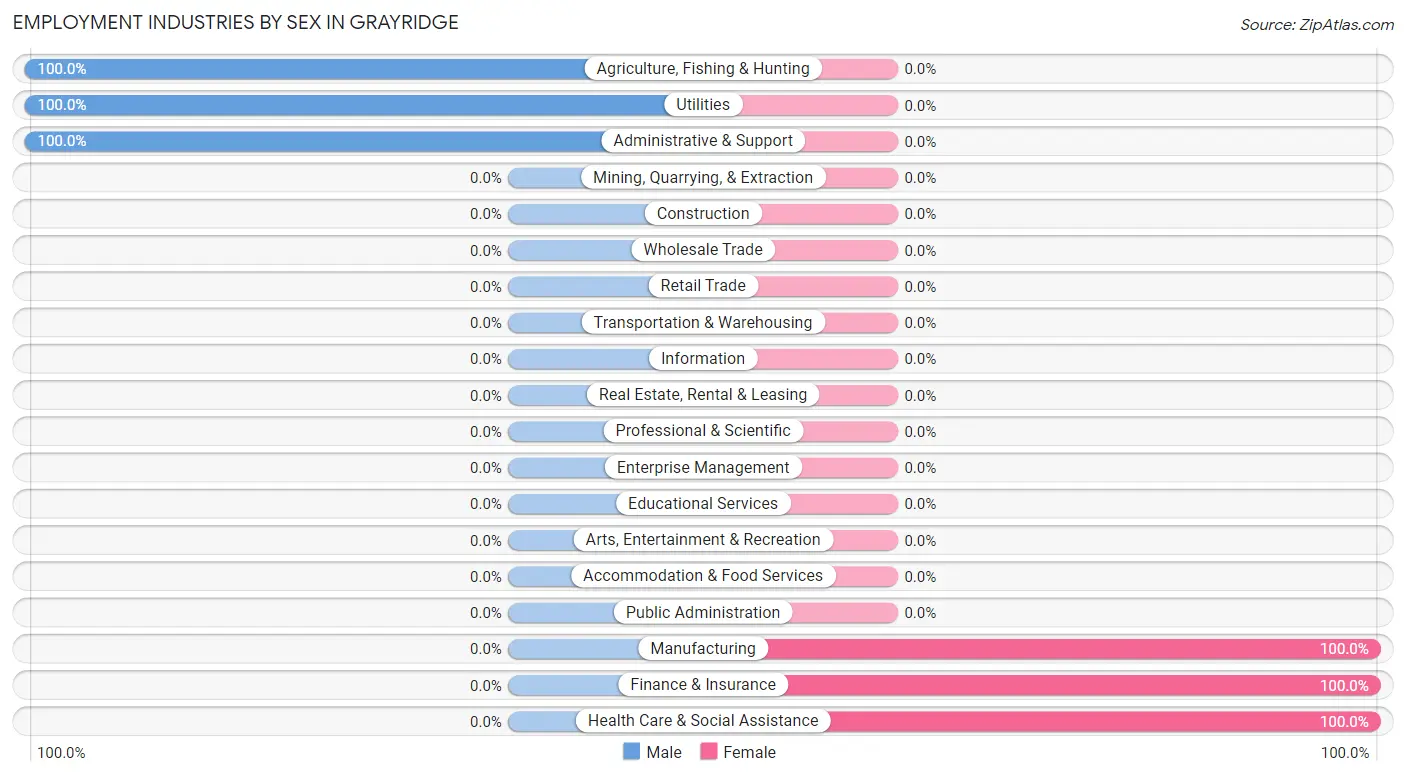
Employment Industries by Sex in Grayridge
The Grayridge industries that see more men than women are Agriculture, Fishing & Hunting (100.0%), Utilities (100.0%), and Administrative & Support (100.0%), whereas the industries that tend to have a higher number of women are Manufacturing (100.0%), Finance & Insurance (100.0%), and Health Care & Social Assistance (100.0%).
| Industry | Male | Female |
| Agriculture, Fishing & Hunting | 8 (100.0%) | 0 (0.0%) |
| Mining, Quarrying, & Extraction | 0 (0.0%) | 0 (0.0%) |
| Construction | 0 (0.0%) | 0 (0.0%) |
| Manufacturing | 0 (0.0%) | 3 (100.0%) |
| Wholesale Trade | 0 (0.0%) | 0 (0.0%) |
| Retail Trade | 0 (0.0%) | 0 (0.0%) |
| Transportation & Warehousing | 0 (0.0%) | 0 (0.0%) |
| Utilities | 7 (100.0%) | 0 (0.0%) |
| Information | 0 (0.0%) | 0 (0.0%) |
| Finance & Insurance | 0 (0.0%) | 3 (100.0%) |
| Real Estate, Rental & Leasing | 0 (0.0%) | 0 (0.0%) |
| Professional & Scientific | 0 (0.0%) | 0 (0.0%) |
| Enterprise Management | 0 (0.0%) | 0 (0.0%) |
| Administrative & Support | 1 (100.0%) | 0 (0.0%) |
| Educational Services | 0 (0.0%) | 0 (0.0%) |
| Health Care & Social Assistance | 0 (0.0%) | 4 (100.0%) |
| Arts, Entertainment & Recreation | 0 (0.0%) | 0 (0.0%) |
| Accommodation & Food Services | 0 (0.0%) | 0 (0.0%) |
| Public Administration | 0 (0.0%) | 0 (0.0%) |
| Total | 16 (61.5%) | 10 (38.5%) |
Education in Grayridge
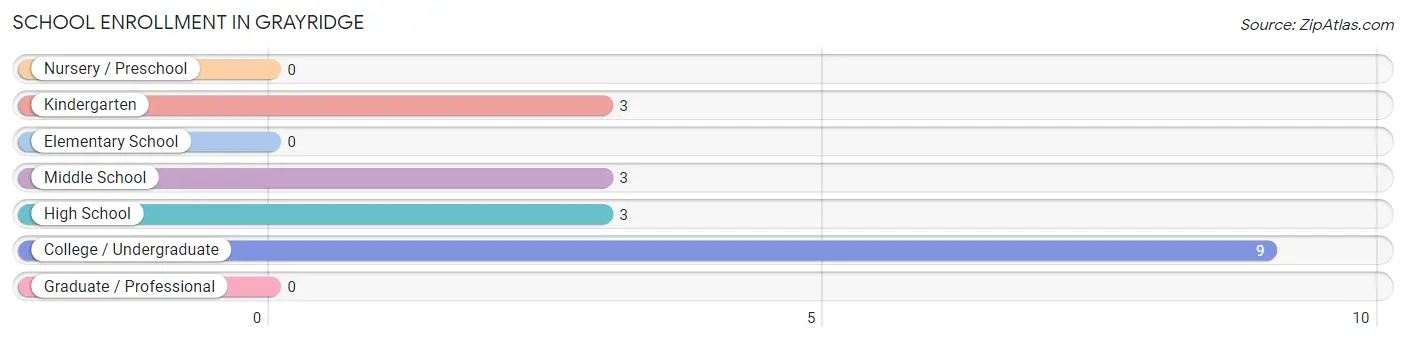
School Enrollment in Grayridge
The most common levels of schooling among the 18 students in Grayridge are college / undergraduate (9 | 50.0%), kindergarten (3 | 16.7%), and middle school (3 | 16.7%).
| School Level | # Students | % Students |
| Nursery / Preschool | 0 | 0.0% |
| Kindergarten | 3 | 16.7% |
| Elementary School | 0 | 0.0% |
| Middle School | 3 | 16.7% |
| High School | 3 | 16.7% |
| College / Undergraduate | 9 | 50.0% |
| Graduate / Professional | 0 | 0.0% |
| Total | 18 | 100.0% |
School Enrollment by Age by Funding Source in Grayridge
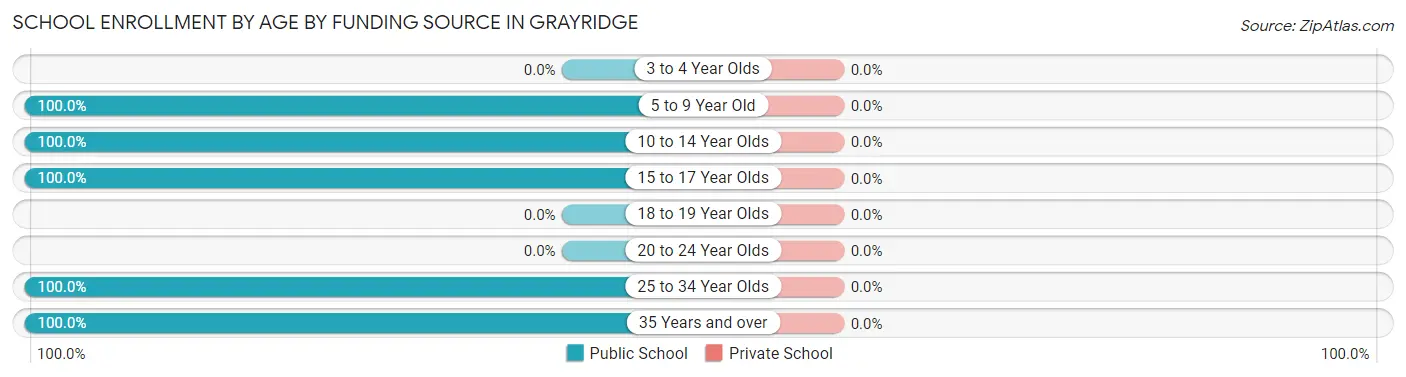
| Age Bracket | Public School | Private School |
| 3 to 4 Year Olds | 0 (0.0%) | 0 (0.0%) |
| 5 to 9 Year Old | 3 (100.0%) | 0 (0.0%) |
| 10 to 14 Year Olds | 6 (100.0%) | 0 (0.0%) |
| 15 to 17 Year Olds | 2 (100.0%) | 0 (0.0%) |
| 18 to 19 Year Olds | 0 (0.0%) | 0 (0.0%) |
| 20 to 24 Year Olds | 0 (0.0%) | 0 (0.0%) |
| 25 to 34 Year Olds | 4 (100.0%) | 0 (0.0%) |
| 35 Years and over | 3 (100.0%) | 0 (0.0%) |
| Total | 18 (100.0%) | 0 (0.0%) |
Educational Attainment by Field of Study in Grayridge
Bio, nature & agricultural (3 | 42.9%), education (2 | 28.6%), and arts & humanities (2 | 28.6%) are the most common fields of study among 7 individuals in Grayridge who have obtained a bachelor's degree or higher.
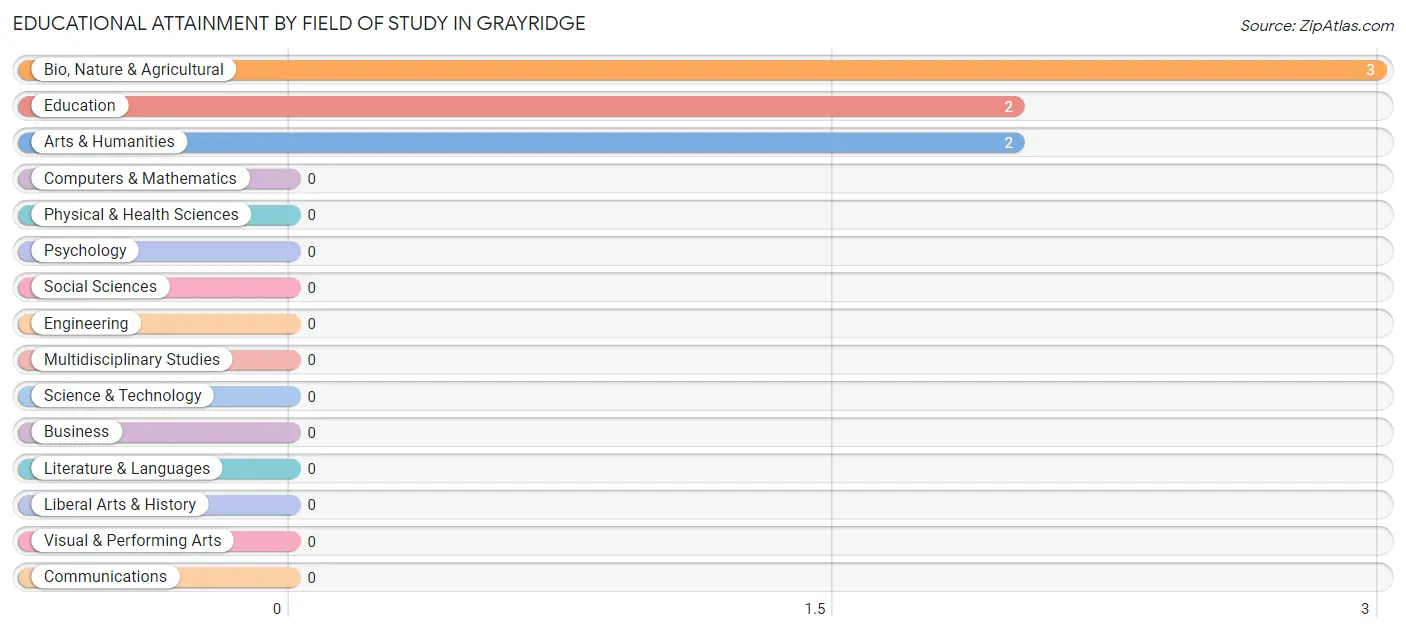
| Field of Study | # Graduates | % Graduates |
| Computers & Mathematics | 0 | 0.0% |
| Bio, Nature & Agricultural | 3 | 42.9% |
| Physical & Health Sciences | 0 | 0.0% |
| Psychology | 0 | 0.0% |
| Social Sciences | 0 | 0.0% |
| Engineering | 0 | 0.0% |
| Multidisciplinary Studies | 0 | 0.0% |
| Science & Technology | 0 | 0.0% |
| Business | 0 | 0.0% |
| Education | 2 | 28.6% |
| Literature & Languages | 0 | 0.0% |
| Liberal Arts & History | 0 | 0.0% |
| Visual & Performing Arts | 0 | 0.0% |
| Communications | 0 | 0.0% |
| Arts & Humanities | 2 | 28.6% |
| Total | 7 | 100.0% |
Transportation & Commute in Grayridge
Vehicle Availability by Sex in Grayridge
The most prevalent vehicle ownership categories in Grayridge are males with 2 vehicles (16, accounting for 100.0%) and females with 2 vehicles (10, making up 160.0%).
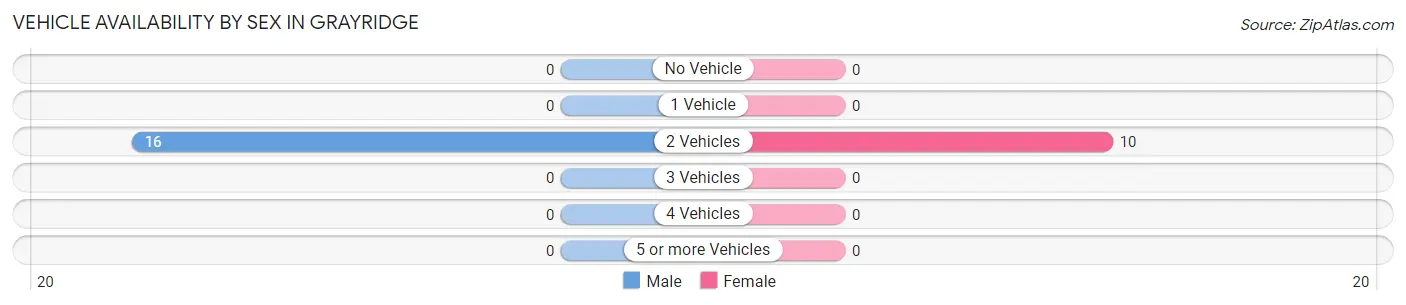
| Vehicles Available | Male | Female |
| No Vehicle | 0 (0.0%) | 0 (0.0%) |
| 1 Vehicle | 0 (0.0%) | 0 (0.0%) |
| 2 Vehicles | 16 (100.0%) | 10 (100.0%) |
| 3 Vehicles | 0 (0.0%) | 0 (0.0%) |
| 4 Vehicles | 0 (0.0%) | 0 (0.0%) |
| 5 or more Vehicles | 0 (0.0%) | 0 (0.0%) |
| Total | 16 (100.0%) | 10 (100.0%) |
Commute Time in Grayridge
The most frequently occuring commute durations in Grayridge are 15 to 19 minutes (8 commuters, 30.8%), 5 to 9 minutes (6 commuters, 23.1%), and 10 to 14 minutes (5 commuters, 19.2%).
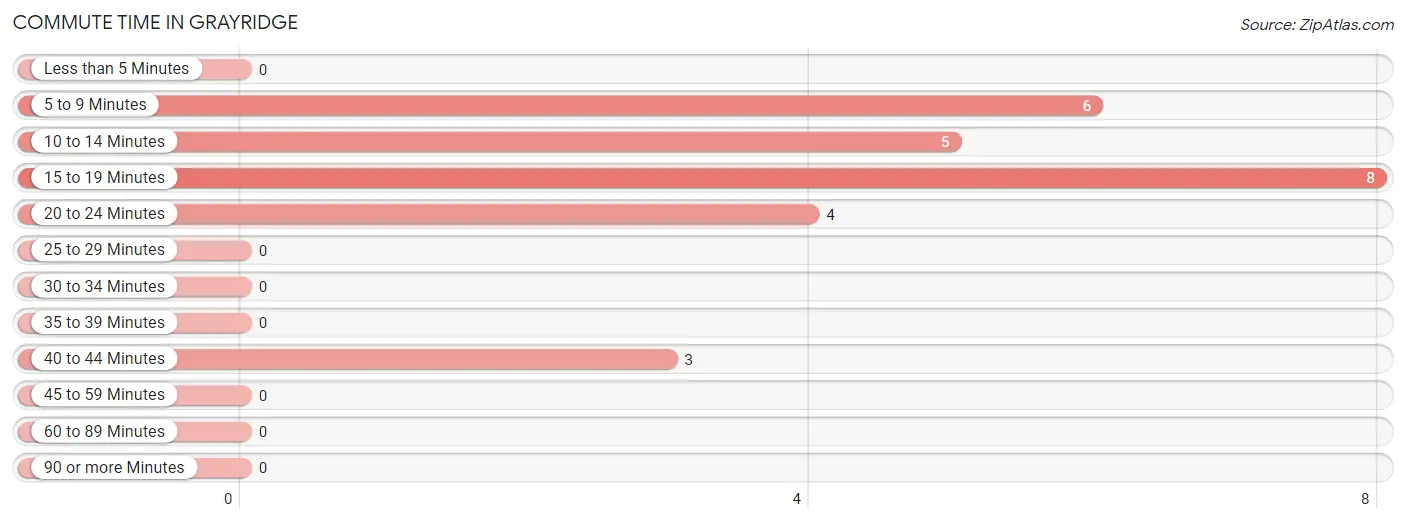
| Commute Time | # Commuters | % Commuters |
| Less than 5 Minutes | 0 | 0.0% |
| 5 to 9 Minutes | 6 | 23.1% |
| 10 to 14 Minutes | 5 | 19.2% |
| 15 to 19 Minutes | 8 | 30.8% |
| 20 to 24 Minutes | 4 | 15.4% |
| 25 to 29 Minutes | 0 | 0.0% |
| 30 to 34 Minutes | 0 | 0.0% |
| 35 to 39 Minutes | 0 | 0.0% |
| 40 to 44 Minutes | 3 | 11.5% |
| 45 to 59 Minutes | 0 | 0.0% |
| 60 to 89 Minutes | 0 | 0.0% |
| 90 or more Minutes | 0 | 0.0% |
Commute Time by Sex in Grayridge
The most common commute times in Grayridge are 15 to 19 minutes (8 commuters, 50.0%) for males and 20 to 24 minutes (4 commuters, 40.0%) for females.
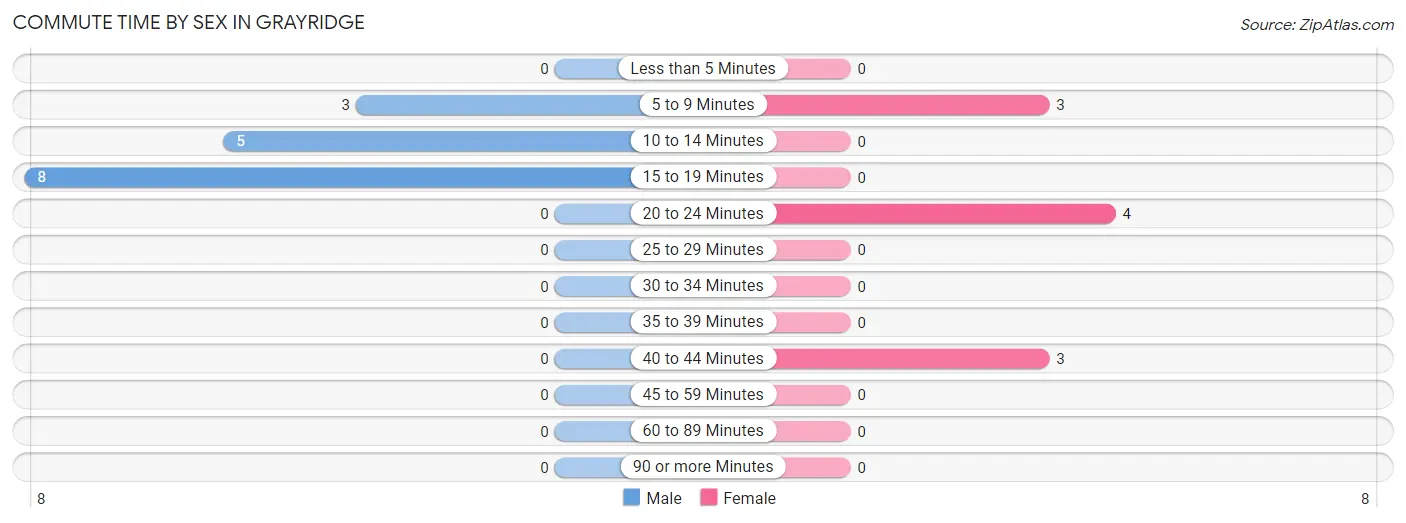
| Commute Time | Male | Female |
| Less than 5 Minutes | 0 (0.0%) | 0 (0.0%) |
| 5 to 9 Minutes | 3 (18.8%) | 3 (30.0%) |
| 10 to 14 Minutes | 5 (31.2%) | 0 (0.0%) |
| 15 to 19 Minutes | 8 (50.0%) | 0 (0.0%) |
| 20 to 24 Minutes | 0 (0.0%) | 4 (40.0%) |
| 25 to 29 Minutes | 0 (0.0%) | 0 (0.0%) |
| 30 to 34 Minutes | 0 (0.0%) | 0 (0.0%) |
| 35 to 39 Minutes | 0 (0.0%) | 0 (0.0%) |
| 40 to 44 Minutes | 0 (0.0%) | 3 (30.0%) |
| 45 to 59 Minutes | 0 (0.0%) | 0 (0.0%) |
| 60 to 89 Minutes | 0 (0.0%) | 0 (0.0%) |
| 90 or more Minutes | 0 (0.0%) | 0 (0.0%) |
Time of Departure to Work by Sex in Grayridge
The most frequent times of departure to work in Grayridge are 7:00 AM to 7:29 AM (9, 56.2%) for males and 5:30 AM to 5:59 AM (6, 60.0%) for females.
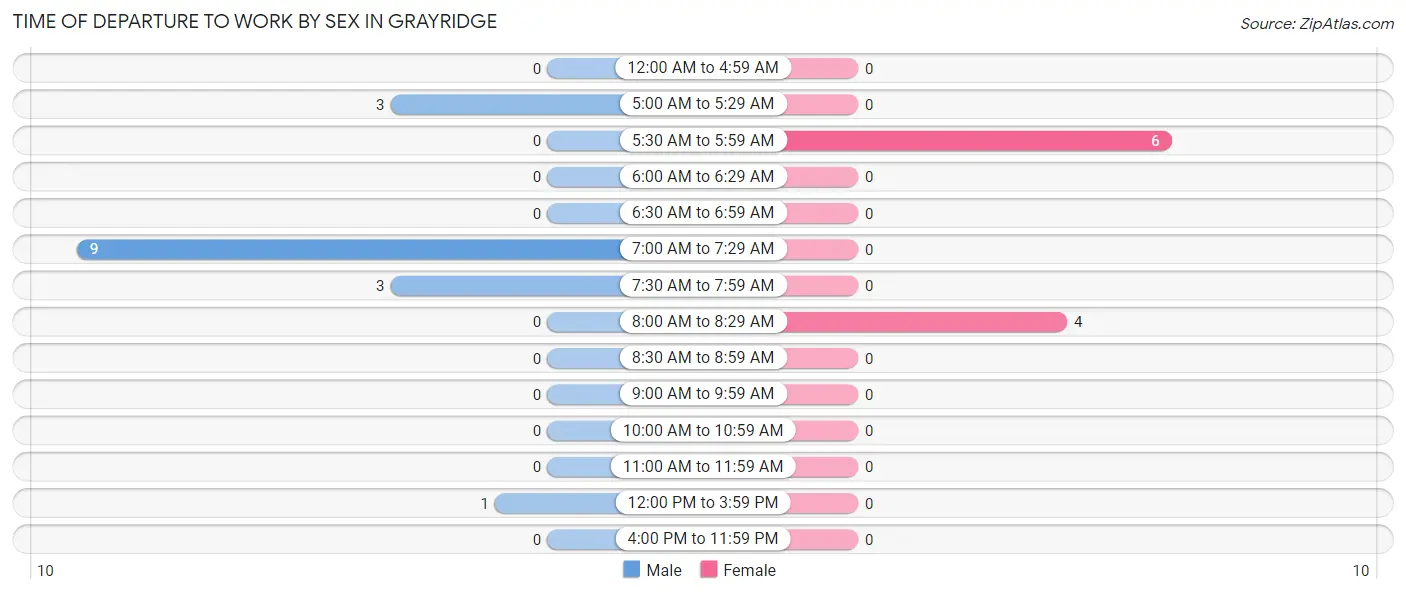
| Time of Departure | Male | Female |
| 12:00 AM to 4:59 AM | 0 (0.0%) | 0 (0.0%) |
| 5:00 AM to 5:29 AM | 3 (18.8%) | 0 (0.0%) |
| 5:30 AM to 5:59 AM | 0 (0.0%) | 6 (60.0%) |
| 6:00 AM to 6:29 AM | 0 (0.0%) | 0 (0.0%) |
| 6:30 AM to 6:59 AM | 0 (0.0%) | 0 (0.0%) |
| 7:00 AM to 7:29 AM | 9 (56.2%) | 0 (0.0%) |
| 7:30 AM to 7:59 AM | 3 (18.8%) | 0 (0.0%) |
| 8:00 AM to 8:29 AM | 0 (0.0%) | 4 (40.0%) |
| 8:30 AM to 8:59 AM | 0 (0.0%) | 0 (0.0%) |
| 9:00 AM to 9:59 AM | 0 (0.0%) | 0 (0.0%) |
| 10:00 AM to 10:59 AM | 0 (0.0%) | 0 (0.0%) |
| 11:00 AM to 11:59 AM | 0 (0.0%) | 0 (0.0%) |
| 12:00 PM to 3:59 PM | 1 (6.2%) | 0 (0.0%) |
| 4:00 PM to 11:59 PM | 0 (0.0%) | 0 (0.0%) |
| Total | 16 (100.0%) | 10 (100.0%) |
Housing Occupancy in Grayridge
Occupancy by Ownership in Grayridge
Of the total 28 dwellings in Grayridge, owner-occupied units account for 25 (89.3%), while renter-occupied units make up 3 (10.7%).
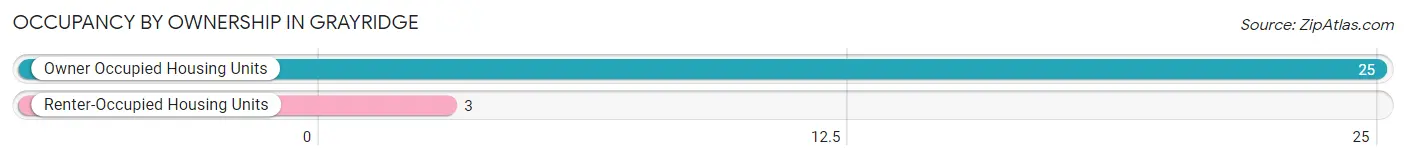
| Occupancy | # Housing Units | % Housing Units |
| Owner Occupied Housing Units | 25 | 89.3% |
| Renter-Occupied Housing Units | 3 | 10.7% |
| Total Occupied Housing Units | 28 | 100.0% |
Occupancy by Household Size in Grayridge
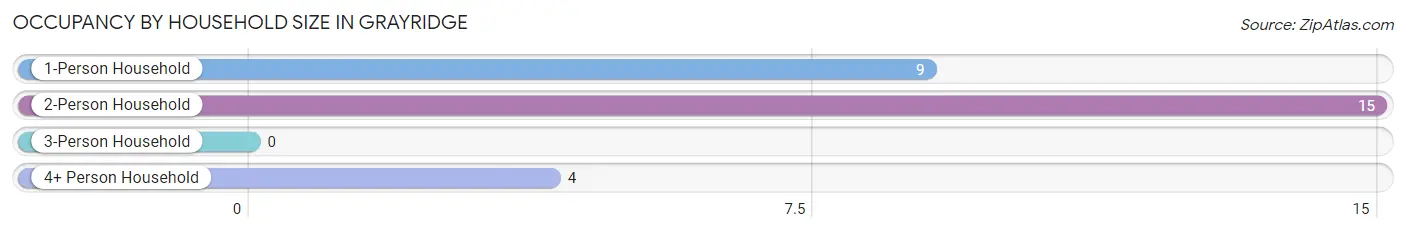
| Household Size | # Housing Units | % Housing Units |
| 1-Person Household | 9 | 32.1% |
| 2-Person Household | 15 | 53.6% |
| 3-Person Household | 0 | 0.0% |
| 4+ Person Household | 4 | 14.3% |
| Total Housing Units | 28 | 100.0% |
Occupancy by Ownership by Household Size in Grayridge
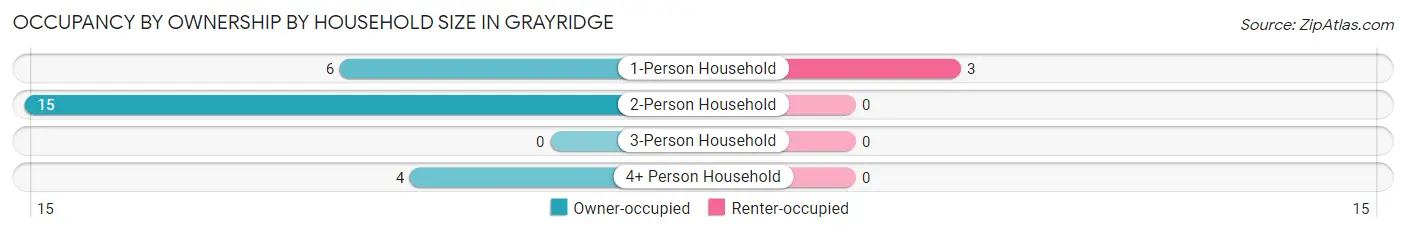
| Household Size | Owner-occupied | Renter-occupied |
| 1-Person Household | 6 (66.7%) | 3 (33.3%) |
| 2-Person Household | 15 (100.0%) | 0 (0.0%) |
| 3-Person Household | 0 (0.0%) | 0 (0.0%) |
| 4+ Person Household | 4 (100.0%) | 0 (0.0%) |
| Total Housing Units | 25 (89.3%) | 3 (10.7%) |
Occupancy by Educational Attainment in Grayridge
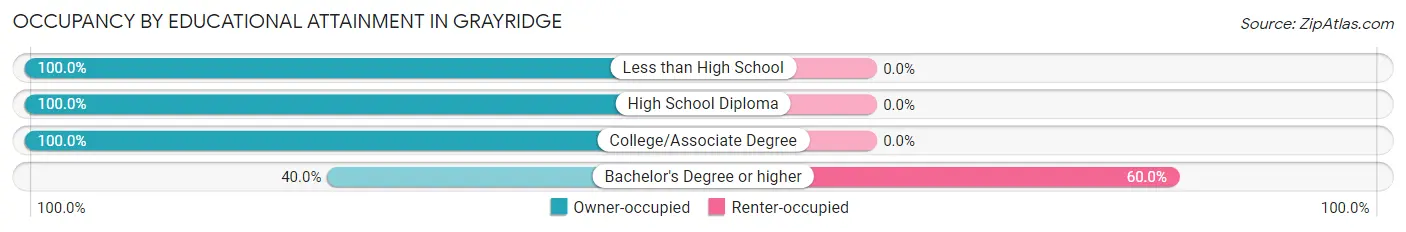
| Household Size | Owner-occupied | Renter-occupied |
| Less than High School | 1 (100.0%) | 0 (0.0%) |
| High School Diploma | 14 (100.0%) | 0 (0.0%) |
| College/Associate Degree | 8 (100.0%) | 0 (0.0%) |
| Bachelor's Degree or higher | 2 (40.0%) | 3 (60.0%) |
Occupancy by Age of Householder in Grayridge
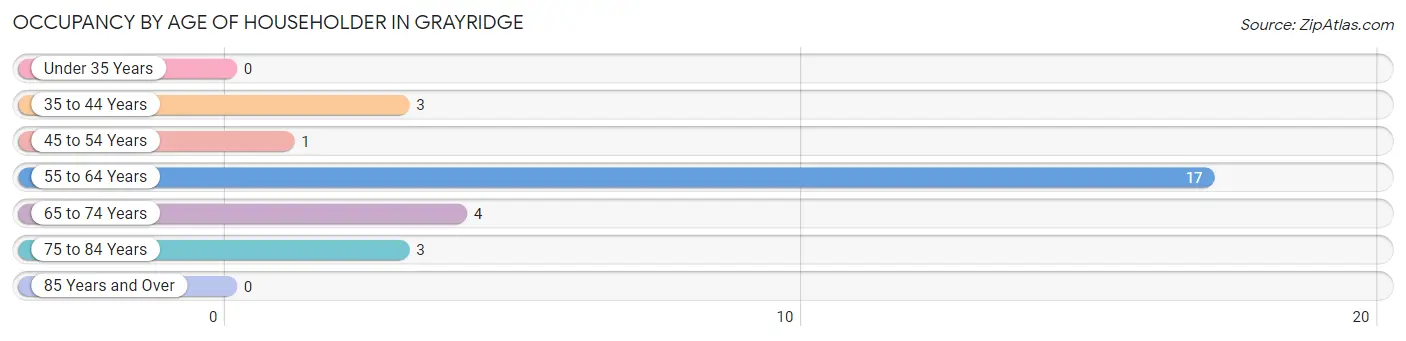
| Age Bracket | # Households | % Households |
| Under 35 Years | 0 | 0.0% |
| 35 to 44 Years | 3 | 10.7% |
| 45 to 54 Years | 1 | 3.6% |
| 55 to 64 Years | 17 | 60.7% |
| 65 to 74 Years | 4 | 14.3% |
| 75 to 84 Years | 3 | 10.7% |
| 85 Years and Over | 0 | 0.0% |
| Total | 28 | 100.0% |
Housing Finances in Grayridge
Median Income by Occupancy in Grayridge
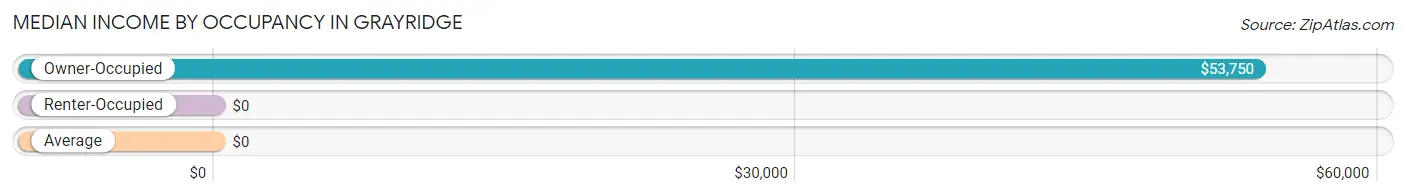
| Occupancy Type | # Households | Median Income |
| Owner-Occupied | 25 (89.3%) | $53,750 |
| Renter-Occupied | 3 (10.7%) | $0 |
| Average | 28 (100.0%) | $0 |
Occupancy by Householder Income Bracket in Grayridge
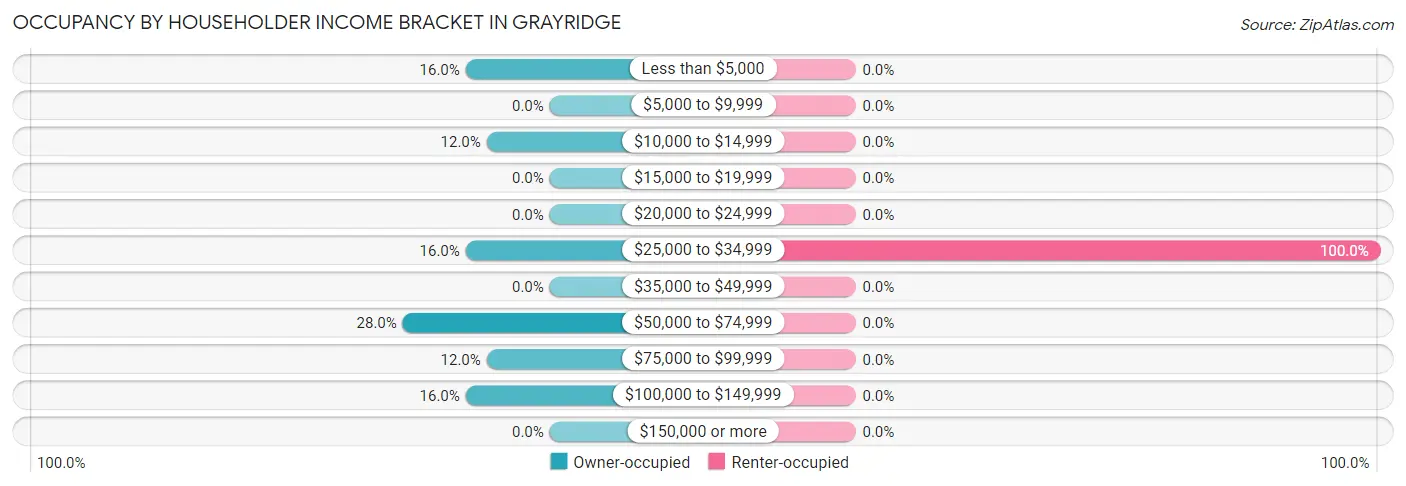
| Income Bracket | Owner-occupied | Renter-occupied |
| Less than $5,000 | 4 (16.0%) | 0 (0.0%) |
| $5,000 to $9,999 | 0 (0.0%) | 0 (0.0%) |
| $10,000 to $14,999 | 3 (12.0%) | 0 (0.0%) |
| $15,000 to $19,999 | 0 (0.0%) | 0 (0.0%) |
| $20,000 to $24,999 | 0 (0.0%) | 0 (0.0%) |
| $25,000 to $34,999 | 4 (16.0%) | 3 (100.0%) |
| $35,000 to $49,999 | 0 (0.0%) | 0 (0.0%) |
| $50,000 to $74,999 | 7 (28.0%) | 0 (0.0%) |
| $75,000 to $99,999 | 3 (12.0%) | 0 (0.0%) |
| $100,000 to $149,999 | 4 (16.0%) | 0 (0.0%) |
| $150,000 or more | 0 (0.0%) | 0 (0.0%) |
| Total | 25 (100.0%) | 3 (100.0%) |
Monthly Housing Cost Tiers in Grayridge
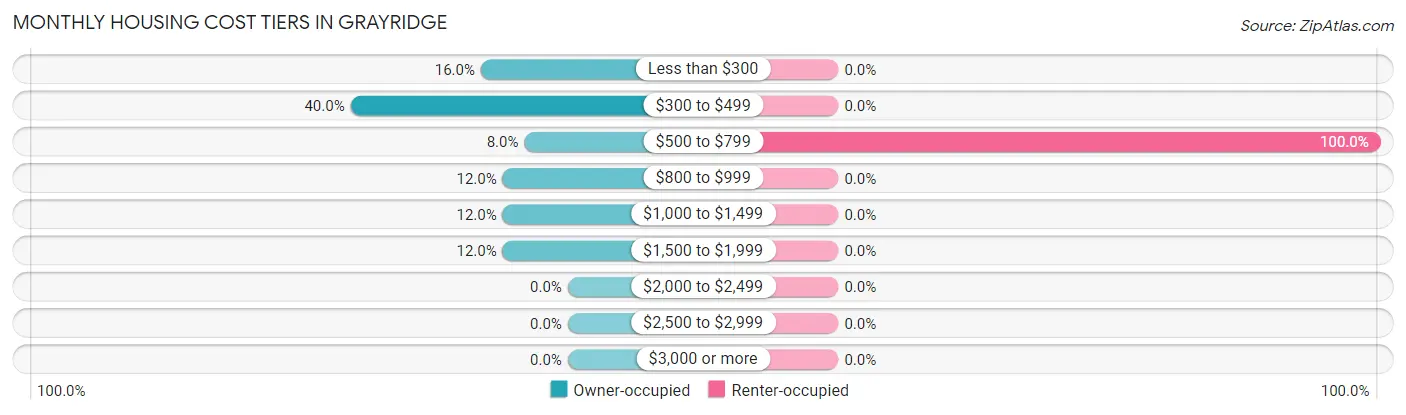
| Monthly Cost | Owner-occupied | Renter-occupied |
| Less than $300 | 4 (16.0%) | 0 (0.0%) |
| $300 to $499 | 10 (40.0%) | 0 (0.0%) |
| $500 to $799 | 2 (8.0%) | 3 (100.0%) |
| $800 to $999 | 3 (12.0%) | 0 (0.0%) |
| $1,000 to $1,499 | 3 (12.0%) | 0 (0.0%) |
| $1,500 to $1,999 | 3 (12.0%) | 0 (0.0%) |
| $2,000 to $2,499 | 0 (0.0%) | 0 (0.0%) |
| $2,500 to $2,999 | 0 (0.0%) | 0 (0.0%) |
| $3,000 or more | 0 (0.0%) | 0 (0.0%) |
| Total | 25 (100.0%) | 3 (100.0%) |
Physical Housing Characteristics in Grayridge
Housing Structures in Grayridge
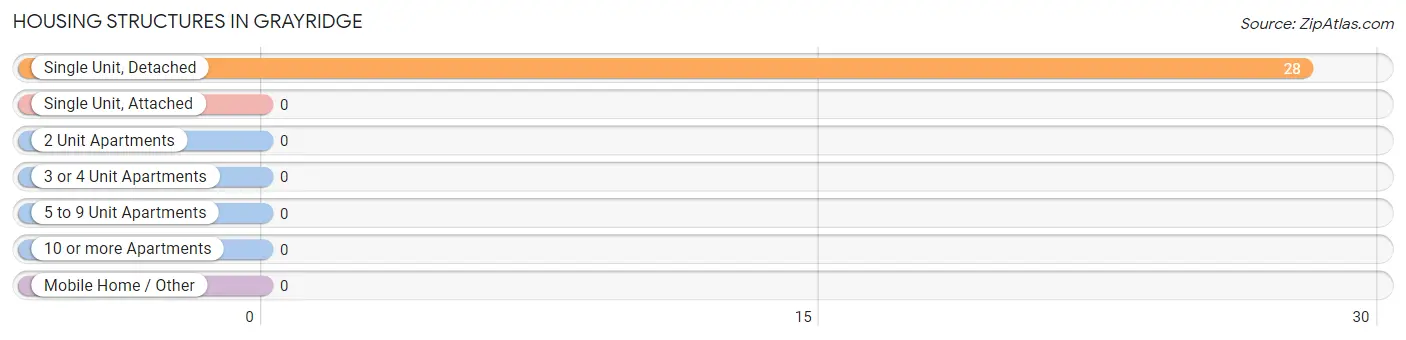
| Structure Type | # Housing Units | % Housing Units |
| Single Unit, Detached | 28 | 100.0% |
| Single Unit, Attached | 0 | 0.0% |
| 2 Unit Apartments | 0 | 0.0% |
| 3 or 4 Unit Apartments | 0 | 0.0% |
| 5 to 9 Unit Apartments | 0 | 0.0% |
| 10 or more Apartments | 0 | 0.0% |
| Mobile Home / Other | 0 | 0.0% |
| Total | 28 | 100.0% |
Housing Structures by Occupancy in Grayridge
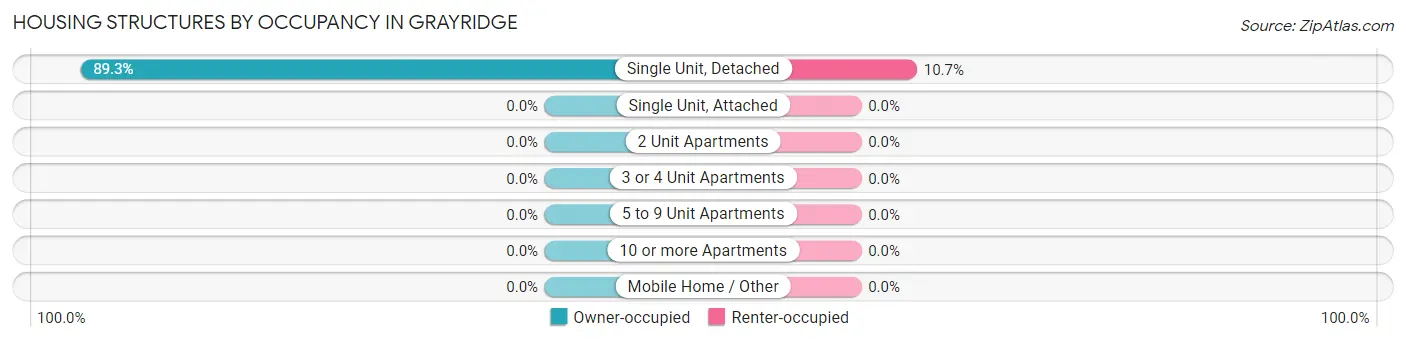
| Structure Type | Owner-occupied | Renter-occupied |
| Single Unit, Detached | 25 (89.3%) | 3 (10.7%) |
| Single Unit, Attached | 0 (0.0%) | 0 (0.0%) |
| 2 Unit Apartments | 0 (0.0%) | 0 (0.0%) |
| 3 or 4 Unit Apartments | 0 (0.0%) | 0 (0.0%) |
| 5 to 9 Unit Apartments | 0 (0.0%) | 0 (0.0%) |
| 10 or more Apartments | 0 (0.0%) | 0 (0.0%) |
| Mobile Home / Other | 0 (0.0%) | 0 (0.0%) |
| Total | 25 (89.3%) | 3 (10.7%) |
Housing Structures by Number of Rooms in Grayridge
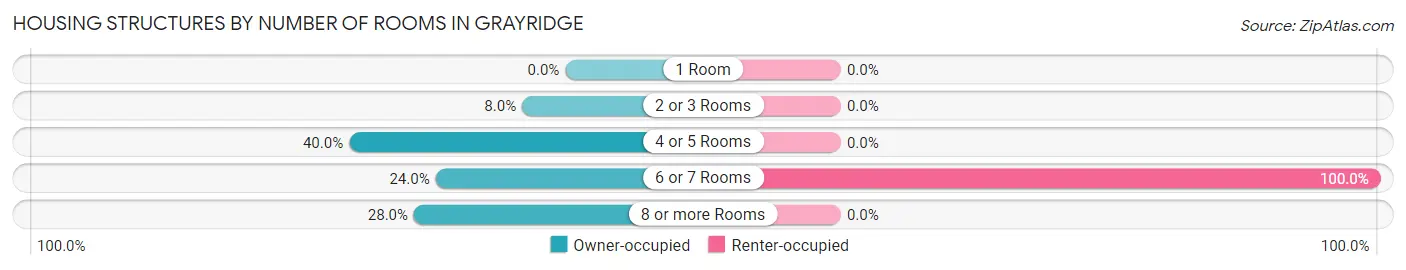
| Number of Rooms | Owner-occupied | Renter-occupied |
| 1 Room | 0 (0.0%) | 0 (0.0%) |
| 2 or 3 Rooms | 2 (8.0%) | 0 (0.0%) |
| 4 or 5 Rooms | 10 (40.0%) | 0 (0.0%) |
| 6 or 7 Rooms | 6 (24.0%) | 3 (100.0%) |
| 8 or more Rooms | 7 (28.0%) | 0 (0.0%) |
| Total | 25 (100.0%) | 3 (100.0%) |
Housing Structure by Heating Type in Grayridge
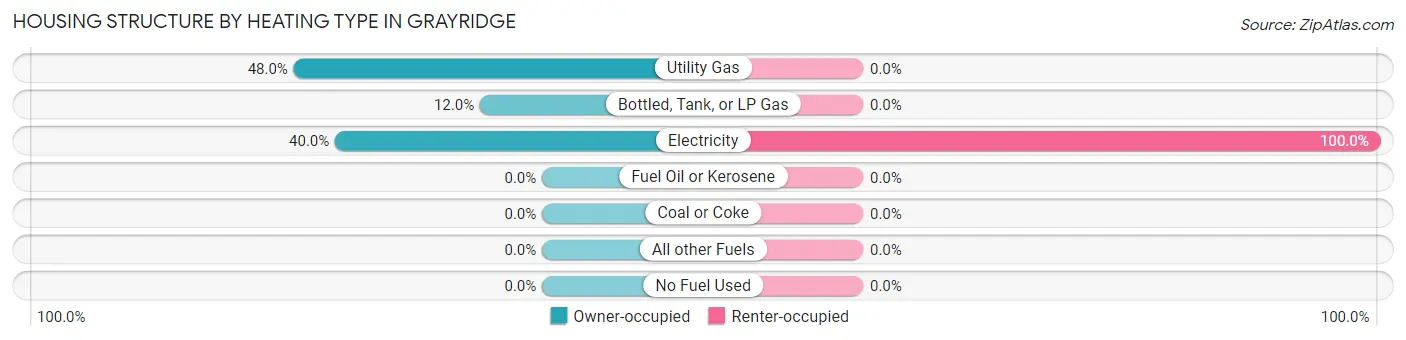
| Heating Type | Owner-occupied | Renter-occupied |
| Utility Gas | 12 (48.0%) | 0 (0.0%) |
| Bottled, Tank, or LP Gas | 3 (12.0%) | 0 (0.0%) |
| Electricity | 10 (40.0%) | 3 (100.0%) |
| Fuel Oil or Kerosene | 0 (0.0%) | 0 (0.0%) |
| Coal or Coke | 0 (0.0%) | 0 (0.0%) |
| All other Fuels | 0 (0.0%) | 0 (0.0%) |
| No Fuel Used | 0 (0.0%) | 0 (0.0%) |
| Total | 25 (100.0%) | 3 (100.0%) |
Household Vehicle Usage in Grayridge
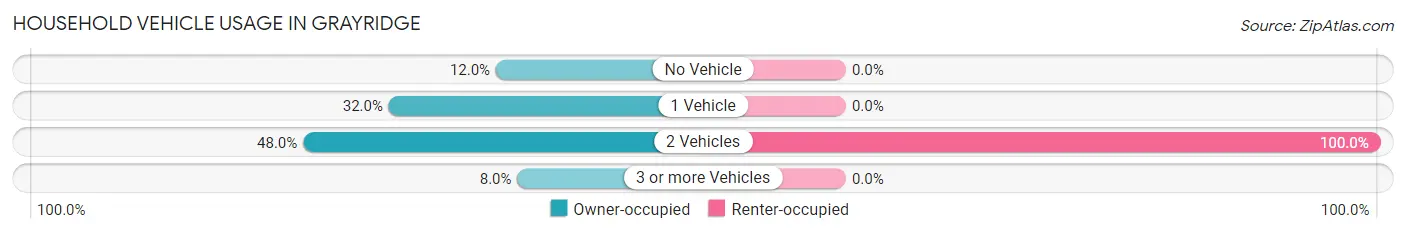
| Vehicles per Household | Owner-occupied | Renter-occupied |
| No Vehicle | 3 (12.0%) | 0 (0.0%) |
| 1 Vehicle | 8 (32.0%) | 0 (0.0%) |
| 2 Vehicles | 12 (48.0%) | 3 (100.0%) |
| 3 or more Vehicles | 2 (8.0%) | 0 (0.0%) |
| Total | 25 (100.0%) | 3 (100.0%) |
Real Estate & Mortgages in Grayridge
Real Estate and Mortgage Overview in Grayridge
| Characteristic | Without Mortgage | With Mortgage |
| Housing Units | 13 | 12 |
| Median Property Value | $63,600 | $76,300 |
| Median Household Income | - | - |
| Monthly Housing Costs | $342 | $0 |
| Real Estate Taxes | $471 | $0 |
Property Value by Mortgage Status in Grayridge
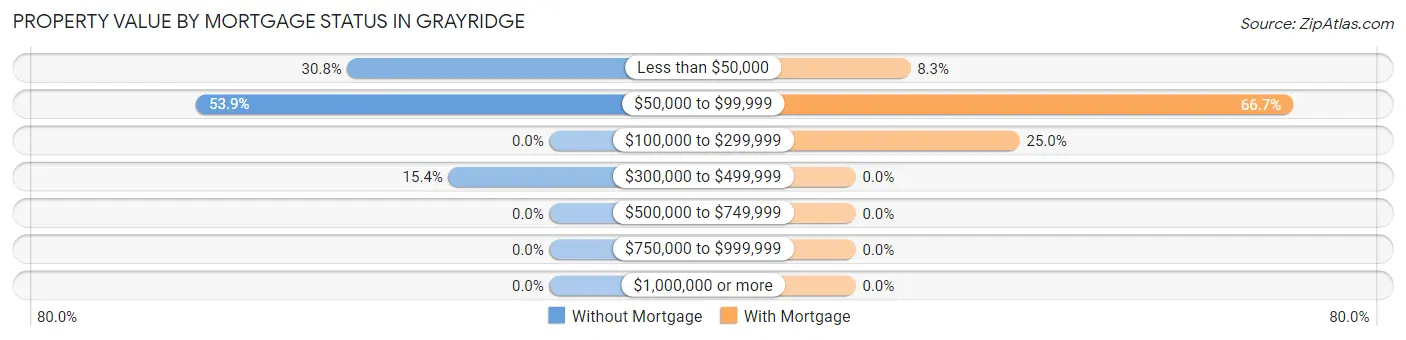
| Property Value | Without Mortgage | With Mortgage |
| Less than $50,000 | 4 (30.8%) | 1 (8.3%) |
| $50,000 to $99,999 | 7 (53.8%) | 8 (66.7%) |
| $100,000 to $299,999 | 0 (0.0%) | 3 (25.0%) |
| $300,000 to $499,999 | 2 (15.4%) | 0 (0.0%) |
| $500,000 to $749,999 | 0 (0.0%) | 0 (0.0%) |
| $750,000 to $999,999 | 0 (0.0%) | 0 (0.0%) |
| $1,000,000 or more | 0 (0.0%) | 0 (0.0%) |
| Total | 13 (100.0%) | 12 (100.0%) |
Household Income by Mortgage Status in Grayridge
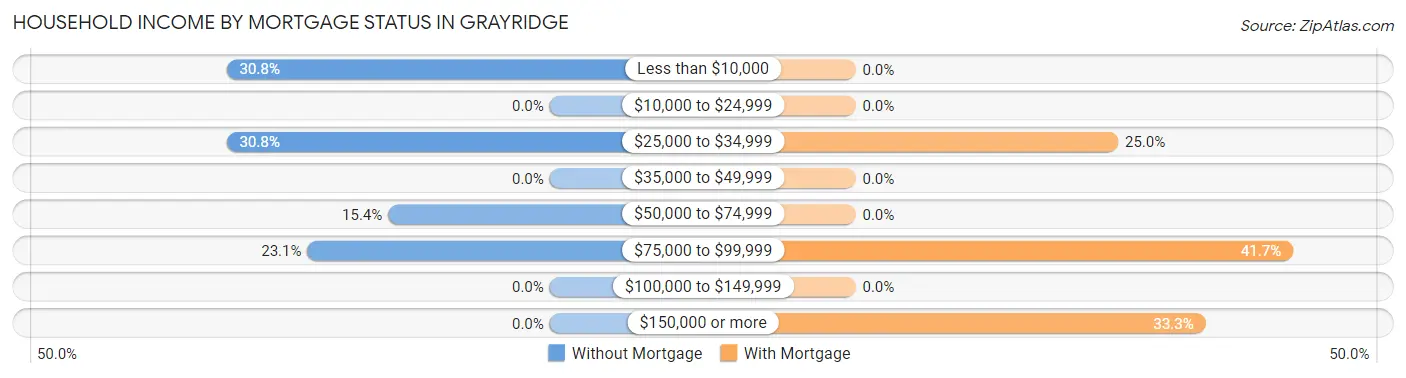
| Household Income | Without Mortgage | With Mortgage |
| Less than $10,000 | 4 (30.8%) | 0 (0.0%) |
| $10,000 to $24,999 | 0 (0.0%) | 0 (0.0%) |
| $25,000 to $34,999 | 4 (30.8%) | 3 (25.0%) |
| $35,000 to $49,999 | 0 (0.0%) | 0 (0.0%) |
| $50,000 to $74,999 | 2 (15.4%) | 0 (0.0%) |
| $75,000 to $99,999 | 3 (23.1%) | 5 (41.7%) |
| $100,000 to $149,999 | 0 (0.0%) | 0 (0.0%) |
| $150,000 or more | 0 (0.0%) | 4 (33.3%) |
| Total | 13 (100.0%) | 12 (100.0%) |
Property Value to Household Income Ratio in Grayridge
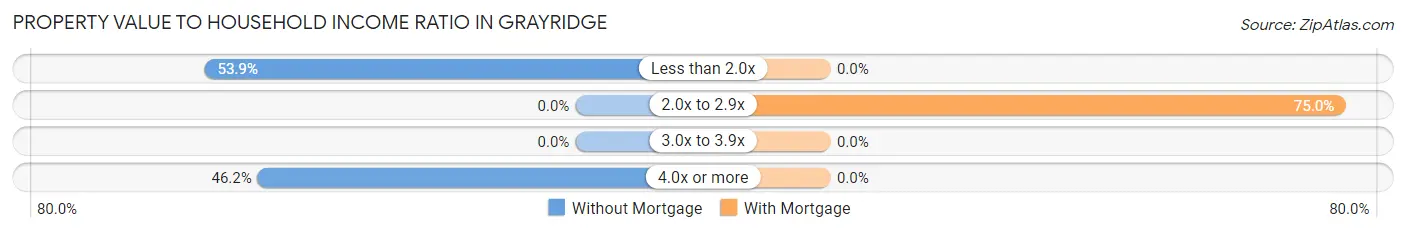
| Value-to-Income Ratio | Without Mortgage | With Mortgage |
| Less than 2.0x | 7 (53.8%) | 0 (0.0%) |
| 2.0x to 2.9x | 0 (0.0%) | 9 (75.0%) |
| 3.0x to 3.9x | 0 (0.0%) | 0 (0.0%) |
| 4.0x or more | 6 (46.2%) | 0 (0.0%) |
| Total | 13 (100.0%) | 12 (100.0%) |
Real Estate Taxes by Mortgage Status in Grayridge
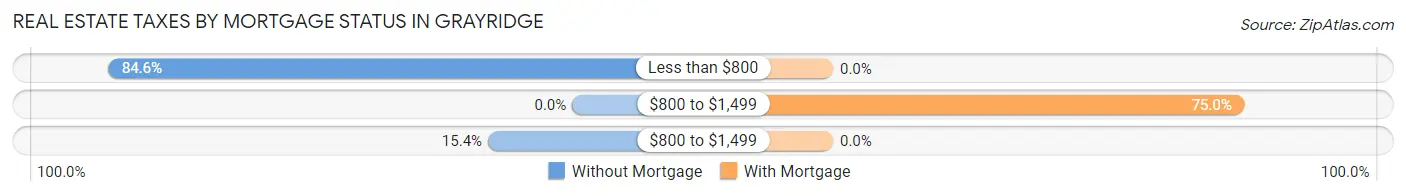
| Property Taxes | Without Mortgage | With Mortgage |
| Less than $800 | 11 (84.6%) | 0 (0.0%) |
| $800 to $1,499 | 0 (0.0%) | 9 (75.0%) |
| $800 to $1,499 | 2 (15.4%) | 0 (0.0%) |
| Total | 13 (100.0%) | 12 (100.0%) |
Health & Disability in Grayridge
Health Insurance Coverage by Age in Grayridge
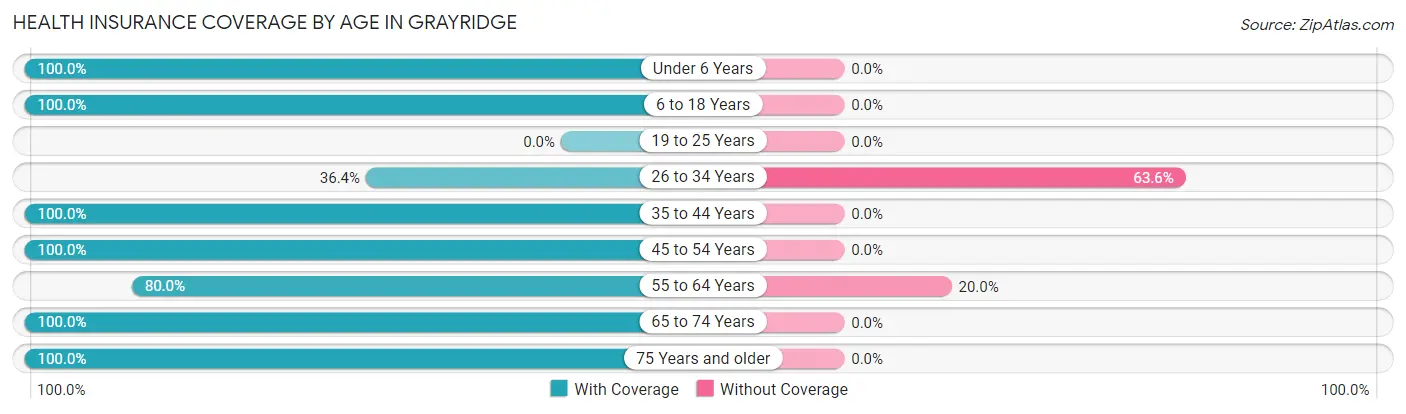
| Age Bracket | With Coverage | Without Coverage |
| Under 6 Years | 4 (100.0%) | 0 (0.0%) |
| 6 to 18 Years | 11 (100.0%) | 0 (0.0%) |
| 19 to 25 Years | 0 (0.0%) | 0 (0.0%) |
| 26 to 34 Years | 4 (36.4%) | 7 (63.6%) |
| 35 to 44 Years | 4 (100.0%) | 0 (0.0%) |
| 45 to 54 Years | 4 (100.0%) | 0 (0.0%) |
| 55 to 64 Years | 16 (80.0%) | 4 (20.0%) |
| 65 to 74 Years | 8 (100.0%) | 0 (0.0%) |
| 75 Years and older | 3 (100.0%) | 0 (0.0%) |
| Total | 54 (83.1%) | 11 (16.9%) |
Health Insurance Coverage by Citizenship Status in Grayridge
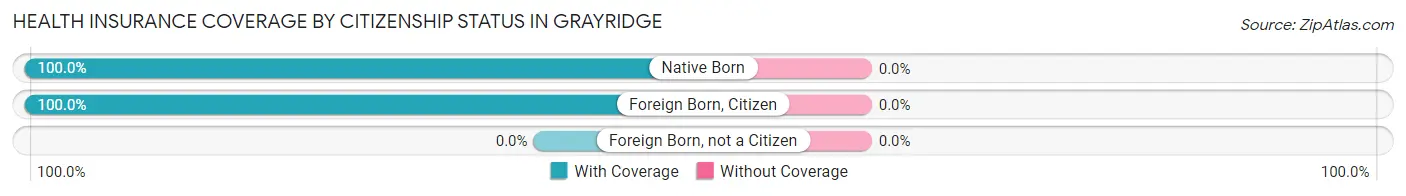
| Citizenship Status | With Coverage | Without Coverage |
| Native Born | 4 (100.0%) | 0 (0.0%) |
| Foreign Born, Citizen | 11 (100.0%) | 0 (0.0%) |
| Foreign Born, not a Citizen | 0 (0.0%) | 0 (0.0%) |
Health Insurance Coverage by Household Income in Grayridge
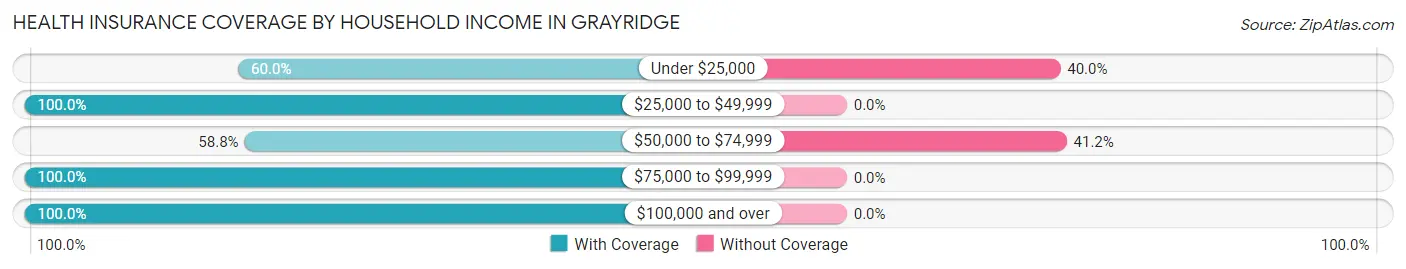
| Household Income | With Coverage | Without Coverage |
| Under $25,000 | 6 (60.0%) | 4 (40.0%) |
| $25,000 to $49,999 | 11 (100.0%) | 0 (0.0%) |
| $50,000 to $74,999 | 10 (58.8%) | 7 (41.2%) |
| $75,000 to $99,999 | 6 (100.0%) | 0 (0.0%) |
| $100,000 and over | 21 (100.0%) | 0 (0.0%) |
Public vs Private Health Insurance Coverage by Age in Grayridge
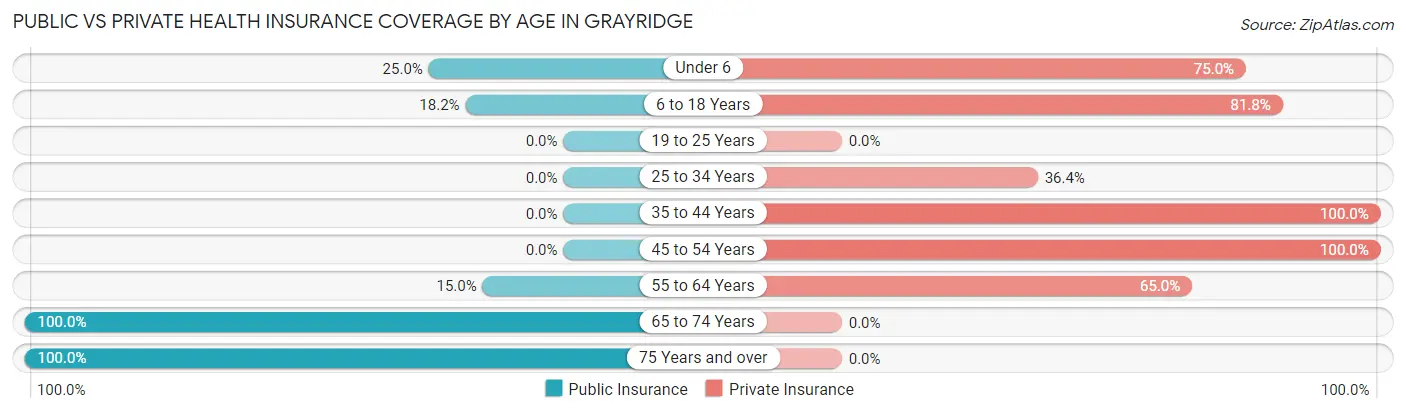
| Age Bracket | Public Insurance | Private Insurance |
| Under 6 | 1 (25.0%) | 3 (75.0%) |
| 6 to 18 Years | 2 (18.2%) | 9 (81.8%) |
| 19 to 25 Years | 0 (0.0%) | 0 (0.0%) |
| 25 to 34 Years | 0 (0.0%) | 4 (36.4%) |
| 35 to 44 Years | 0 (0.0%) | 4 (100.0%) |
| 45 to 54 Years | 0 (0.0%) | 4 (100.0%) |
| 55 to 64 Years | 3 (15.0%) | 13 (65.0%) |
| 65 to 74 Years | 8 (100.0%) | 0 (0.0%) |
| 75 Years and over | 3 (100.0%) | 0 (0.0%) |
| Total | 17 (26.2%) | 37 (56.9%) |
Disability Status by Sex by Age in Grayridge
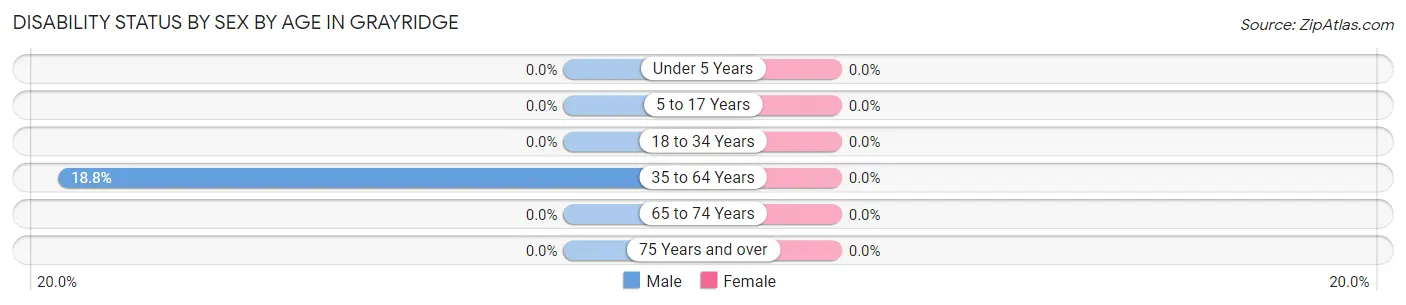
| Age Bracket | Male | Female |
| Under 5 Years | 0 (0.0%) | 0 (0.0%) |
| 5 to 17 Years | 0 (0.0%) | 0 (0.0%) |
| 18 to 34 Years | 0 (0.0%) | 0 (0.0%) |
| 35 to 64 Years | 3 (18.8%) | 0 (0.0%) |
| 65 to 74 Years | 0 (0.0%) | 0 (0.0%) |
| 75 Years and over | 0 (0.0%) | 0 (0.0%) |
Disability Class by Sex by Age in Grayridge
Disability Class: Hearing Difficulty
| Age Bracket | Male | Female |
| Under 5 Years | 0 (0.0%) | 0 (0.0%) |
| 5 to 17 Years | 0 (0.0%) | 0 (0.0%) |
| 18 to 34 Years | 0 (0.0%) | 0 (0.0%) |
| 35 to 64 Years | 0 (0.0%) | 0 (0.0%) |
| 65 to 74 Years | 0 (0.0%) | 0 (0.0%) |
| 75 Years and over | 0 (0.0%) | 0 (0.0%) |
Disability Class: Vision Difficulty
| Age Bracket | Male | Female |
| Under 5 Years | 0 (0.0%) | 0 (0.0%) |
| 5 to 17 Years | 0 (0.0%) | 0 (0.0%) |
| 18 to 34 Years | 0 (0.0%) | 0 (0.0%) |
| 35 to 64 Years | 0 (0.0%) | 0 (0.0%) |
| 65 to 74 Years | 0 (0.0%) | 0 (0.0%) |
| 75 Years and over | 0 (0.0%) | 0 (0.0%) |
Disability Class: Cognitive Difficulty
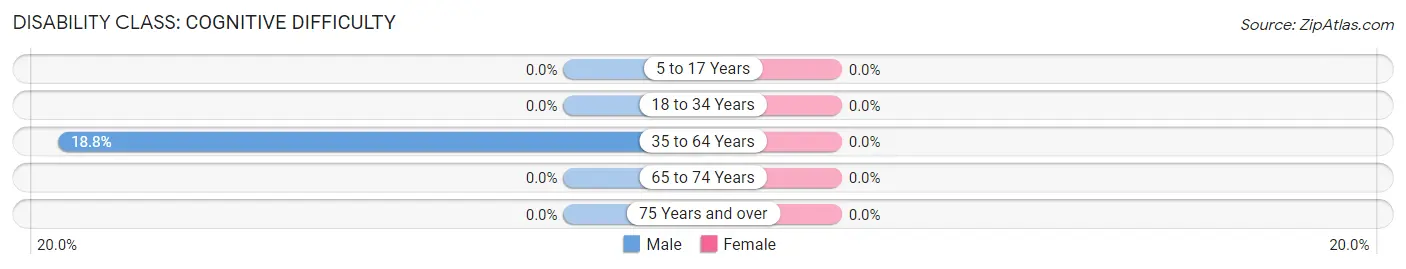
| Age Bracket | Male | Female |
| 5 to 17 Years | 0 (0.0%) | 0 (0.0%) |
| 18 to 34 Years | 0 (0.0%) | 0 (0.0%) |
| 35 to 64 Years | 3 (18.8%) | 0 (0.0%) |
| 65 to 74 Years | 0 (0.0%) | 0 (0.0%) |
| 75 Years and over | 0 (0.0%) | 0 (0.0%) |
Disability Class: Ambulatory Difficulty
| Age Bracket | Male | Female |
| 5 to 17 Years | 0 (0.0%) | 0 (0.0%) |
| 18 to 34 Years | 0 (0.0%) | 0 (0.0%) |
| 35 to 64 Years | 0 (0.0%) | 0 (0.0%) |
| 65 to 74 Years | 0 (0.0%) | 0 (0.0%) |
| 75 Years and over | 0 (0.0%) | 0 (0.0%) |
Disability Class: Self-Care Difficulty
| Age Bracket | Male | Female |
| 5 to 17 Years | 0 (0.0%) | 0 (0.0%) |
| 18 to 34 Years | 0 (0.0%) | 0 (0.0%) |
| 35 to 64 Years | 0 (0.0%) | 0 (0.0%) |
| 65 to 74 Years | 0 (0.0%) | 0 (0.0%) |
| 75 Years and over | 0 (0.0%) | 0 (0.0%) |
Technology Access in Grayridge
Computing Device Access in Grayridge
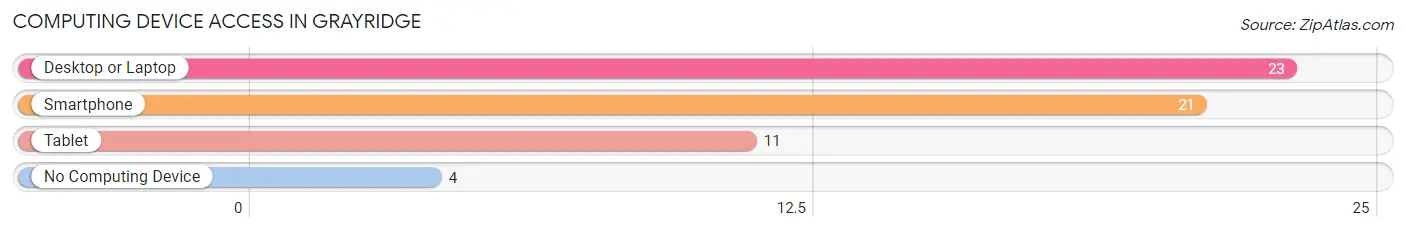
| Device Type | # Households | % Households |
| Desktop or Laptop | 23 | 82.1% |
| Smartphone | 21 | 75.0% |
| Tablet | 11 | 39.3% |
| No Computing Device | 4 | 14.3% |
| Total | 28 | 100.0% |
Internet Access in Grayridge
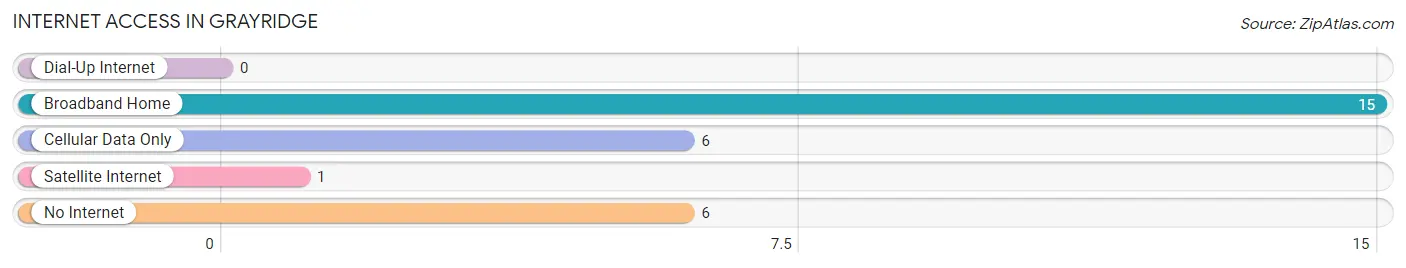
| Internet Type | # Households | % Households |
| Dial-Up Internet | 0 | 0.0% |
| Broadband Home | 15 | 53.6% |
| Cellular Data Only | 6 | 21.4% |
| Satellite Internet | 1 | 3.6% |
| No Internet | 6 | 21.4% |
| Total | 28 | 100.0% |
Grayridge Summary
Grayridge is a small town located in Stoddard County, Missouri. It is situated in the southeastern corner of the state, about 20 miles from the Mississippi River. The town was founded in 1883 and has a population of approximately 500 people.
Geography
Grayridge is located in the southeastern corner of Missouri, about 20 miles from the Mississippi River. The town is situated in the Bootheel region of the state, which is characterized by flat, fertile farmland. The town is surrounded by rolling hills and is located in the Mississippi Alluvial Plain. The climate in Grayridge is humid subtropical, with hot, humid summers and mild winters.
Economy
The economy of Grayridge is largely based on agriculture. The town is located in an area of the state that is known for its fertile farmland, and the majority of the town’s residents are employed in the agricultural industry. The town is also home to several small businesses, including a grocery store, a hardware store, and a few restaurants.
Demographics
As of the 2010 census, the population of Grayridge was 498 people. The racial makeup of the town was 97.2% White, 0.6% African American, 0.2% Native American, 0.2% Asian, 0.2% from other races, and 1.8% from two or more races. Hispanic or Latino of any race were 0.8% of the population.
The median income for a household in Grayridge was $30,000, and the median income for a family was $35,000. The per capita income for the town was $14,000. About 17.2% of families and 19.2% of the population were below the poverty line, including 25.2% of those under age 18 and 11.2% of those age 65 or over.
History
Grayridge was founded in 1883 by a group of settlers from Tennessee. The town was named after a local family, the Grays, who had settled in the area in the early 1800s. The town was originally a farming community, and the main crops grown were cotton, corn, and soybeans.
In the early 1900s, the town began to grow and develop. The first school was built in 1910, and the first bank opened in 1912. The town also had a post office, a general store, and a few other businesses.
In the 1950s, the town began to decline as many of the residents moved away in search of better economic opportunities. The population of Grayridge has remained relatively stable since then, and the town has retained its small-town charm.
Today, Grayridge is a quiet, rural town with a population of approximately 500 people. The town is still largely agricultural, and the main crops grown are cotton, corn, and soybeans. The town also has a few small businesses, including a grocery store, a hardware store, and a few restaurants.
Common Questions
What is Per Capita Income in Grayridge?
Per Capita income in Grayridge is $22,671.
What is the Median Family Income in Grayridge?
Median Family Income in Grayridge is $54,583.
What is Inequality or Gini Index in Grayridge?
Inequality or Gini Index in Grayridge is 0.41.
What is the Total Population of Grayridge?
Total Population of Grayridge is 65.
What is the Total Male Population of Grayridge?
Total Male Population of Grayridge is 36.
What is the Total Female Population of Grayridge?
Total Female Population of Grayridge is 29.
What is the Ratio of Males per 100 Females in Grayridge?
There are 124.14 Males per 100 Females in Grayridge.
What is the Ratio of Females per 100 Males in Grayridge?
There are 80.56 Females per 100 Males in Grayridge.
What is the Median Population Age in Grayridge?
Median Population Age in Grayridge is 49.8 Years.
What is the Average Family Size in Grayridge
Average Family Size in Grayridge is 2.9 People.
What is the Average Household Size in Grayridge
Average Household Size in Grayridge is 2.3 People.
How Large is the Labor Force in Grayridge?
There are 30 People in the Labor Forcein in Grayridge.
What is the Percentage of People in the Labor Force in Grayridge?
60.0% of People are in the Labor Force in Grayridge.
What is the Unemployment Rate in Grayridge?
Unemployment Rate in Grayridge is 13.3%.