Grant City, MO Map & Demographics
Grant City Map
Grant City Overview
$20,012
PER CAPITA INCOME
$49,375
AVG FAMILY INCOME
$36,429
AVG HOUSEHOLD INCOME
64.0%
WAGE / INCOME GAP [ % ]
36.0¢/ $1
WAGE / INCOME GAP [ $ ]
0.43
INEQUALITY / GINI INDEX
1,004
TOTAL POPULATION
479
MALE POPULATION
525
FEMALE POPULATION
91.24
MALES / 100 FEMALES
109.60
FEMALES / 100 MALES
37.7
MEDIAN AGE
3.7
AVG FAMILY SIZE
2.8
AVG HOUSEHOLD SIZE
512
LABOR FORCE [ PEOPLE ]
65.8%
PERCENT IN LABOR FORCE
1.2%
UNEMPLOYMENT RATE
Grant City Zip Codes
Grant City Area Codes
Income in Grant City
Income Overview in Grant City
Per Capita Income in Grant City is $20,012, while median incomes of families and households are $49,375 and $36,429 respectively.
| Characteristic | Number | Measure |
| Per Capita Income | 1,004 | $20,012 |
| Median Family Income | 207 | $49,375 |
| Mean Family Income | 207 | $60,547 |
| Median Household Income | 352 | $36,429 |
| Mean Household Income | 352 | $48,950 |
| Income Deficit | 207 | $0 |
| Wage / Income Gap (%) | 1,004 | 64.00% |
| Wage / Income Gap ($) | 1,004 | 36.00¢ per $1 |
| Gini / Inequality Index | 1,004 | 0.43 |
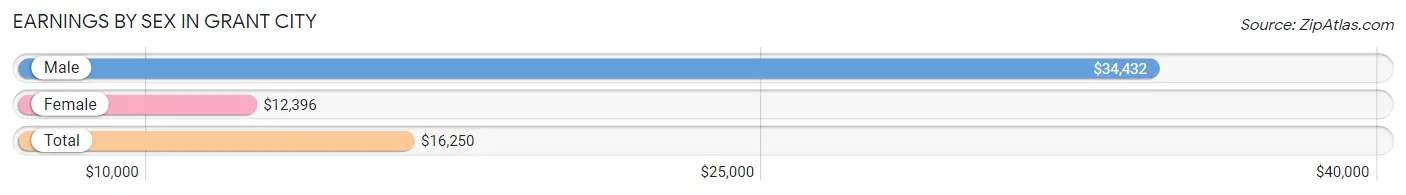
Earnings by Sex in Grant City
Average Earnings in Grant City are $16,250, $34,432 for men and $12,396 for women, a difference of 64.0%.
| Sex | Number | Average Earnings |
| Male | 239 (45.5%) | $34,432 |
| Female | 286 (54.5%) | $12,396 |
| Total | 525 (100.0%) | $16,250 |
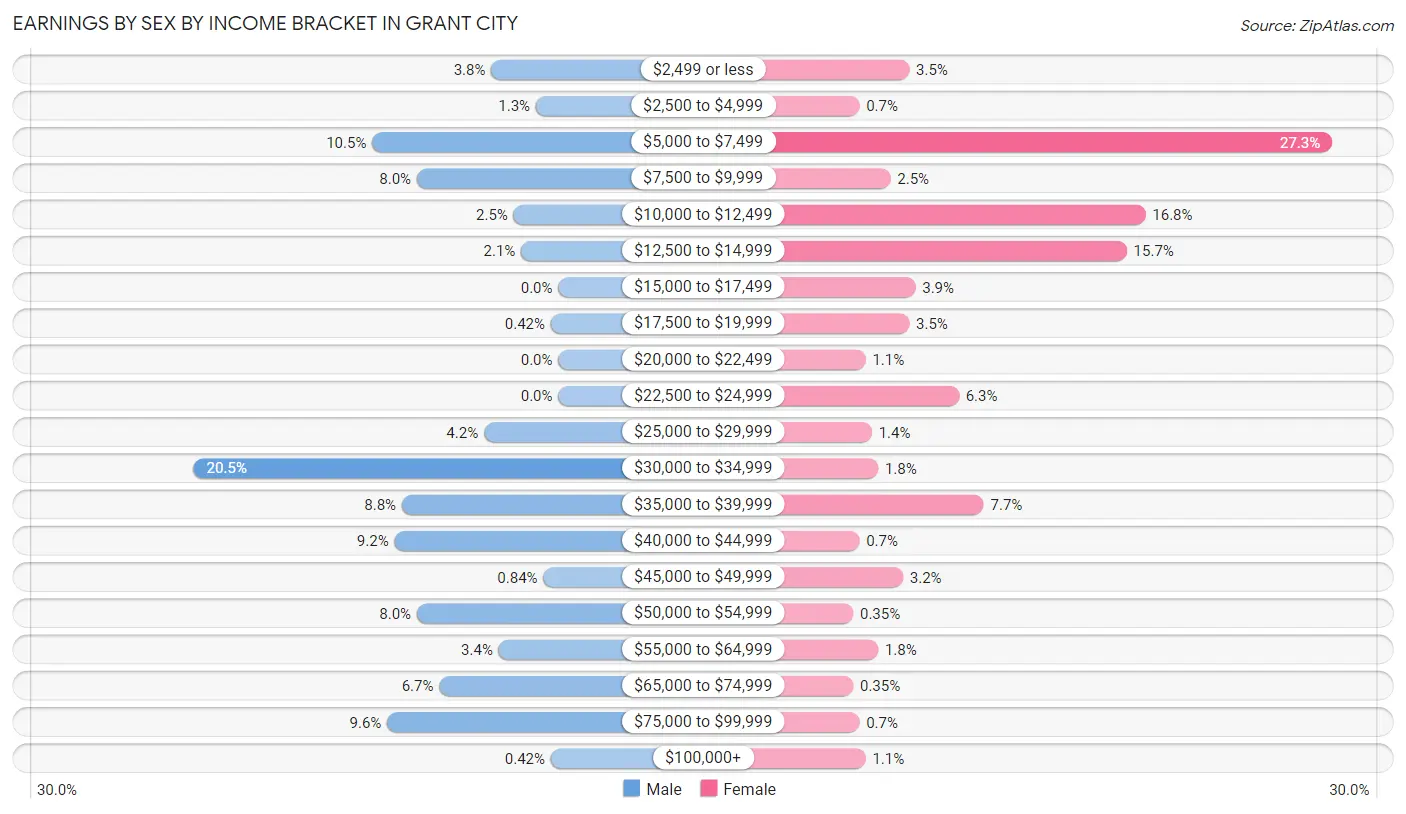
Earnings by Sex by Income Bracket in Grant City
The most common earnings brackets in Grant City are $30,000 to $34,999 for men (49 | 20.5%) and $5,000 to $7,499 for women (78 | 27.3%).
| Income | Male | Female |
| $2,499 or less | 9 (3.8%) | 10 (3.5%) |
| $2,500 to $4,999 | 3 (1.3%) | 2 (0.7%) |
| $5,000 to $7,499 | 25 (10.5%) | 78 (27.3%) |
| $7,500 to $9,999 | 19 (8.0%) | 7 (2.5%) |
| $10,000 to $12,499 | 6 (2.5%) | 48 (16.8%) |
| $12,500 to $14,999 | 5 (2.1%) | 45 (15.7%) |
| $15,000 to $17,499 | 0 (0.0%) | 11 (3.8%) |
| $17,500 to $19,999 | 1 (0.4%) | 10 (3.5%) |
| $20,000 to $22,499 | 0 (0.0%) | 3 (1.1%) |
| $22,500 to $24,999 | 0 (0.0%) | 18 (6.3%) |
| $25,000 to $29,999 | 10 (4.2%) | 4 (1.4%) |
| $30,000 to $34,999 | 49 (20.5%) | 5 (1.8%) |
| $35,000 to $39,999 | 21 (8.8%) | 22 (7.7%) |
| $40,000 to $44,999 | 22 (9.2%) | 2 (0.7%) |
| $45,000 to $49,999 | 2 (0.8%) | 9 (3.2%) |
| $50,000 to $54,999 | 19 (8.0%) | 1 (0.4%) |
| $55,000 to $64,999 | 8 (3.4%) | 5 (1.8%) |
| $65,000 to $74,999 | 16 (6.7%) | 1 (0.4%) |
| $75,000 to $99,999 | 23 (9.6%) | 2 (0.7%) |
| $100,000+ | 1 (0.4%) | 3 (1.1%) |
| Total | 239 (100.0%) | 286 (100.0%) |
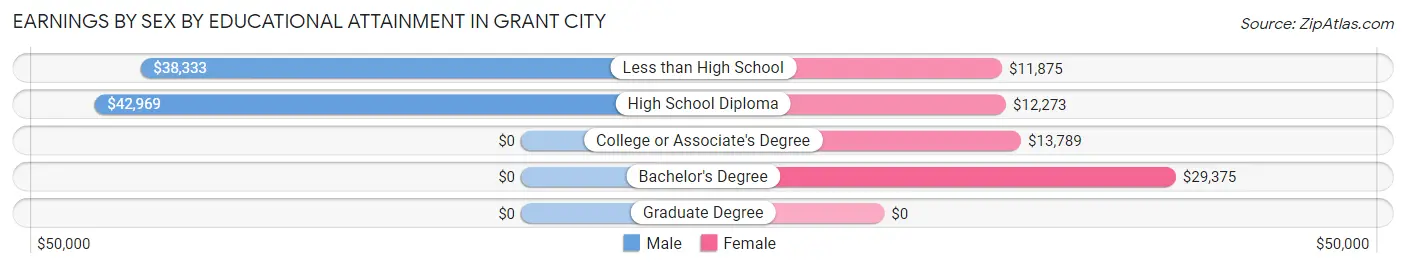
Earnings by Sex by Educational Attainment in Grant City
Average earnings in Grant City are $42,500 for men and $13,984 for women, a difference of 67.1%. Men with an educational attainment of high school diploma enjoy the highest average annual earnings of $42,969, while those with less than high school education earn the least with $38,333. Women with an educational attainment of bachelor's degree earn the most with the average annual earnings of $29,375, while those with less than high school education have the smallest earnings of $11,875.
| Educational Attainment | Male Income | Female Income |
| Less than High School | $38,333 | $11,875 |
| High School Diploma | $42,969 | $12,273 |
| College or Associate's Degree | - | - |
| Bachelor's Degree | - | - |
| Graduate Degree | - | - |
| Total | $42,500 | $13,984 |
Family Income in Grant City
Family Income Brackets in Grant City
According to the Grant City family income data, there are 42 families falling into the $15,000 to $24,999 income range, which is the most common income bracket and makes up 20.3% of all families.
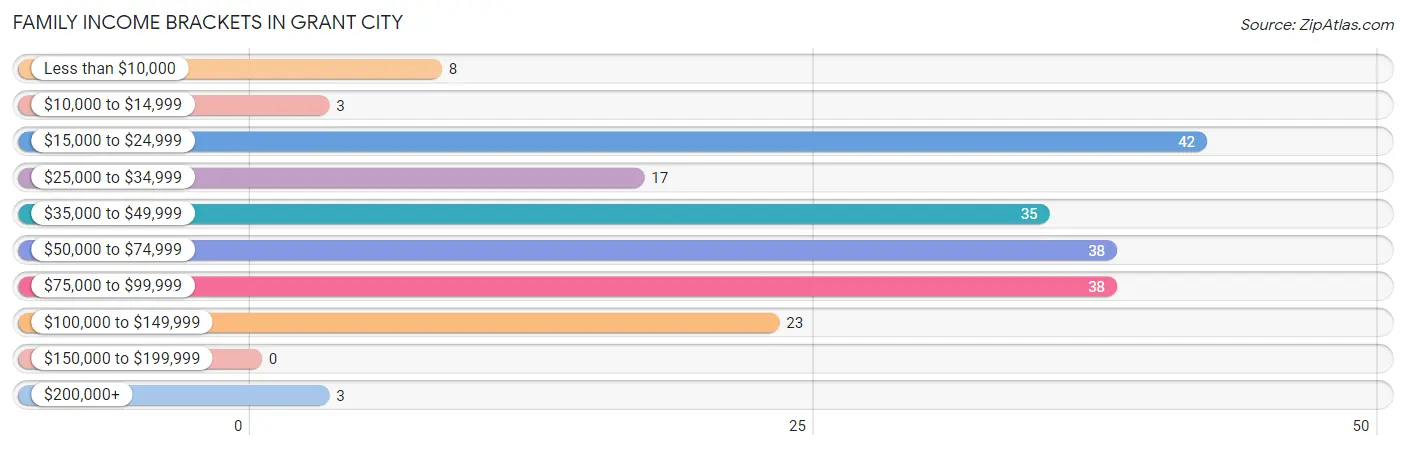
| Income Bracket | # Families | % Families |
| Less than $10,000 | 8 | 3.9% |
| $10,000 to $14,999 | 3 | 1.4% |
| $15,000 to $24,999 | 42 | 20.3% |
| $25,000 to $34,999 | 17 | 8.2% |
| $35,000 to $49,999 | 35 | 16.9% |
| $50,000 to $74,999 | 38 | 18.4% |
| $75,000 to $99,999 | 38 | 18.4% |
| $100,000 to $149,999 | 23 | 11.1% |
| $150,000 to $199,999 | 0 | 0.0% |
| $200,000+ | 3 | 1.4% |
Family Income by Famaliy Size in Grant City
3-person families (35 | 16.9%) account for the highest median family income in Grant City with $71,875 per family, while 2-person families (103 | 49.8%) have the highest median income of $32,292 per family member.
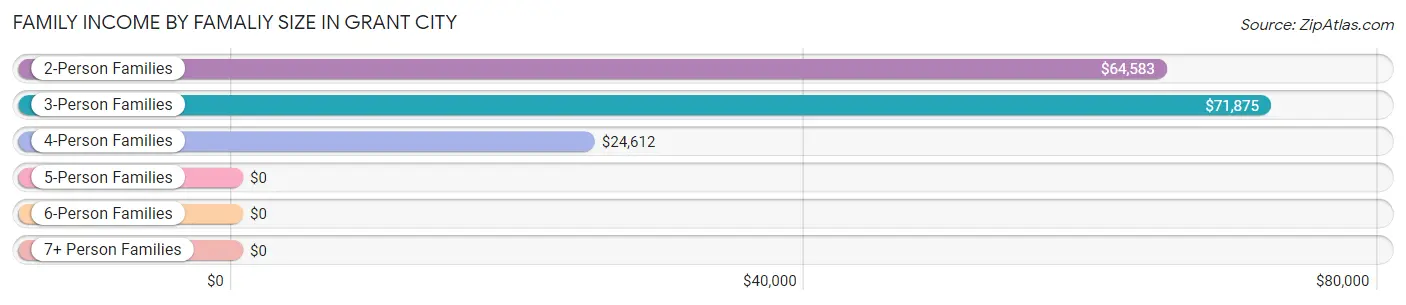
| Income Bracket | # Families | Median Income |
| 2-Person Families | 103 (49.8%) | $64,583 |
| 3-Person Families | 35 (16.9%) | $71,875 |
| 4-Person Families | 61 (29.5%) | $24,612 |
| 5-Person Families | 8 (3.9%) | $0 |
| 6-Person Families | 0 (0.0%) | $0 |
| 7+ Person Families | 0 (0.0%) | $0 |
| Total | 207 (100.0%) | $49,375 |
Family Income by Number of Earners in Grant City
The median family income in Grant City is $49,375, with families comprising 3+ earners (22) having the highest median family income of $91,667, while families with 1 earner (75) have the lowest median family income of $24,718, accounting for 10.6% and 36.2% of families, respectively.
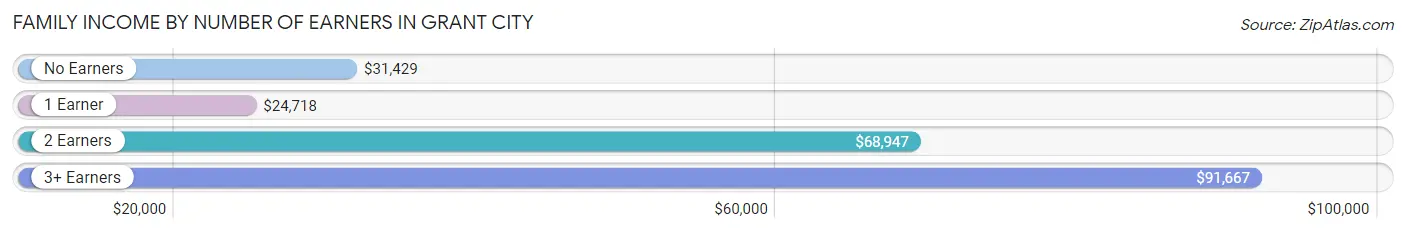
| Number of Earners | # Families | Median Income |
| No Earners | 32 (15.5%) | $31,429 |
| 1 Earner | 75 (36.2%) | $24,718 |
| 2 Earners | 78 (37.7%) | $68,947 |
| 3+ Earners | 22 (10.6%) | $91,667 |
| Total | 207 (100.0%) | $49,375 |
Household Income in Grant City
Household Income Brackets in Grant City
With 60 households falling in the category, the $15,000 to $24,999 income range is the most frequent in Grant City, accounting for 17.1% of all households.
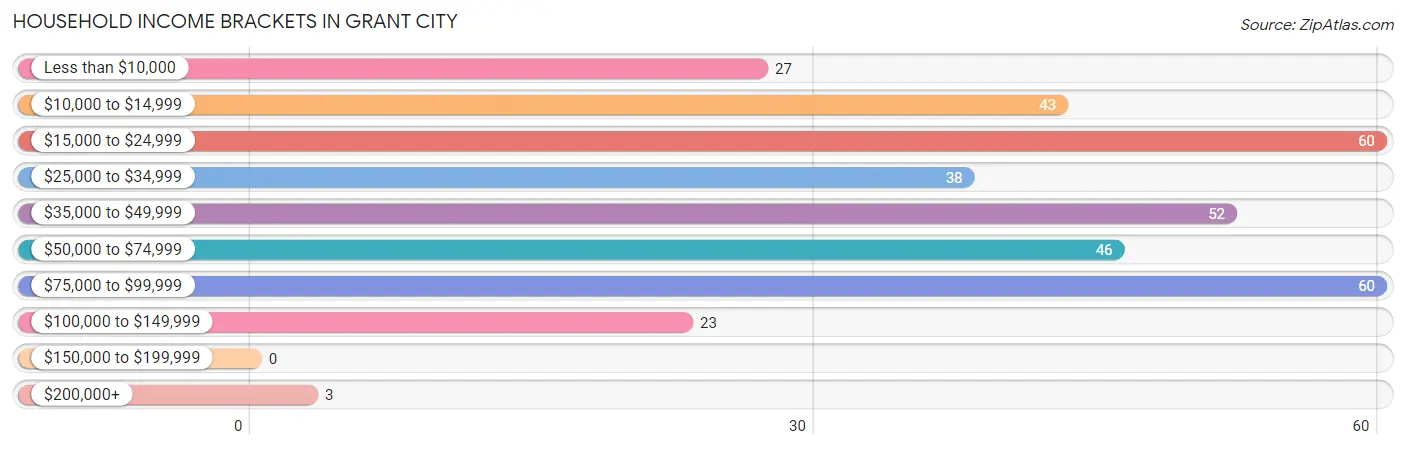
| Income Bracket | # Households | % Households |
| Less than $10,000 | 27 | 7.7% |
| $10,000 to $14,999 | 43 | 12.2% |
| $15,000 to $24,999 | 60 | 17.0% |
| $25,000 to $34,999 | 38 | 10.8% |
| $35,000 to $49,999 | 52 | 14.8% |
| $50,000 to $74,999 | 46 | 13.1% |
| $75,000 to $99,999 | 60 | 17.0% |
| $100,000 to $149,999 | 23 | 6.5% |
| $150,000 to $199,999 | 0 | 0.0% |
| $200,000+ | 3 | 0.9% |
Household Income by Householder Age in Grant City
The median household income in Grant City is $36,429, with the highest median household income of $42,875 found in the 25 to 44 years age bracket for the primary householder. A total of 122 households (34.7%) fall into this category. Meanwhile, the 15 to 24 years age bracket for the primary householder has the lowest median household income of $0, with 1 households (0.3%) in this group.
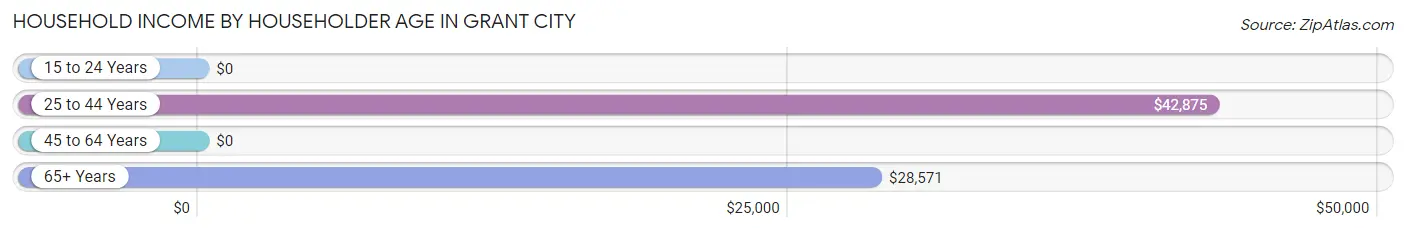
| Income Bracket | # Households | Median Income |
| 15 to 24 Years | 1 (0.3%) | $0 |
| 25 to 44 Years | 122 (34.7%) | $42,875 |
| 45 to 64 Years | 127 (36.1%) | $0 |
| 65+ Years | 102 (29.0%) | $28,571 |
| Total | 352 (100.0%) | $36,429 |
Poverty in Grant City
Income Below Poverty by Sex and Age in Grant City
With 23.8% poverty level for males and 33.5% for females among the residents of Grant City, 5 year old males and 5 year old females are the most vulnerable to poverty, with 1 males (100.0%) and 9 females (100.0%) in their respective age groups living below the poverty level.
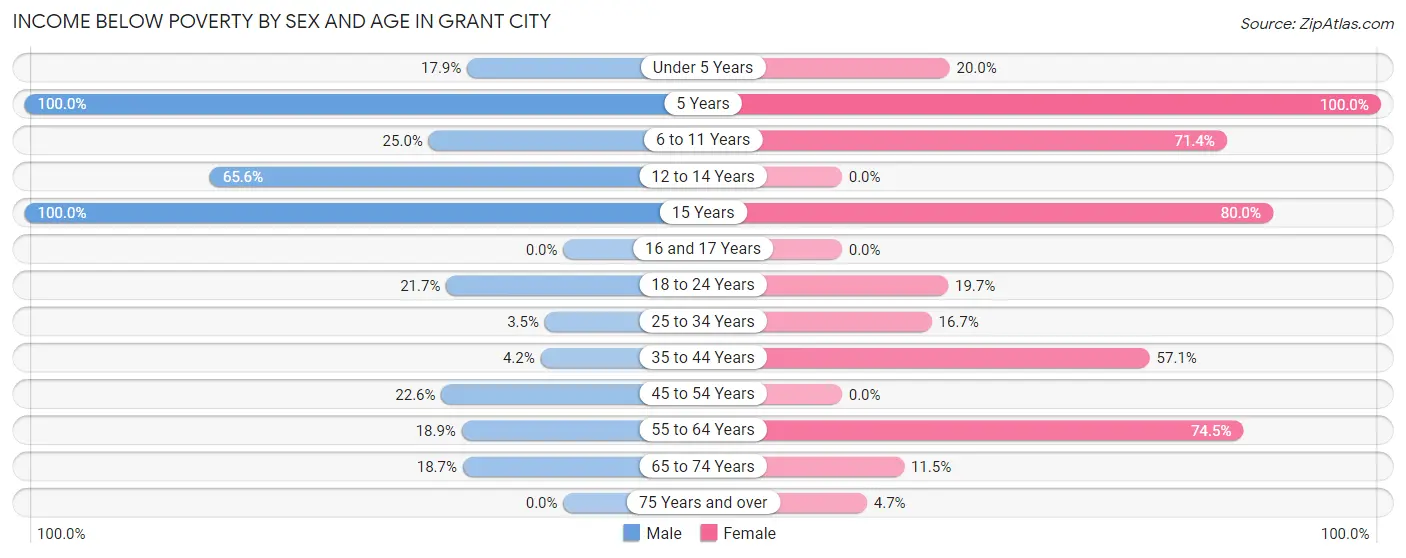
| Age Bracket | Male | Female |
| Under 5 Years | 5 (17.9%) | 7 (20.0%) |
| 5 Years | 1 (100.0%) | 9 (100.0%) |
| 6 to 11 Years | 3 (25.0%) | 40 (71.4%) |
| 12 to 14 Years | 21 (65.6%) | 0 (0.0%) |
| 15 Years | 26 (100.0%) | 8 (80.0%) |
| 16 and 17 Years | 0 (0.0%) | 0 (0.0%) |
| 18 to 24 Years | 15 (21.7%) | 14 (19.7%) |
| 25 to 34 Years | 1 (3.5%) | 9 (16.7%) |
| 35 to 44 Years | 3 (4.2%) | 36 (57.1%) |
| 45 to 54 Years | 12 (22.6%) | 0 (0.0%) |
| 55 to 64 Years | 10 (18.9%) | 38 (74.5%) |
| 65 to 74 Years | 14 (18.7%) | 6 (11.5%) |
| 75 Years and over | 0 (0.0%) | 2 (4.6%) |
| Total | 111 (23.8%) | 169 (33.5%) |
Income Above Poverty by Sex and Age in Grant City
According to the poverty statistics in Grant City, males aged 16 and 17 years and females aged 12 to 14 years are the age groups that are most secure financially, with 100.0% of males and 100.0% of females in these age groups living above the poverty line.
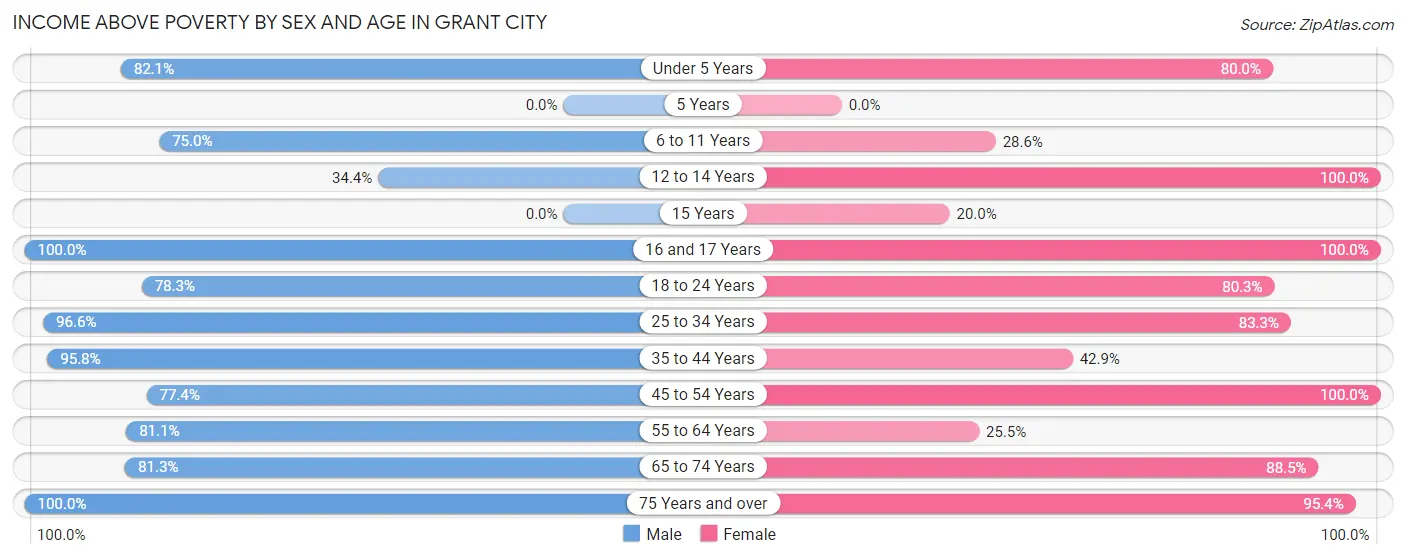
| Age Bracket | Male | Female |
| Under 5 Years | 23 (82.1%) | 28 (80.0%) |
| 5 Years | 0 (0.0%) | 0 (0.0%) |
| 6 to 11 Years | 9 (75.0%) | 16 (28.6%) |
| 12 to 14 Years | 11 (34.4%) | 9 (100.0%) |
| 15 Years | 0 (0.0%) | 2 (20.0%) |
| 16 and 17 Years | 1 (100.0%) | 1 (100.0%) |
| 18 to 24 Years | 54 (78.3%) | 57 (80.3%) |
| 25 to 34 Years | 28 (96.6%) | 45 (83.3%) |
| 35 to 44 Years | 68 (95.8%) | 27 (42.9%) |
| 45 to 54 Years | 41 (77.4%) | 50 (100.0%) |
| 55 to 64 Years | 43 (81.1%) | 13 (25.5%) |
| 65 to 74 Years | 61 (81.3%) | 46 (88.5%) |
| 75 Years and over | 17 (100.0%) | 41 (95.4%) |
| Total | 356 (76.2%) | 335 (66.5%) |
Income Below Poverty Among Married-Couple Families in Grant City
The poverty statistics for married-couple families in Grant City show that 5.4% or 7 of the total 129 families live below the poverty line. Families with 1 or 2 children have the highest poverty rate of 28.0%, comprising of 7 families. On the other hand, families with no children have the lowest poverty rate of 0.0%, which includes 0 families.
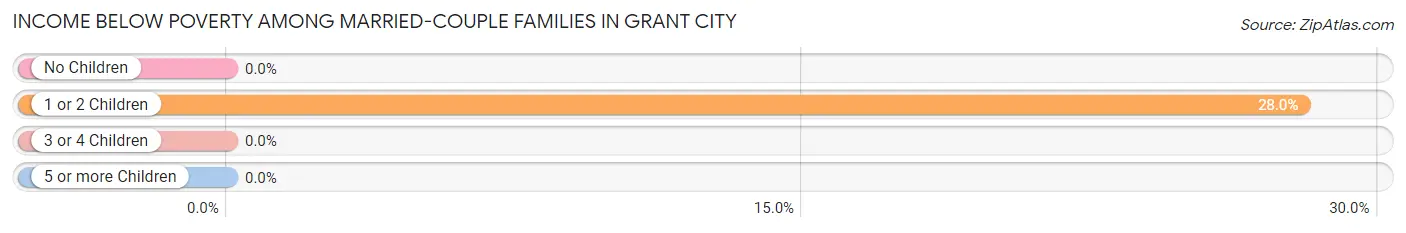
| Children | Above Poverty | Below Poverty |
| No Children | 101 (100.0%) | 0 (0.0%) |
| 1 or 2 Children | 18 (72.0%) | 7 (28.0%) |
| 3 or 4 Children | 3 (100.0%) | 0 (0.0%) |
| 5 or more Children | 0 (0.0%) | 0 (0.0%) |
| Total | 122 (94.6%) | 7 (5.4%) |
Income Below Poverty Among Single-Parent Households in Grant City
According to the poverty data in Grant City, 3.6% or 1 single-father households and 70.0% or 35 single-mother households are living below the poverty line. Among single-father households, those with 1 or 2 children have the highest poverty rate, with 1 households (3.7%) experiencing poverty. Likewise, among single-mother households, those with 3 or 4 children have the highest poverty rate, with 32 households (100.0%) falling below the poverty line.
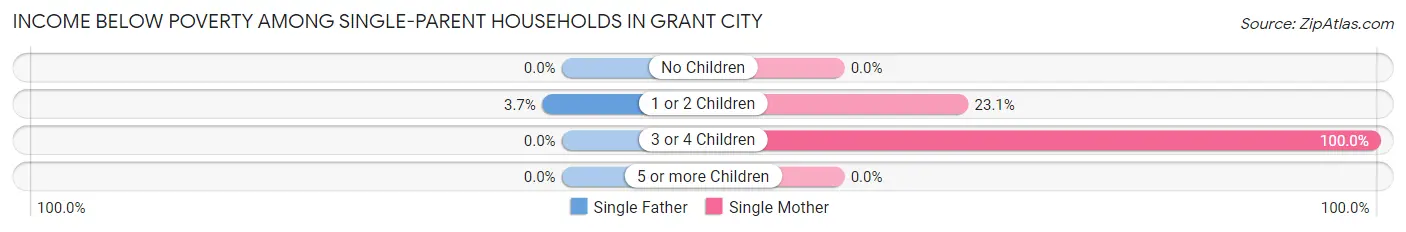
| Children | Single Father | Single Mother |
| No Children | 0 (0.0%) | 0 (0.0%) |
| 1 or 2 Children | 1 (3.7%) | 3 (23.1%) |
| 3 or 4 Children | 0 (0.0%) | 32 (100.0%) |
| 5 or more Children | 0 (0.0%) | 0 (0.0%) |
| Total | 1 (3.6%) | 35 (70.0%) |
Income Below Poverty Among Married-Couple vs Single-Parent Households in Grant City
The poverty data for Grant City shows that 7 of the married-couple family households (5.4%) and 36 of the single-parent households (46.2%) are living below the poverty level. Within the married-couple family households, those with 1 or 2 children have the highest poverty rate, with 7 households (28.0%) falling below the poverty line. Among the single-parent households, those with 3 or 4 children have the highest poverty rate, with 32 household (100.0%) living below poverty.
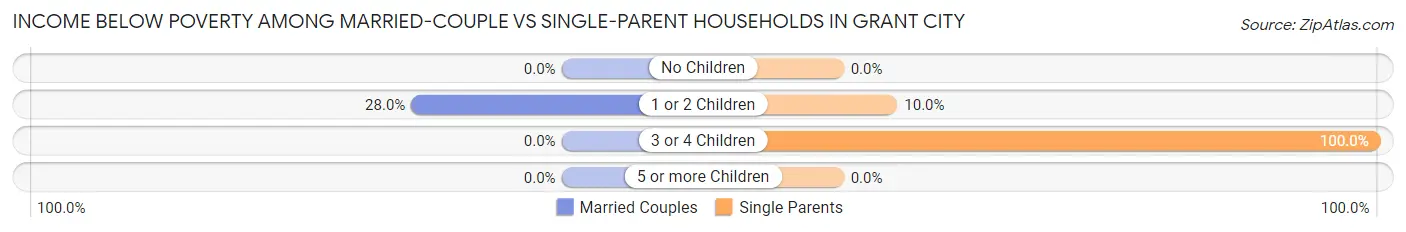
| Children | Married-Couple Families | Single-Parent Households |
| No Children | 0 (0.0%) | 0 (0.0%) |
| 1 or 2 Children | 7 (28.0%) | 4 (10.0%) |
| 3 or 4 Children | 0 (0.0%) | 32 (100.0%) |
| 5 or more Children | 0 (0.0%) | 0 (0.0%) |
| Total | 7 (5.4%) | 36 (46.2%) |
Race in Grant City
The most populous races in Grant City are White / Caucasian (957 | 95.3%), Two or more Races (43 | 4.3%), and Hispanic or Latino (15 | 1.5%).
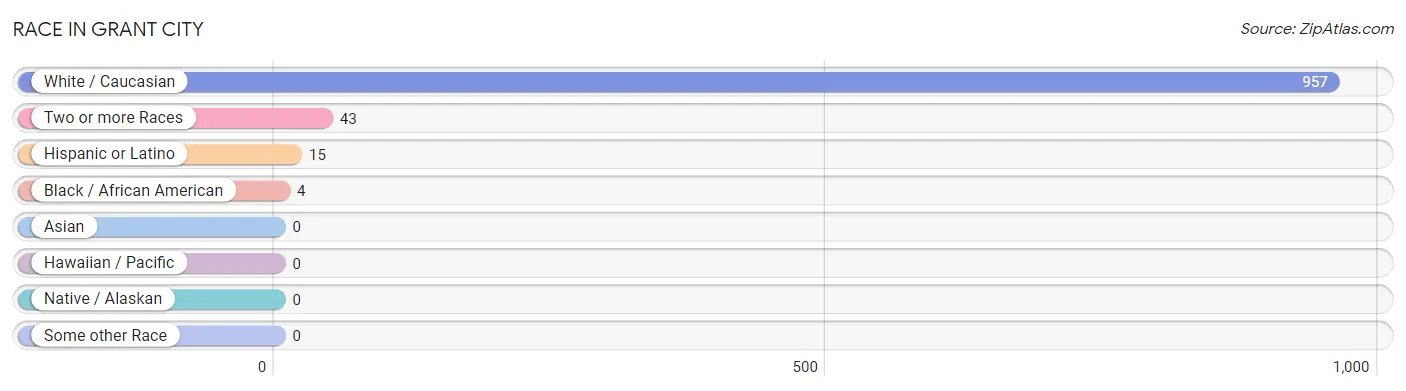
| Race | # Population | % Population |
| Asian | 0 | 0.0% |
| Black / African American | 4 | 0.4% |
| Hawaiian / Pacific | 0 | 0.0% |
| Hispanic or Latino | 15 | 1.5% |
| Native / Alaskan | 0 | 0.0% |
| White / Caucasian | 957 | 95.3% |
| Two or more Races | 43 | 4.3% |
| Some other Race | 0 | 0.0% |
| Total | 1,004 | 100.0% |
Ancestry in Grant City
The most populous ancestries reported in Grant City are American (170 | 16.9%), French (106 | 10.6%), English (102 | 10.2%), German (96 | 9.6%), and Irish (84 | 8.4%), together accounting for 55.6% of all Grant City residents.
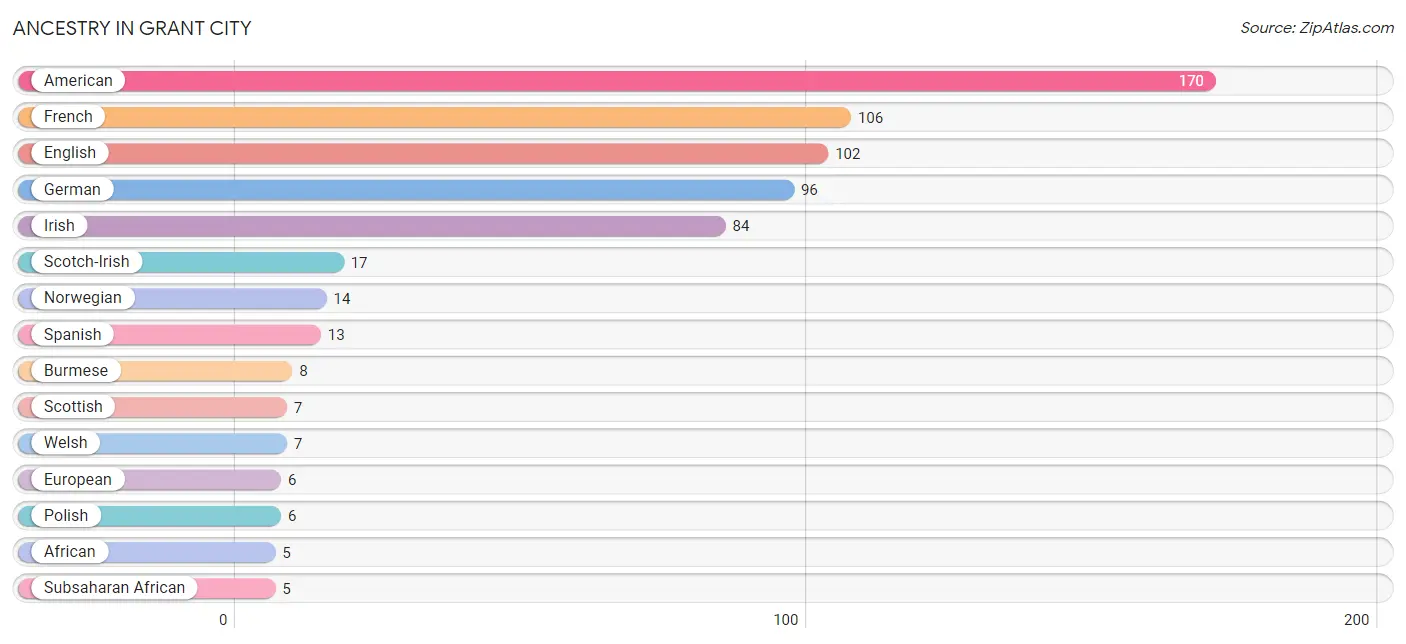
| Ancestry | # Population | % Population |
| African | 5 | 0.5% |
| American | 170 | 16.9% |
| Austrian | 4 | 0.4% |
| British | 2 | 0.2% |
| Burmese | 8 | 0.8% |
| Central American | 1 | 0.1% |
| Cherokee | 1 | 0.1% |
| Croatian | 2 | 0.2% |
| Danish | 1 | 0.1% |
| Dutch | 3 | 0.3% |
| Eastern European | 3 | 0.3% |
| English | 102 | 10.2% |
| European | 6 | 0.6% |
| French | 106 | 10.6% |
| German | 96 | 9.6% |
| Greek | 1 | 0.1% |
| Irish | 84 | 8.4% |
| Mexican | 1 | 0.1% |
| Norwegian | 14 | 1.4% |
| Panamanian | 1 | 0.1% |
| Polish | 6 | 0.6% |
| Portuguese | 3 | 0.3% |
| Russian | 3 | 0.3% |
| Scotch-Irish | 17 | 1.7% |
| Scottish | 7 | 0.7% |
| Spanish | 13 | 1.3% |
| Subsaharan African | 5 | 0.5% |
| Swedish | 4 | 0.4% |
| Swiss | 4 | 0.4% |
| Welsh | 7 | 0.7% | View All 30 Rows |
Immigrants in Grant City
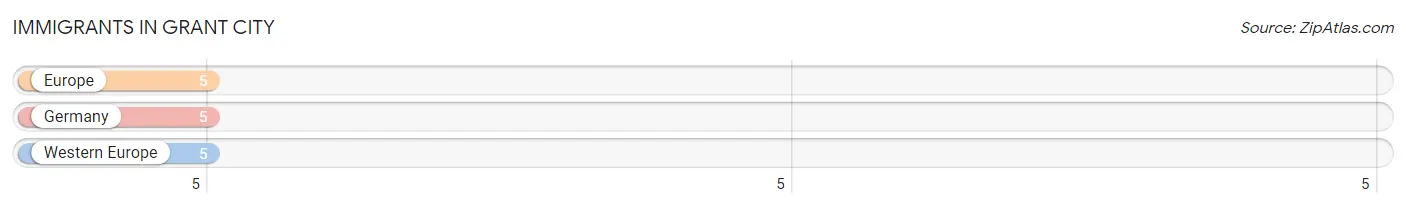
The most numerous immigrant groups reported in Grant City came from Europe (5 | 0.5%), Germany (5 | 0.5%), and Western Europe (5 | 0.5%), together accounting for 1.5% of all Grant City residents.
| Immigration Origin | # Population | % Population |
| Europe | 5 | 0.5% |
| Germany | 5 | 0.5% |
| Western Europe | 5 | 0.5% | View All 3 Rows |
Sex and Age in Grant City
Sex and Age in Grant City
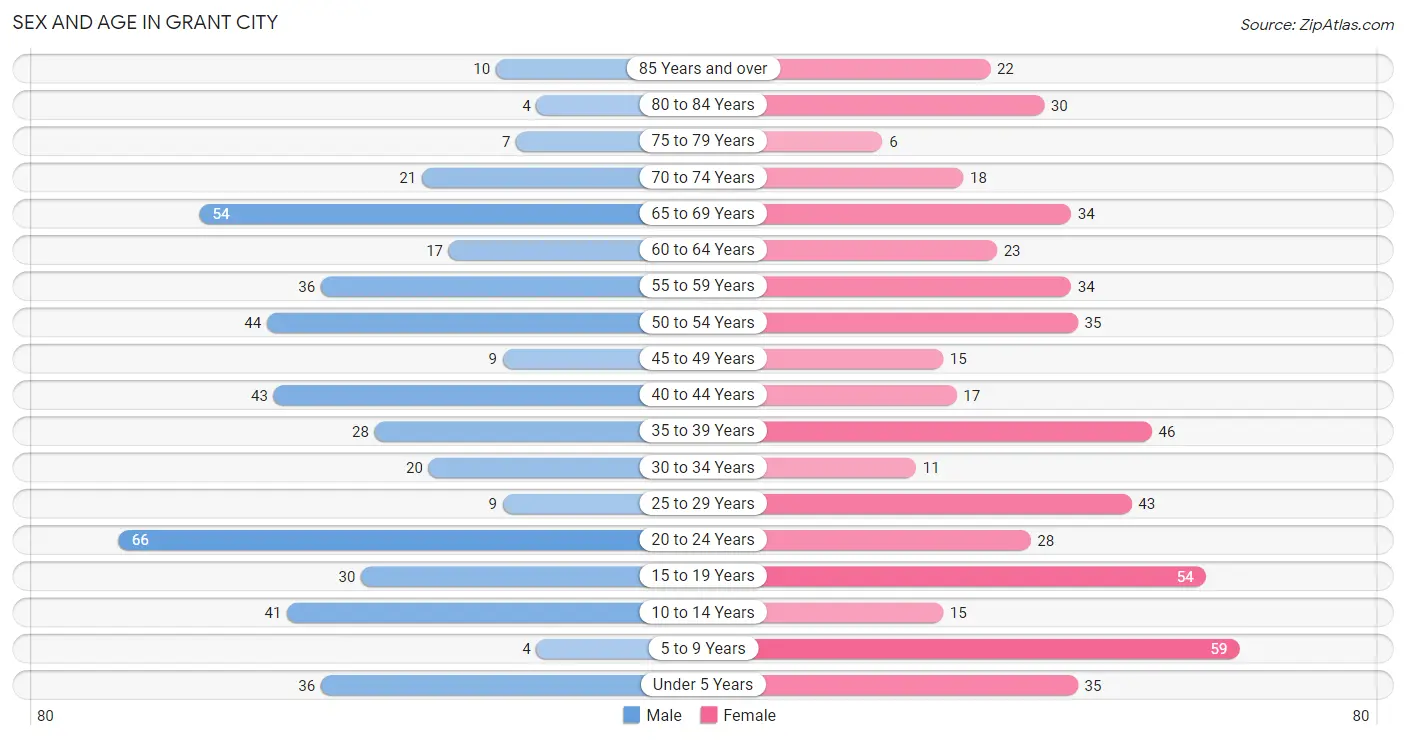
The most populous age groups in Grant City are 20 to 24 Years (66 | 13.8%) for men and 5 to 9 Years (59 | 11.2%) for women.
| Age Bracket | Male | Female |
| Under 5 Years | 36 (7.5%) | 35 (6.7%) |
| 5 to 9 Years | 4 (0.8%) | 59 (11.2%) |
| 10 to 14 Years | 41 (8.6%) | 15 (2.9%) |
| 15 to 19 Years | 30 (6.3%) | 54 (10.3%) |
| 20 to 24 Years | 66 (13.8%) | 28 (5.3%) |
| 25 to 29 Years | 9 (1.9%) | 43 (8.2%) |
| 30 to 34 Years | 20 (4.2%) | 11 (2.1%) |
| 35 to 39 Years | 28 (5.9%) | 46 (8.8%) |
| 40 to 44 Years | 43 (9.0%) | 17 (3.2%) |
| 45 to 49 Years | 9 (1.9%) | 15 (2.9%) |
| 50 to 54 Years | 44 (9.2%) | 35 (6.7%) |
| 55 to 59 Years | 36 (7.5%) | 34 (6.5%) |
| 60 to 64 Years | 17 (3.5%) | 23 (4.4%) |
| 65 to 69 Years | 54 (11.3%) | 34 (6.5%) |
| 70 to 74 Years | 21 (4.4%) | 18 (3.4%) |
| 75 to 79 Years | 7 (1.5%) | 6 (1.1%) |
| 80 to 84 Years | 4 (0.8%) | 30 (5.7%) |
| 85 Years and over | 10 (2.1%) | 22 (4.2%) |
| Total | 479 (100.0%) | 525 (100.0%) |
Families and Households in Grant City
Median Family Size in Grant City
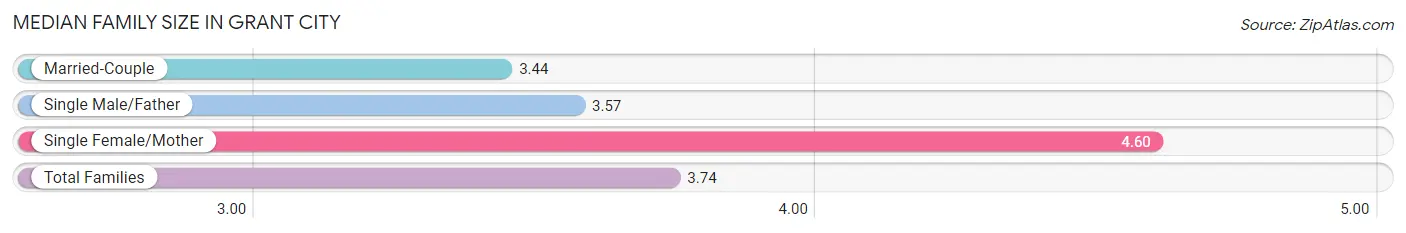
The median family size in Grant City is 3.74 persons per family, with single female/mother families (50 | 24.1%) accounting for the largest median family size of 4.6 persons per family. On the other hand, married-couple families (129 | 62.3%) represent the smallest median family size with 3.44 persons per family.
| Family Type | # Families | Family Size |
| Married-Couple | 129 (62.3%) | 3.44 |
| Single Male/Father | 28 (13.5%) | 3.57 |
| Single Female/Mother | 50 (24.1%) | 4.60 |
| Total Families | 207 (100.0%) | 3.74 |
Median Household Size in Grant City
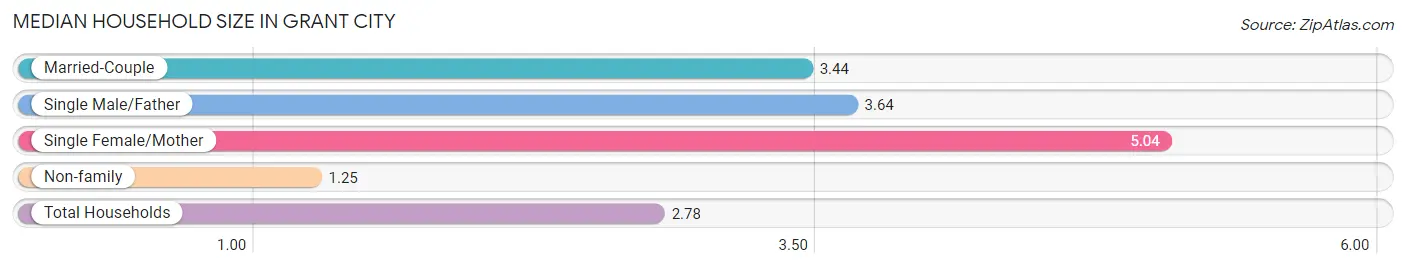
The median household size in Grant City is 2.78 persons per household, with single female/mother households (50 | 14.2%) accounting for the largest median household size of 5.04 persons per household. non-family households (145 | 41.2%) represent the smallest median household size with 1.25 persons per household.
| Household Type | # Households | Household Size |
| Married-Couple | 129 (36.6%) | 3.44 |
| Single Male/Father | 28 (8.0%) | 3.64 |
| Single Female/Mother | 50 (14.2%) | 5.04 |
| Non-family | 145 (41.2%) | 1.25 |
| Total Households | 352 (100.0%) | 2.78 |
Household Size by Marriage Status in Grant City
Out of a total of 352 households in Grant City, 207 (58.8%) are family households, while 145 (41.2%) are nonfamily households. The most numerous type of family households are 2-person households, comprising 95, and the most common type of nonfamily households are 1-person households, comprising 138.
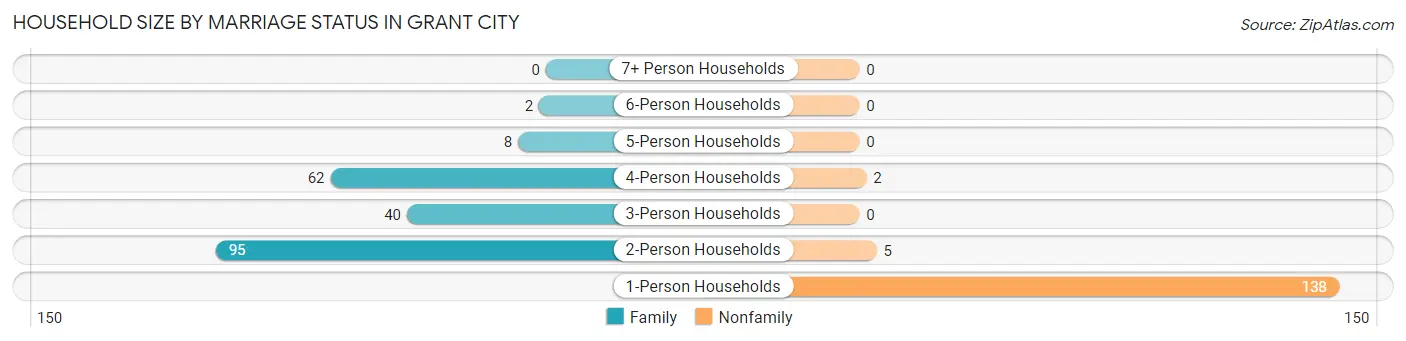
| Household Size | Family Households | Nonfamily Households |
| 1-Person Households | - | 138 (39.2%) |
| 2-Person Households | 95 (27.0%) | 5 (1.4%) |
| 3-Person Households | 40 (11.4%) | 0 (0.0%) |
| 4-Person Households | 62 (17.6%) | 2 (0.6%) |
| 5-Person Households | 8 (2.3%) | 0 (0.0%) |
| 6-Person Households | 2 (0.6%) | 0 (0.0%) |
| 7+ Person Households | 0 (0.0%) | 0 (0.0%) |
| Total | 207 (58.8%) | 145 (41.2%) |
Female Fertility in Grant City
Fertility by Age in Grant City
Average fertility rate in Grant City is 136.0 births per 1,000 women. Women in the age bracket of 20 to 34 years have the highest fertility rate with 366.0 births per 1,000 women. Women in the age bracket of 20 to 34 years acount for 100.0% of all women with births.
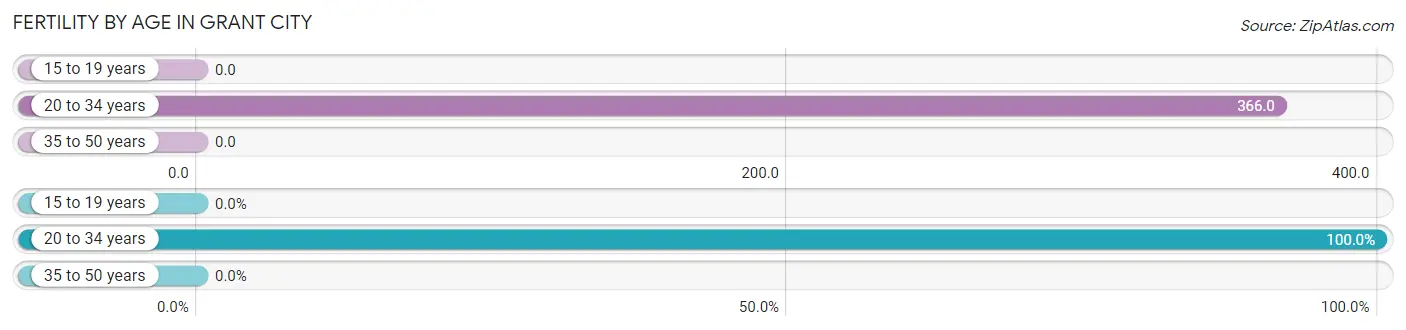
| Age Bracket | Women with Births | Births / 1,000 Women |
| 15 to 19 years | 0 (0.0%) | 0.0 |
| 20 to 34 years | 30 (100.0%) | 366.0 |
| 35 to 50 years | 0 (0.0%) | 0.0 |
| Total | 30 (100.0%) | 136.0 |
Fertility by Age by Marriage Status in Grant City
16.7% of women with births (30) in Grant City are married. The highest percentage of unmarried women with births falls into 20 to 34 years age bracket with 83.3% of them unmarried at the time of birth, while the lowest percentage of unmarried women with births belong to 20 to 34 years age bracket with 83.3% of them unmarried.
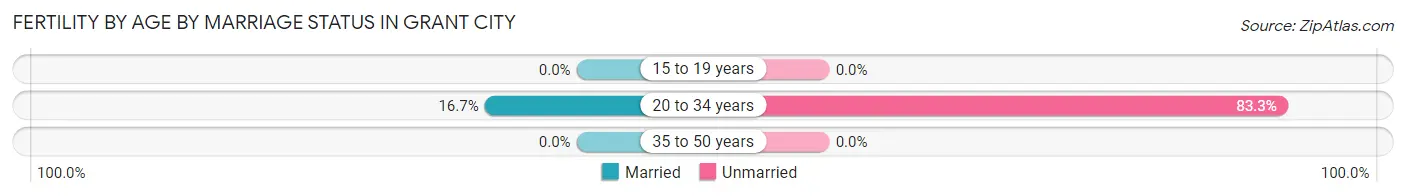
| Age Bracket | Married | Unmarried |
| 15 to 19 years | 0 (0.0%) | 0 (0.0%) |
| 20 to 34 years | 5 (16.7%) | 25 (83.3%) |
| 35 to 50 years | 0 (0.0%) | 0 (0.0%) |
| Total | 5 (16.7%) | 25 (83.3%) |
Fertility by Education in Grant City
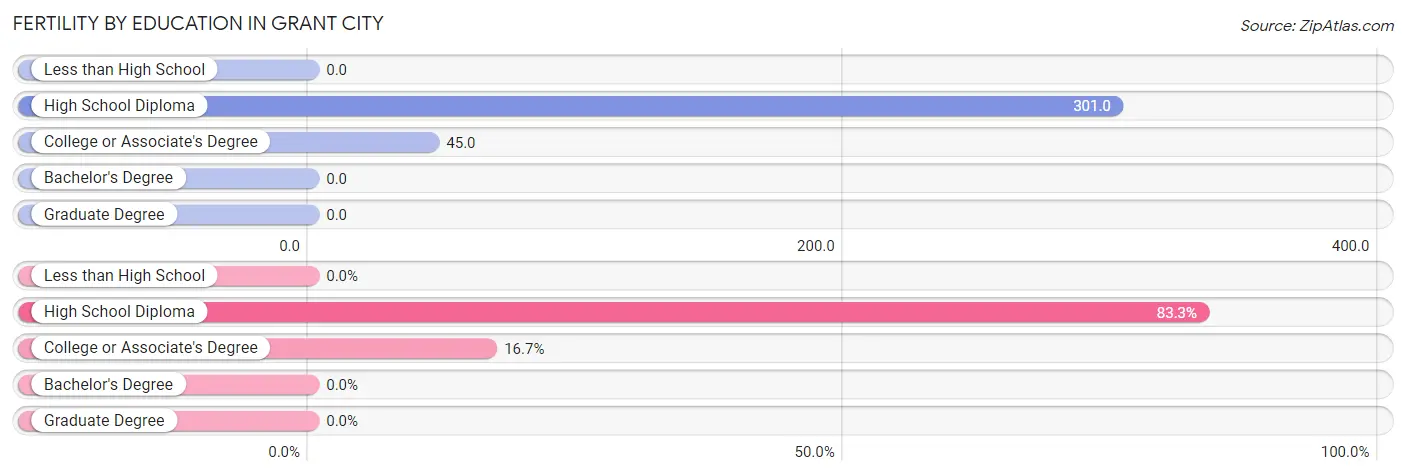
| Educational Attainment | Women with Births | Births / 1,000 Women |
| Less than High School | 0 (0.0%) | 0.0 |
| High School Diploma | 25 (83.3%) | 301.0 |
| College or Associate's Degree | 5 (16.7%) | 45.0 |
| Bachelor's Degree | 0 (0.0%) | 0.0 |
| Graduate Degree | 0 (0.0%) | 0.0 |
| Total | 30 (100.0%) | 136.0 |
Fertility by Education by Marriage Status in Grant City
83.3% of women with births in Grant City are unmarried. Women with the educational attainment of college or associate's degree are most likely to be married with 100.0% of them married at childbirth, while women with the educational attainment of high school diploma are least likely to be married with 100.0% of them unmarried at childbirth.
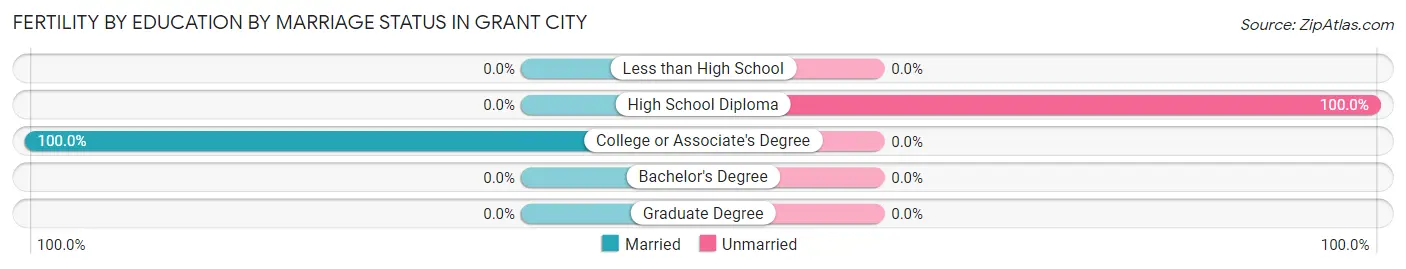
| Educational Attainment | Married | Unmarried |
| Less than High School | 0 (0.0%) | 0 (0.0%) |
| High School Diploma | 0 (0.0%) | 25 (100.0%) |
| College or Associate's Degree | 5 (100.0%) | 0 (0.0%) |
| Bachelor's Degree | 0 (0.0%) | 0 (0.0%) |
| Graduate Degree | 0 (0.0%) | 0 (0.0%) |
| Total | 5 (16.7%) | 25 (83.3%) |
Employment Characteristics in Grant City
Employment by Class of Employer in Grant City
Among the 475 employed individuals in Grant City, private company employees (289 | 60.8%), self-employed (not incorporated) (52 | 11.0%), and state government employees (38 | 8.0%) make up the most common classes of employment.
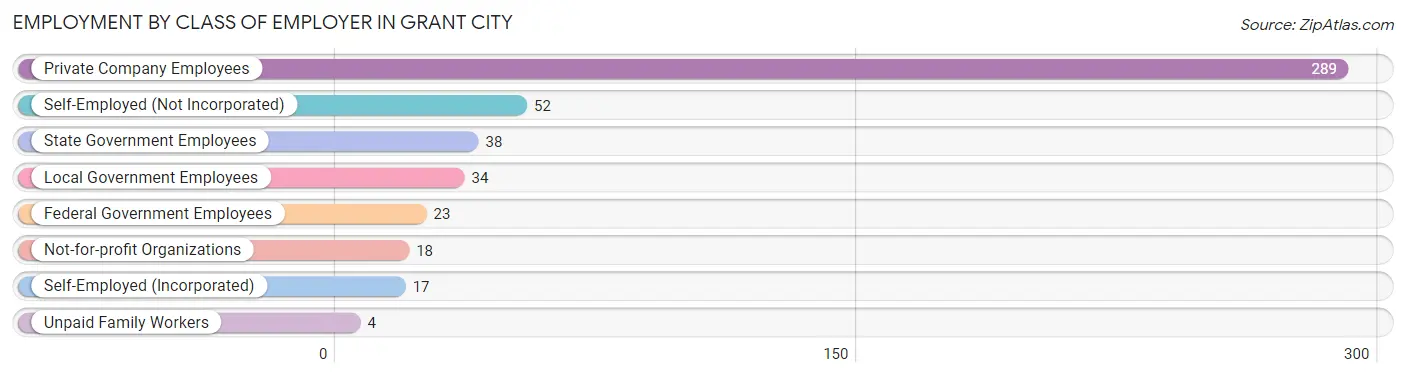
| Employer Class | # Employees | % Employees |
| Private Company Employees | 289 | 60.8% |
| Self-Employed (Incorporated) | 17 | 3.6% |
| Self-Employed (Not Incorporated) | 52 | 11.0% |
| Not-for-profit Organizations | 18 | 3.8% |
| Local Government Employees | 34 | 7.2% |
| State Government Employees | 38 | 8.0% |
| Federal Government Employees | 23 | 4.8% |
| Unpaid Family Workers | 4 | 0.8% |
| Total | 475 | 100.0% |
Employment Status by Age in Grant City
According to the labor force statistics for Grant City, out of the total population over 16 years of age (778), 65.8% or 512 individuals are in the labor force, with 1.2% or 6 of them unemployed. The age group with the highest labor force participation rate is 30 to 34 years, with 100.0% or 31 individuals in the labor force. Within the labor force, the 20 to 24 years age range has the highest percentage of unemployed individuals, with 5.4% or 5 of them being unemployed.
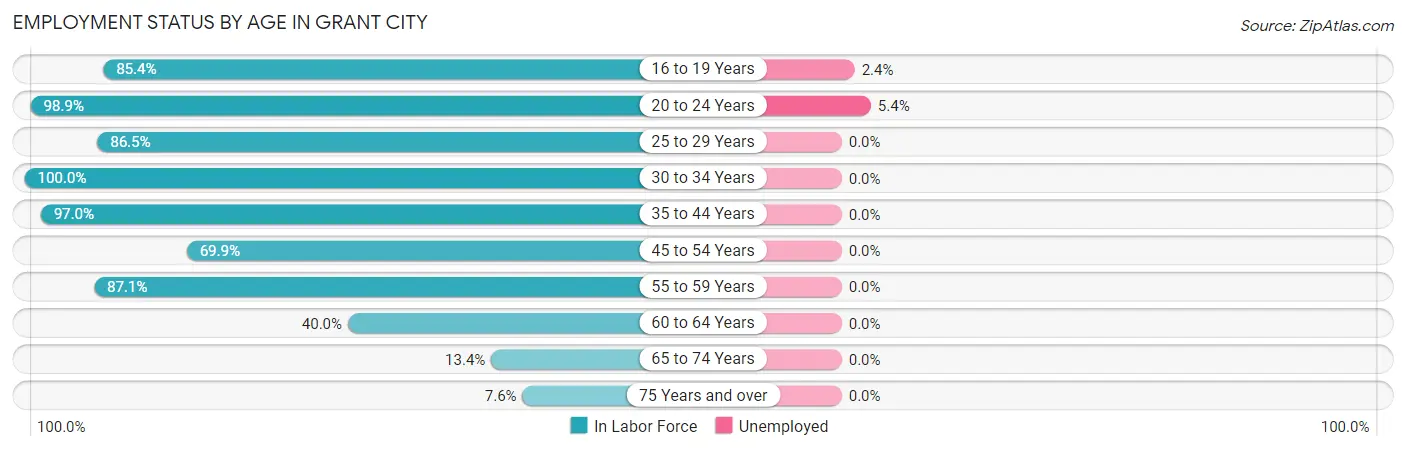
| Age Bracket | In Labor Force | Unemployed |
| 16 to 19 Years | 41 (85.4%) | 1 (2.4%) |
| 20 to 24 Years | 93 (98.9%) | 5 (5.4%) |
| 25 to 29 Years | 45 (86.5%) | 0 (0.0%) |
| 30 to 34 Years | 31 (100.0%) | 0 (0.0%) |
| 35 to 44 Years | 130 (97.0%) | 0 (0.0%) |
| 45 to 54 Years | 72 (69.9%) | 0 (0.0%) |
| 55 to 59 Years | 61 (87.1%) | 0 (0.0%) |
| 60 to 64 Years | 16 (40.0%) | 0 (0.0%) |
| 65 to 74 Years | 17 (13.4%) | 0 (0.0%) |
| 75 Years and over | 6 (7.6%) | 0 (0.0%) |
| Total | 512 (65.8%) | 6 (1.2%) |
Employment Status by Educational Attainment in Grant City
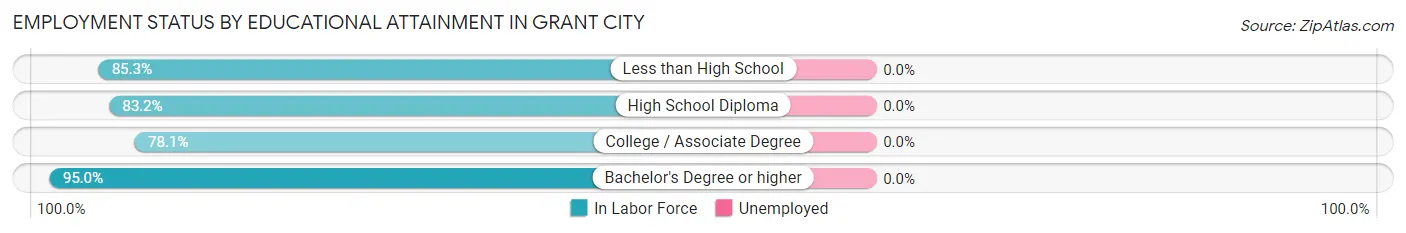
| Educational Attainment | In Labor Force | Unemployed |
| Less than High School | 29 (85.3%) | 0 (0.0%) |
| High School Diploma | 218 (83.2%) | 0 (0.0%) |
| College / Associate Degree | 89 (78.1%) | 0 (0.0%) |
| Bachelor's Degree or higher | 19 (95.0%) | 0 (0.0%) |
| Total | 355 (82.6%) | 0 (0.0%) |
Employment Occupations by Sex in Grant City
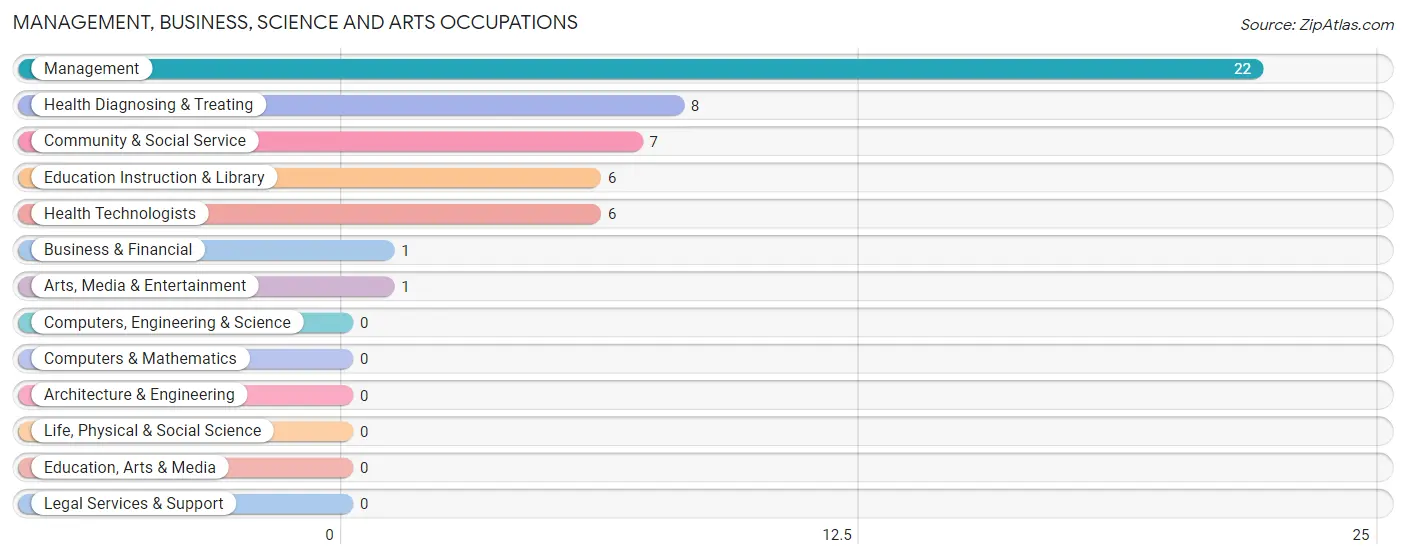
Management, Business, Science and Arts Occupations
The most common Management, Business, Science and Arts occupations in Grant City are Management (22 | 4.3%), Health Diagnosing & Treating (8 | 1.6%), Community & Social Service (7 | 1.4%), Education Instruction & Library (6 | 1.2%), and Health Technologists (6 | 1.2%).
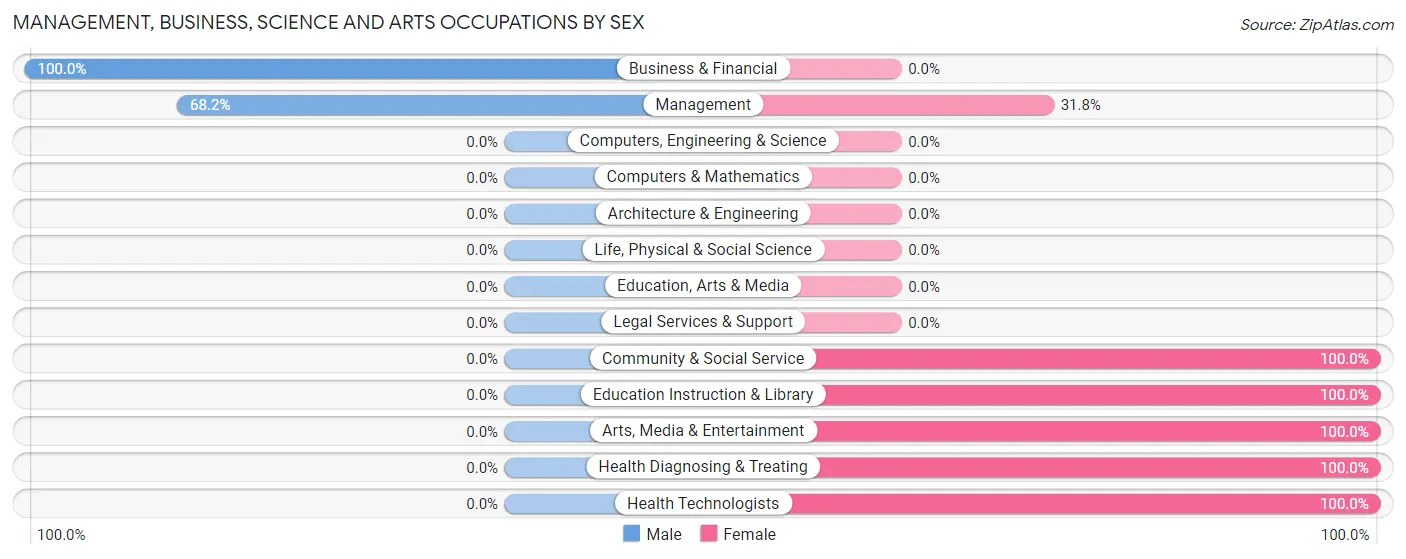
Management, Business, Science and Arts Occupations by Sex
Within the Management, Business, Science and Arts occupations in Grant City, the most male-oriented occupations are Business & Financial (100.0%), and Management (68.2%), while the most female-oriented occupations are Community & Social Service (100.0%), Education Instruction & Library (100.0%), and Arts, Media & Entertainment (100.0%).
| Occupation | Male | Female |
| Management | 15 (68.2%) | 7 (31.8%) |
| Business & Financial | 1 (100.0%) | 0 (0.0%) |
| Computers, Engineering & Science | 0 (0.0%) | 0 (0.0%) |
| Computers & Mathematics | 0 (0.0%) | 0 (0.0%) |
| Architecture & Engineering | 0 (0.0%) | 0 (0.0%) |
| Life, Physical & Social Science | 0 (0.0%) | 0 (0.0%) |
| Community & Social Service | 0 (0.0%) | 7 (100.0%) |
| Education, Arts & Media | 0 (0.0%) | 0 (0.0%) |
| Legal Services & Support | 0 (0.0%) | 0 (0.0%) |
| Education Instruction & Library | 0 (0.0%) | 6 (100.0%) |
| Arts, Media & Entertainment | 0 (0.0%) | 1 (100.0%) |
| Health Diagnosing & Treating | 0 (0.0%) | 8 (100.0%) |
| Health Technologists | 0 (0.0%) | 6 (100.0%) |
| Total (Category) | 16 (42.1%) | 22 (57.9%) |
| Total (Overall) | 231 (45.7%) | 275 (54.3%) |
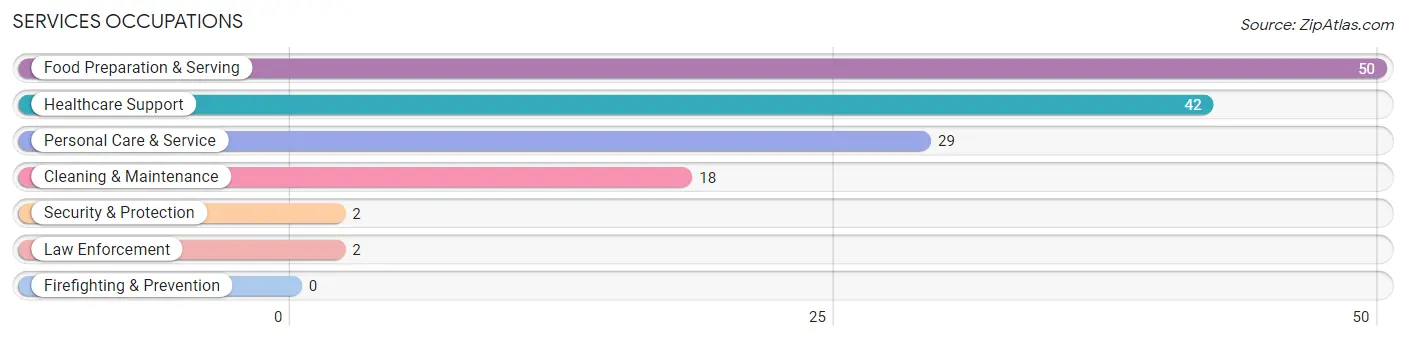
Services Occupations
The most common Services occupations in Grant City are Food Preparation & Serving (50 | 9.9%), Healthcare Support (42 | 8.3%), Personal Care & Service (29 | 5.7%), Cleaning & Maintenance (18 | 3.6%), and Security & Protection (2 | 0.4%).
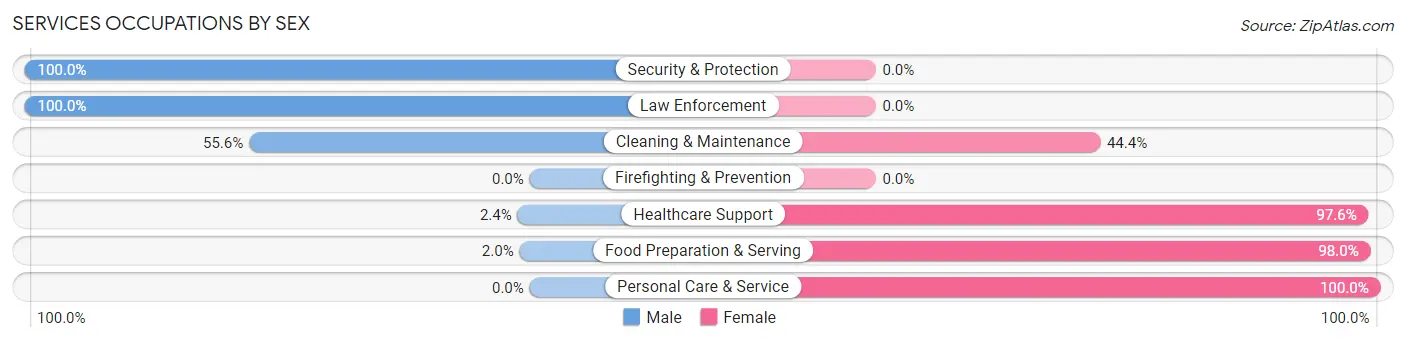
Services Occupations by Sex
Within the Services occupations in Grant City, the most male-oriented occupations are Security & Protection (100.0%), Law Enforcement (100.0%), and Cleaning & Maintenance (55.6%), while the most female-oriented occupations are Personal Care & Service (100.0%), Food Preparation & Serving (98.0%), and Healthcare Support (97.6%).
| Occupation | Male | Female |
| Healthcare Support | 1 (2.4%) | 41 (97.6%) |
| Security & Protection | 2 (100.0%) | 0 (0.0%) |
| Firefighting & Prevention | 0 (0.0%) | 0 (0.0%) |
| Law Enforcement | 2 (100.0%) | 0 (0.0%) |
| Food Preparation & Serving | 1 (2.0%) | 49 (98.0%) |
| Cleaning & Maintenance | 10 (55.6%) | 8 (44.4%) |
| Personal Care & Service | 0 (0.0%) | 29 (100.0%) |
| Total (Category) | 14 (9.9%) | 127 (90.1%) |
| Total (Overall) | 231 (45.7%) | 275 (54.3%) |
Sales and Office Occupations
The most common Sales and Office occupations in Grant City are Sales & Related (131 | 25.9%), and Office & Administration (49 | 9.7%).
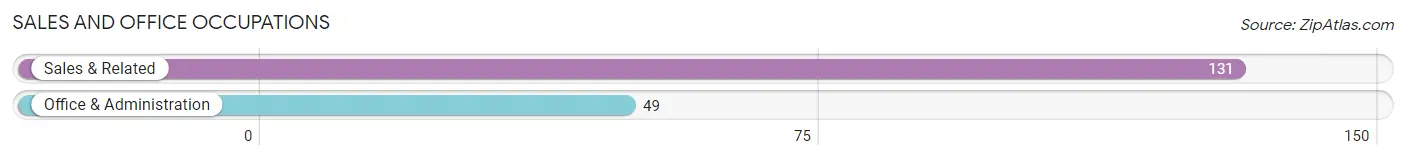
Sales and Office Occupations by Sex
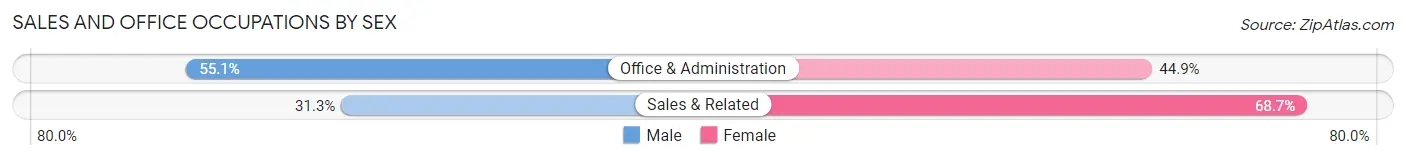
| Occupation | Male | Female |
| Sales & Related | 41 (31.3%) | 90 (68.7%) |
| Office & Administration | 27 (55.1%) | 22 (44.9%) |
| Total (Category) | 68 (37.8%) | 112 (62.2%) |
| Total (Overall) | 231 (45.7%) | 275 (54.3%) |
Natural Resources, Construction and Maintenance Occupations
The most common Natural Resources, Construction and Maintenance occupations in Grant City are Construction & Extraction (51 | 10.1%), Installation, Maintenance & Repair (27 | 5.3%), and Farming, Fishing & Forestry (16 | 3.2%).
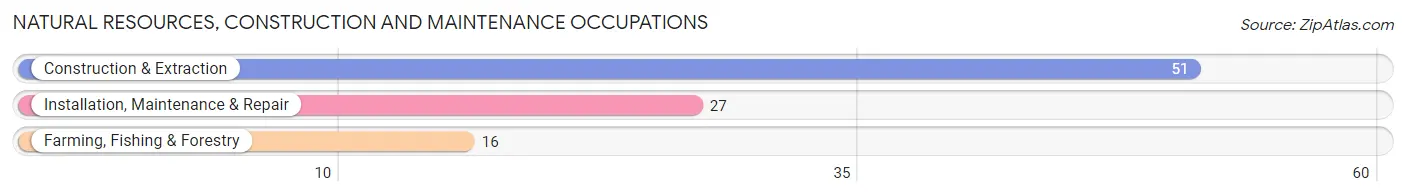
Natural Resources, Construction and Maintenance Occupations by Sex
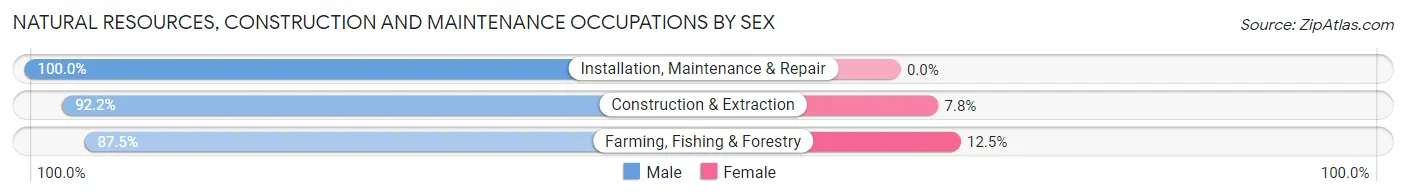
| Occupation | Male | Female |
| Farming, Fishing & Forestry | 14 (87.5%) | 2 (12.5%) |
| Construction & Extraction | 47 (92.2%) | 4 (7.8%) |
| Installation, Maintenance & Repair | 27 (100.0%) | 0 (0.0%) |
| Total (Category) | 88 (93.6%) | 6 (6.4%) |
| Total (Overall) | 231 (45.7%) | 275 (54.3%) |
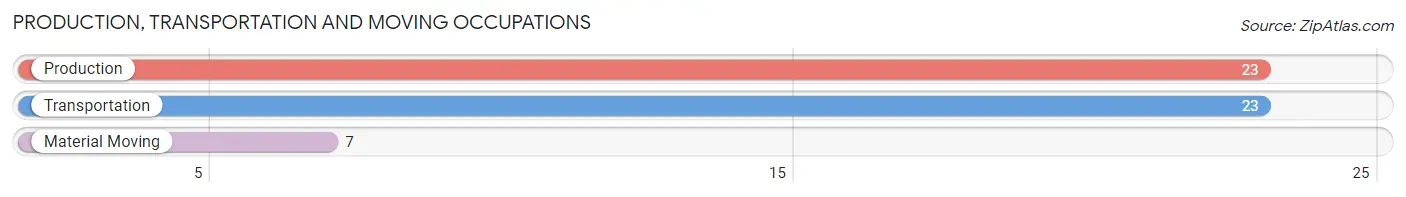
Production, Transportation and Moving Occupations
The most common Production, Transportation and Moving occupations in Grant City are Production (23 | 4.5%), Transportation (23 | 4.5%), and Material Moving (7 | 1.4%).
Production, Transportation and Moving Occupations by Sex
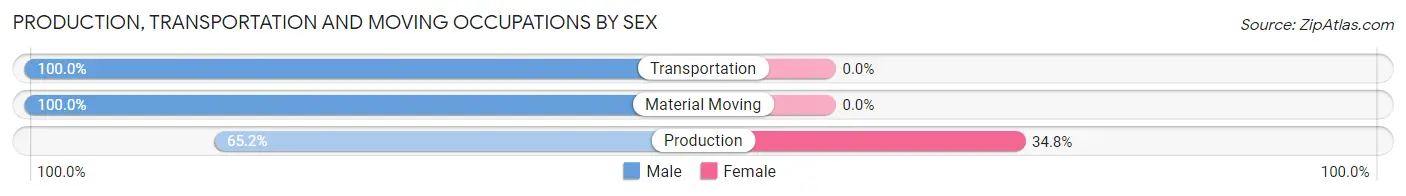
| Occupation | Male | Female |
| Production | 15 (65.2%) | 8 (34.8%) |
| Transportation | 23 (100.0%) | 0 (0.0%) |
| Material Moving | 7 (100.0%) | 0 (0.0%) |
| Total (Category) | 45 (84.9%) | 8 (15.1%) |
| Total (Overall) | 231 (45.7%) | 275 (54.3%) |
Employment Industries by Sex in Grant City
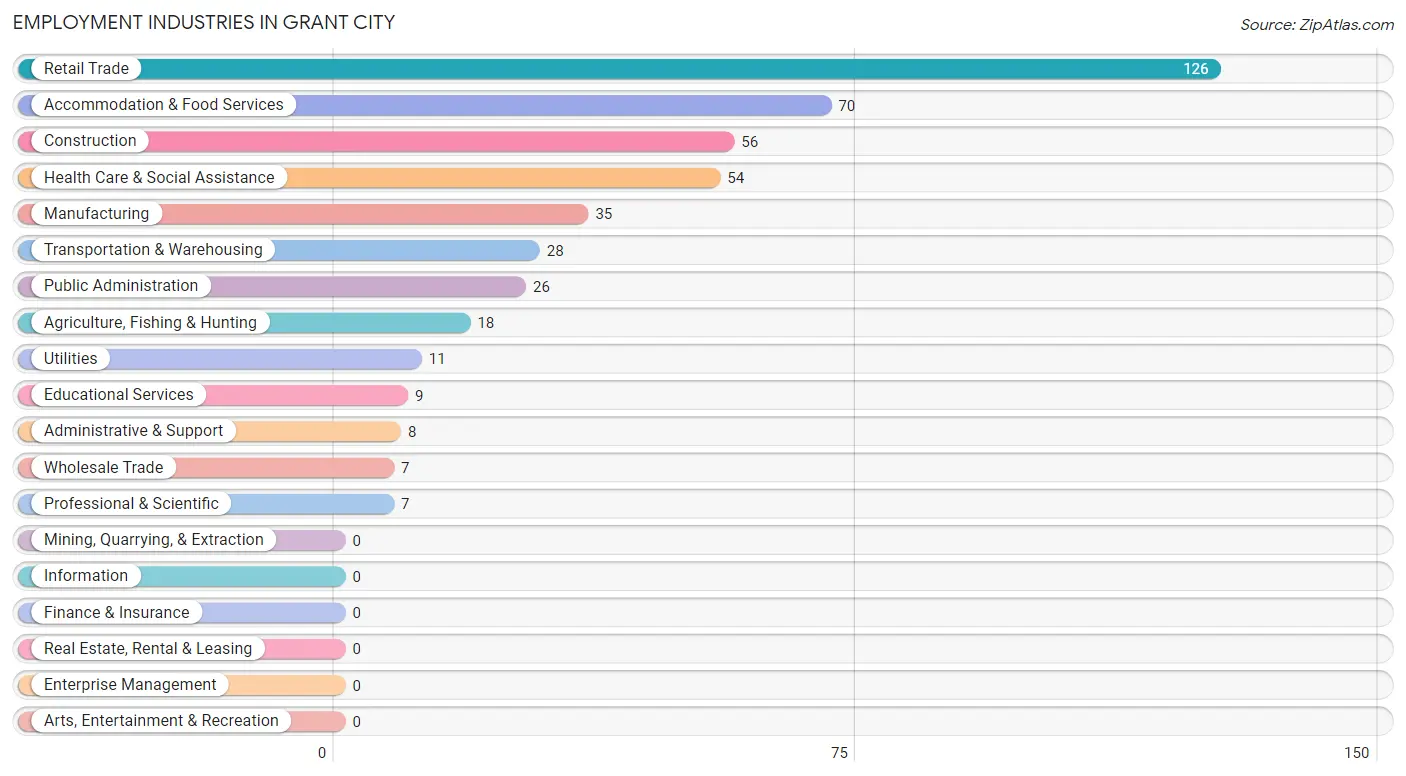
Employment Industries in Grant City
The major employment industries in Grant City include Retail Trade (126 | 24.9%), Accommodation & Food Services (70 | 13.8%), Construction (56 | 11.1%), Health Care & Social Assistance (54 | 10.7%), and Manufacturing (35 | 6.9%).
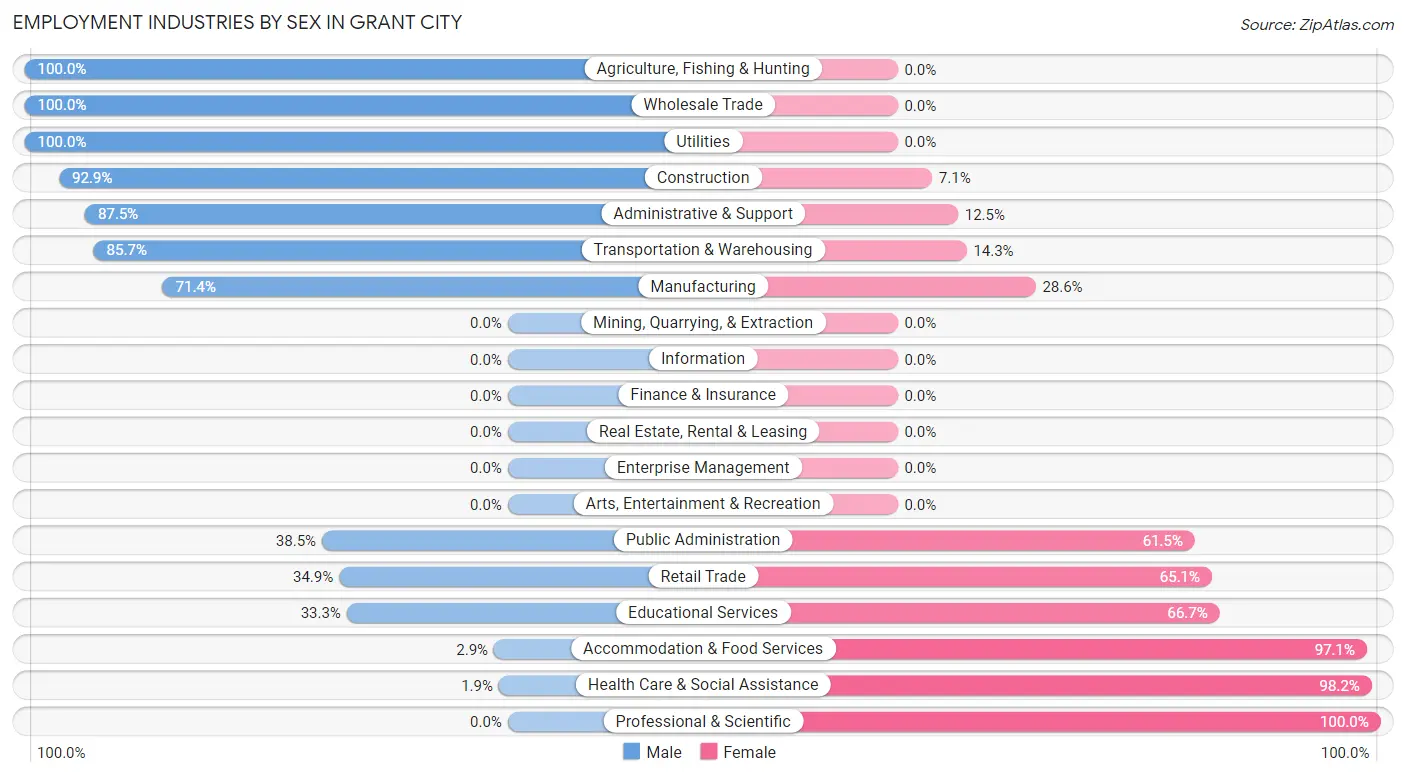
Employment Industries by Sex in Grant City
The Grant City industries that see more men than women are Agriculture, Fishing & Hunting (100.0%), Wholesale Trade (100.0%), and Utilities (100.0%), whereas the industries that tend to have a higher number of women are Professional & Scientific (100.0%), Health Care & Social Assistance (98.2%), and Accommodation & Food Services (97.1%).
| Industry | Male | Female |
| Agriculture, Fishing & Hunting | 18 (100.0%) | 0 (0.0%) |
| Mining, Quarrying, & Extraction | 0 (0.0%) | 0 (0.0%) |
| Construction | 52 (92.9%) | 4 (7.1%) |
| Manufacturing | 25 (71.4%) | 10 (28.6%) |
| Wholesale Trade | 7 (100.0%) | 0 (0.0%) |
| Retail Trade | 44 (34.9%) | 82 (65.1%) |
| Transportation & Warehousing | 24 (85.7%) | 4 (14.3%) |
| Utilities | 11 (100.0%) | 0 (0.0%) |
| Information | 0 (0.0%) | 0 (0.0%) |
| Finance & Insurance | 0 (0.0%) | 0 (0.0%) |
| Real Estate, Rental & Leasing | 0 (0.0%) | 0 (0.0%) |
| Professional & Scientific | 0 (0.0%) | 7 (100.0%) |
| Enterprise Management | 0 (0.0%) | 0 (0.0%) |
| Administrative & Support | 7 (87.5%) | 1 (12.5%) |
| Educational Services | 3 (33.3%) | 6 (66.7%) |
| Health Care & Social Assistance | 1 (1.8%) | 53 (98.2%) |
| Arts, Entertainment & Recreation | 0 (0.0%) | 0 (0.0%) |
| Accommodation & Food Services | 2 (2.9%) | 68 (97.1%) |
| Public Administration | 10 (38.5%) | 16 (61.5%) |
| Total | 231 (45.7%) | 275 (54.3%) |
Education in Grant City
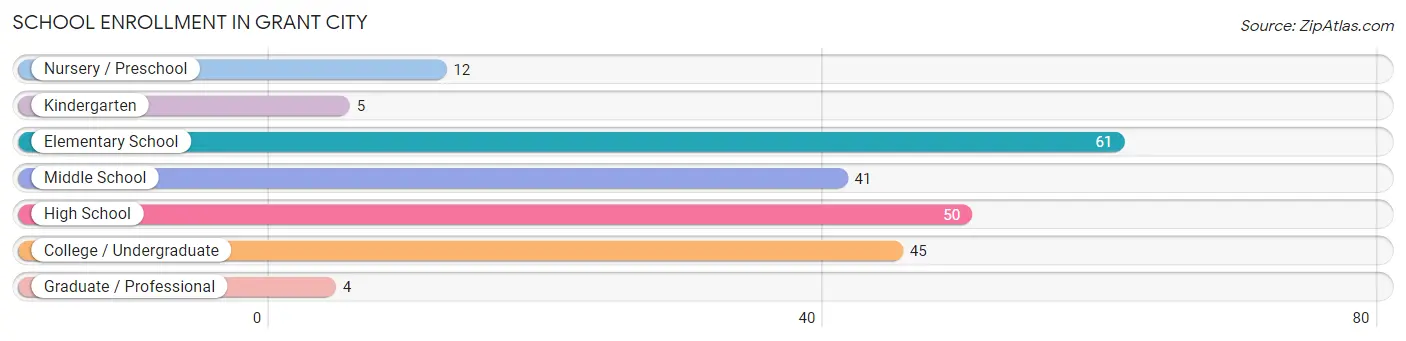
School Enrollment in Grant City
The most common levels of schooling among the 218 students in Grant City are elementary school (61 | 28.0%), high school (50 | 22.9%), and college / undergraduate (45 | 20.6%).
| School Level | # Students | % Students |
| Nursery / Preschool | 12 | 5.5% |
| Kindergarten | 5 | 2.3% |
| Elementary School | 61 | 28.0% |
| Middle School | 41 | 18.8% |
| High School | 50 | 22.9% |
| College / Undergraduate | 45 | 20.6% |
| Graduate / Professional | 4 | 1.8% |
| Total | 218 | 100.0% |
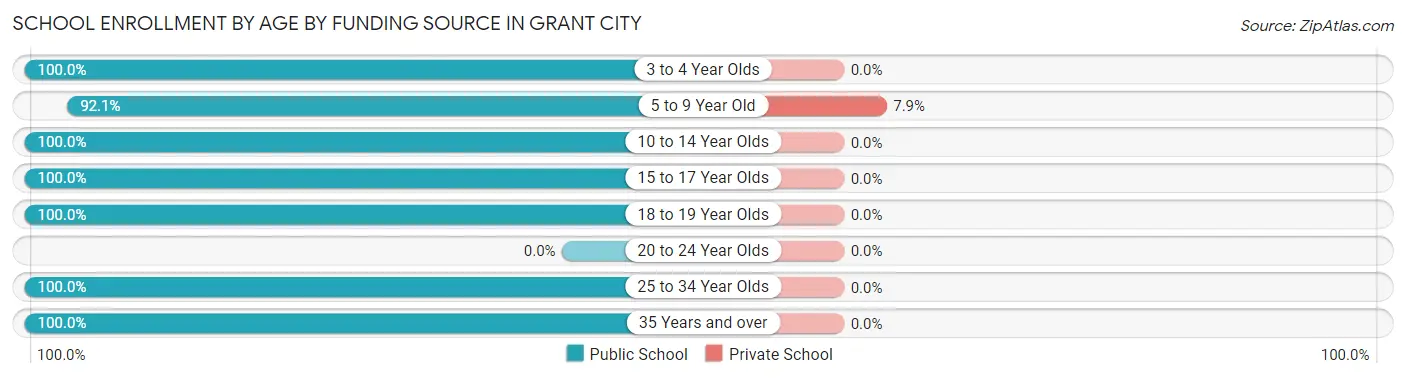
School Enrollment by Age by Funding Source in Grant City
Out of a total of 218 students who are enrolled in schools in Grant City, 5 (2.3%) attend a private institution, while the remaining 213 (97.7%) are enrolled in public schools. The age group of 5 to 9 year old has the highest likelihood of being enrolled in private schools, with 5 (7.9% in the age bracket) enrolled. Conversely, the age group of 3 to 4 year olds has the lowest likelihood of being enrolled in a private school, with 6 (100.0% in the age bracket) attending a public institution.
| Age Bracket | Public School | Private School |
| 3 to 4 Year Olds | 6 (100.0%) | 0 (0.0%) |
| 5 to 9 Year Old | 58 (92.1%) | 5 (7.9%) |
| 10 to 14 Year Olds | 56 (100.0%) | 0 (0.0%) |
| 15 to 17 Year Olds | 38 (100.0%) | 0 (0.0%) |
| 18 to 19 Year Olds | 43 (100.0%) | 0 (0.0%) |
| 20 to 24 Year Olds | 0 (0.0%) | 0 (0.0%) |
| 25 to 34 Year Olds | 5 (100.0%) | 0 (0.0%) |
| 35 Years and over | 7 (100.0%) | 0 (0.0%) |
| Total | 213 (97.7%) | 5 (2.3%) |
Educational Attainment by Field of Study in Grant City
Education (18 | 34.6%), science & technology (12 | 23.1%), business (7 | 13.5%), arts & humanities (6 | 11.5%), and bio, nature & agricultural (3 | 5.8%) are the most common fields of study among 52 individuals in Grant City who have obtained a bachelor's degree or higher.
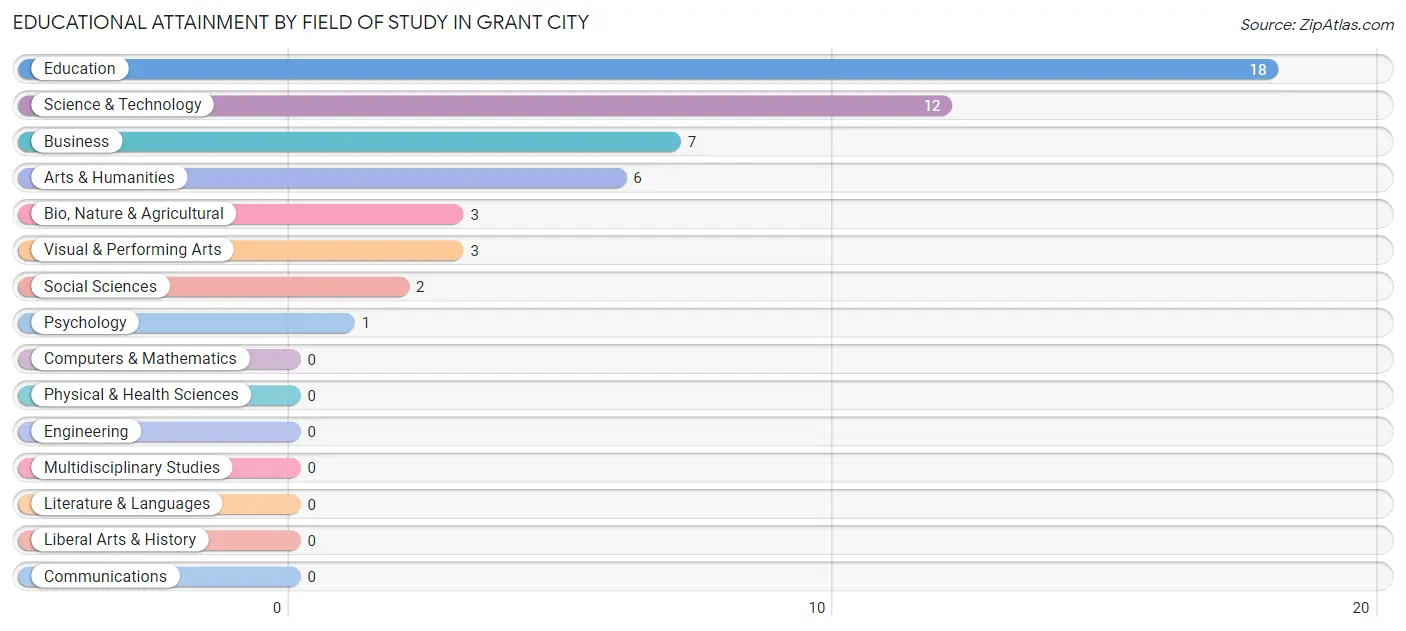
| Field of Study | # Graduates | % Graduates |
| Computers & Mathematics | 0 | 0.0% |
| Bio, Nature & Agricultural | 3 | 5.8% |
| Physical & Health Sciences | 0 | 0.0% |
| Psychology | 1 | 1.9% |
| Social Sciences | 2 | 3.8% |
| Engineering | 0 | 0.0% |
| Multidisciplinary Studies | 0 | 0.0% |
| Science & Technology | 12 | 23.1% |
| Business | 7 | 13.5% |
| Education | 18 | 34.6% |
| Literature & Languages | 0 | 0.0% |
| Liberal Arts & History | 0 | 0.0% |
| Visual & Performing Arts | 3 | 5.8% |
| Communications | 0 | 0.0% |
| Arts & Humanities | 6 | 11.5% |
| Total | 52 | 100.0% |
Transportation & Commute in Grant City
Vehicle Availability by Sex in Grant City
The most prevalent vehicle ownership categories in Grant City are males with 2 vehicles (83, accounting for 36.4%) and females with 2 vehicles (43, making up 33.6%).
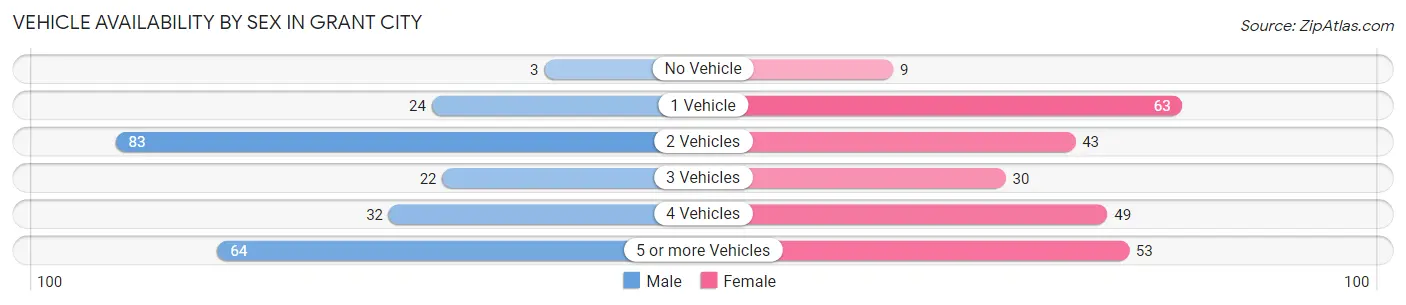
| Vehicles Available | Male | Female |
| No Vehicle | 3 (1.3%) | 9 (3.6%) |
| 1 Vehicle | 24 (10.5%) | 63 (25.5%) |
| 2 Vehicles | 83 (36.4%) | 43 (17.4%) |
| 3 Vehicles | 22 (9.7%) | 30 (12.1%) |
| 4 Vehicles | 32 (14.0%) | 49 (19.8%) |
| 5 or more Vehicles | 64 (28.1%) | 53 (21.5%) |
| Total | 228 (100.0%) | 247 (100.0%) |
Commute Time in Grant City
The most frequently occuring commute durations in Grant City are 5 to 9 minutes (116 commuters, 26.4%), 45 to 59 minutes (90 commuters, 20.5%), and less than 5 minutes (55 commuters, 12.5%).
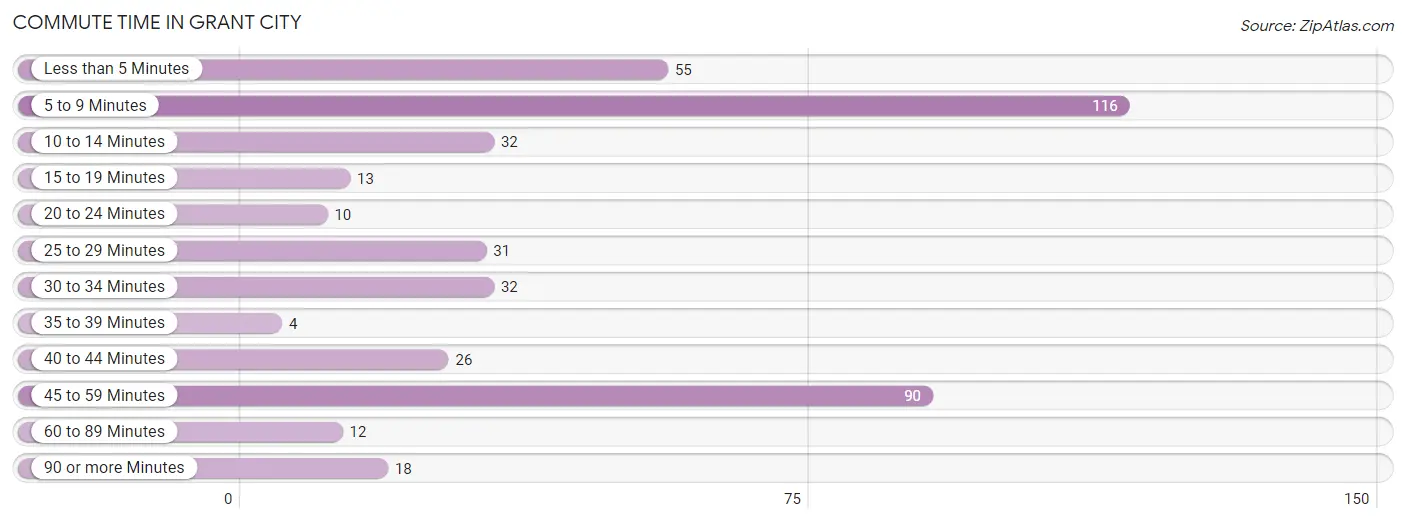
| Commute Time | # Commuters | % Commuters |
| Less than 5 Minutes | 55 | 12.5% |
| 5 to 9 Minutes | 116 | 26.4% |
| 10 to 14 Minutes | 32 | 7.3% |
| 15 to 19 Minutes | 13 | 3.0% |
| 20 to 24 Minutes | 10 | 2.3% |
| 25 to 29 Minutes | 31 | 7.1% |
| 30 to 34 Minutes | 32 | 7.3% |
| 35 to 39 Minutes | 4 | 0.9% |
| 40 to 44 Minutes | 26 | 5.9% |
| 45 to 59 Minutes | 90 | 20.5% |
| 60 to 89 Minutes | 12 | 2.7% |
| 90 or more Minutes | 18 | 4.1% |
Commute Time by Sex in Grant City
The most common commute times in Grant City are 5 to 9 minutes (76 commuters, 34.4%) for males and 45 to 59 minutes (52 commuters, 23.8%) for females.
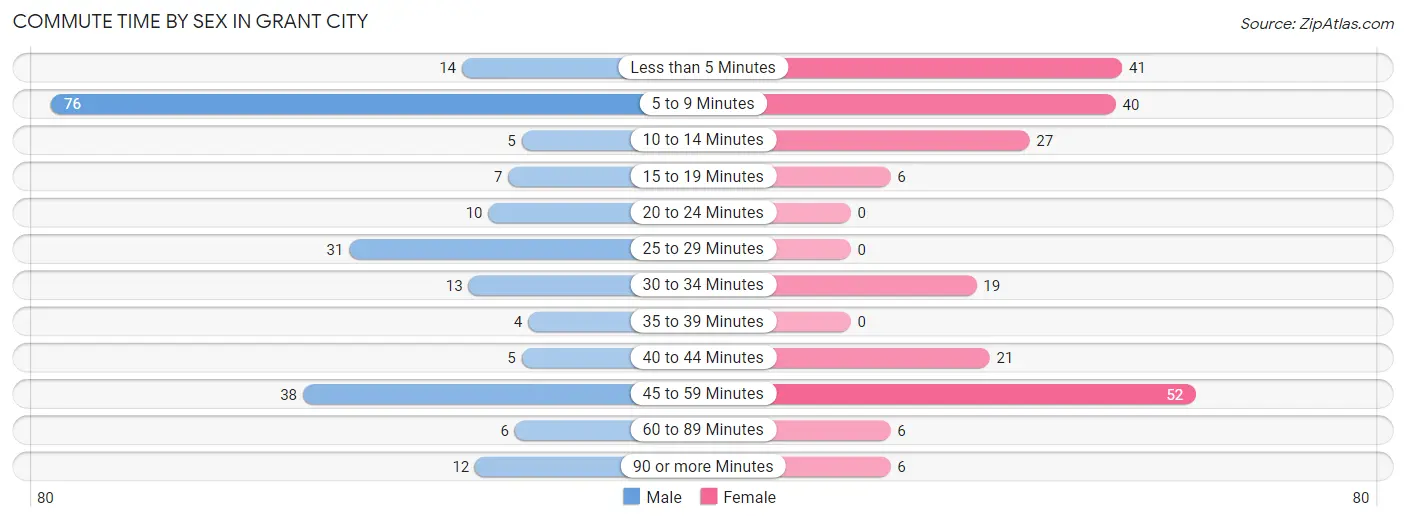
| Commute Time | Male | Female |
| Less than 5 Minutes | 14 (6.3%) | 41 (18.8%) |
| 5 to 9 Minutes | 76 (34.4%) | 40 (18.3%) |
| 10 to 14 Minutes | 5 (2.3%) | 27 (12.4%) |
| 15 to 19 Minutes | 7 (3.2%) | 6 (2.8%) |
| 20 to 24 Minutes | 10 (4.5%) | 0 (0.0%) |
| 25 to 29 Minutes | 31 (14.0%) | 0 (0.0%) |
| 30 to 34 Minutes | 13 (5.9%) | 19 (8.7%) |
| 35 to 39 Minutes | 4 (1.8%) | 0 (0.0%) |
| 40 to 44 Minutes | 5 (2.3%) | 21 (9.6%) |
| 45 to 59 Minutes | 38 (17.2%) | 52 (23.8%) |
| 60 to 89 Minutes | 6 (2.7%) | 6 (2.8%) |
| 90 or more Minutes | 12 (5.4%) | 6 (2.8%) |
Time of Departure to Work by Sex in Grant City
The most frequent times of departure to work in Grant City are 7:00 AM to 7:29 AM (48, 21.7%) for males and 6:30 AM to 6:59 AM (64, 29.4%) for females.
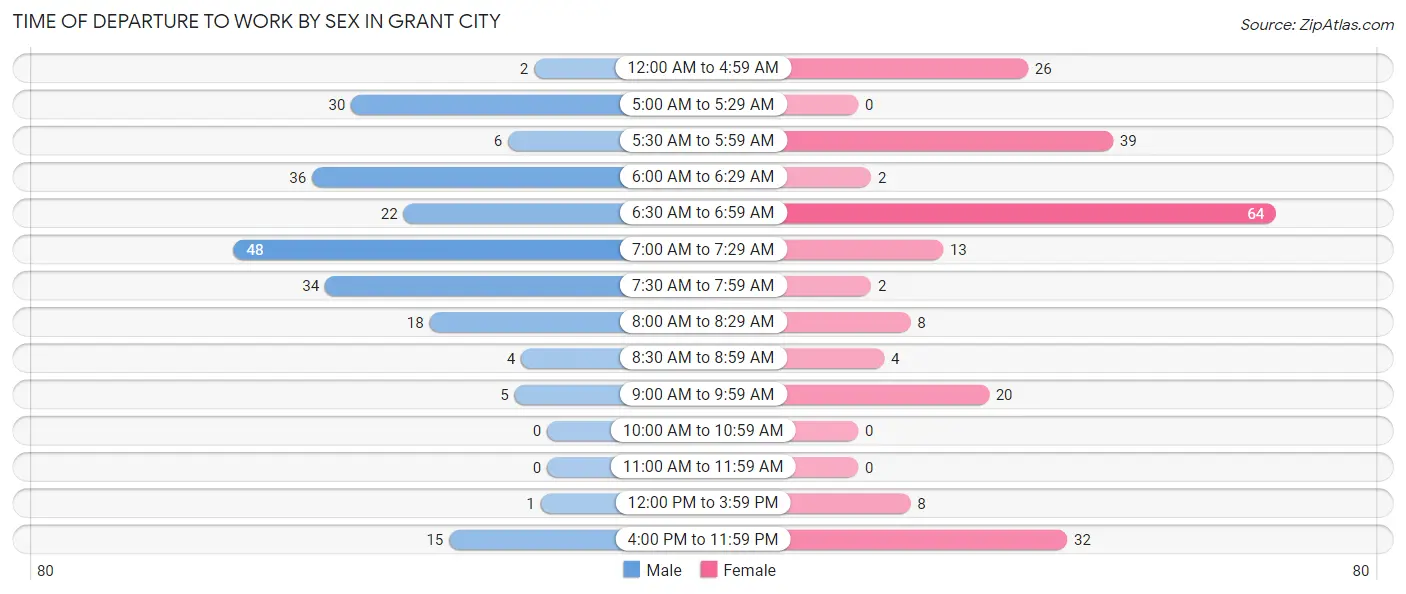
| Time of Departure | Male | Female |
| 12:00 AM to 4:59 AM | 2 (0.9%) | 26 (11.9%) |
| 5:00 AM to 5:29 AM | 30 (13.6%) | 0 (0.0%) |
| 5:30 AM to 5:59 AM | 6 (2.7%) | 39 (17.9%) |
| 6:00 AM to 6:29 AM | 36 (16.3%) | 2 (0.9%) |
| 6:30 AM to 6:59 AM | 22 (10.0%) | 64 (29.4%) |
| 7:00 AM to 7:29 AM | 48 (21.7%) | 13 (6.0%) |
| 7:30 AM to 7:59 AM | 34 (15.4%) | 2 (0.9%) |
| 8:00 AM to 8:29 AM | 18 (8.1%) | 8 (3.7%) |
| 8:30 AM to 8:59 AM | 4 (1.8%) | 4 (1.8%) |
| 9:00 AM to 9:59 AM | 5 (2.3%) | 20 (9.2%) |
| 10:00 AM to 10:59 AM | 0 (0.0%) | 0 (0.0%) |
| 11:00 AM to 11:59 AM | 0 (0.0%) | 0 (0.0%) |
| 12:00 PM to 3:59 PM | 1 (0.4%) | 8 (3.7%) |
| 4:00 PM to 11:59 PM | 15 (6.8%) | 32 (14.7%) |
| Total | 221 (100.0%) | 218 (100.0%) |
Housing Occupancy in Grant City
Occupancy by Ownership in Grant City
Of the total 352 dwellings in Grant City, owner-occupied units account for 282 (80.1%), while renter-occupied units make up 70 (19.9%).
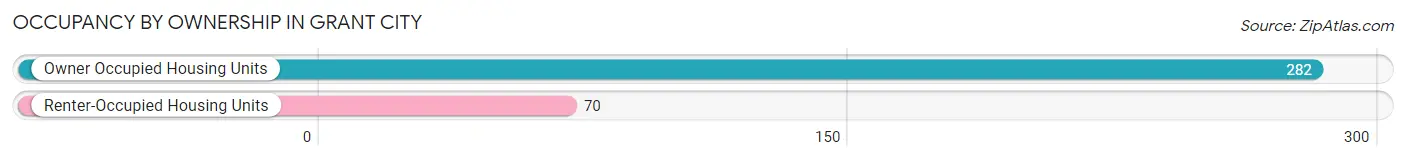
| Occupancy | # Housing Units | % Housing Units |
| Owner Occupied Housing Units | 282 | 80.1% |
| Renter-Occupied Housing Units | 70 | 19.9% |
| Total Occupied Housing Units | 352 | 100.0% |
Occupancy by Household Size in Grant City
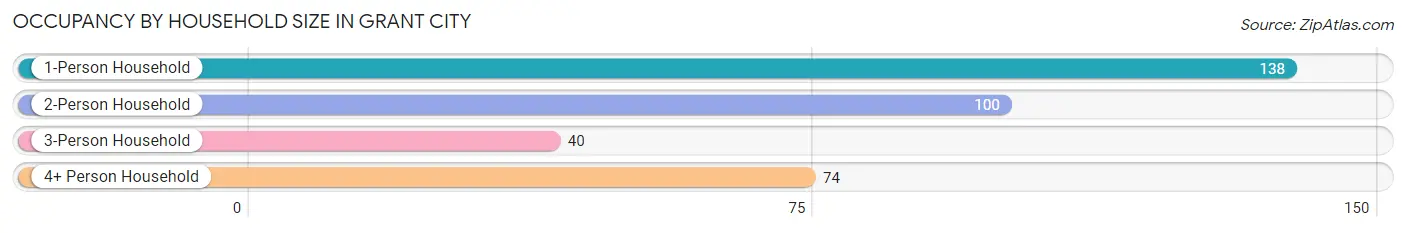
| Household Size | # Housing Units | % Housing Units |
| 1-Person Household | 138 | 39.2% |
| 2-Person Household | 100 | 28.4% |
| 3-Person Household | 40 | 11.4% |
| 4+ Person Household | 74 | 21.0% |
| Total Housing Units | 352 | 100.0% |
Occupancy by Ownership by Household Size in Grant City
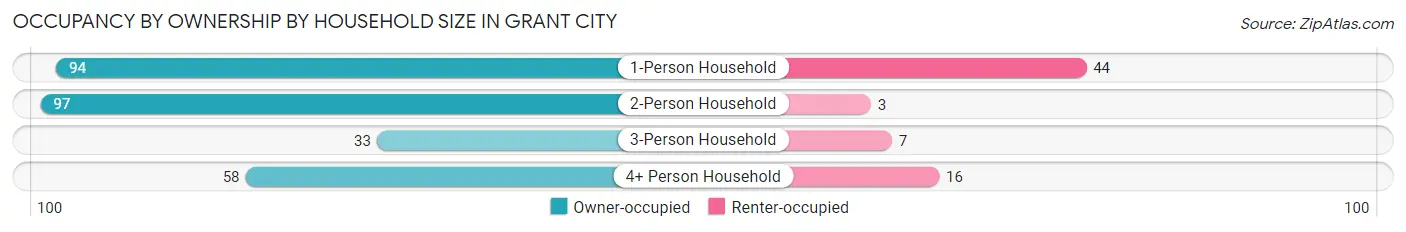
| Household Size | Owner-occupied | Renter-occupied |
| 1-Person Household | 94 (68.1%) | 44 (31.9%) |
| 2-Person Household | 97 (97.0%) | 3 (3.0%) |
| 3-Person Household | 33 (82.5%) | 7 (17.5%) |
| 4+ Person Household | 58 (78.4%) | 16 (21.6%) |
| Total Housing Units | 282 (80.1%) | 70 (19.9%) |
Occupancy by Educational Attainment in Grant City
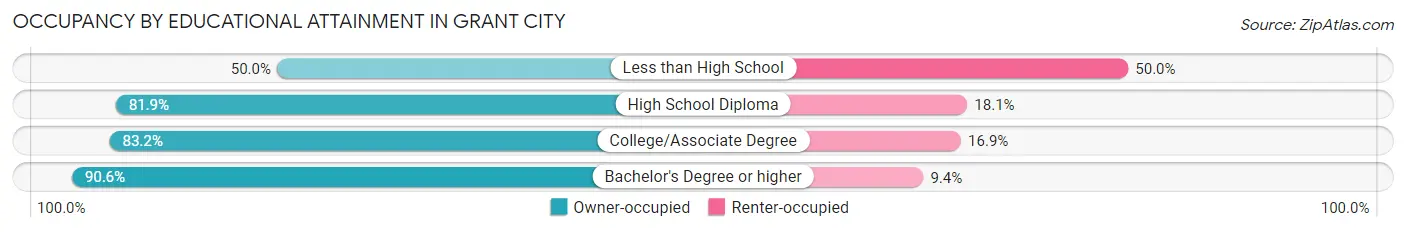
| Household Size | Owner-occupied | Renter-occupied |
| Less than High School | 16 (50.0%) | 16 (50.0%) |
| High School Diploma | 163 (81.9%) | 36 (18.1%) |
| College/Associate Degree | 74 (83.2%) | 15 (16.9%) |
| Bachelor's Degree or higher | 29 (90.6%) | 3 (9.4%) |
Occupancy by Age of Householder in Grant City
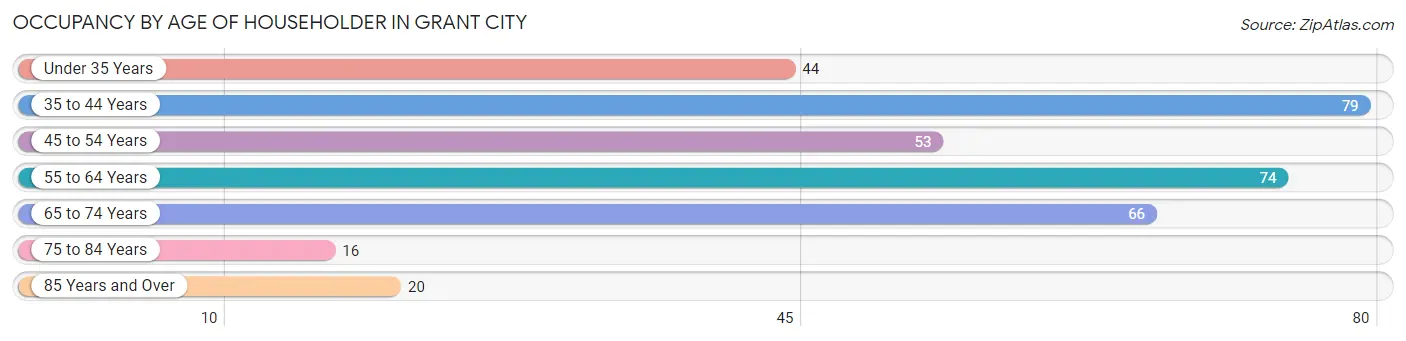
| Age Bracket | # Households | % Households |
| Under 35 Years | 44 | 12.5% |
| 35 to 44 Years | 79 | 22.4% |
| 45 to 54 Years | 53 | 15.1% |
| 55 to 64 Years | 74 | 21.0% |
| 65 to 74 Years | 66 | 18.8% |
| 75 to 84 Years | 16 | 4.5% |
| 85 Years and Over | 20 | 5.7% |
| Total | 352 | 100.0% |
Housing Finances in Grant City
Median Income by Occupancy in Grant City
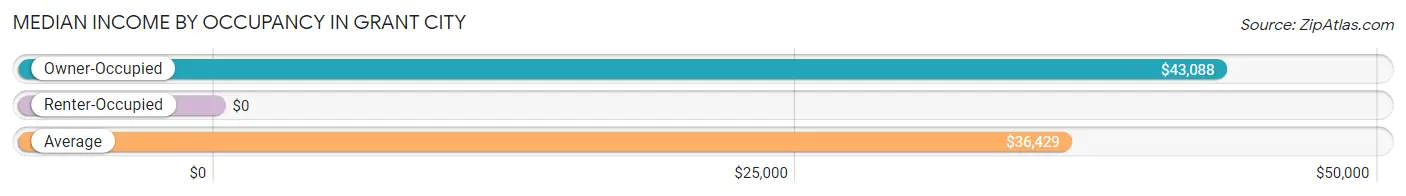
| Occupancy Type | # Households | Median Income |
| Owner-Occupied | 282 (80.1%) | $43,088 |
| Renter-Occupied | 70 (19.9%) | $0 |
| Average | 352 (100.0%) | $36,429 |
Occupancy by Householder Income Bracket in Grant City
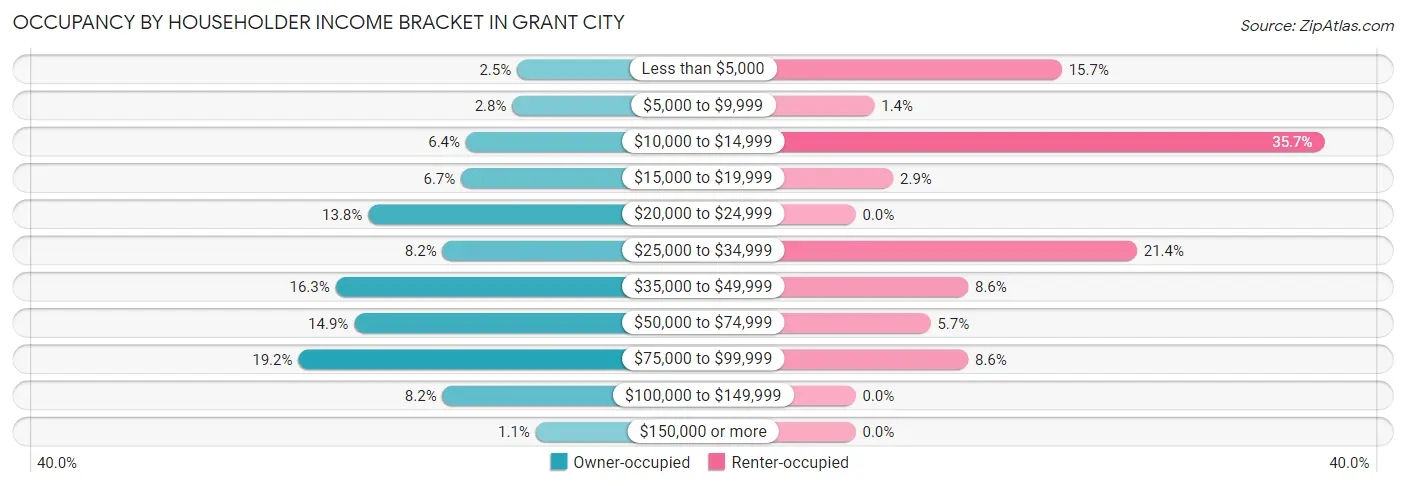
| Income Bracket | Owner-occupied | Renter-occupied |
| Less than $5,000 | 7 (2.5%) | 11 (15.7%) |
| $5,000 to $9,999 | 8 (2.8%) | 1 (1.4%) |
| $10,000 to $14,999 | 18 (6.4%) | 25 (35.7%) |
| $15,000 to $19,999 | 19 (6.7%) | 2 (2.9%) |
| $20,000 to $24,999 | 39 (13.8%) | 0 (0.0%) |
| $25,000 to $34,999 | 23 (8.2%) | 15 (21.4%) |
| $35,000 to $49,999 | 46 (16.3%) | 6 (8.6%) |
| $50,000 to $74,999 | 42 (14.9%) | 4 (5.7%) |
| $75,000 to $99,999 | 54 (19.2%) | 6 (8.6%) |
| $100,000 to $149,999 | 23 (8.2%) | 0 (0.0%) |
| $150,000 or more | 3 (1.1%) | 0 (0.0%) |
| Total | 282 (100.0%) | 70 (100.0%) |
Monthly Housing Cost Tiers in Grant City
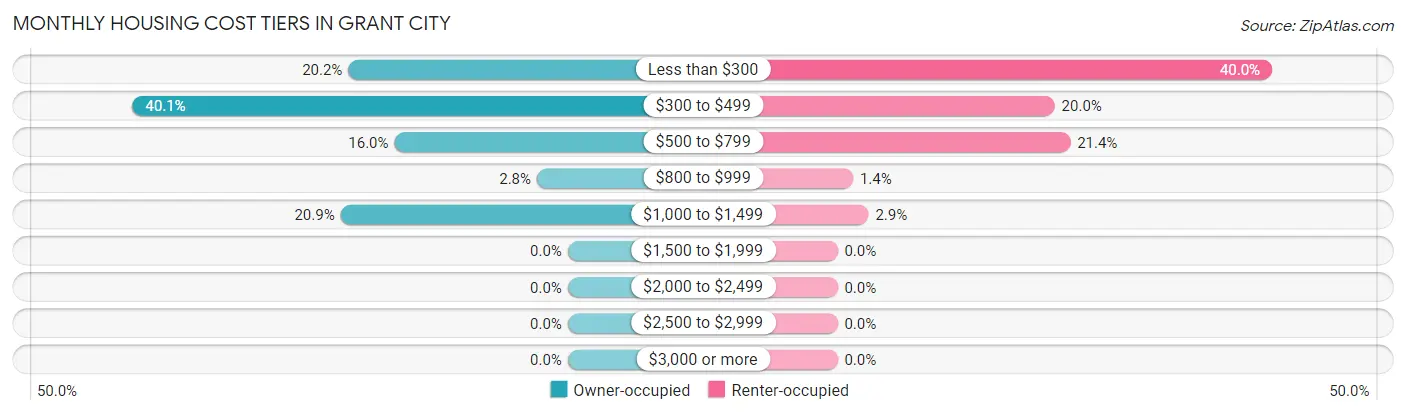
| Monthly Cost | Owner-occupied | Renter-occupied |
| Less than $300 | 57 (20.2%) | 28 (40.0%) |
| $300 to $499 | 113 (40.1%) | 14 (20.0%) |
| $500 to $799 | 45 (16.0%) | 15 (21.4%) |
| $800 to $999 | 8 (2.8%) | 1 (1.4%) |
| $1,000 to $1,499 | 59 (20.9%) | 2 (2.9%) |
| $1,500 to $1,999 | 0 (0.0%) | 0 (0.0%) |
| $2,000 to $2,499 | 0 (0.0%) | 0 (0.0%) |
| $2,500 to $2,999 | 0 (0.0%) | 0 (0.0%) |
| $3,000 or more | 0 (0.0%) | 0 (0.0%) |
| Total | 282 (100.0%) | 70 (100.0%) |
Physical Housing Characteristics in Grant City
Housing Structures in Grant City
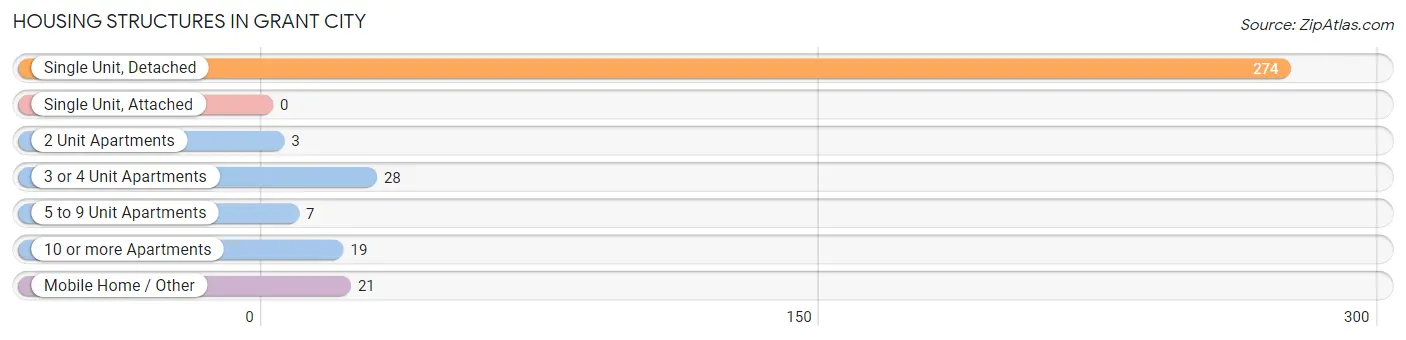
| Structure Type | # Housing Units | % Housing Units |
| Single Unit, Detached | 274 | 77.8% |
| Single Unit, Attached | 0 | 0.0% |
| 2 Unit Apartments | 3 | 0.9% |
| 3 or 4 Unit Apartments | 28 | 8.0% |
| 5 to 9 Unit Apartments | 7 | 2.0% |
| 10 or more Apartments | 19 | 5.4% |
| Mobile Home / Other | 21 | 6.0% |
| Total | 352 | 100.0% |
Housing Structures by Occupancy in Grant City
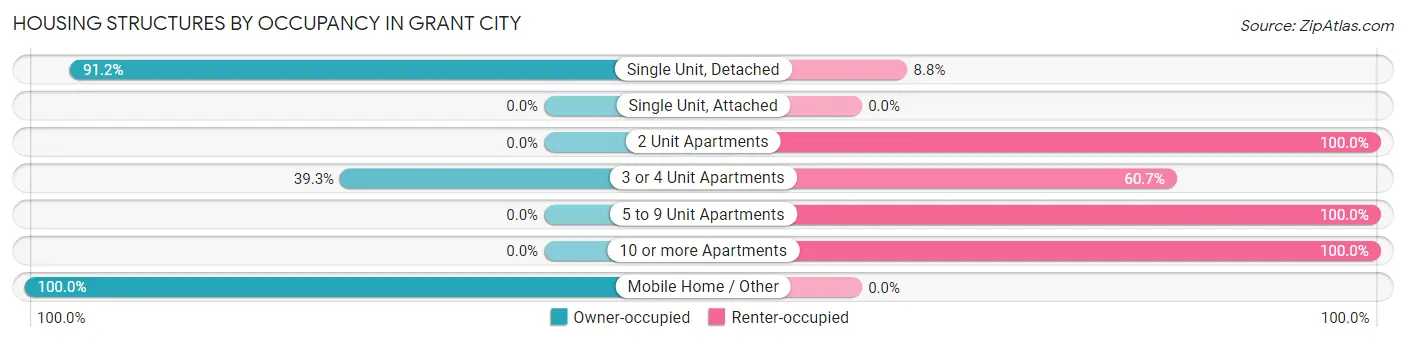
| Structure Type | Owner-occupied | Renter-occupied |
| Single Unit, Detached | 250 (91.2%) | 24 (8.8%) |
| Single Unit, Attached | 0 (0.0%) | 0 (0.0%) |
| 2 Unit Apartments | 0 (0.0%) | 3 (100.0%) |
| 3 or 4 Unit Apartments | 11 (39.3%) | 17 (60.7%) |
| 5 to 9 Unit Apartments | 0 (0.0%) | 7 (100.0%) |
| 10 or more Apartments | 0 (0.0%) | 19 (100.0%) |
| Mobile Home / Other | 21 (100.0%) | 0 (0.0%) |
| Total | 282 (80.1%) | 70 (19.9%) |
Housing Structures by Number of Rooms in Grant City
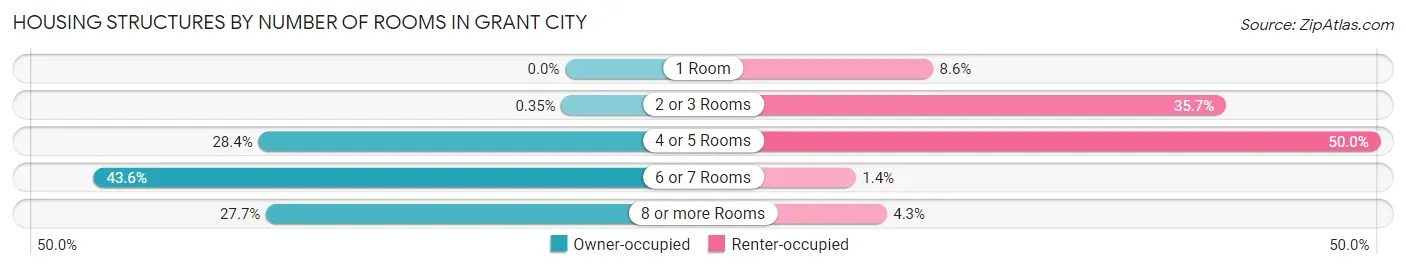
| Number of Rooms | Owner-occupied | Renter-occupied |
| 1 Room | 0 (0.0%) | 6 (8.6%) |
| 2 or 3 Rooms | 1 (0.4%) | 25 (35.7%) |
| 4 or 5 Rooms | 80 (28.4%) | 35 (50.0%) |
| 6 or 7 Rooms | 123 (43.6%) | 1 (1.4%) |
| 8 or more Rooms | 78 (27.7%) | 3 (4.3%) |
| Total | 282 (100.0%) | 70 (100.0%) |
Housing Structure by Heating Type in Grant City
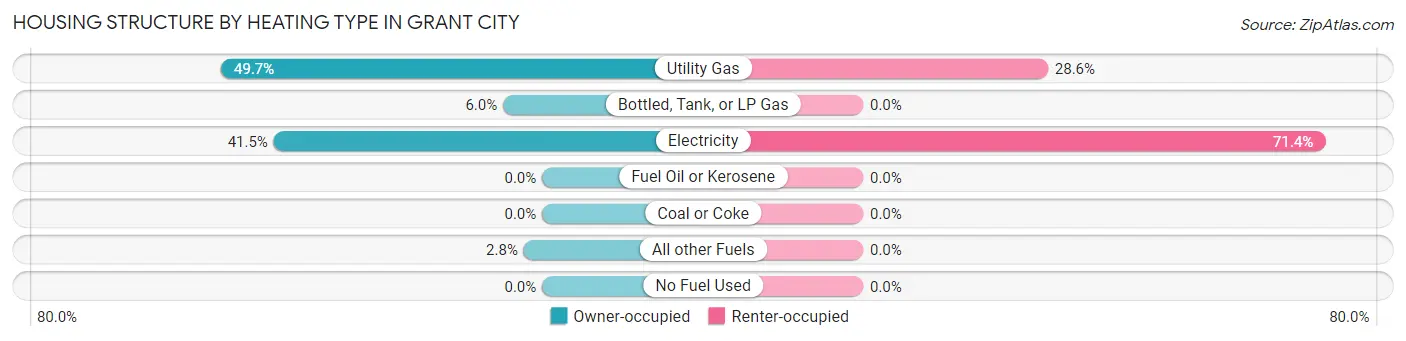
| Heating Type | Owner-occupied | Renter-occupied |
| Utility Gas | 140 (49.6%) | 20 (28.6%) |
| Bottled, Tank, or LP Gas | 17 (6.0%) | 0 (0.0%) |
| Electricity | 117 (41.5%) | 50 (71.4%) |
| Fuel Oil or Kerosene | 0 (0.0%) | 0 (0.0%) |
| Coal or Coke | 0 (0.0%) | 0 (0.0%) |
| All other Fuels | 8 (2.8%) | 0 (0.0%) |
| No Fuel Used | 0 (0.0%) | 0 (0.0%) |
| Total | 282 (100.0%) | 70 (100.0%) |
Household Vehicle Usage in Grant City
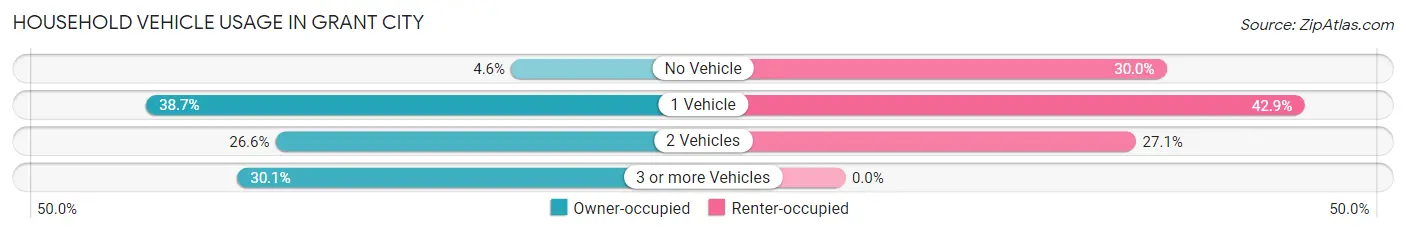
| Vehicles per Household | Owner-occupied | Renter-occupied |
| No Vehicle | 13 (4.6%) | 21 (30.0%) |
| 1 Vehicle | 109 (38.7%) | 30 (42.9%) |
| 2 Vehicles | 75 (26.6%) | 19 (27.1%) |
| 3 or more Vehicles | 85 (30.1%) | 0 (0.0%) |
| Total | 282 (100.0%) | 70 (100.0%) |
Real Estate & Mortgages in Grant City
Real Estate and Mortgage Overview in Grant City
| Characteristic | Without Mortgage | With Mortgage |
| Housing Units | 188 | 94 |
| Median Property Value | $53,300 | $85,600 |
| Median Household Income | $29,688 | $0 |
| Monthly Housing Costs | $368 | $0 |
| Real Estate Taxes | $552 | $0 |
Property Value by Mortgage Status in Grant City
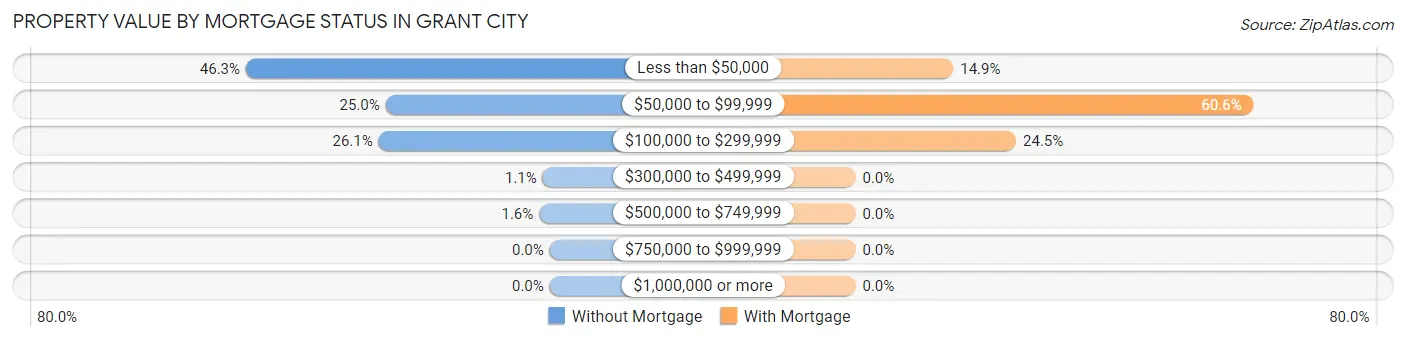
| Property Value | Without Mortgage | With Mortgage |
| Less than $50,000 | 87 (46.3%) | 14 (14.9%) |
| $50,000 to $99,999 | 47 (25.0%) | 57 (60.6%) |
| $100,000 to $299,999 | 49 (26.1%) | 23 (24.5%) |
| $300,000 to $499,999 | 2 (1.1%) | 0 (0.0%) |
| $500,000 to $749,999 | 3 (1.6%) | 0 (0.0%) |
| $750,000 to $999,999 | 0 (0.0%) | 0 (0.0%) |
| $1,000,000 or more | 0 (0.0%) | 0 (0.0%) |
| Total | 188 (100.0%) | 94 (100.0%) |
Household Income by Mortgage Status in Grant City
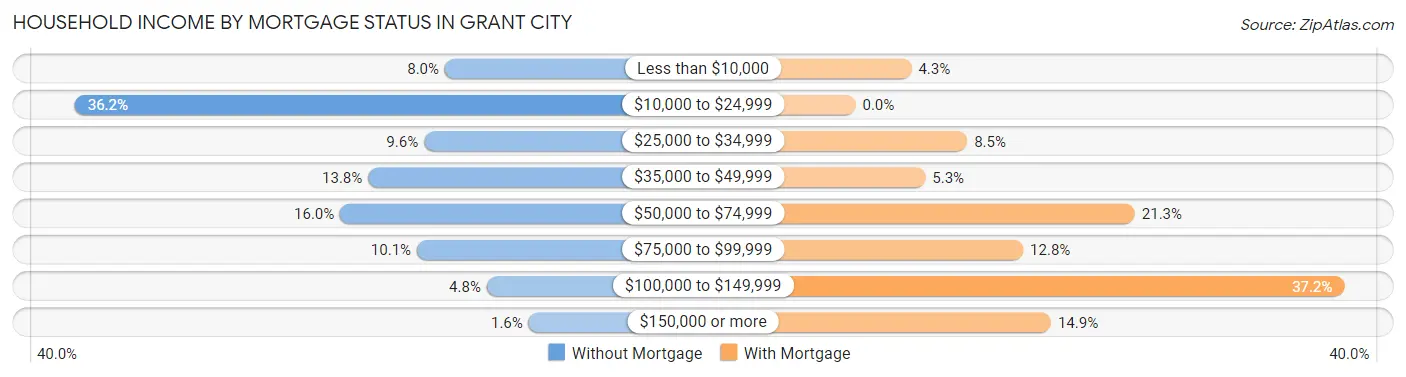
| Household Income | Without Mortgage | With Mortgage |
| Less than $10,000 | 15 (8.0%) | 4 (4.3%) |
| $10,000 to $24,999 | 68 (36.2%) | 0 (0.0%) |
| $25,000 to $34,999 | 18 (9.6%) | 8 (8.5%) |
| $35,000 to $49,999 | 26 (13.8%) | 5 (5.3%) |
| $50,000 to $74,999 | 30 (16.0%) | 20 (21.3%) |
| $75,000 to $99,999 | 19 (10.1%) | 12 (12.8%) |
| $100,000 to $149,999 | 9 (4.8%) | 35 (37.2%) |
| $150,000 or more | 3 (1.6%) | 14 (14.9%) |
| Total | 188 (100.0%) | 94 (100.0%) |
Property Value to Household Income Ratio in Grant City
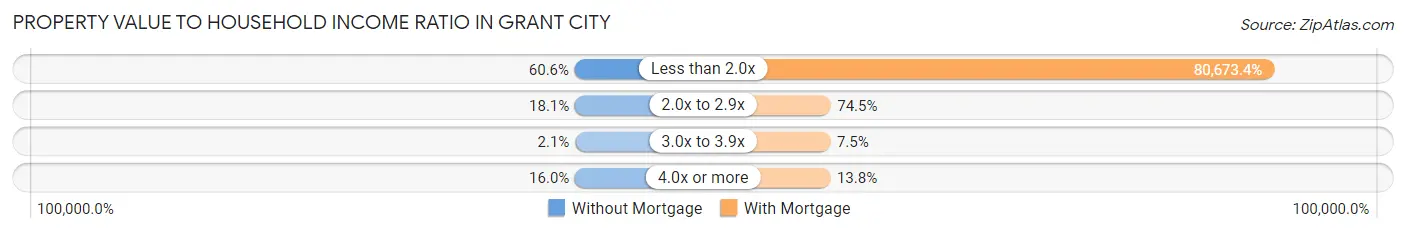
| Value-to-Income Ratio | Without Mortgage | With Mortgage |
| Less than 2.0x | 114 (60.6%) | 75,833 (80,673.4%) |
| 2.0x to 2.9x | 34 (18.1%) | 70 (74.5%) |
| 3.0x to 3.9x | 4 (2.1%) | 7 (7.4%) |
| 4.0x or more | 30 (16.0%) | 13 (13.8%) |
| Total | 188 (100.0%) | 94 (100.0%) |
Real Estate Taxes by Mortgage Status in Grant City
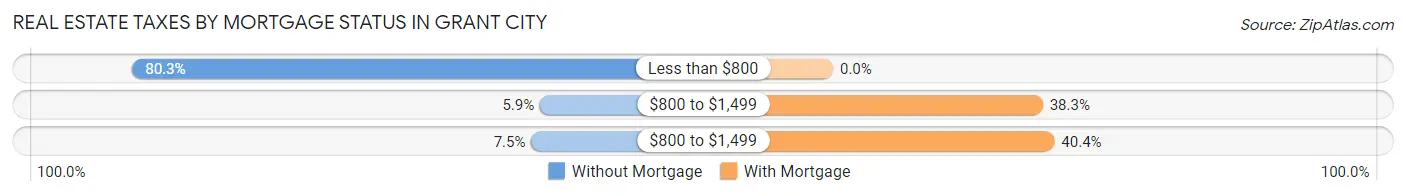
| Property Taxes | Without Mortgage | With Mortgage |
| Less than $800 | 151 (80.3%) | 0 (0.0%) |
| $800 to $1,499 | 11 (5.9%) | 36 (38.3%) |
| $800 to $1,499 | 14 (7.4%) | 38 (40.4%) |
| Total | 188 (100.0%) | 94 (100.0%) |
Health & Disability in Grant City
Health Insurance Coverage by Age in Grant City
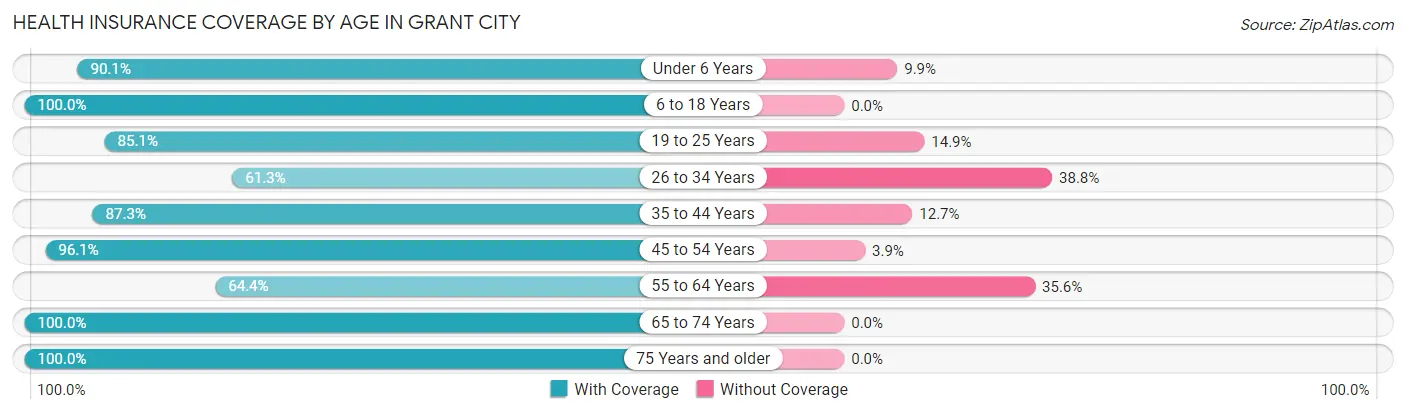
| Age Bracket | With Coverage | Without Coverage |
| Under 6 Years | 73 (90.1%) | 8 (9.9%) |
| 6 to 18 Years | 156 (100.0%) | 0 (0.0%) |
| 19 to 25 Years | 114 (85.1%) | 20 (14.9%) |
| 26 to 34 Years | 49 (61.3%) | 31 (38.8%) |
| 35 to 44 Years | 117 (87.3%) | 17 (12.7%) |
| 45 to 54 Years | 99 (96.1%) | 4 (3.9%) |
| 55 to 64 Years | 67 (64.4%) | 37 (35.6%) |
| 65 to 74 Years | 127 (100.0%) | 0 (0.0%) |
| 75 Years and older | 60 (100.0%) | 0 (0.0%) |
| Total | 862 (88.0%) | 117 (11.9%) |
Health Insurance Coverage by Citizenship Status in Grant City
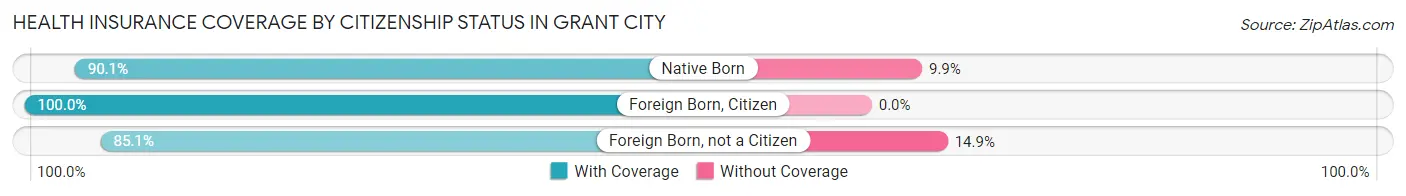
| Citizenship Status | With Coverage | Without Coverage |
| Native Born | 73 (90.1%) | 8 (9.9%) |
| Foreign Born, Citizen | 156 (100.0%) | 0 (0.0%) |
| Foreign Born, not a Citizen | 114 (85.1%) | 20 (14.9%) |
Health Insurance Coverage by Household Income in Grant City
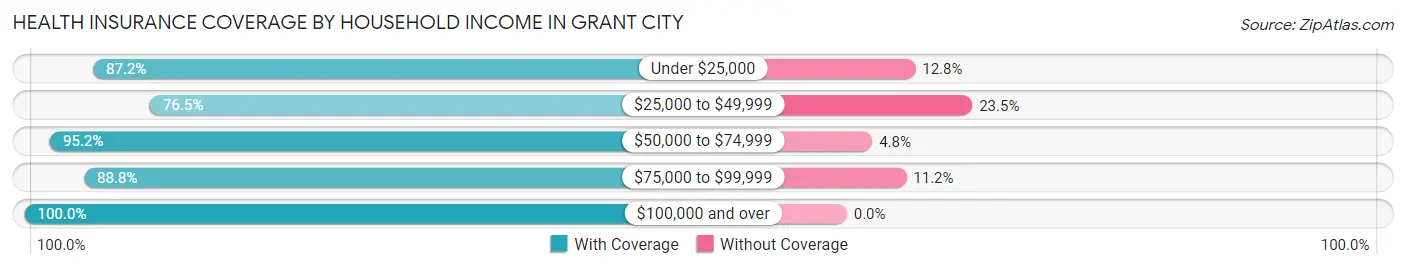
| Household Income | With Coverage | Without Coverage |
| Under $25,000 | 265 (87.2%) | 39 (12.8%) |
| $25,000 to $49,999 | 153 (76.5%) | 47 (23.5%) |
| $50,000 to $74,999 | 100 (95.2%) | 5 (4.8%) |
| $75,000 to $99,999 | 207 (88.8%) | 26 (11.2%) |
| $100,000 and over | 137 (100.0%) | 0 (0.0%) |
Public vs Private Health Insurance Coverage by Age in Grant City
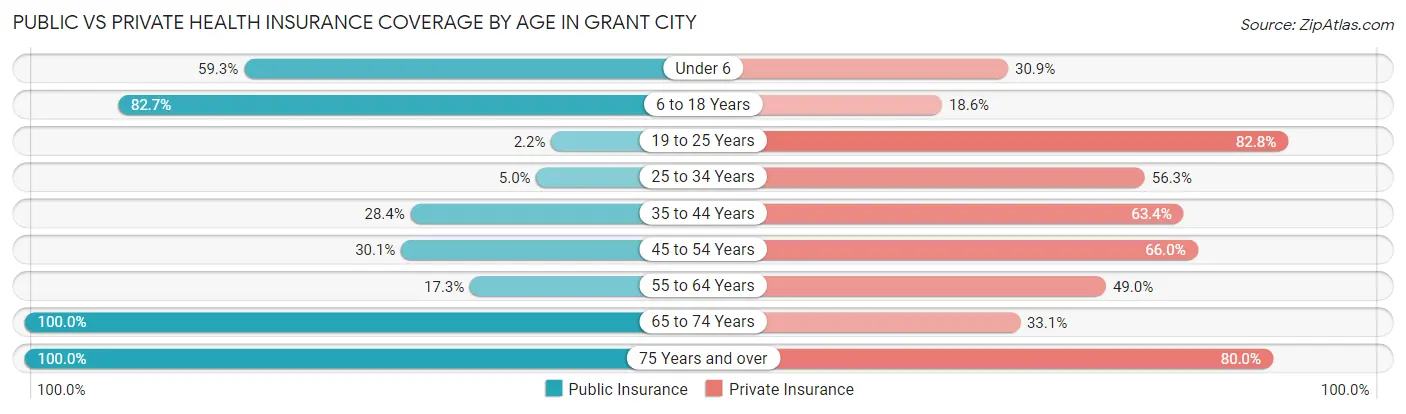
| Age Bracket | Public Insurance | Private Insurance |
| Under 6 | 48 (59.3%) | 25 (30.9%) |
| 6 to 18 Years | 129 (82.7%) | 29 (18.6%) |
| 19 to 25 Years | 3 (2.2%) | 111 (82.8%) |
| 25 to 34 Years | 4 (5.0%) | 45 (56.2%) |
| 35 to 44 Years | 38 (28.4%) | 85 (63.4%) |
| 45 to 54 Years | 31 (30.1%) | 68 (66.0%) |
| 55 to 64 Years | 18 (17.3%) | 51 (49.0%) |
| 65 to 74 Years | 127 (100.0%) | 42 (33.1%) |
| 75 Years and over | 60 (100.0%) | 48 (80.0%) |
| Total | 458 (46.8%) | 504 (51.5%) |
Disability Status by Sex by Age in Grant City
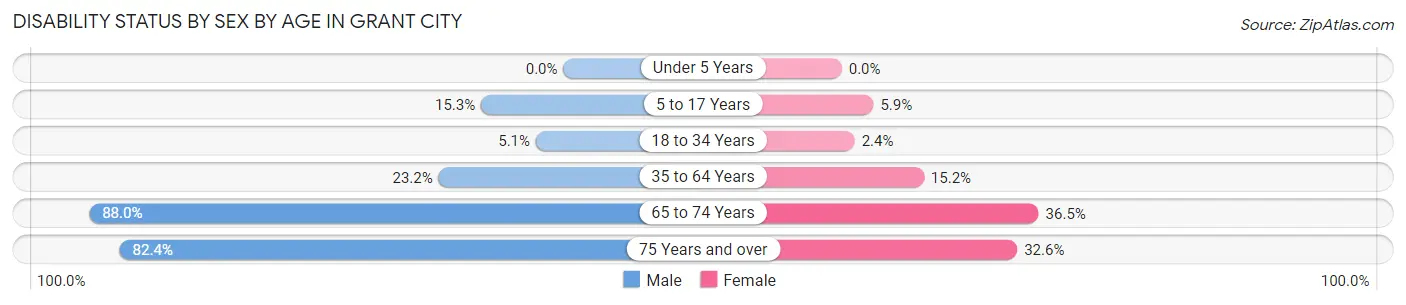
| Age Bracket | Male | Female |
| Under 5 Years | 0 (0.0%) | 0 (0.0%) |
| 5 to 17 Years | 11 (15.3%) | 5 (5.9%) |
| 18 to 34 Years | 5 (5.1%) | 3 (2.4%) |
| 35 to 64 Years | 41 (23.2%) | 25 (15.2%) |
| 65 to 74 Years | 66 (88.0%) | 19 (36.5%) |
| 75 Years and over | 14 (82.4%) | 14 (32.6%) |
Disability Class by Sex by Age in Grant City
Disability Class: Hearing Difficulty
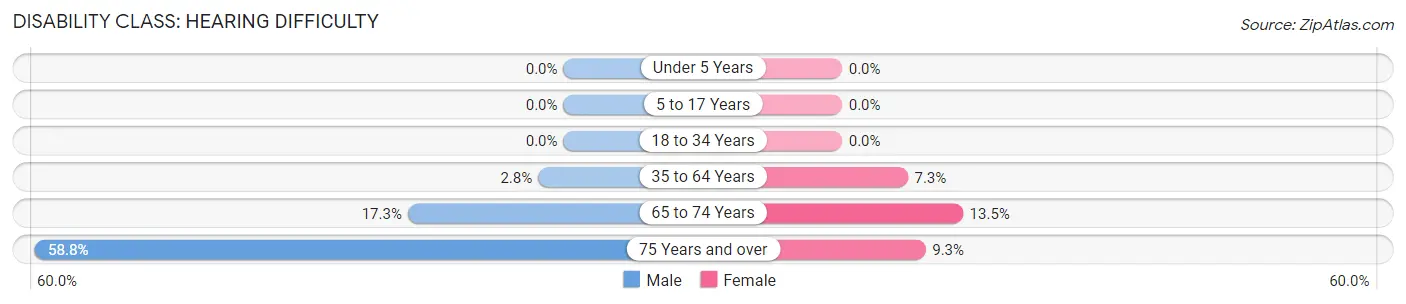
| Age Bracket | Male | Female |
| Under 5 Years | 0 (0.0%) | 0 (0.0%) |
| 5 to 17 Years | 0 (0.0%) | 0 (0.0%) |
| 18 to 34 Years | 0 (0.0%) | 0 (0.0%) |
| 35 to 64 Years | 5 (2.8%) | 12 (7.3%) |
| 65 to 74 Years | 13 (17.3%) | 7 (13.5%) |
| 75 Years and over | 10 (58.8%) | 4 (9.3%) |
Disability Class: Vision Difficulty
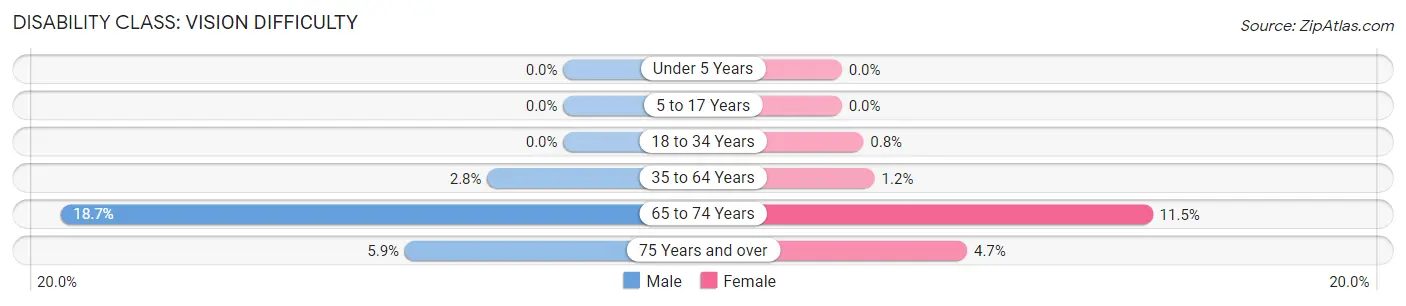
| Age Bracket | Male | Female |
| Under 5 Years | 0 (0.0%) | 0 (0.0%) |
| 5 to 17 Years | 0 (0.0%) | 0 (0.0%) |
| 18 to 34 Years | 0 (0.0%) | 1 (0.8%) |
| 35 to 64 Years | 5 (2.8%) | 2 (1.2%) |
| 65 to 74 Years | 14 (18.7%) | 6 (11.5%) |
| 75 Years and over | 1 (5.9%) | 2 (4.6%) |
Disability Class: Cognitive Difficulty
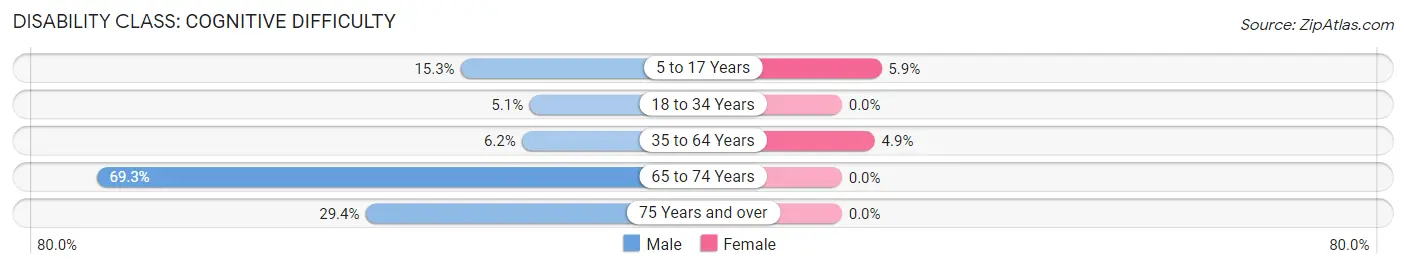
| Age Bracket | Male | Female |
| 5 to 17 Years | 11 (15.3%) | 5 (5.9%) |
| 18 to 34 Years | 5 (5.1%) | 0 (0.0%) |
| 35 to 64 Years | 11 (6.2%) | 8 (4.9%) |
| 65 to 74 Years | 52 (69.3%) | 0 (0.0%) |
| 75 Years and over | 5 (29.4%) | 0 (0.0%) |
Disability Class: Ambulatory Difficulty
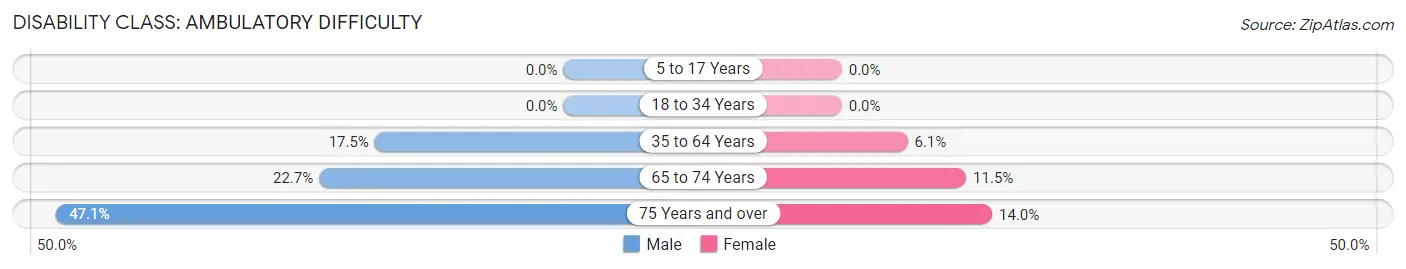
| Age Bracket | Male | Female |
| 5 to 17 Years | 0 (0.0%) | 0 (0.0%) |
| 18 to 34 Years | 0 (0.0%) | 0 (0.0%) |
| 35 to 64 Years | 31 (17.5%) | 10 (6.1%) |
| 65 to 74 Years | 17 (22.7%) | 6 (11.5%) |
| 75 Years and over | 8 (47.1%) | 6 (14.0%) |
Disability Class: Self-Care Difficulty
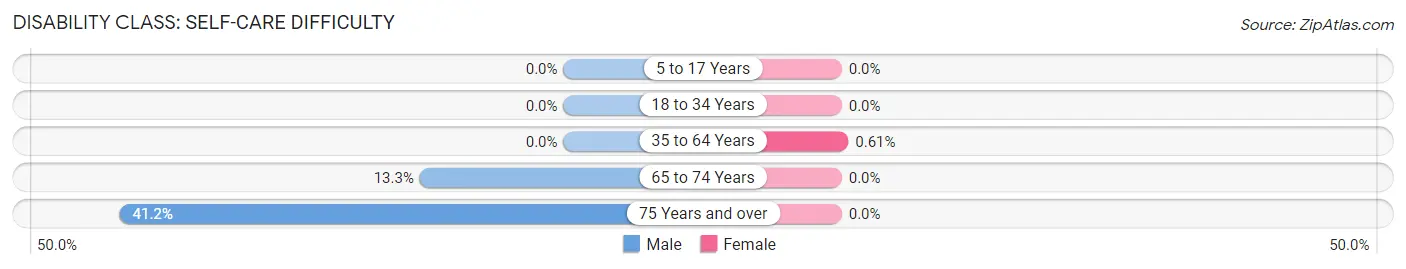
| Age Bracket | Male | Female |
| 5 to 17 Years | 0 (0.0%) | 0 (0.0%) |
| 18 to 34 Years | 0 (0.0%) | 0 (0.0%) |
| 35 to 64 Years | 0 (0.0%) | 1 (0.6%) |
| 65 to 74 Years | 10 (13.3%) | 0 (0.0%) |
| 75 Years and over | 7 (41.2%) | 0 (0.0%) |
Technology Access in Grant City
Computing Device Access in Grant City
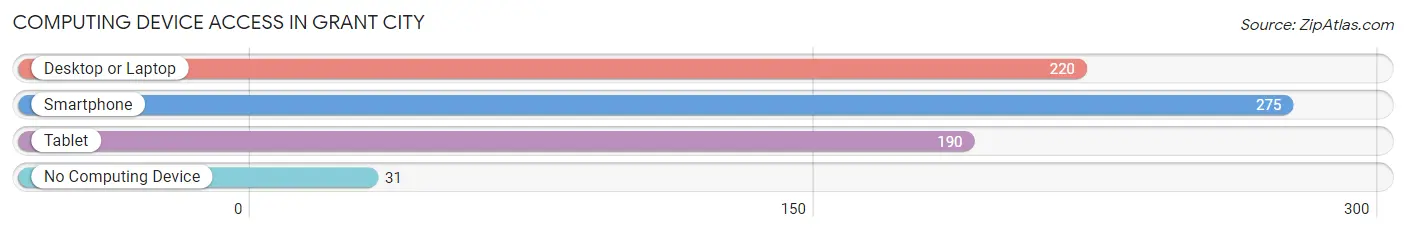
| Device Type | # Households | % Households |
| Desktop or Laptop | 220 | 62.5% |
| Smartphone | 275 | 78.1% |
| Tablet | 190 | 54.0% |
| No Computing Device | 31 | 8.8% |
| Total | 352 | 100.0% |
Internet Access in Grant City
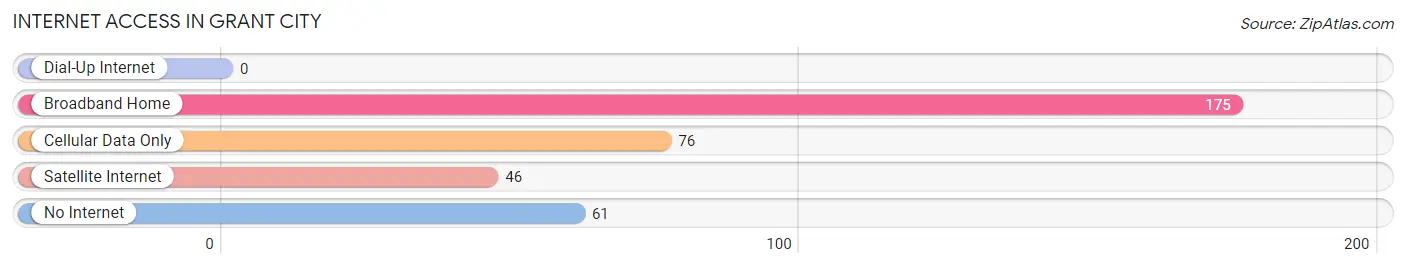
| Internet Type | # Households | % Households |
| Dial-Up Internet | 0 | 0.0% |
| Broadband Home | 175 | 49.7% |
| Cellular Data Only | 76 | 21.6% |
| Satellite Internet | 46 | 13.1% |
| No Internet | 61 | 17.3% |
| Total | 352 | 100.0% |
Grant City Summary
City of Grant City Missouri
History
The City of Grant City, Missouri is located in Worth County, Missouri. It is the county seat of Worth County and is located in the northwest corner of the state. The city was founded in 1871 and was named after Ulysses S. Grant, the 18th President of the United States. The city was originally a small farming community, but has since grown to become a thriving small town.
The city was first settled in 1871 by a group of settlers from Ohio. The settlers were attracted to the area due to its fertile soil and abundant natural resources. The first post office was established in 1872 and the town was officially incorporated in 1876.
The city has a rich history of industry and commerce. In the late 1800s, the city was home to several sawmills, gristmills, and a brickyard. The city also had a thriving agricultural industry, with many farmers growing corn, wheat, and other crops.
In the early 1900s, the city began to experience a period of growth and development. The city was home to several businesses, including a bank, a hotel, a newspaper, and a movie theater. The city also had a thriving manufacturing industry, with several factories producing furniture, clothing, and other goods.
The city experienced a period of decline in the mid-1900s, as many of the factories and businesses closed. However, the city has since experienced a resurgence in recent years, with many new businesses and industries opening in the area.
Geography
The City of Grant City is located in the northwest corner of Missouri, in Worth County. The city is situated on the banks of the Grand River, which flows through the city. The city is surrounded by rolling hills and farmland, with the nearest major city being St. Joseph, Missouri, which is located about 40 miles to the south.
The city has a total area of 1.3 square miles, all of which is land. The city has a humid continental climate, with hot, humid summers and cold, snowy winters.
Economy
The economy of Grant City is largely based on agriculture and manufacturing. The city is home to several farms, which produce corn, wheat, soybeans, and other crops. The city also has several factories, which produce furniture, clothing, and other goods.
The city also has a thriving retail sector, with several stores and restaurants located in the downtown area. The city is also home to several banks and financial institutions, which provide banking services to the local community.
Demographics
As of the 2010 census, the population of Grant City was 1,845. The population is largely white (94.3%), with small percentages of African American (2.2%), Hispanic (1.7%), and Asian (0.8%) residents. The median household income is $37,917, and the median home value is $87,400.
The city has a low unemployment rate (3.7%), and the poverty rate is 11.3%. The city is served by several public schools, including Grant City Elementary School, Grant City Middle School, and Grant City High School. The city also has several private schools, including St. Mary's Catholic School and Grant City Christian Academy.
Common Questions
What is Per Capita Income in Grant City?
Per Capita income in Grant City is $20,012.
What is the Median Family Income in Grant City?
Median Family Income in Grant City is $49,375.
What is the Median Household income in Grant City?
Median Household Income in Grant City is $36,429.
What is Income or Wage Gap in Grant City?
Income or Wage Gap in Grant City is 64.0%.
Women in Grant City earn 36.0 cents for every dollar earned by a man.
What is Inequality or Gini Index in Grant City?
Inequality or Gini Index in Grant City is 0.43.
What is the Total Population of Grant City?
Total Population of Grant City is 1,004.
What is the Total Male Population of Grant City?
Total Male Population of Grant City is 479.
What is the Total Female Population of Grant City?
Total Female Population of Grant City is 525.
What is the Ratio of Males per 100 Females in Grant City?
There are 91.24 Males per 100 Females in Grant City.
What is the Ratio of Females per 100 Males in Grant City?
There are 109.60 Females per 100 Males in Grant City.
What is the Median Population Age in Grant City?
Median Population Age in Grant City is 37.7 Years.
What is the Average Family Size in Grant City
Average Family Size in Grant City is 3.7 People.
What is the Average Household Size in Grant City
Average Household Size in Grant City is 2.8 People.
How Large is the Labor Force in Grant City?
There are 512 People in the Labor Forcein in Grant City.
What is the Percentage of People in the Labor Force in Grant City?
65.8% of People are in the Labor Force in Grant City.
What is the Unemployment Rate in Grant City?
Unemployment Rate in Grant City is 1.2%.