Gilman City, MO Map & Demographics
Gilman City Map
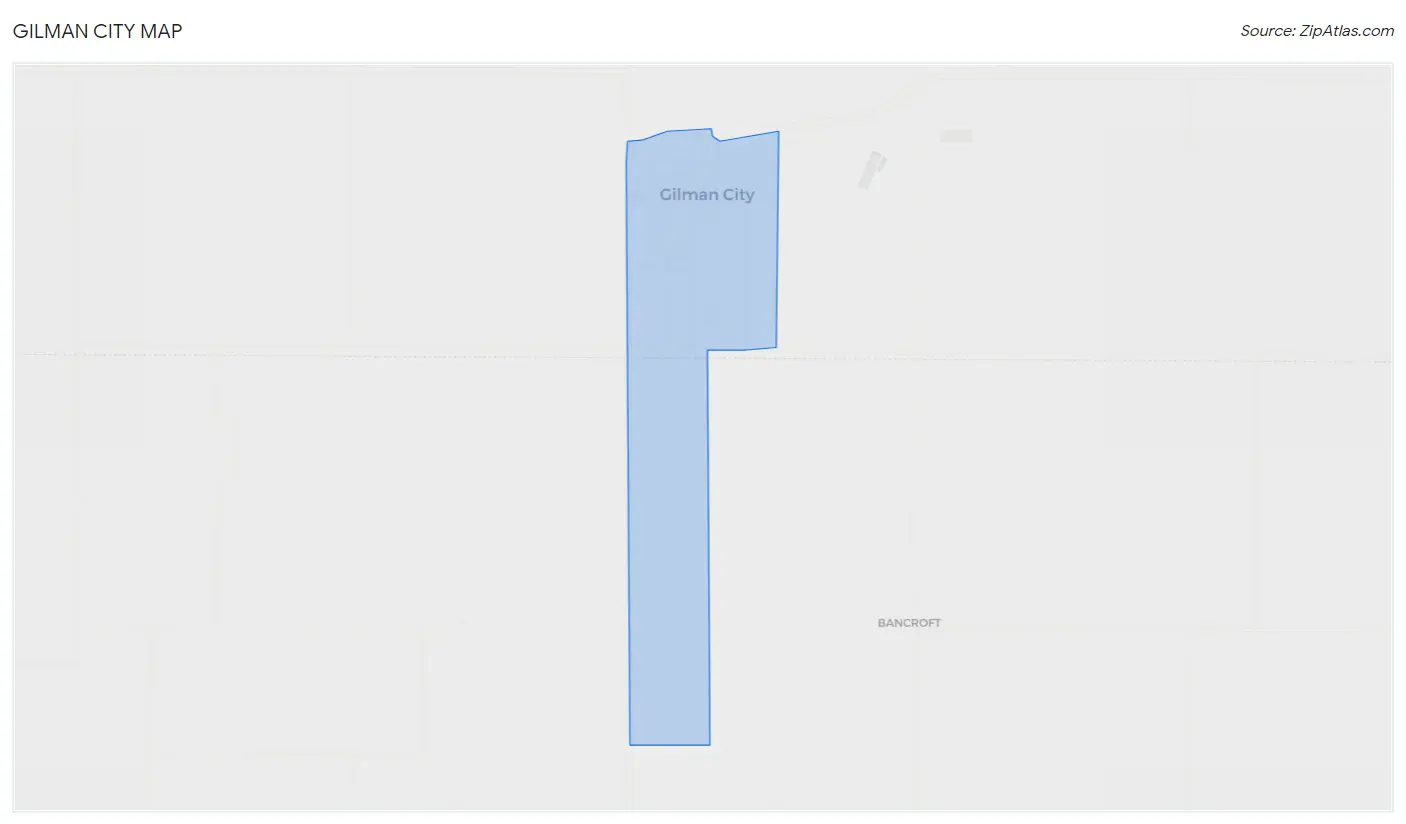
Gilman City Overview
$21,961
PER CAPITA INCOME
$62,083
AVG FAMILY INCOME
$50,714
AVG HOUSEHOLD INCOME
38.2%
WAGE / INCOME GAP [ % ]
61.8¢/ $1
WAGE / INCOME GAP [ $ ]
0.35
INEQUALITY / GINI INDEX
412
TOTAL POPULATION
210
MALE POPULATION
202
FEMALE POPULATION
103.96
MALES / 100 FEMALES
96.19
FEMALES / 100 MALES
42.1
MEDIAN AGE
3.4
AVG FAMILY SIZE
2.8
AVG HOUSEHOLD SIZE
172
LABOR FORCE [ PEOPLE ]
54.1%
PERCENT IN LABOR FORCE
1.7%
UNEMPLOYMENT RATE
Gilman City Zip Codes
Gilman City Area Codes
Income in Gilman City
Income Overview in Gilman City
Per Capita Income in Gilman City is $21,961, while median incomes of families and households are $62,083 and $50,714 respectively.
| Characteristic | Number | Measure |
| Per Capita Income | 412 | $21,961 |
| Median Family Income | 95 | $62,083 |
| Mean Family Income | 95 | $66,709 |
| Median Household Income | 148 | $50,714 |
| Mean Household Income | 148 | $54,890 |
| Income Deficit | 95 | $0 |
| Wage / Income Gap (%) | 412 | 38.23% |
| Wage / Income Gap ($) | 412 | 61.77¢ per $1 |
| Gini / Inequality Index | 412 | 0.35 |
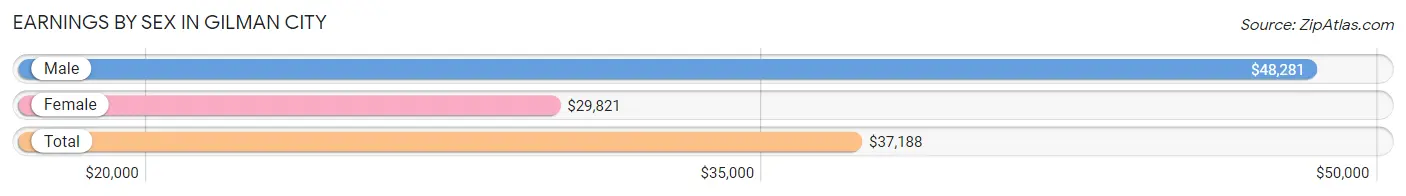
Earnings by Sex in Gilman City
Average Earnings in Gilman City are $37,188, $48,281 for men and $29,821 for women, a difference of 38.2%.
| Sex | Number | Average Earnings |
| Male | 97 (53.9%) | $48,281 |
| Female | 83 (46.1%) | $29,821 |
| Total | 180 (100.0%) | $37,188 |
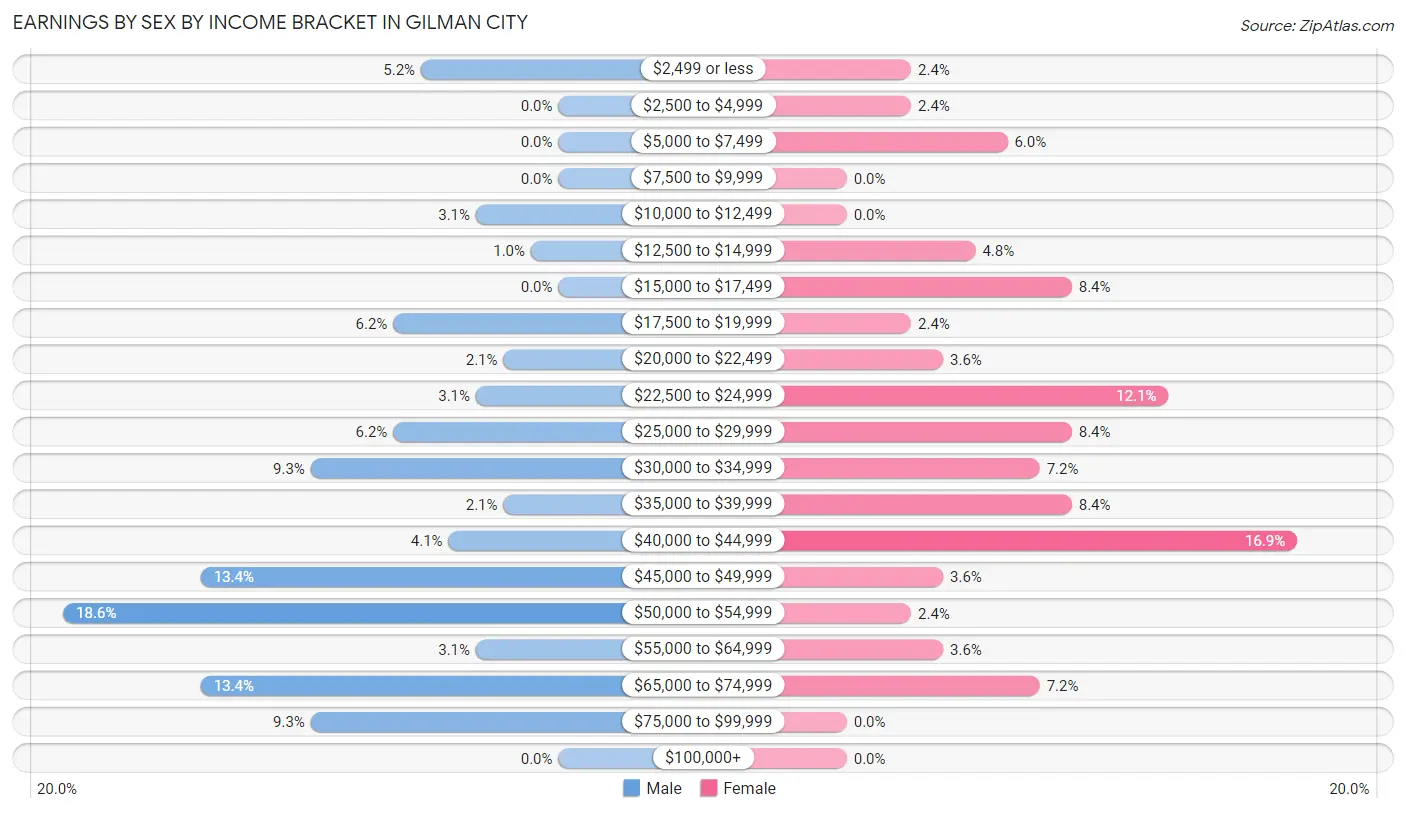
Earnings by Sex by Income Bracket in Gilman City
The most common earnings brackets in Gilman City are $50,000 to $54,999 for men (18 | 18.6%) and $40,000 to $44,999 for women (14 | 16.9%).
| Income | Male | Female |
| $2,499 or less | 5 (5.1%) | 2 (2.4%) |
| $2,500 to $4,999 | 0 (0.0%) | 2 (2.4%) |
| $5,000 to $7,499 | 0 (0.0%) | 5 (6.0%) |
| $7,500 to $9,999 | 0 (0.0%) | 0 (0.0%) |
| $10,000 to $12,499 | 3 (3.1%) | 0 (0.0%) |
| $12,500 to $14,999 | 1 (1.0%) | 4 (4.8%) |
| $15,000 to $17,499 | 0 (0.0%) | 7 (8.4%) |
| $17,500 to $19,999 | 6 (6.2%) | 2 (2.4%) |
| $20,000 to $22,499 | 2 (2.1%) | 3 (3.6%) |
| $22,500 to $24,999 | 3 (3.1%) | 10 (12.0%) |
| $25,000 to $29,999 | 6 (6.2%) | 7 (8.4%) |
| $30,000 to $34,999 | 9 (9.3%) | 6 (7.2%) |
| $35,000 to $39,999 | 2 (2.1%) | 7 (8.4%) |
| $40,000 to $44,999 | 4 (4.1%) | 14 (16.9%) |
| $45,000 to $49,999 | 13 (13.4%) | 3 (3.6%) |
| $50,000 to $54,999 | 18 (18.6%) | 2 (2.4%) |
| $55,000 to $64,999 | 3 (3.1%) | 3 (3.6%) |
| $65,000 to $74,999 | 13 (13.4%) | 6 (7.2%) |
| $75,000 to $99,999 | 9 (9.3%) | 0 (0.0%) |
| $100,000+ | 0 (0.0%) | 0 (0.0%) |
| Total | 97 (100.0%) | 83 (100.0%) |
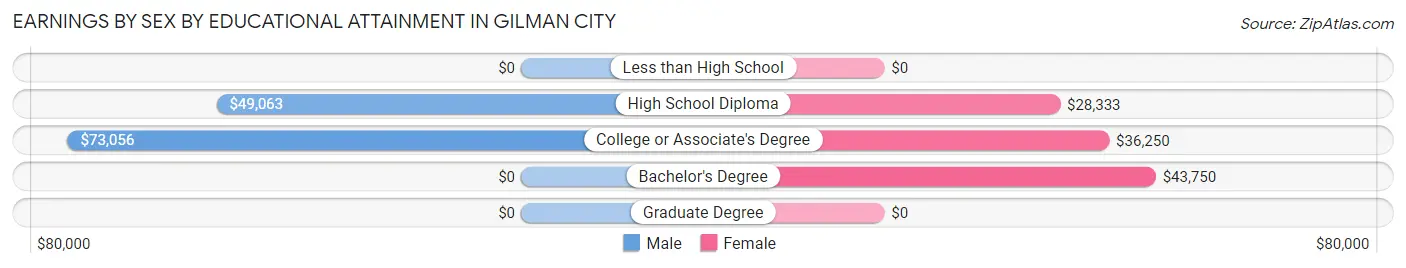
Earnings by Sex by Educational Attainment in Gilman City
Average earnings in Gilman City are $50,000 for men and $35,000 for women, a difference of 30.0%. Men with an educational attainment of college or associate's degree enjoy the highest average annual earnings of $73,056, while those with high school diploma education earn the least with $49,063. Women with an educational attainment of bachelor's degree earn the most with the average annual earnings of $43,750, while those with high school diploma education have the smallest earnings of $28,333.
| Educational Attainment | Male Income | Female Income |
| Less than High School | - | - |
| High School Diploma | $49,063 | $28,333 |
| College or Associate's Degree | $73,056 | $36,250 |
| Bachelor's Degree | - | - |
| Graduate Degree | - | - |
| Total | $50,000 | $35,000 |
Family Income in Gilman City
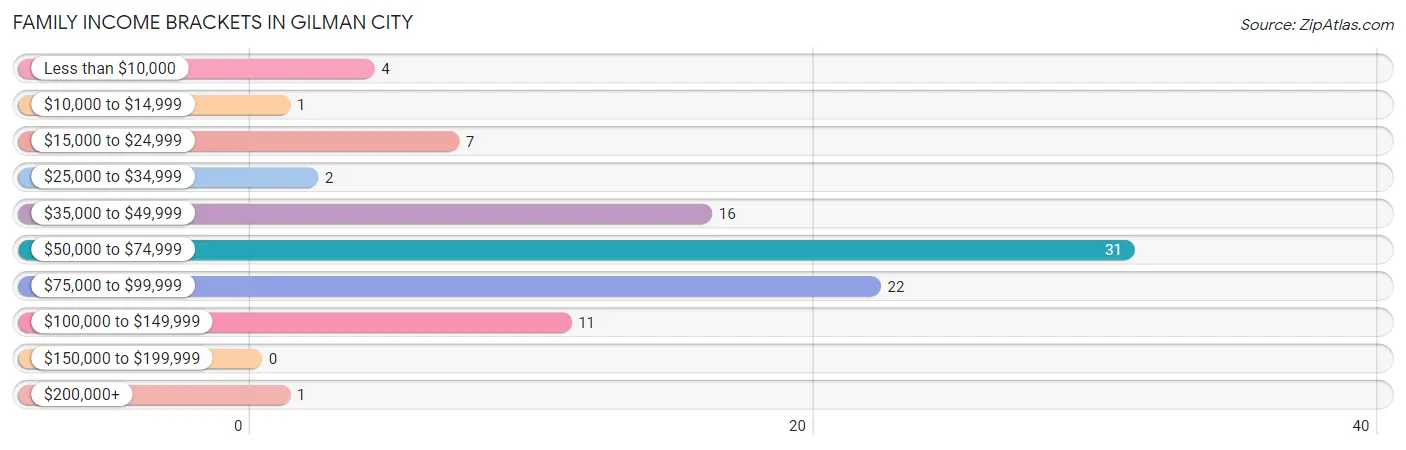
Family Income Brackets in Gilman City
According to the Gilman City family income data, there are 31 families falling into the $50,000 to $74,999 income range, which is the most common income bracket and makes up 32.6% of all families.
| Income Bracket | # Families | % Families |
| Less than $10,000 | 4 | 4.2% |
| $10,000 to $14,999 | 1 | 1.1% |
| $15,000 to $24,999 | 7 | 7.4% |
| $25,000 to $34,999 | 2 | 2.1% |
| $35,000 to $49,999 | 16 | 16.8% |
| $50,000 to $74,999 | 31 | 32.6% |
| $75,000 to $99,999 | 22 | 23.2% |
| $100,000 to $149,999 | 11 | 11.6% |
| $150,000 to $199,999 | 0 | 0.0% |
| $200,000+ | 1 | 1.1% |
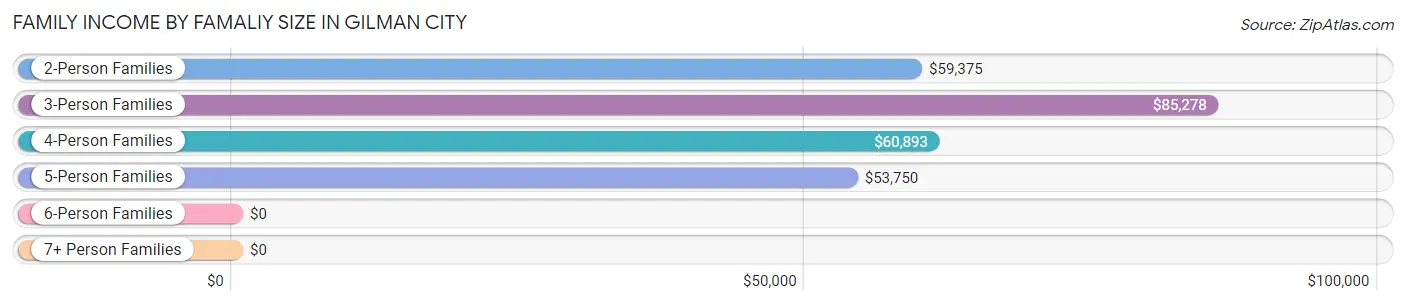
Family Income by Famaliy Size in Gilman City
3-person families (20 | 21.0%) account for the highest median family income in Gilman City with $85,278 per family, while 2-person families (43 | 45.3%) have the highest median income of $29,688 per family member.
| Income Bracket | # Families | Median Income |
| 2-Person Families | 43 (45.3%) | $59,375 |
| 3-Person Families | 20 (21.0%) | $85,278 |
| 4-Person Families | 23 (24.2%) | $60,893 |
| 5-Person Families | 6 (6.3%) | $53,750 |
| 6-Person Families | 3 (3.2%) | $0 |
| 7+ Person Families | 0 (0.0%) | $0 |
| Total | 95 (100.0%) | $62,083 |
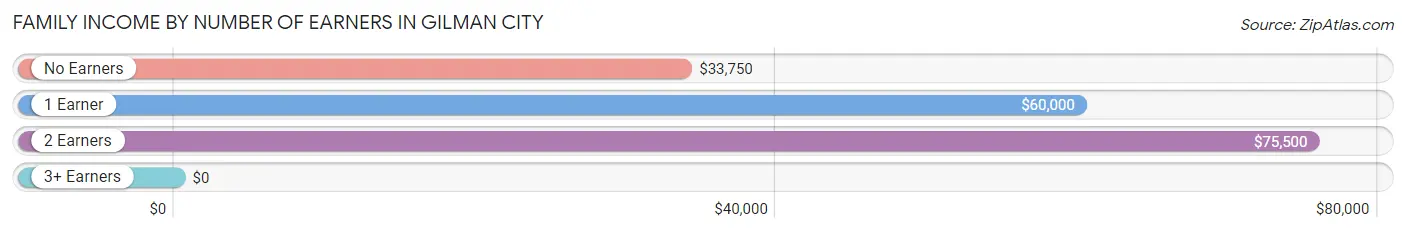
Family Income by Number of Earners in Gilman City
| Number of Earners | # Families | Median Income |
| No Earners | 7 (7.4%) | $33,750 |
| 1 Earner | 46 (48.4%) | $60,000 |
| 2 Earners | 40 (42.1%) | $75,500 |
| 3+ Earners | 2 (2.1%) | $0 |
| Total | 95 (100.0%) | $62,083 |
Household Income in Gilman City
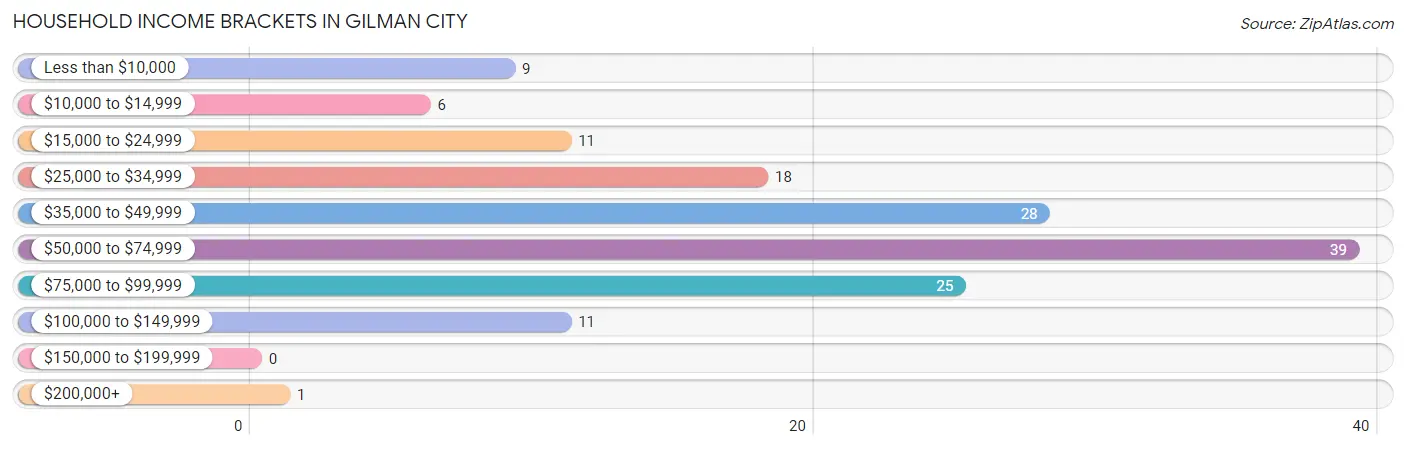
Household Income Brackets in Gilman City
With 39 households falling in the category, the $50,000 to $74,999 income range is the most frequent in Gilman City, accounting for 26.4% of all households.
| Income Bracket | # Households | % Households |
| Less than $10,000 | 9 | 6.1% |
| $10,000 to $14,999 | 6 | 4.1% |
| $15,000 to $24,999 | 11 | 7.4% |
| $25,000 to $34,999 | 18 | 12.2% |
| $35,000 to $49,999 | 28 | 18.9% |
| $50,000 to $74,999 | 39 | 26.4% |
| $75,000 to $99,999 | 25 | 16.9% |
| $100,000 to $149,999 | 11 | 7.4% |
| $150,000 to $199,999 | 0 | 0.0% |
| $200,000+ | 1 | 0.7% |
Household Income by Householder Age in Gilman City
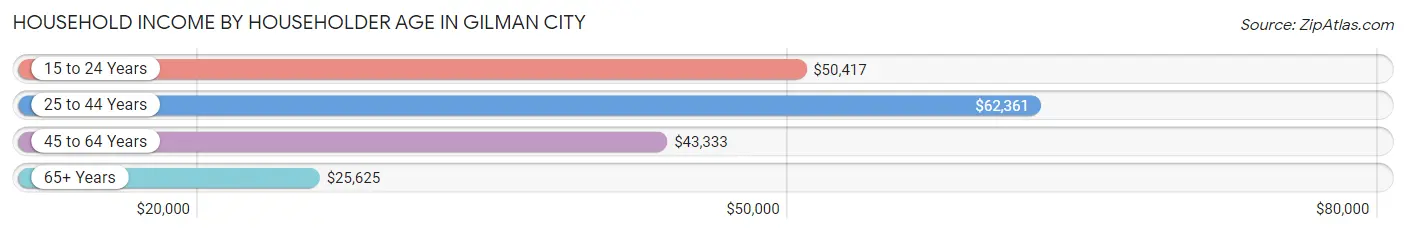
The median household income in Gilman City is $50,714, with the highest median household income of $62,361 found in the 25 to 44 years age bracket for the primary householder. A total of 47 households (31.8%) fall into this category. Meanwhile, the 65+ years age bracket for the primary householder has the lowest median household income of $25,625, with 29 households (19.6%) in this group.
| Income Bracket | # Households | Median Income |
| 15 to 24 Years | 10 (6.8%) | $50,417 |
| 25 to 44 Years | 47 (31.8%) | $62,361 |
| 45 to 64 Years | 62 (41.9%) | $43,333 |
| 65+ Years | 29 (19.6%) | $25,625 |
| Total | 148 (100.0%) | $50,714 |
Poverty in Gilman City
Income Below Poverty by Sex and Age in Gilman City
With 11.0% poverty level for males and 20.8% for females among the residents of Gilman City, 45 to 54 year old males and 65 to 74 year old females are the most vulnerable to poverty, with 16 males (43.2%) and 9 females (50.0%) in their respective age groups living below the poverty level.
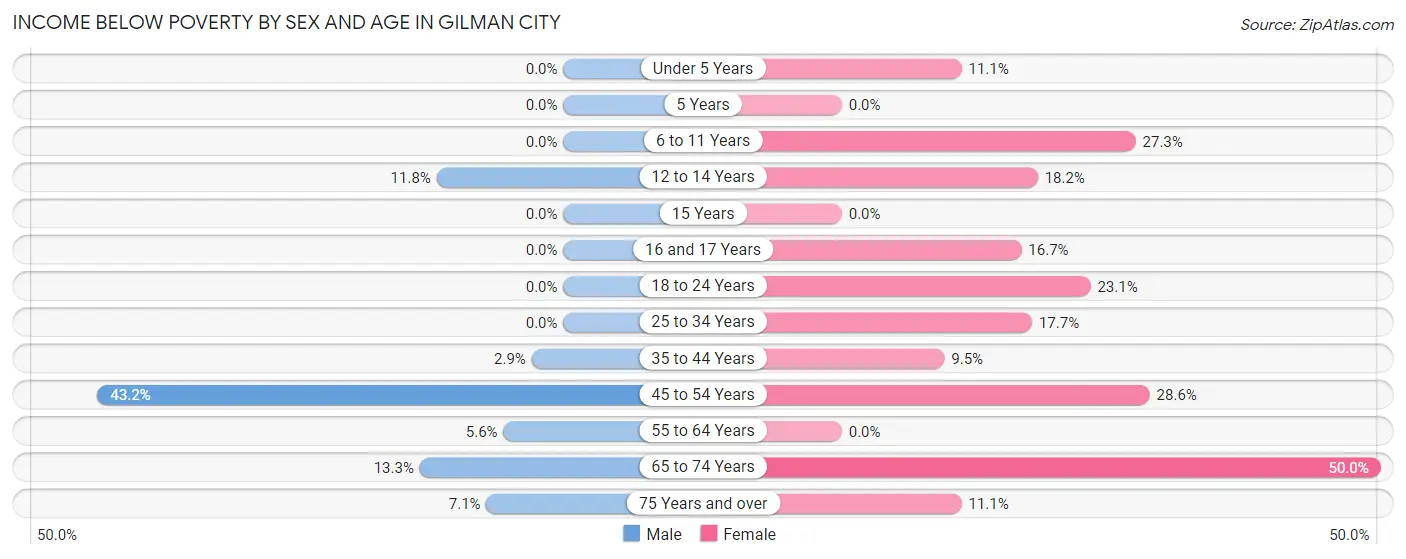
| Age Bracket | Male | Female |
| Under 5 Years | 0 (0.0%) | 1 (11.1%) |
| 5 Years | 0 (0.0%) | 0 (0.0%) |
| 6 to 11 Years | 0 (0.0%) | 6 (27.3%) |
| 12 to 14 Years | 2 (11.8%) | 4 (18.2%) |
| 15 Years | 0 (0.0%) | 0 (0.0%) |
| 16 and 17 Years | 0 (0.0%) | 1 (16.7%) |
| 18 to 24 Years | 0 (0.0%) | 3 (23.1%) |
| 25 to 34 Years | 0 (0.0%) | 3 (17.6%) |
| 35 to 44 Years | 1 (2.9%) | 2 (9.5%) |
| 45 to 54 Years | 16 (43.2%) | 12 (28.6%) |
| 55 to 64 Years | 1 (5.6%) | 0 (0.0%) |
| 65 to 74 Years | 2 (13.3%) | 9 (50.0%) |
| 75 Years and over | 1 (7.1%) | 1 (11.1%) |
| Total | 23 (11.0%) | 42 (20.8%) |
Income Above Poverty by Sex and Age in Gilman City
According to the poverty statistics in Gilman City, males aged under 5 years and females aged 15 years are the age groups that are most secure financially, with 100.0% of males and 100.0% of females in these age groups living above the poverty line.
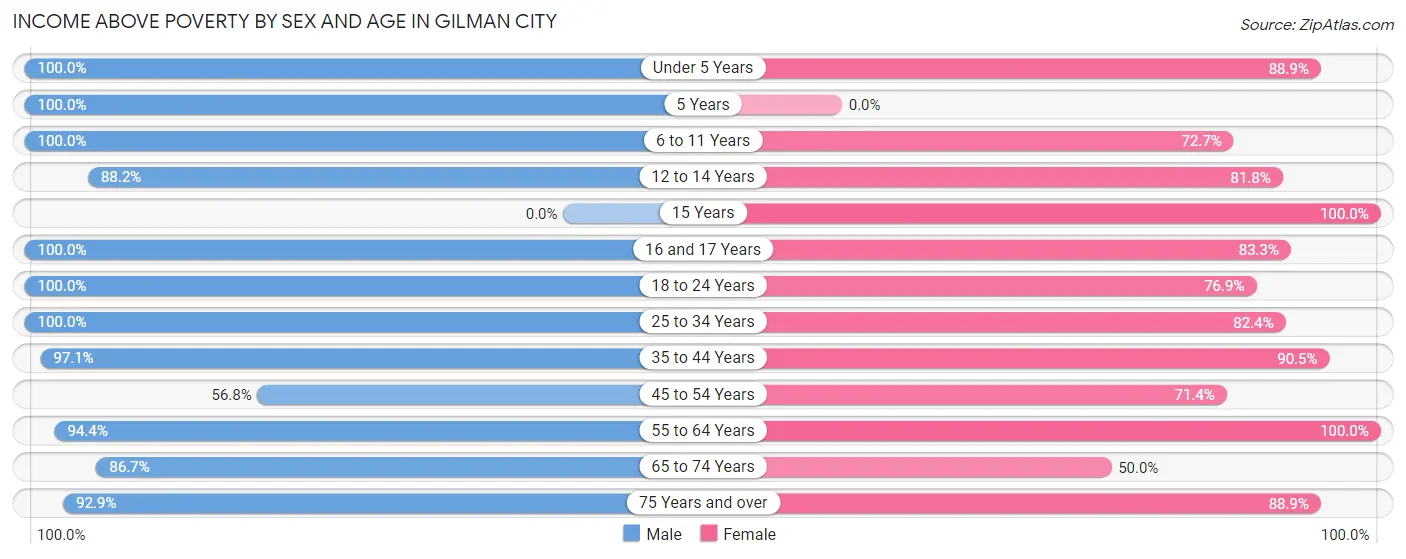
| Age Bracket | Male | Female |
| Under 5 Years | 9 (100.0%) | 8 (88.9%) |
| 5 Years | 8 (100.0%) | 0 (0.0%) |
| 6 to 11 Years | 2 (100.0%) | 16 (72.7%) |
| 12 to 14 Years | 15 (88.2%) | 18 (81.8%) |
| 15 Years | 0 (0.0%) | 4 (100.0%) |
| 16 and 17 Years | 6 (100.0%) | 5 (83.3%) |
| 18 to 24 Years | 30 (100.0%) | 10 (76.9%) |
| 25 to 34 Years | 19 (100.0%) | 14 (82.4%) |
| 35 to 44 Years | 33 (97.1%) | 19 (90.5%) |
| 45 to 54 Years | 21 (56.8%) | 30 (71.4%) |
| 55 to 64 Years | 17 (94.4%) | 19 (100.0%) |
| 65 to 74 Years | 13 (86.7%) | 9 (50.0%) |
| 75 Years and over | 13 (92.9%) | 8 (88.9%) |
| Total | 186 (89.0%) | 160 (79.2%) |
Income Below Poverty Among Married-Couple Families in Gilman City
The poverty statistics for married-couple families in Gilman City show that 4.4% or 3 of the total 68 families live below the poverty line. Families with 1 or 2 children have the highest poverty rate of 9.1%, comprising of 2 families. On the other hand, families with 3 or 4 children have the lowest poverty rate of 0.0%, which includes 0 families.
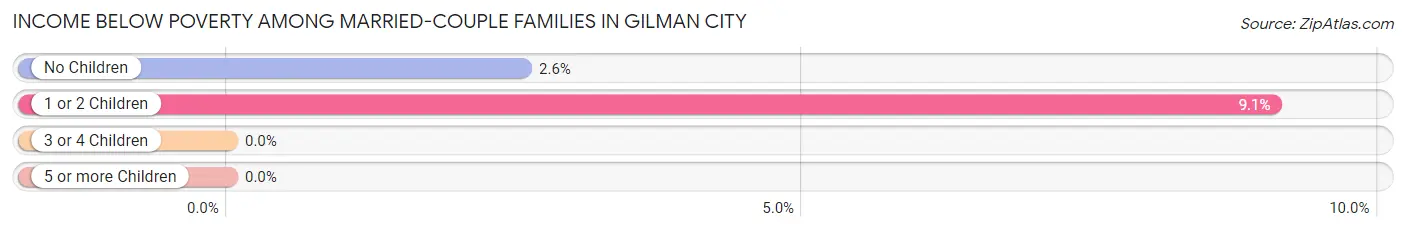
| Children | Above Poverty | Below Poverty |
| No Children | 38 (97.4%) | 1 (2.6%) |
| 1 or 2 Children | 20 (90.9%) | 2 (9.1%) |
| 3 or 4 Children | 7 (100.0%) | 0 (0.0%) |
| 5 or more Children | 0 (0.0%) | 0 (0.0%) |
| Total | 65 (95.6%) | 3 (4.4%) |
Income Below Poverty Among Single-Parent Households in Gilman City
According to the poverty data in Gilman City, 7.7% or 1 single-father households and 42.9% or 6 single-mother households are living below the poverty line. Among single-father households, those with 1 or 2 children have the highest poverty rate, with 1 households (25.0%) experiencing poverty. Likewise, among single-mother households, those with 1 or 2 children have the highest poverty rate, with 6 households (75.0%) falling below the poverty line.
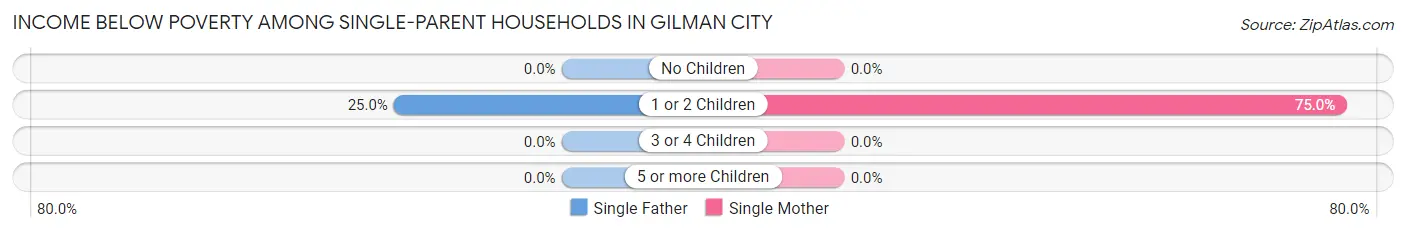
| Children | Single Father | Single Mother |
| No Children | 0 (0.0%) | 0 (0.0%) |
| 1 or 2 Children | 1 (25.0%) | 6 (75.0%) |
| 3 or 4 Children | 0 (0.0%) | 0 (0.0%) |
| 5 or more Children | 0 (0.0%) | 0 (0.0%) |
| Total | 1 (7.7%) | 6 (42.9%) |
Income Below Poverty Among Married-Couple vs Single-Parent Households in Gilman City
The poverty data for Gilman City shows that 3 of the married-couple family households (4.4%) and 7 of the single-parent households (25.9%) are living below the poverty level. Within the married-couple family households, those with 1 or 2 children have the highest poverty rate, with 2 households (9.1%) falling below the poverty line. Among the single-parent households, those with 1 or 2 children have the highest poverty rate, with 7 household (58.3%) living below poverty.
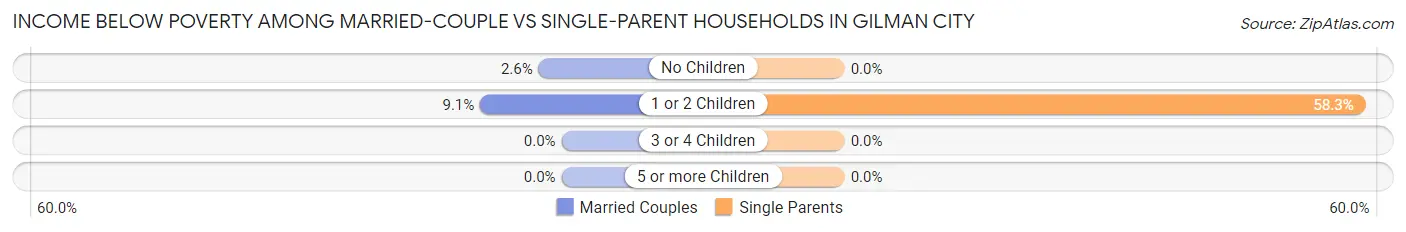
| Children | Married-Couple Families | Single-Parent Households |
| No Children | 1 (2.6%) | 0 (0.0%) |
| 1 or 2 Children | 2 (9.1%) | 7 (58.3%) |
| 3 or 4 Children | 0 (0.0%) | 0 (0.0%) |
| 5 or more Children | 0 (0.0%) | 0 (0.0%) |
| Total | 3 (4.4%) | 7 (25.9%) |
Race in Gilman City
The most populous races in Gilman City are White / Caucasian (367 | 89.1%), Hispanic or Latino (45 | 10.9%), and Two or more Races (41 | 10.0%).
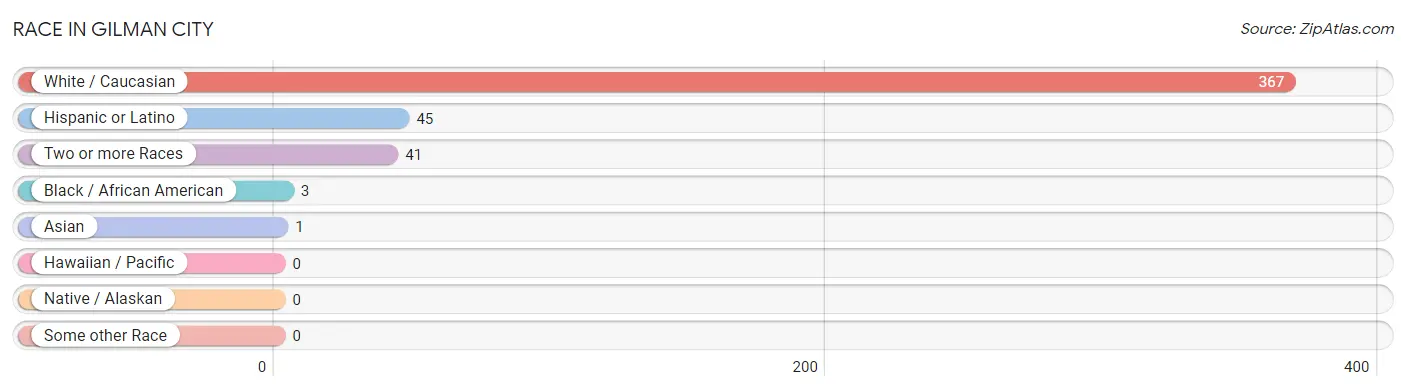
| Race | # Population | % Population |
| Asian | 1 | 0.2% |
| Black / African American | 3 | 0.7% |
| Hawaiian / Pacific | 0 | 0.0% |
| Hispanic or Latino | 45 | 10.9% |
| Native / Alaskan | 0 | 0.0% |
| White / Caucasian | 367 | 89.1% |
| Two or more Races | 41 | 10.0% |
| Some other Race | 0 | 0.0% |
| Total | 412 | 100.0% |
Ancestry in Gilman City
The most populous ancestries reported in Gilman City are German (79 | 19.2%), American (64 | 15.5%), Mexican (45 | 10.9%), English (42 | 10.2%), and Russian (40 | 9.7%), together accounting for 65.5% of all Gilman City residents.
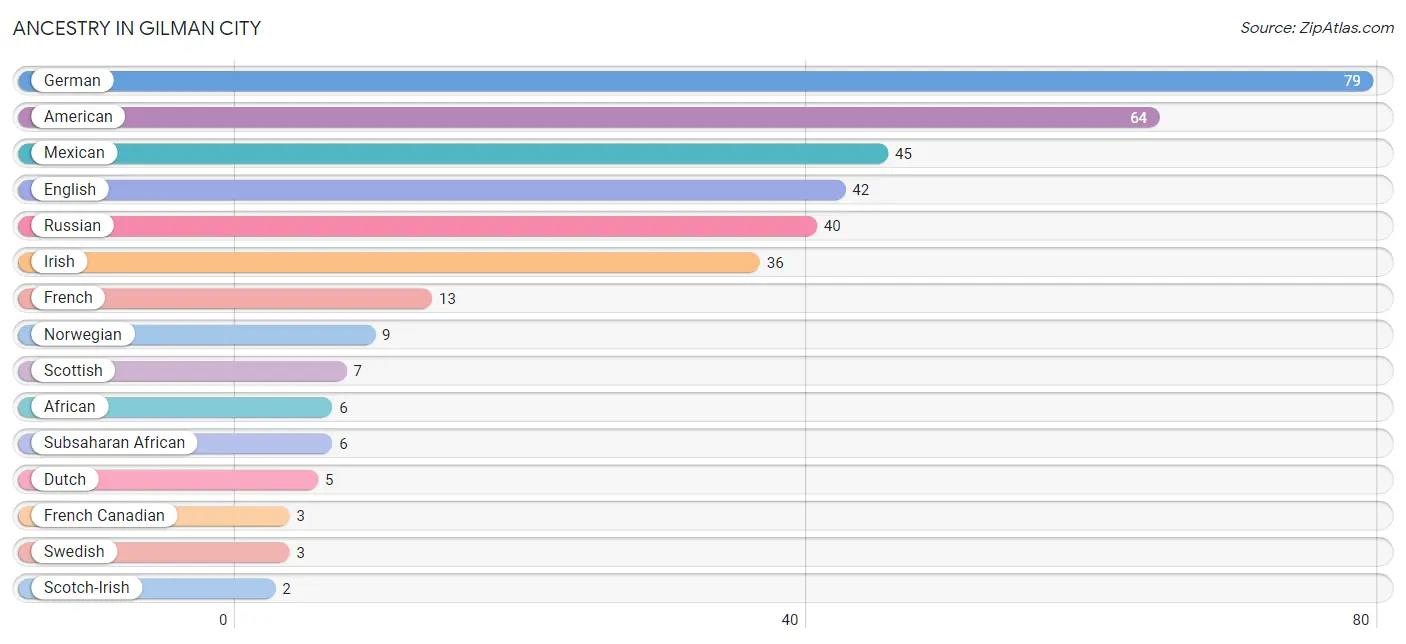
| Ancestry | # Population | % Population |
| African | 6 | 1.5% |
| American | 64 | 15.5% |
| Cherokee | 1 | 0.2% |
| Dutch | 5 | 1.2% |
| English | 42 | 10.2% |
| French | 13 | 3.2% |
| French Canadian | 3 | 0.7% |
| German | 79 | 19.2% |
| Irish | 36 | 8.7% |
| Mexican | 45 | 10.9% |
| Norwegian | 9 | 2.2% |
| Russian | 40 | 9.7% |
| Scotch-Irish | 2 | 0.5% |
| Scottish | 7 | 1.7% |
| Sri Lankan | 1 | 0.2% |
| Subsaharan African | 6 | 1.5% |
| Swedish | 3 | 0.7% | View All 17 Rows |
Immigrants in Gilman City
The most numerous immigrant groups reported in Gilman City came from Central America (14 | 3.4%), Latin America (14 | 3.4%), Mexico (14 | 3.4%), Asia (1 | 0.2%), and South Eastern Asia (1 | 0.2%), together accounting for 10.7% of all Gilman City residents.
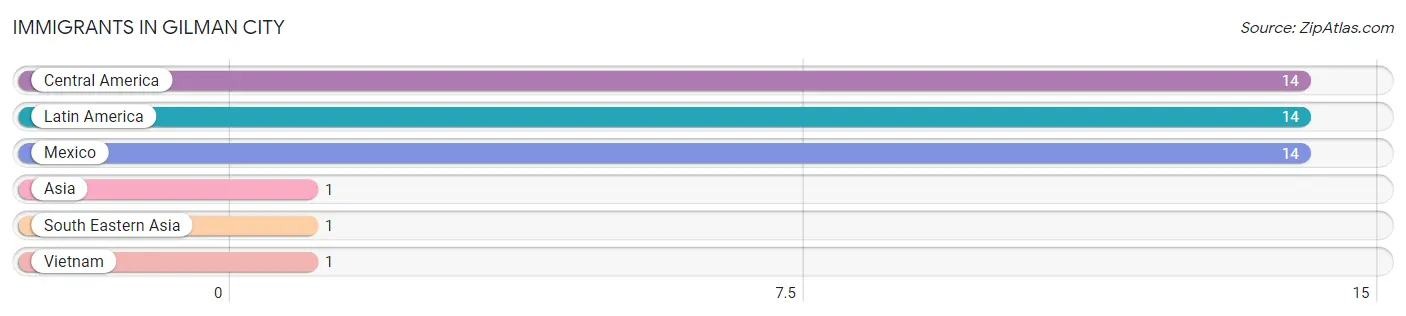
| Immigration Origin | # Population | % Population |
| Asia | 1 | 0.2% |
| Central America | 14 | 3.4% |
| Latin America | 14 | 3.4% |
| Mexico | 14 | 3.4% |
| South Eastern Asia | 1 | 0.2% |
| Vietnam | 1 | 0.2% | View All 6 Rows |
Sex and Age in Gilman City
Sex and Age in Gilman City
The most populous age groups in Gilman City are 40 to 44 Years (31 | 14.8%) for men and 45 to 49 Years (34 | 16.8%) for women.
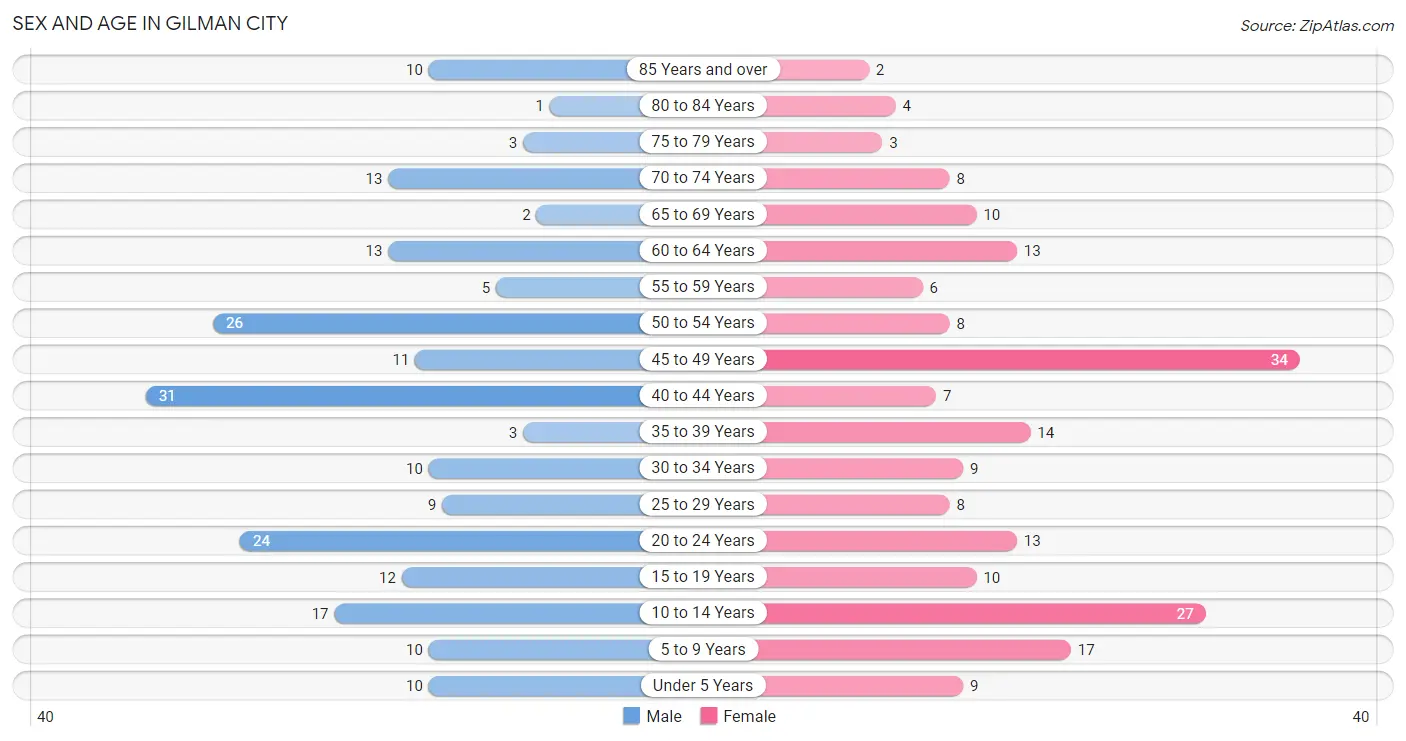
| Age Bracket | Male | Female |
| Under 5 Years | 10 (4.8%) | 9 (4.5%) |
| 5 to 9 Years | 10 (4.8%) | 17 (8.4%) |
| 10 to 14 Years | 17 (8.1%) | 27 (13.4%) |
| 15 to 19 Years | 12 (5.7%) | 10 (5.0%) |
| 20 to 24 Years | 24 (11.4%) | 13 (6.4%) |
| 25 to 29 Years | 9 (4.3%) | 8 (4.0%) |
| 30 to 34 Years | 10 (4.8%) | 9 (4.5%) |
| 35 to 39 Years | 3 (1.4%) | 14 (6.9%) |
| 40 to 44 Years | 31 (14.8%) | 7 (3.5%) |
| 45 to 49 Years | 11 (5.2%) | 34 (16.8%) |
| 50 to 54 Years | 26 (12.4%) | 8 (4.0%) |
| 55 to 59 Years | 5 (2.4%) | 6 (3.0%) |
| 60 to 64 Years | 13 (6.2%) | 13 (6.4%) |
| 65 to 69 Years | 2 (0.9%) | 10 (5.0%) |
| 70 to 74 Years | 13 (6.2%) | 8 (4.0%) |
| 75 to 79 Years | 3 (1.4%) | 3 (1.5%) |
| 80 to 84 Years | 1 (0.5%) | 4 (2.0%) |
| 85 Years and over | 10 (4.8%) | 2 (1.0%) |
| Total | 210 (100.0%) | 202 (100.0%) |
Families and Households in Gilman City
Median Family Size in Gilman City
The median family size in Gilman City is 3.38 persons per family, with single male/father families (13 | 13.7%) accounting for the largest median family size of 4.38 persons per family. On the other hand, married-couple families (68 | 71.6%) represent the smallest median family size with 3.15 persons per family.
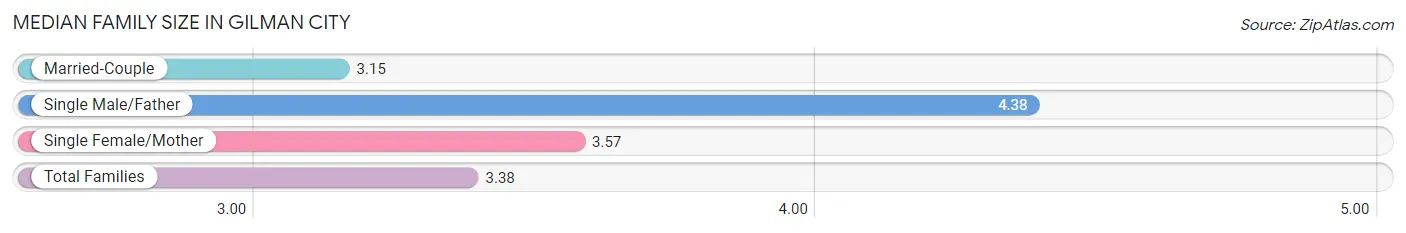
| Family Type | # Families | Family Size |
| Married-Couple | 68 (71.6%) | 3.15 |
| Single Male/Father | 13 (13.7%) | 4.38 |
| Single Female/Mother | 14 (14.7%) | 3.57 |
| Total Families | 95 (100.0%) | 3.38 |
Median Household Size in Gilman City
The median household size in Gilman City is 2.78 persons per household, with single male/father households (13 | 8.8%) accounting for the largest median household size of 4.69 persons per household. non-family households (53 | 35.8%) represent the smallest median household size with 1.62 persons per household.
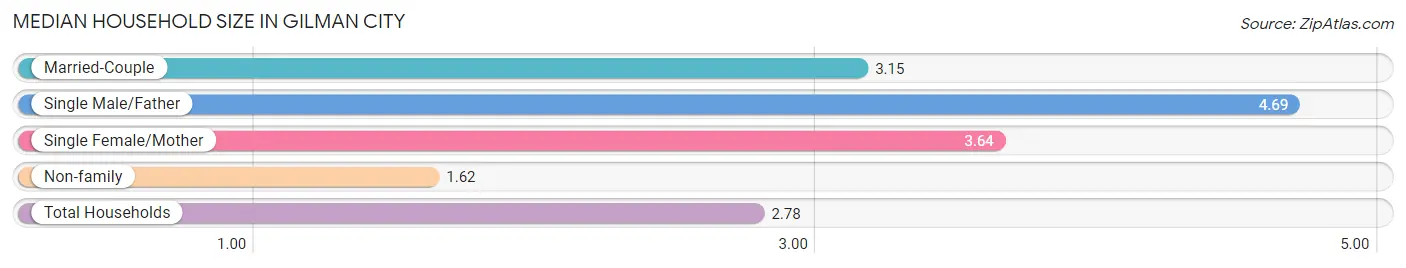
| Household Type | # Households | Household Size |
| Married-Couple | 68 (46.0%) | 3.15 |
| Single Male/Father | 13 (8.8%) | 4.69 |
| Single Female/Mother | 14 (9.5%) | 3.64 |
| Non-family | 53 (35.8%) | 1.62 |
| Total Households | 148 (100.0%) | 2.78 |
Household Size by Marriage Status in Gilman City
Out of a total of 148 households in Gilman City, 95 (64.2%) are family households, while 53 (35.8%) are nonfamily households. The most numerous type of family households are 2-person households, comprising 42, and the most common type of nonfamily households are 1-person households, comprising 35.
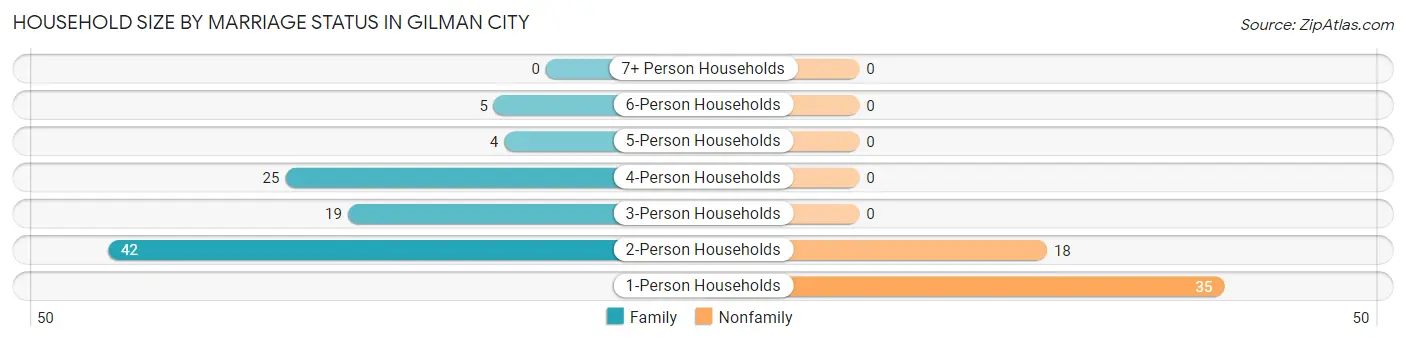
| Household Size | Family Households | Nonfamily Households |
| 1-Person Households | - | 35 (23.6%) |
| 2-Person Households | 42 (28.4%) | 18 (12.2%) |
| 3-Person Households | 19 (12.8%) | 0 (0.0%) |
| 4-Person Households | 25 (16.9%) | 0 (0.0%) |
| 5-Person Households | 4 (2.7%) | 0 (0.0%) |
| 6-Person Households | 5 (3.4%) | 0 (0.0%) |
| 7+ Person Households | 0 (0.0%) | 0 (0.0%) |
| Total | 95 (64.2%) | 53 (35.8%) |
Female Fertility in Gilman City
Fertility by Age in Gilman City
| Age Bracket | Women with Births | Births / 1,000 Women |
| 15 to 19 years | 0 (0.0%) | 0.0 |
| 20 to 34 years | 0 (0.0%) | 0.0 |
| 35 to 50 years | 0 (0.0%) | 0.0 |
| Total | 0 (0.0%) | 0.0 |
Fertility by Age by Marriage Status in Gilman City
| Age Bracket | Married | Unmarried |
| 15 to 19 years | 0 (0.0%) | 0 (0.0%) |
| 20 to 34 years | 0 (0.0%) | 0 (0.0%) |
| 35 to 50 years | 0 (0.0%) | 0 (0.0%) |
| Total | 0 (0.0%) | 0 (0.0%) |
Fertility by Education in Gilman City
| Educational Attainment | Women with Births | Births / 1,000 Women |
| Less than High School | 0 (0.0%) | 0.0 |
| High School Diploma | 0 (0.0%) | 0.0 |
| College or Associate's Degree | 0 (0.0%) | 0.0 |
| Bachelor's Degree | 0 (0.0%) | 0.0 |
| Graduate Degree | 0 (0.0%) | 0.0 |
| Total | 0 (0.0%) | 0.0 |
Fertility by Education by Marriage Status in Gilman City
| Educational Attainment | Married | Unmarried |
| Less than High School | 0 (0.0%) | 0 (0.0%) |
| High School Diploma | 0 (0.0%) | 0 (0.0%) |
| College or Associate's Degree | 0 (0.0%) | 0 (0.0%) |
| Bachelor's Degree | 0 (0.0%) | 0 (0.0%) |
| Graduate Degree | 0 (0.0%) | 0 (0.0%) |
| Total | 0 (0.0%) | 0 (0.0%) |
Employment Characteristics in Gilman City
Employment by Class of Employer in Gilman City
Among the 169 employed individuals in Gilman City, private company employees (100 | 59.2%), local government employees (19 | 11.2%), and self-employed (incorporated) (18 | 10.6%) make up the most common classes of employment.
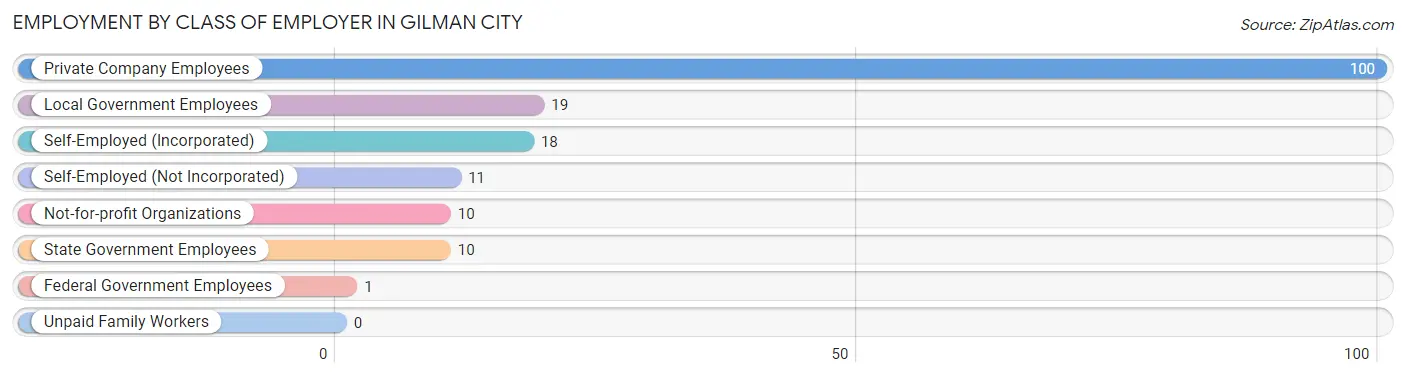
| Employer Class | # Employees | % Employees |
| Private Company Employees | 100 | 59.2% |
| Self-Employed (Incorporated) | 18 | 10.6% |
| Self-Employed (Not Incorporated) | 11 | 6.5% |
| Not-for-profit Organizations | 10 | 5.9% |
| Local Government Employees | 19 | 11.2% |
| State Government Employees | 10 | 5.9% |
| Federal Government Employees | 1 | 0.6% |
| Unpaid Family Workers | 0 | 0.0% |
| Total | 169 | 100.0% |
Employment Status by Age in Gilman City
According to the labor force statistics for Gilman City, out of the total population over 16 years of age (318), 54.1% or 172 individuals are in the labor force, with 1.7% or 3 of them unemployed. The age group with the highest labor force participation rate is 25 to 29 years, with 100.0% or 17 individuals in the labor force. Within the labor force, the 45 to 54 years age range has the highest percentage of unemployed individuals, with 3.8% or 2 of them being unemployed.
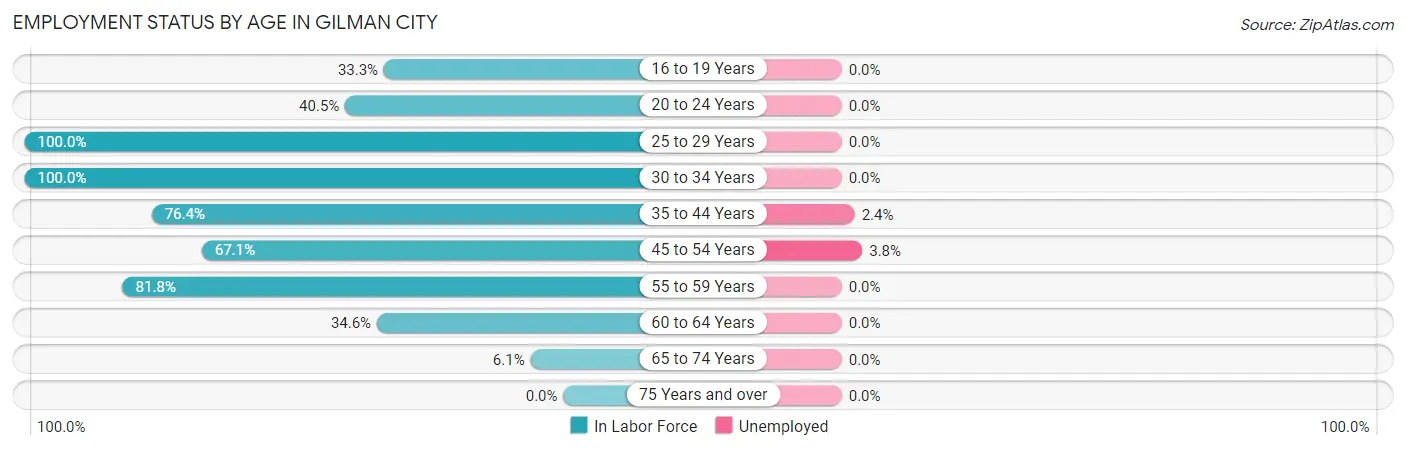
| Age Bracket | In Labor Force | Unemployed |
| 16 to 19 Years | 6 (33.3%) | 0 (0.0%) |
| 20 to 24 Years | 15 (40.5%) | 0 (0.0%) |
| 25 to 29 Years | 17 (100.0%) | 0 (0.0%) |
| 30 to 34 Years | 19 (100.0%) | 0 (0.0%) |
| 35 to 44 Years | 42 (76.4%) | 1 (2.4%) |
| 45 to 54 Years | 53 (67.1%) | 2 (3.8%) |
| 55 to 59 Years | 9 (81.8%) | 0 (0.0%) |
| 60 to 64 Years | 9 (34.6%) | 0 (0.0%) |
| 65 to 74 Years | 2 (6.1%) | 0 (0.0%) |
| 75 Years and over | 0 (0.0%) | 0 (0.0%) |
| Total | 172 (54.1%) | 3 (1.7%) |
Employment Status by Educational Attainment in Gilman City
According to labor force statistics for Gilman City, 72.0% of individuals (149) out of the total population between 25 and 64 years of age (207) are in the labor force, with 2.0% or 3 of them being unemployed. The group with the highest labor force participation rate are those with the educational attainment of bachelor's degree or higher, with 100.0% or 18 individuals in the labor force. Within the labor force, individuals with college / associate degree education have the highest percentage of unemployment, with 5.9% or 3 of them being unemployed.
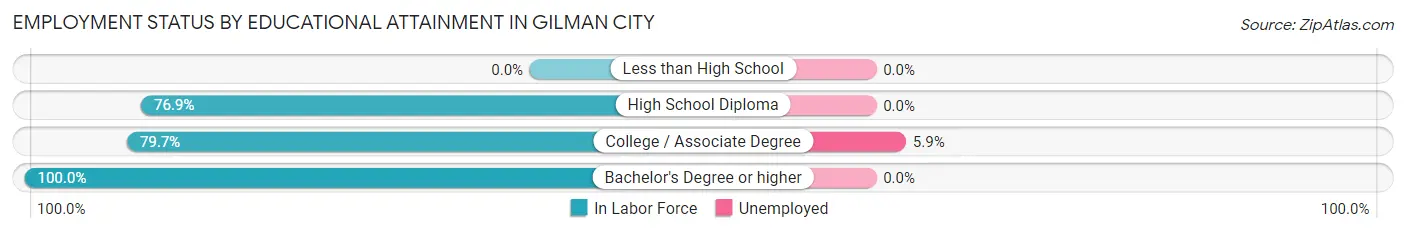
| Educational Attainment | In Labor Force | Unemployed |
| Less than High School | 0 (0.0%) | 0 (0.0%) |
| High School Diploma | 80 (76.9%) | 0 (0.0%) |
| College / Associate Degree | 51 (79.7%) | 4 (5.9%) |
| Bachelor's Degree or higher | 18 (100.0%) | 0 (0.0%) |
| Total | 149 (72.0%) | 4 (2.0%) |
Employment Occupations by Sex in Gilman City
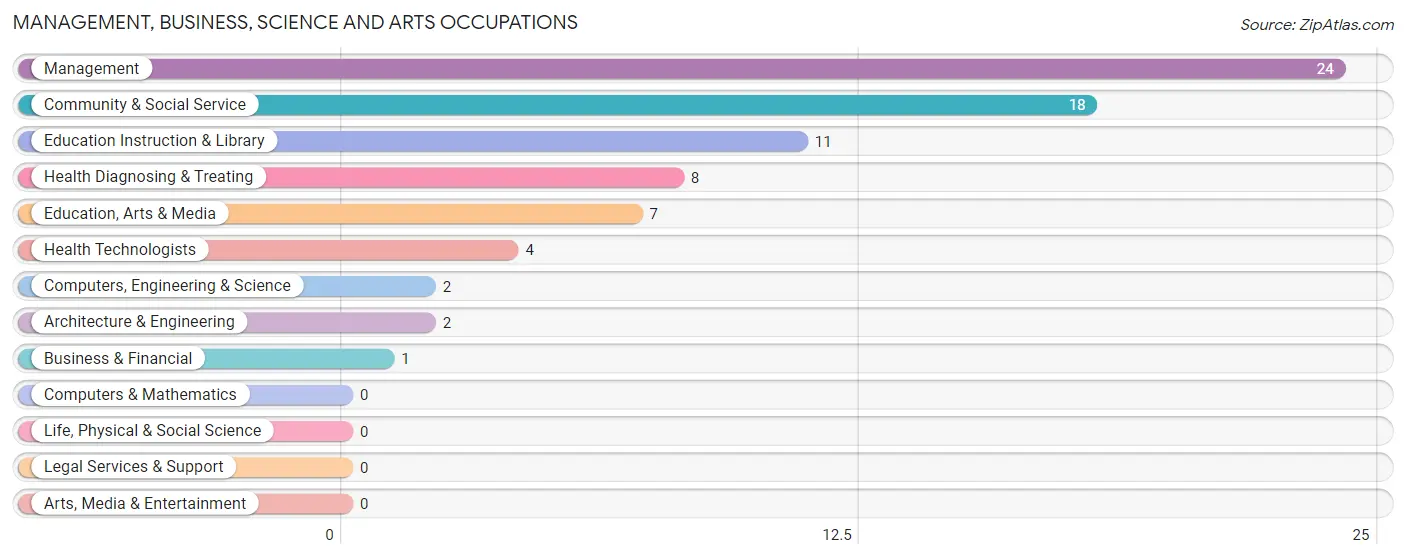
Management, Business, Science and Arts Occupations
The most common Management, Business, Science and Arts occupations in Gilman City are Management (24 | 14.2%), Community & Social Service (18 | 10.6%), Education Instruction & Library (11 | 6.5%), Health Diagnosing & Treating (8 | 4.7%), and Education, Arts & Media (7 | 4.1%).
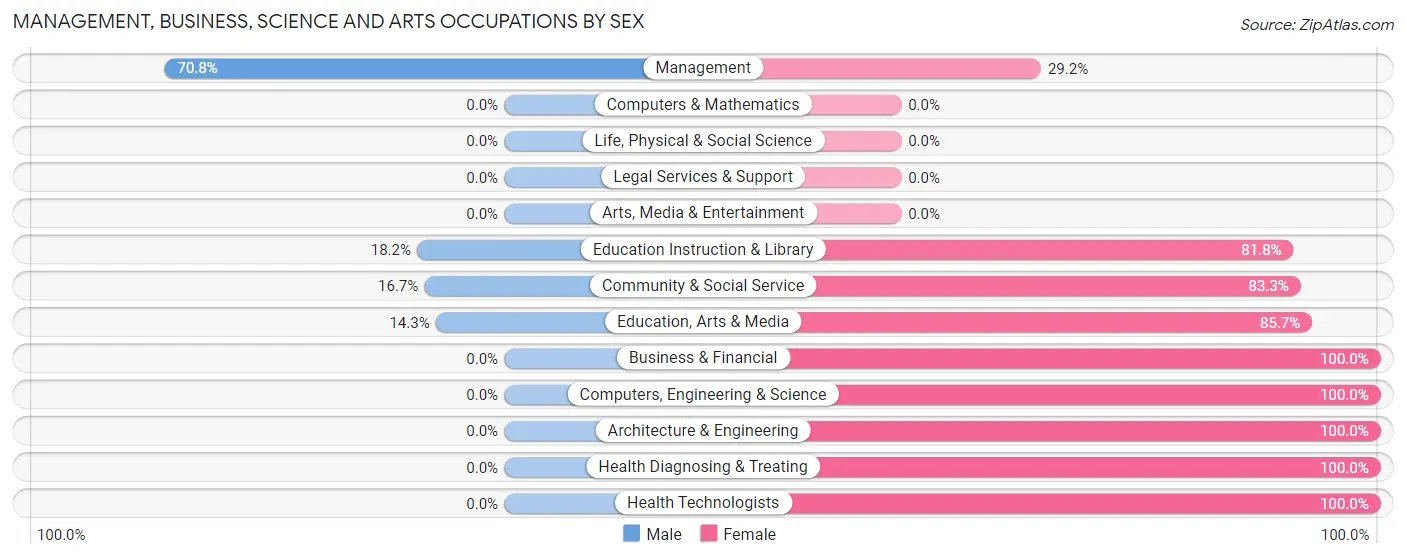
Management, Business, Science and Arts Occupations by Sex
Within the Management, Business, Science and Arts occupations in Gilman City, the most male-oriented occupations are Management (70.8%), Education Instruction & Library (18.2%), and Community & Social Service (16.7%), while the most female-oriented occupations are Business & Financial (100.0%), Computers, Engineering & Science (100.0%), and Architecture & Engineering (100.0%).
| Occupation | Male | Female |
| Management | 17 (70.8%) | 7 (29.2%) |
| Business & Financial | 0 (0.0%) | 1 (100.0%) |
| Computers, Engineering & Science | 0 (0.0%) | 2 (100.0%) |
| Computers & Mathematics | 0 (0.0%) | 0 (0.0%) |
| Architecture & Engineering | 0 (0.0%) | 2 (100.0%) |
| Life, Physical & Social Science | 0 (0.0%) | 0 (0.0%) |
| Community & Social Service | 3 (16.7%) | 15 (83.3%) |
| Education, Arts & Media | 1 (14.3%) | 6 (85.7%) |
| Legal Services & Support | 0 (0.0%) | 0 (0.0%) |
| Education Instruction & Library | 2 (18.2%) | 9 (81.8%) |
| Arts, Media & Entertainment | 0 (0.0%) | 0 (0.0%) |
| Health Diagnosing & Treating | 0 (0.0%) | 8 (100.0%) |
| Health Technologists | 0 (0.0%) | 4 (100.0%) |
| Total (Category) | 20 (37.7%) | 33 (62.3%) |
| Total (Overall) | 92 (54.4%) | 77 (45.6%) |
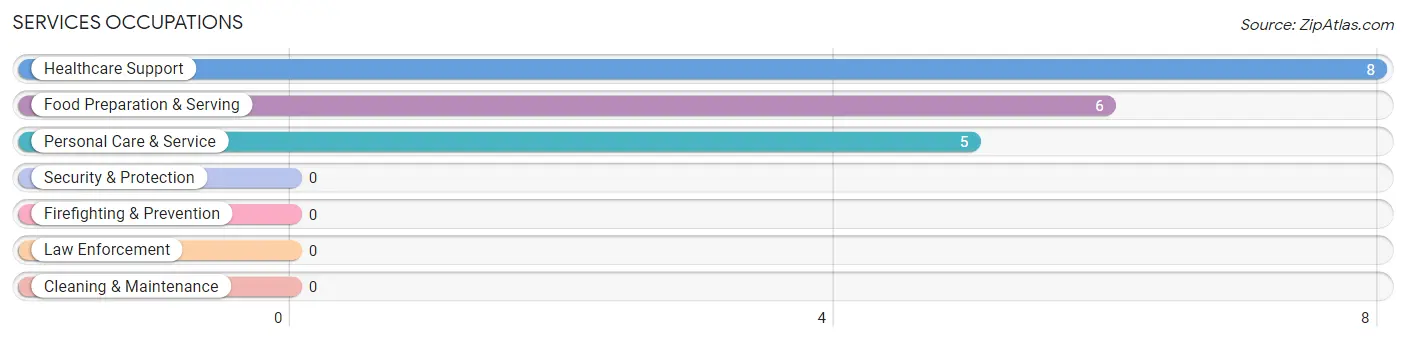
Services Occupations
The most common Services occupations in Gilman City are Healthcare Support (8 | 4.7%), Food Preparation & Serving (6 | 3.5%), and Personal Care & Service (5 | 3.0%).
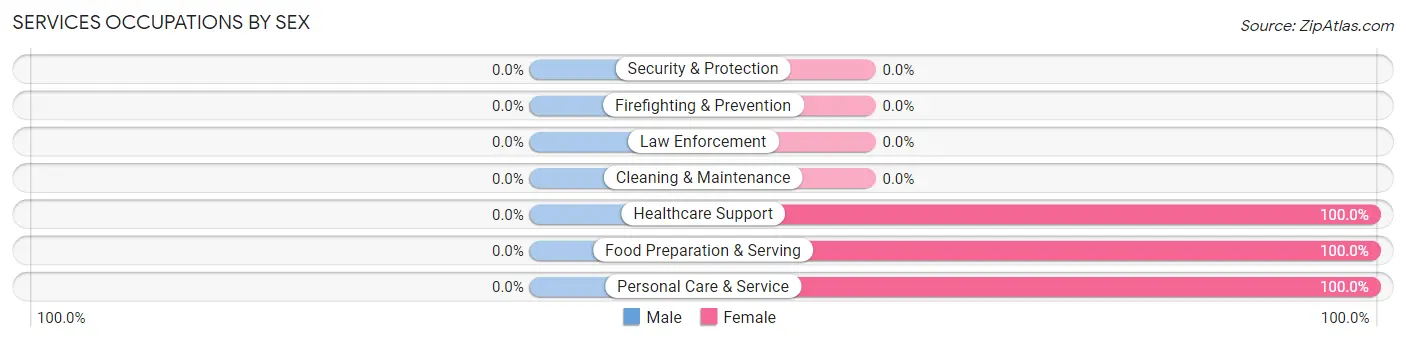
Services Occupations by Sex
| Occupation | Male | Female |
| Healthcare Support | 0 (0.0%) | 8 (100.0%) |
| Security & Protection | 0 (0.0%) | 0 (0.0%) |
| Firefighting & Prevention | 0 (0.0%) | 0 (0.0%) |
| Law Enforcement | 0 (0.0%) | 0 (0.0%) |
| Food Preparation & Serving | 0 (0.0%) | 6 (100.0%) |
| Cleaning & Maintenance | 0 (0.0%) | 0 (0.0%) |
| Personal Care & Service | 0 (0.0%) | 5 (100.0%) |
| Total (Category) | 0 (0.0%) | 19 (100.0%) |
| Total (Overall) | 92 (54.4%) | 77 (45.6%) |
Sales and Office Occupations
The most common Sales and Office occupations in Gilman City are Office & Administration (13 | 7.7%), and Sales & Related (3 | 1.8%).
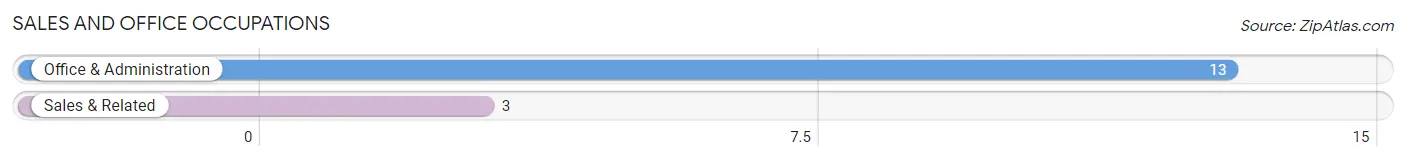
Sales and Office Occupations by Sex
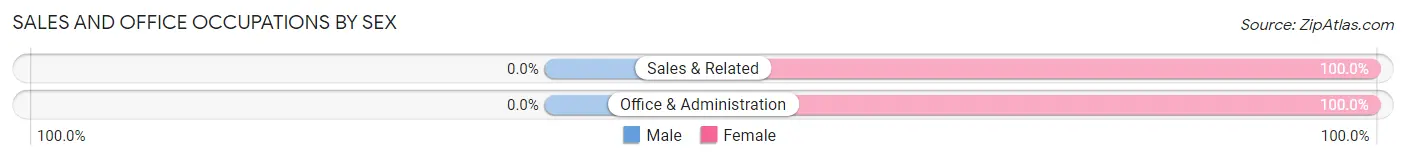
| Occupation | Male | Female |
| Sales & Related | 0 (0.0%) | 3 (100.0%) |
| Office & Administration | 0 (0.0%) | 13 (100.0%) |
| Total (Category) | 0 (0.0%) | 16 (100.0%) |
| Total (Overall) | 92 (54.4%) | 77 (45.6%) |
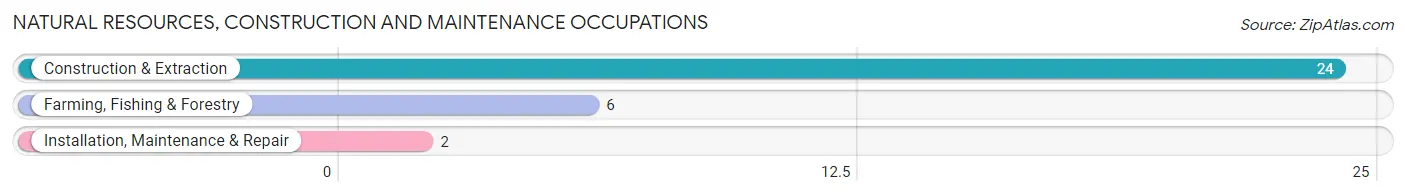
Natural Resources, Construction and Maintenance Occupations
The most common Natural Resources, Construction and Maintenance occupations in Gilman City are Construction & Extraction (24 | 14.2%), Farming, Fishing & Forestry (6 | 3.5%), and Installation, Maintenance & Repair (2 | 1.2%).
Natural Resources, Construction and Maintenance Occupations by Sex
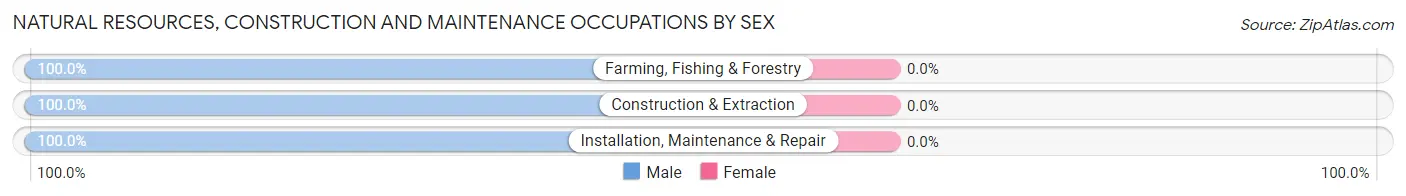
| Occupation | Male | Female |
| Farming, Fishing & Forestry | 6 (100.0%) | 0 (0.0%) |
| Construction & Extraction | 24 (100.0%) | 0 (0.0%) |
| Installation, Maintenance & Repair | 2 (100.0%) | 0 (0.0%) |
| Total (Category) | 32 (100.0%) | 0 (0.0%) |
| Total (Overall) | 92 (54.4%) | 77 (45.6%) |
Production, Transportation and Moving Occupations
The most common Production, Transportation and Moving occupations in Gilman City are Production (24 | 14.2%), Transportation (17 | 10.1%), and Material Moving (8 | 4.7%).
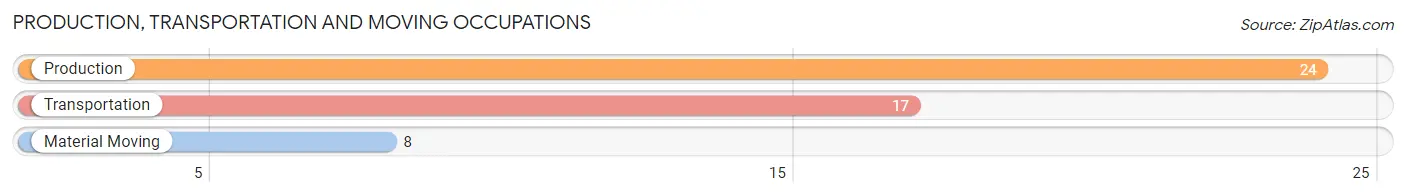
Production, Transportation and Moving Occupations by Sex
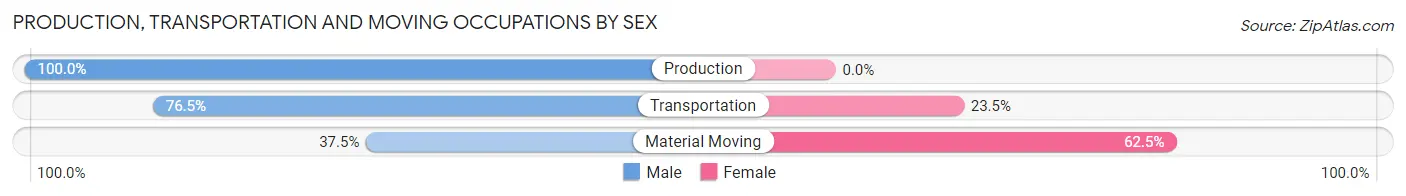
| Occupation | Male | Female |
| Production | 24 (100.0%) | 0 (0.0%) |
| Transportation | 13 (76.5%) | 4 (23.5%) |
| Material Moving | 3 (37.5%) | 5 (62.5%) |
| Total (Category) | 40 (81.6%) | 9 (18.4%) |
| Total (Overall) | 92 (54.4%) | 77 (45.6%) |
Employment Industries by Sex in Gilman City
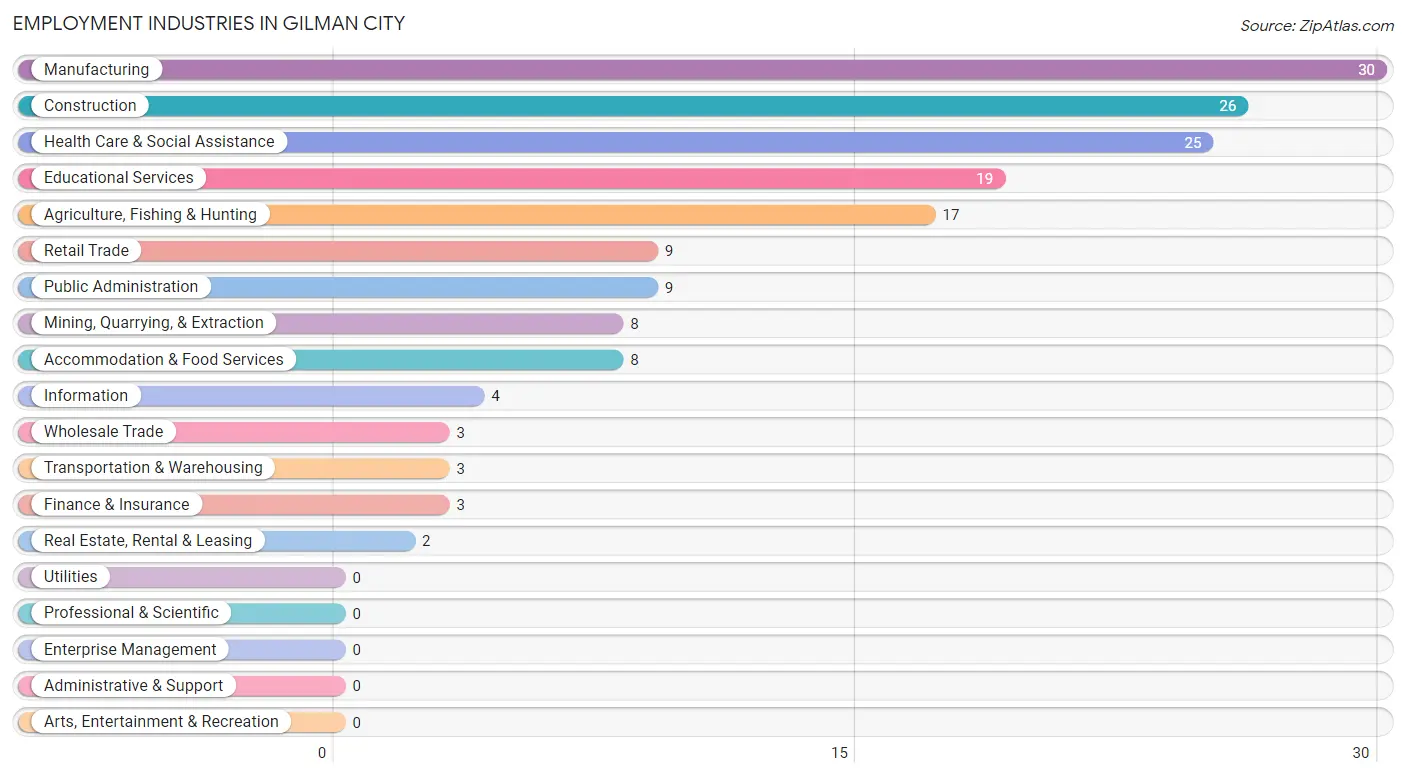
Employment Industries in Gilman City
The major employment industries in Gilman City include Manufacturing (30 | 17.7%), Construction (26 | 15.4%), Health Care & Social Assistance (25 | 14.8%), Educational Services (19 | 11.2%), and Agriculture, Fishing & Hunting (17 | 10.1%).
Employment Industries by Sex in Gilman City
The Gilman City industries that see more men than women are Agriculture, Fishing & Hunting (100.0%), Construction (100.0%), and Information (100.0%), whereas the industries that tend to have a higher number of women are Wholesale Trade (100.0%), Finance & Insurance (100.0%), and Real Estate, Rental & Leasing (100.0%).
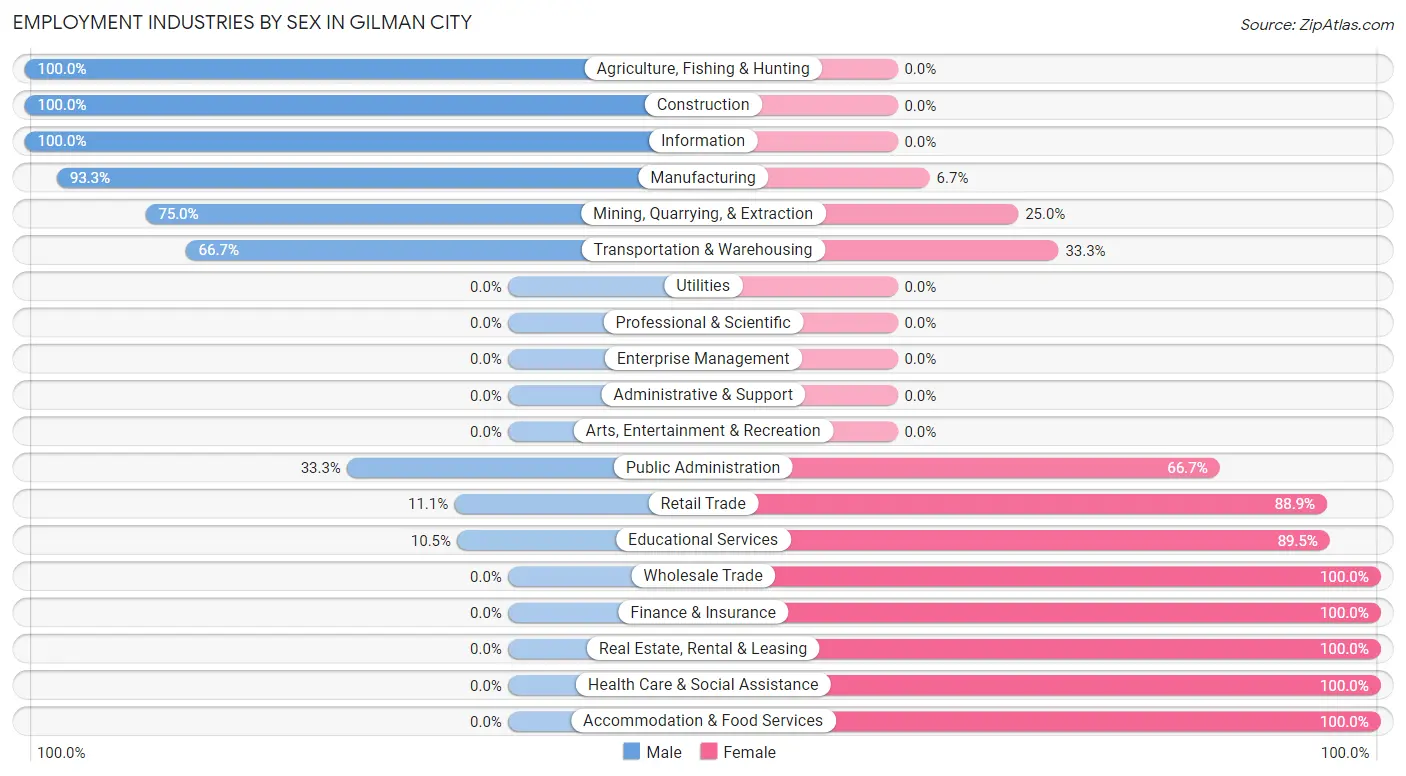
| Industry | Male | Female |
| Agriculture, Fishing & Hunting | 17 (100.0%) | 0 (0.0%) |
| Mining, Quarrying, & Extraction | 6 (75.0%) | 2 (25.0%) |
| Construction | 26 (100.0%) | 0 (0.0%) |
| Manufacturing | 28 (93.3%) | 2 (6.7%) |
| Wholesale Trade | 0 (0.0%) | 3 (100.0%) |
| Retail Trade | 1 (11.1%) | 8 (88.9%) |
| Transportation & Warehousing | 2 (66.7%) | 1 (33.3%) |
| Utilities | 0 (0.0%) | 0 (0.0%) |
| Information | 4 (100.0%) | 0 (0.0%) |
| Finance & Insurance | 0 (0.0%) | 3 (100.0%) |
| Real Estate, Rental & Leasing | 0 (0.0%) | 2 (100.0%) |
| Professional & Scientific | 0 (0.0%) | 0 (0.0%) |
| Enterprise Management | 0 (0.0%) | 0 (0.0%) |
| Administrative & Support | 0 (0.0%) | 0 (0.0%) |
| Educational Services | 2 (10.5%) | 17 (89.5%) |
| Health Care & Social Assistance | 0 (0.0%) | 25 (100.0%) |
| Arts, Entertainment & Recreation | 0 (0.0%) | 0 (0.0%) |
| Accommodation & Food Services | 0 (0.0%) | 8 (100.0%) |
| Public Administration | 3 (33.3%) | 6 (66.7%) |
| Total | 92 (54.4%) | 77 (45.6%) |
Education in Gilman City
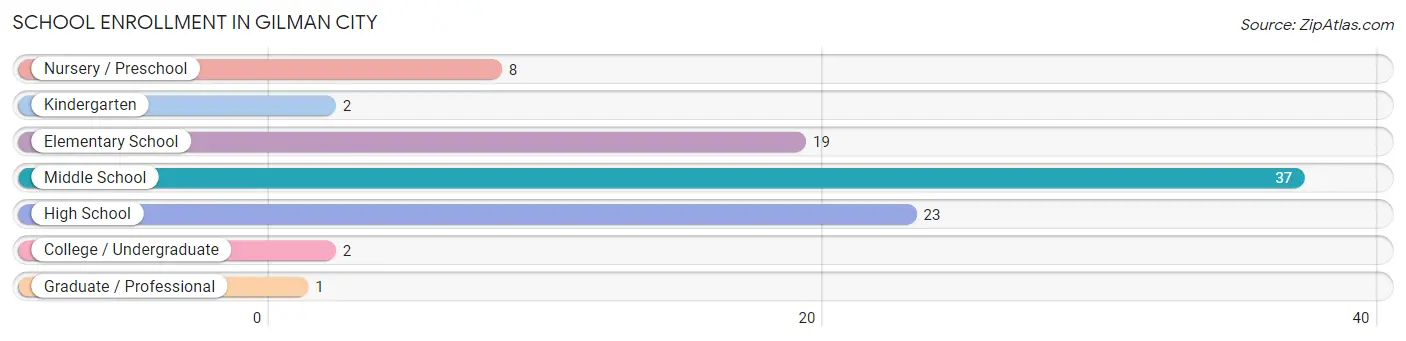
School Enrollment in Gilman City
The most common levels of schooling among the 92 students in Gilman City are middle school (37 | 40.2%), high school (23 | 25.0%), and elementary school (19 | 20.6%).
| School Level | # Students | % Students |
| Nursery / Preschool | 8 | 8.7% |
| Kindergarten | 2 | 2.2% |
| Elementary School | 19 | 20.6% |
| Middle School | 37 | 40.2% |
| High School | 23 | 25.0% |
| College / Undergraduate | 2 | 2.2% |
| Graduate / Professional | 1 | 1.1% |
| Total | 92 | 100.0% |
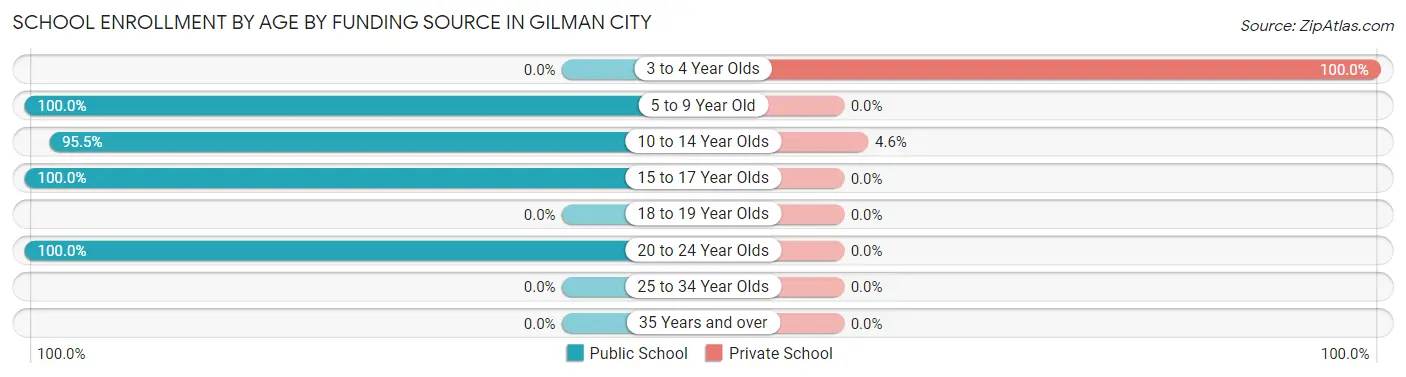
School Enrollment by Age by Funding Source in Gilman City
Out of a total of 92 students who are enrolled in schools in Gilman City, 4 (4.3%) attend a private institution, while the remaining 88 (95.7%) are enrolled in public schools. The age group of 3 to 4 year olds has the highest likelihood of being enrolled in private schools, with 2 (100.0% in the age bracket) enrolled. Conversely, the age group of 5 to 9 year old has the lowest likelihood of being enrolled in a private school, with 27 (100.0% in the age bracket) attending a public institution.
| Age Bracket | Public School | Private School |
| 3 to 4 Year Olds | 0 (0.0%) | 2 (100.0%) |
| 5 to 9 Year Old | 27 (100.0%) | 0 (0.0%) |
| 10 to 14 Year Olds | 42 (95.5%) | 2 (4.5%) |
| 15 to 17 Year Olds | 16 (100.0%) | 0 (0.0%) |
| 18 to 19 Year Olds | 0 (0.0%) | 0 (0.0%) |
| 20 to 24 Year Olds | 3 (100.0%) | 0 (0.0%) |
| 25 to 34 Year Olds | 0 (0.0%) | 0 (0.0%) |
| 35 Years and over | 0 (0.0%) | 0 (0.0%) |
| Total | 88 (95.7%) | 4 (4.3%) |
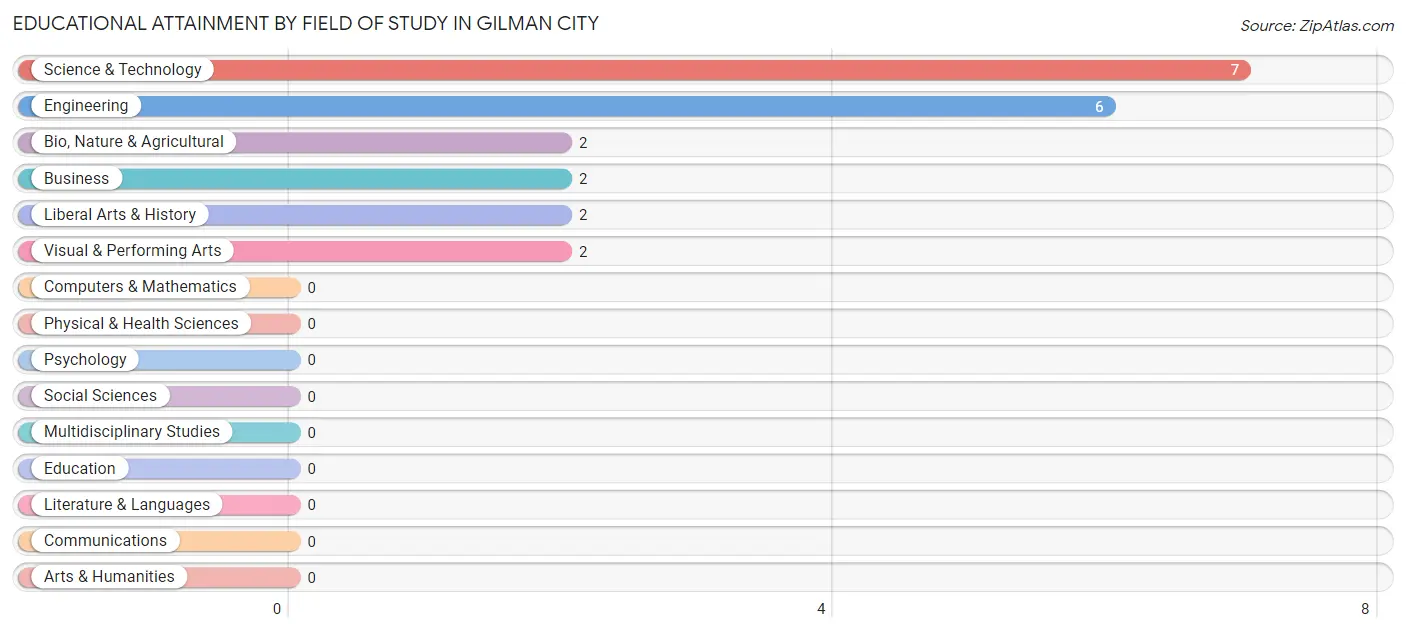
Educational Attainment by Field of Study in Gilman City
Science & technology (7 | 33.3%), engineering (6 | 28.6%), bio, nature & agricultural (2 | 9.5%), business (2 | 9.5%), and liberal arts & history (2 | 9.5%) are the most common fields of study among 21 individuals in Gilman City who have obtained a bachelor's degree or higher.
| Field of Study | # Graduates | % Graduates |
| Computers & Mathematics | 0 | 0.0% |
| Bio, Nature & Agricultural | 2 | 9.5% |
| Physical & Health Sciences | 0 | 0.0% |
| Psychology | 0 | 0.0% |
| Social Sciences | 0 | 0.0% |
| Engineering | 6 | 28.6% |
| Multidisciplinary Studies | 0 | 0.0% |
| Science & Technology | 7 | 33.3% |
| Business | 2 | 9.5% |
| Education | 0 | 0.0% |
| Literature & Languages | 0 | 0.0% |
| Liberal Arts & History | 2 | 9.5% |
| Visual & Performing Arts | 2 | 9.5% |
| Communications | 0 | 0.0% |
| Arts & Humanities | 0 | 0.0% |
| Total | 21 | 100.0% |
Transportation & Commute in Gilman City
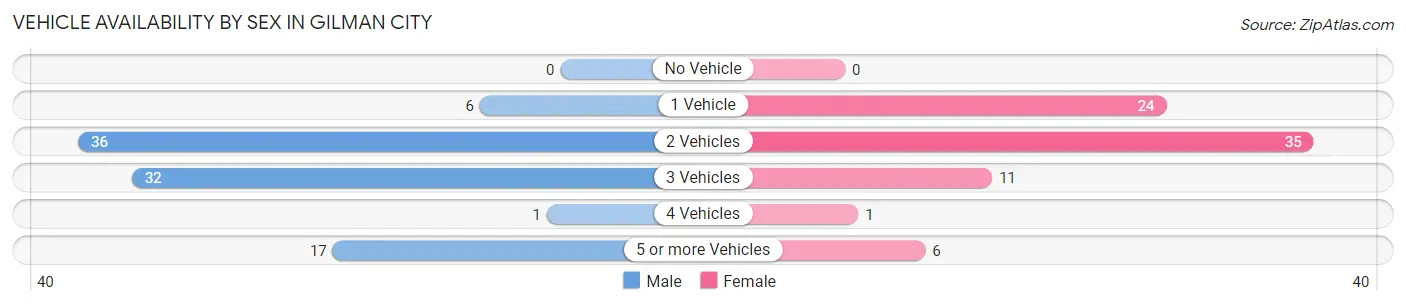
Vehicle Availability by Sex in Gilman City
The most prevalent vehicle ownership categories in Gilman City are males with 2 vehicles (36, accounting for 39.1%) and females with 2 vehicles (35, making up 46.8%).
| Vehicles Available | Male | Female |
| No Vehicle | 0 (0.0%) | 0 (0.0%) |
| 1 Vehicle | 6 (6.5%) | 24 (31.2%) |
| 2 Vehicles | 36 (39.1%) | 35 (45.5%) |
| 3 Vehicles | 32 (34.8%) | 11 (14.3%) |
| 4 Vehicles | 1 (1.1%) | 1 (1.3%) |
| 5 or more Vehicles | 17 (18.5%) | 6 (7.8%) |
| Total | 92 (100.0%) | 77 (100.0%) |
Commute Time in Gilman City
The most frequently occuring commute durations in Gilman City are 20 to 24 minutes (44 commuters, 26.7%), 25 to 29 minutes (25 commuters, 15.1%), and 15 to 19 minutes (20 commuters, 12.1%).
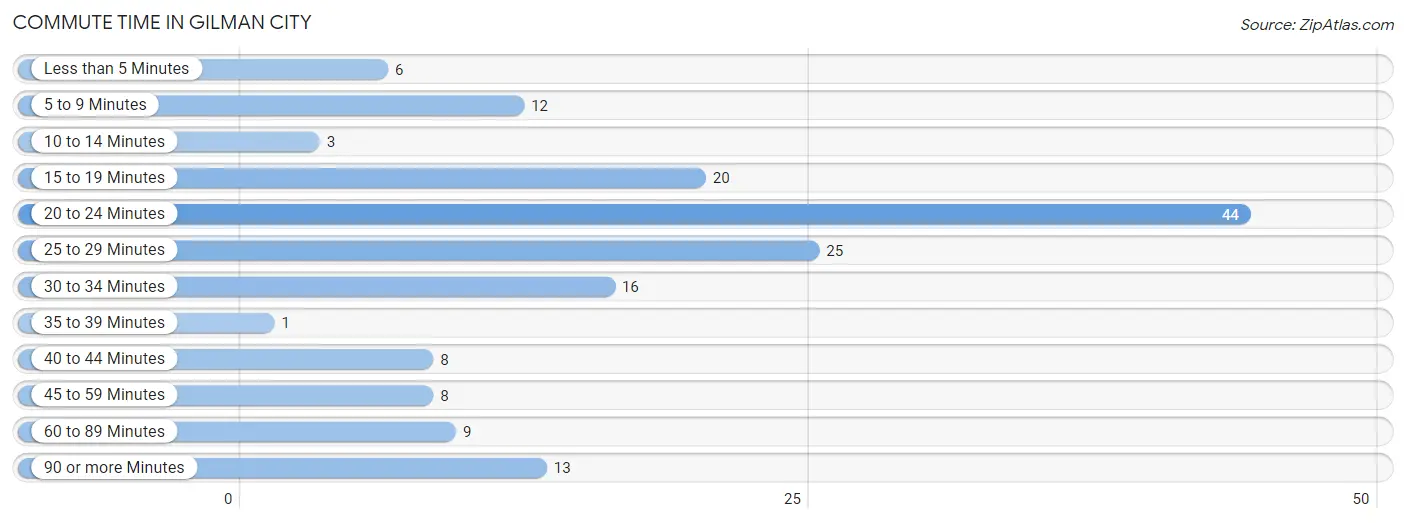
| Commute Time | # Commuters | % Commuters |
| Less than 5 Minutes | 6 | 3.6% |
| 5 to 9 Minutes | 12 | 7.3% |
| 10 to 14 Minutes | 3 | 1.8% |
| 15 to 19 Minutes | 20 | 12.1% |
| 20 to 24 Minutes | 44 | 26.7% |
| 25 to 29 Minutes | 25 | 15.1% |
| 30 to 34 Minutes | 16 | 9.7% |
| 35 to 39 Minutes | 1 | 0.6% |
| 40 to 44 Minutes | 8 | 4.9% |
| 45 to 59 Minutes | 8 | 4.9% |
| 60 to 89 Minutes | 9 | 5.4% |
| 90 or more Minutes | 13 | 7.9% |
Commute Time by Sex in Gilman City
The most common commute times in Gilman City are 15 to 19 minutes (19 commuters, 21.6%) for males and 20 to 24 minutes (28 commuters, 36.4%) for females.
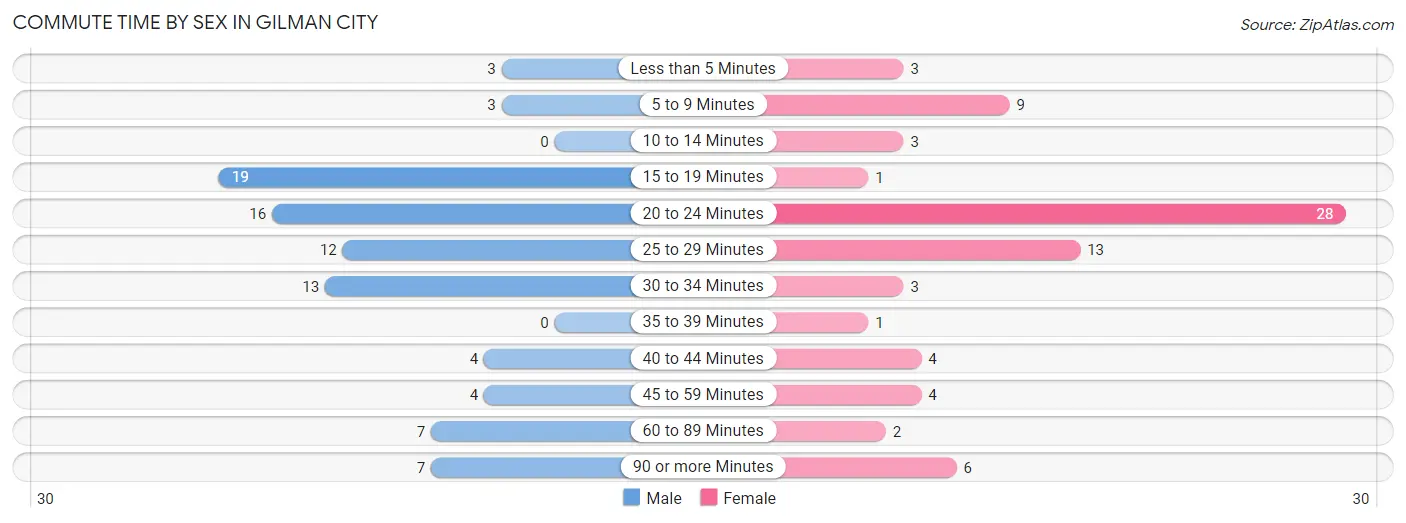
| Commute Time | Male | Female |
| Less than 5 Minutes | 3 (3.4%) | 3 (3.9%) |
| 5 to 9 Minutes | 3 (3.4%) | 9 (11.7%) |
| 10 to 14 Minutes | 0 (0.0%) | 3 (3.9%) |
| 15 to 19 Minutes | 19 (21.6%) | 1 (1.3%) |
| 20 to 24 Minutes | 16 (18.2%) | 28 (36.4%) |
| 25 to 29 Minutes | 12 (13.6%) | 13 (16.9%) |
| 30 to 34 Minutes | 13 (14.8%) | 3 (3.9%) |
| 35 to 39 Minutes | 0 (0.0%) | 1 (1.3%) |
| 40 to 44 Minutes | 4 (4.5%) | 4 (5.2%) |
| 45 to 59 Minutes | 4 (4.5%) | 4 (5.2%) |
| 60 to 89 Minutes | 7 (8.0%) | 2 (2.6%) |
| 90 or more Minutes | 7 (8.0%) | 6 (7.8%) |
Time of Departure to Work by Sex in Gilman City
The most frequent times of departure to work in Gilman City are 5:00 AM to 5:29 AM (23, 26.1%) for males and 7:30 AM to 7:59 AM (23, 29.9%) for females.
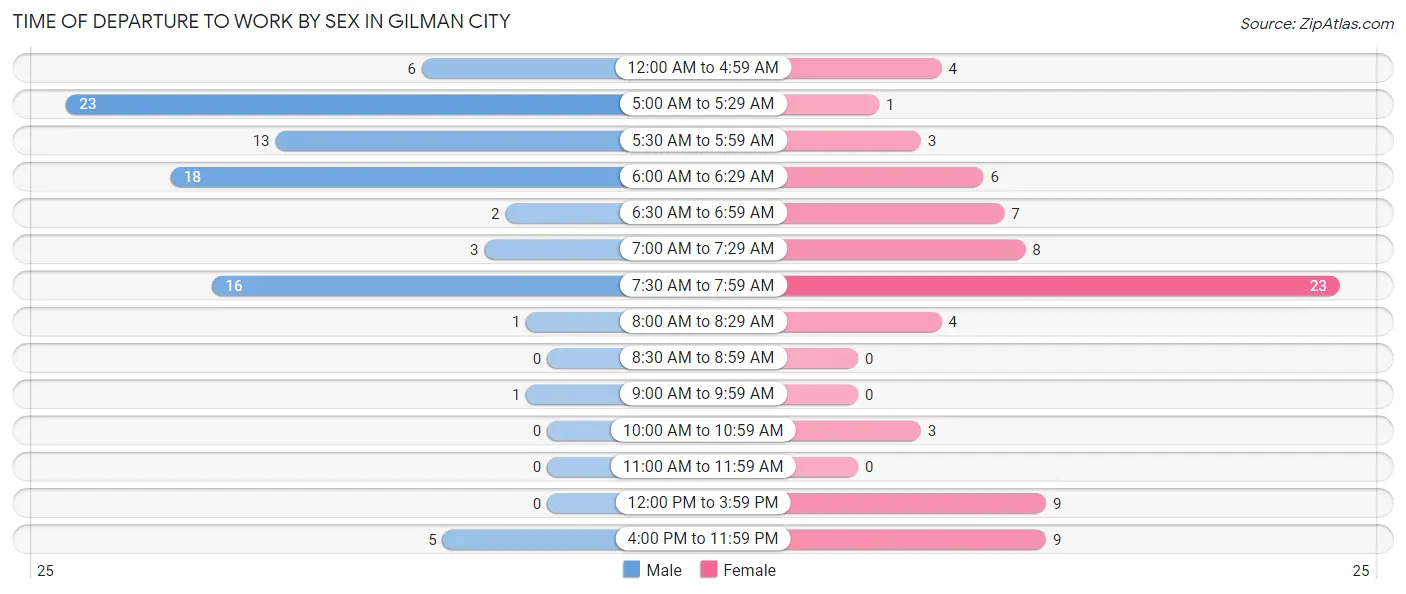
| Time of Departure | Male | Female |
| 12:00 AM to 4:59 AM | 6 (6.8%) | 4 (5.2%) |
| 5:00 AM to 5:29 AM | 23 (26.1%) | 1 (1.3%) |
| 5:30 AM to 5:59 AM | 13 (14.8%) | 3 (3.9%) |
| 6:00 AM to 6:29 AM | 18 (20.4%) | 6 (7.8%) |
| 6:30 AM to 6:59 AM | 2 (2.3%) | 7 (9.1%) |
| 7:00 AM to 7:29 AM | 3 (3.4%) | 8 (10.4%) |
| 7:30 AM to 7:59 AM | 16 (18.2%) | 23 (29.9%) |
| 8:00 AM to 8:29 AM | 1 (1.1%) | 4 (5.2%) |
| 8:30 AM to 8:59 AM | 0 (0.0%) | 0 (0.0%) |
| 9:00 AM to 9:59 AM | 1 (1.1%) | 0 (0.0%) |
| 10:00 AM to 10:59 AM | 0 (0.0%) | 3 (3.9%) |
| 11:00 AM to 11:59 AM | 0 (0.0%) | 0 (0.0%) |
| 12:00 PM to 3:59 PM | 0 (0.0%) | 9 (11.7%) |
| 4:00 PM to 11:59 PM | 5 (5.7%) | 9 (11.7%) |
| Total | 88 (100.0%) | 77 (100.0%) |
Housing Occupancy in Gilman City
Occupancy by Ownership in Gilman City
Of the total 148 dwellings in Gilman City, owner-occupied units account for 106 (71.6%), while renter-occupied units make up 42 (28.4%).
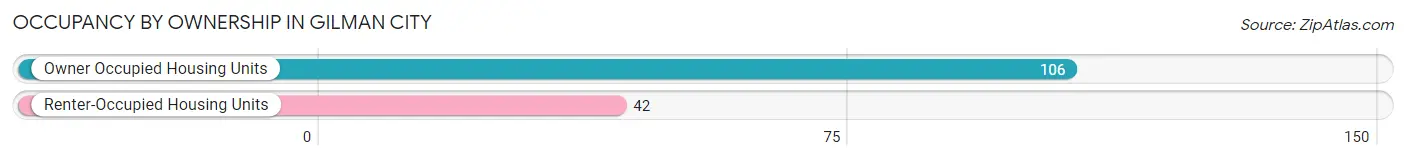
| Occupancy | # Housing Units | % Housing Units |
| Owner Occupied Housing Units | 106 | 71.6% |
| Renter-Occupied Housing Units | 42 | 28.4% |
| Total Occupied Housing Units | 148 | 100.0% |
Occupancy by Household Size in Gilman City
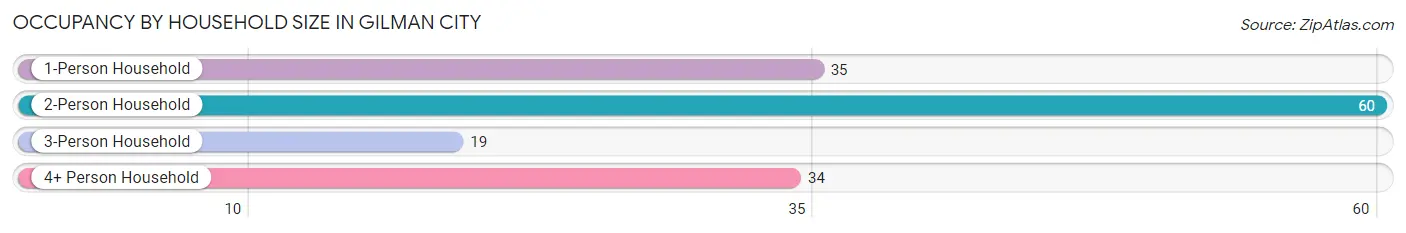
| Household Size | # Housing Units | % Housing Units |
| 1-Person Household | 35 | 23.6% |
| 2-Person Household | 60 | 40.5% |
| 3-Person Household | 19 | 12.8% |
| 4+ Person Household | 34 | 23.0% |
| Total Housing Units | 148 | 100.0% |
Occupancy by Ownership by Household Size in Gilman City
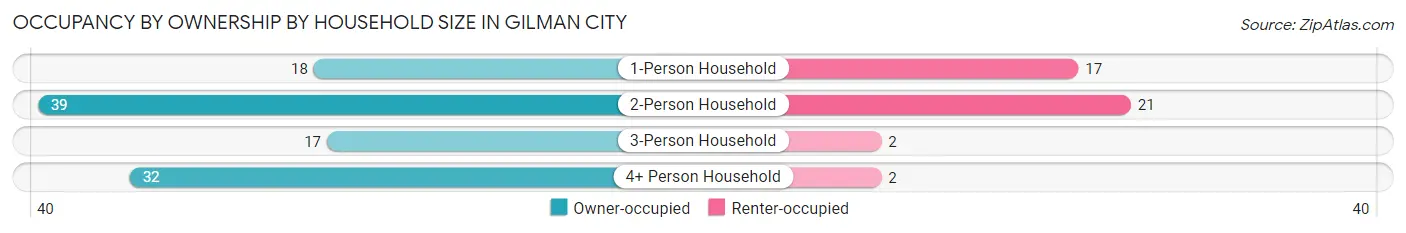
| Household Size | Owner-occupied | Renter-occupied |
| 1-Person Household | 18 (51.4%) | 17 (48.6%) |
| 2-Person Household | 39 (65.0%) | 21 (35.0%) |
| 3-Person Household | 17 (89.5%) | 2 (10.5%) |
| 4+ Person Household | 32 (94.1%) | 2 (5.9%) |
| Total Housing Units | 106 (71.6%) | 42 (28.4%) |
Occupancy by Educational Attainment in Gilman City
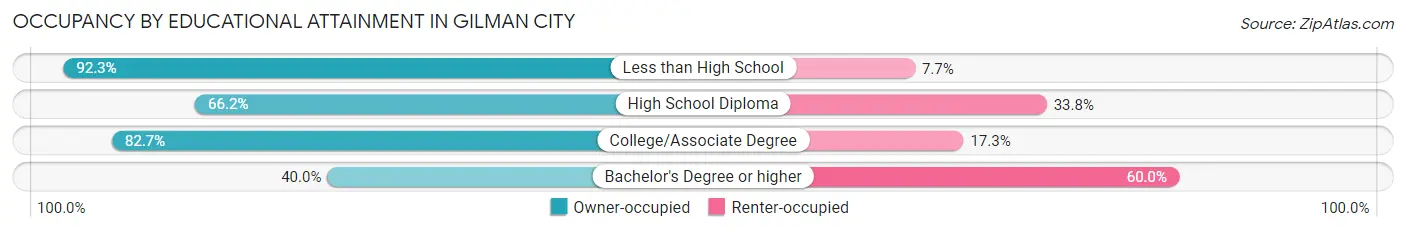
| Household Size | Owner-occupied | Renter-occupied |
| Less than High School | 12 (92.3%) | 1 (7.7%) |
| High School Diploma | 45 (66.2%) | 23 (33.8%) |
| College/Associate Degree | 43 (82.7%) | 9 (17.3%) |
| Bachelor's Degree or higher | 6 (40.0%) | 9 (60.0%) |
Occupancy by Age of Householder in Gilman City
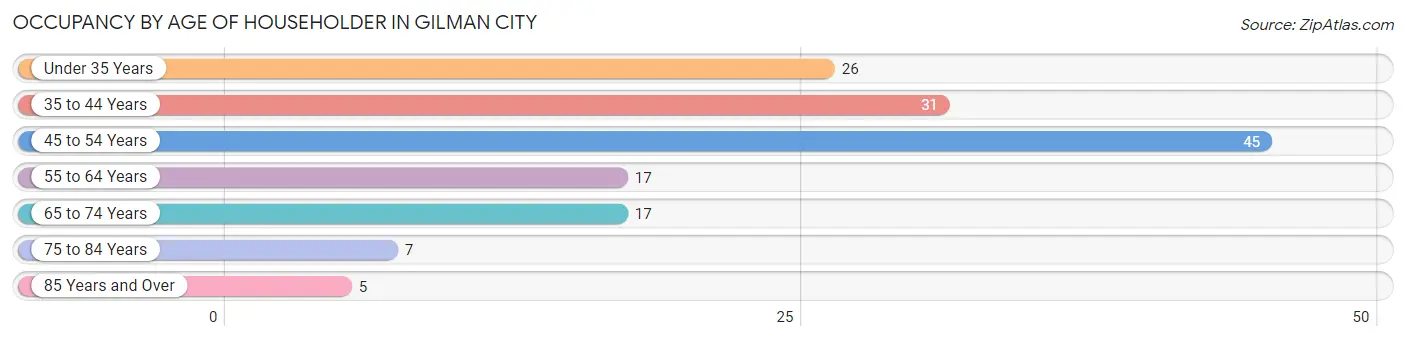
| Age Bracket | # Households | % Households |
| Under 35 Years | 26 | 17.6% |
| 35 to 44 Years | 31 | 20.9% |
| 45 to 54 Years | 45 | 30.4% |
| 55 to 64 Years | 17 | 11.5% |
| 65 to 74 Years | 17 | 11.5% |
| 75 to 84 Years | 7 | 4.7% |
| 85 Years and Over | 5 | 3.4% |
| Total | 148 | 100.0% |
Housing Finances in Gilman City
Median Income by Occupancy in Gilman City
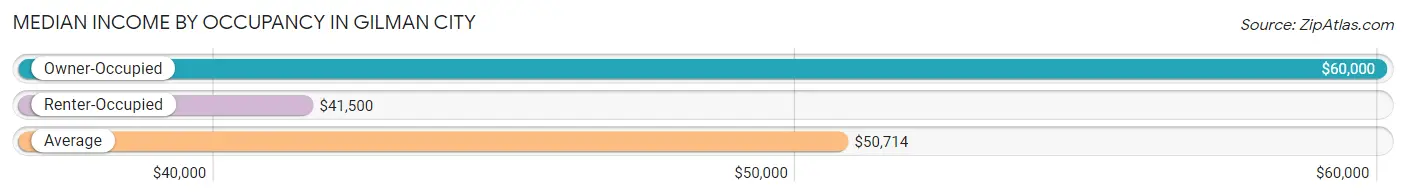
| Occupancy Type | # Households | Median Income |
| Owner-Occupied | 106 (71.6%) | $60,000 |
| Renter-Occupied | 42 (28.4%) | $41,500 |
| Average | 148 (100.0%) | $50,714 |
Occupancy by Householder Income Bracket in Gilman City
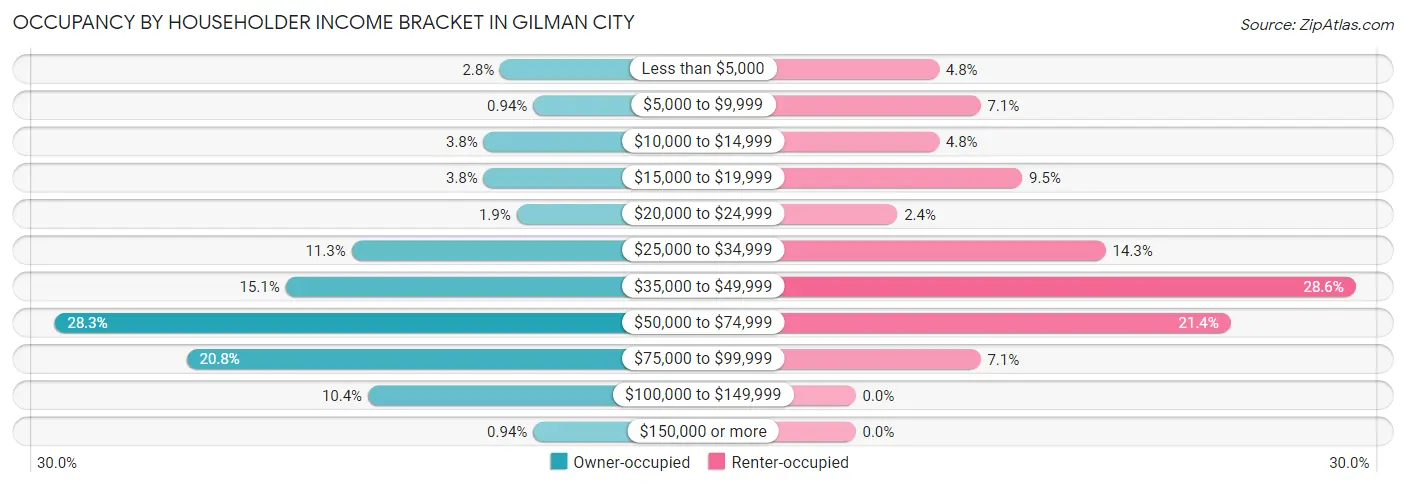
| Income Bracket | Owner-occupied | Renter-occupied |
| Less than $5,000 | 3 (2.8%) | 2 (4.8%) |
| $5,000 to $9,999 | 1 (0.9%) | 3 (7.1%) |
| $10,000 to $14,999 | 4 (3.8%) | 2 (4.8%) |
| $15,000 to $19,999 | 4 (3.8%) | 4 (9.5%) |
| $20,000 to $24,999 | 2 (1.9%) | 1 (2.4%) |
| $25,000 to $34,999 | 12 (11.3%) | 6 (14.3%) |
| $35,000 to $49,999 | 16 (15.1%) | 12 (28.6%) |
| $50,000 to $74,999 | 30 (28.3%) | 9 (21.4%) |
| $75,000 to $99,999 | 22 (20.7%) | 3 (7.1%) |
| $100,000 to $149,999 | 11 (10.4%) | 0 (0.0%) |
| $150,000 or more | 1 (0.9%) | 0 (0.0%) |
| Total | 106 (100.0%) | 42 (100.0%) |
Monthly Housing Cost Tiers in Gilman City
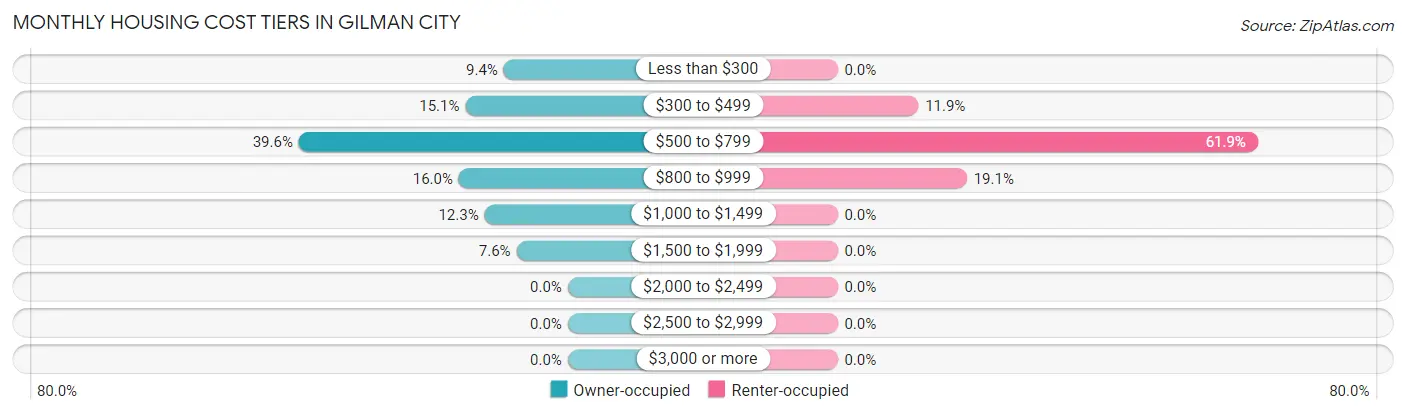
| Monthly Cost | Owner-occupied | Renter-occupied |
| Less than $300 | 10 (9.4%) | 0 (0.0%) |
| $300 to $499 | 16 (15.1%) | 5 (11.9%) |
| $500 to $799 | 42 (39.6%) | 26 (61.9%) |
| $800 to $999 | 17 (16.0%) | 8 (19.1%) |
| $1,000 to $1,499 | 13 (12.3%) | 0 (0.0%) |
| $1,500 to $1,999 | 8 (7.5%) | 0 (0.0%) |
| $2,000 to $2,499 | 0 (0.0%) | 0 (0.0%) |
| $2,500 to $2,999 | 0 (0.0%) | 0 (0.0%) |
| $3,000 or more | 0 (0.0%) | 0 (0.0%) |
| Total | 106 (100.0%) | 42 (100.0%) |
Physical Housing Characteristics in Gilman City
Housing Structures in Gilman City
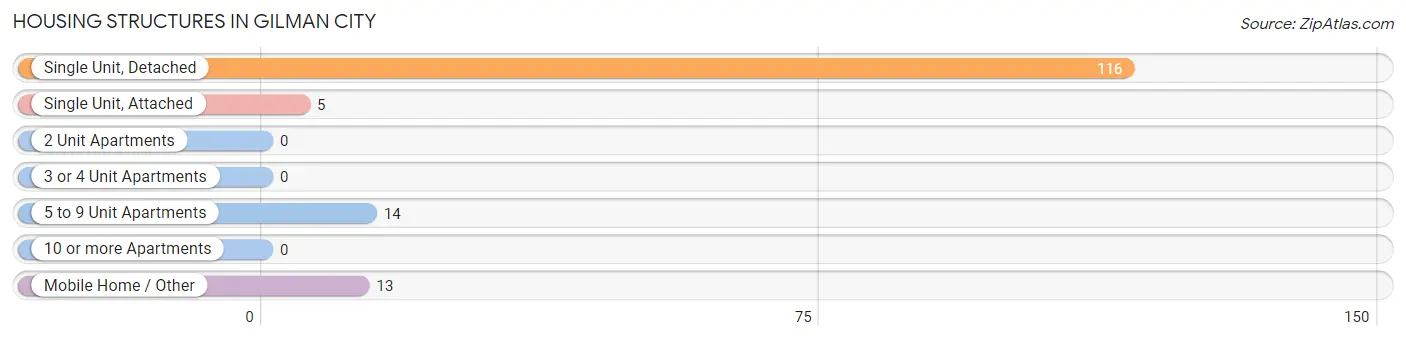
| Structure Type | # Housing Units | % Housing Units |
| Single Unit, Detached | 116 | 78.4% |
| Single Unit, Attached | 5 | 3.4% |
| 2 Unit Apartments | 0 | 0.0% |
| 3 or 4 Unit Apartments | 0 | 0.0% |
| 5 to 9 Unit Apartments | 14 | 9.5% |
| 10 or more Apartments | 0 | 0.0% |
| Mobile Home / Other | 13 | 8.8% |
| Total | 148 | 100.0% |
Housing Structures by Occupancy in Gilman City
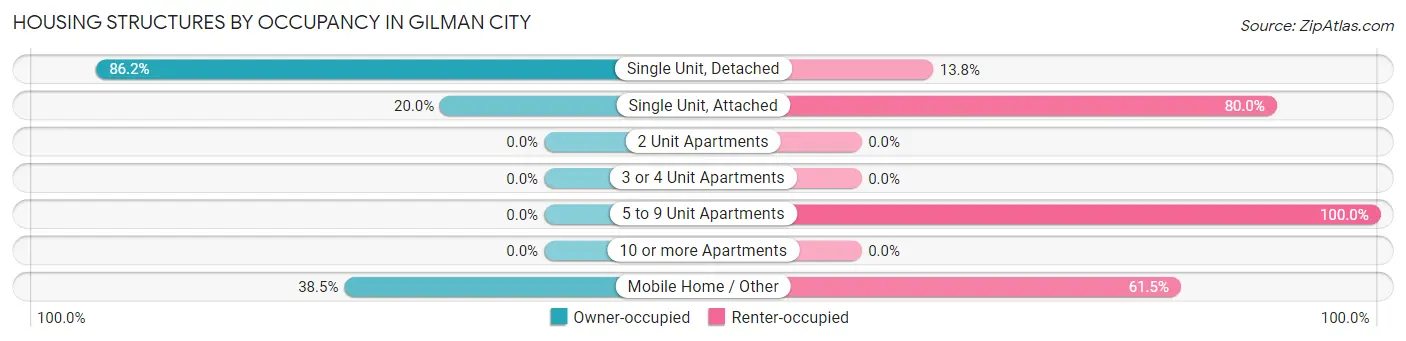
| Structure Type | Owner-occupied | Renter-occupied |
| Single Unit, Detached | 100 (86.2%) | 16 (13.8%) |
| Single Unit, Attached | 1 (20.0%) | 4 (80.0%) |
| 2 Unit Apartments | 0 (0.0%) | 0 (0.0%) |
| 3 or 4 Unit Apartments | 0 (0.0%) | 0 (0.0%) |
| 5 to 9 Unit Apartments | 0 (0.0%) | 14 (100.0%) |
| 10 or more Apartments | 0 (0.0%) | 0 (0.0%) |
| Mobile Home / Other | 5 (38.5%) | 8 (61.5%) |
| Total | 106 (71.6%) | 42 (28.4%) |
Housing Structures by Number of Rooms in Gilman City
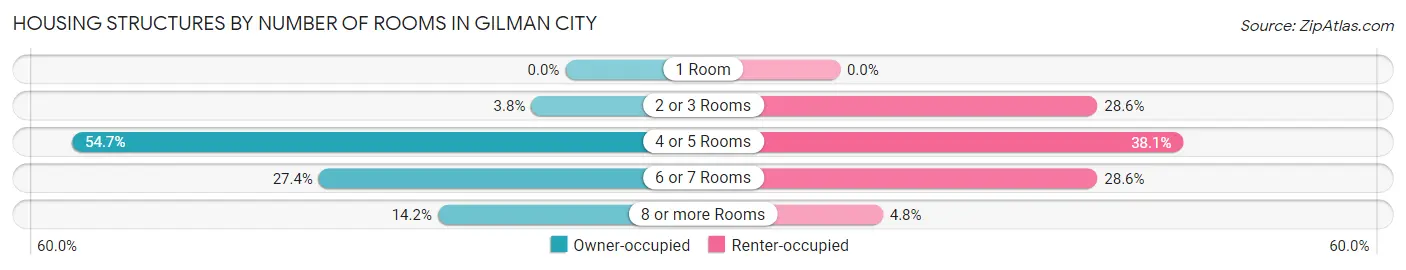
| Number of Rooms | Owner-occupied | Renter-occupied |
| 1 Room | 0 (0.0%) | 0 (0.0%) |
| 2 or 3 Rooms | 4 (3.8%) | 12 (28.6%) |
| 4 or 5 Rooms | 58 (54.7%) | 16 (38.1%) |
| 6 or 7 Rooms | 29 (27.4%) | 12 (28.6%) |
| 8 or more Rooms | 15 (14.1%) | 2 (4.8%) |
| Total | 106 (100.0%) | 42 (100.0%) |
Housing Structure by Heating Type in Gilman City
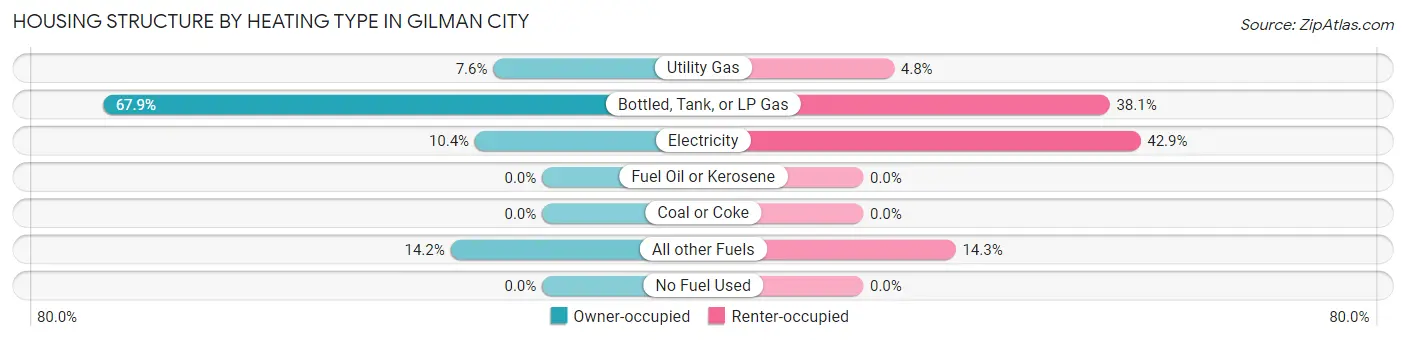
| Heating Type | Owner-occupied | Renter-occupied |
| Utility Gas | 8 (7.5%) | 2 (4.8%) |
| Bottled, Tank, or LP Gas | 72 (67.9%) | 16 (38.1%) |
| Electricity | 11 (10.4%) | 18 (42.9%) |
| Fuel Oil or Kerosene | 0 (0.0%) | 0 (0.0%) |
| Coal or Coke | 0 (0.0%) | 0 (0.0%) |
| All other Fuels | 15 (14.1%) | 6 (14.3%) |
| No Fuel Used | 0 (0.0%) | 0 (0.0%) |
| Total | 106 (100.0%) | 42 (100.0%) |
Household Vehicle Usage in Gilman City
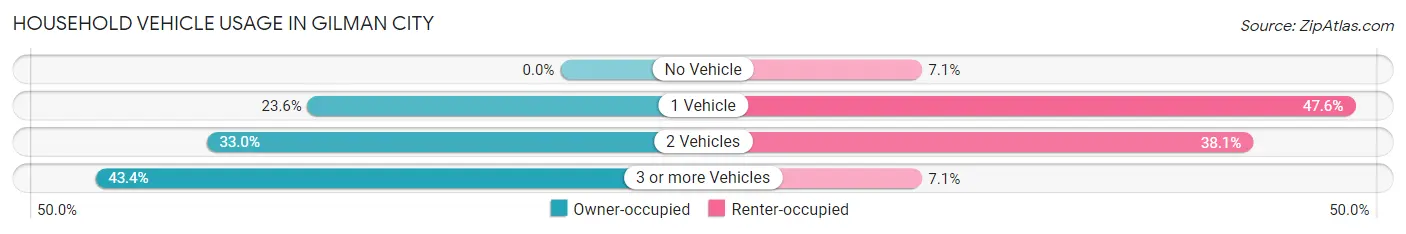
| Vehicles per Household | Owner-occupied | Renter-occupied |
| No Vehicle | 0 (0.0%) | 3 (7.1%) |
| 1 Vehicle | 25 (23.6%) | 20 (47.6%) |
| 2 Vehicles | 35 (33.0%) | 16 (38.1%) |
| 3 or more Vehicles | 46 (43.4%) | 3 (7.1%) |
| Total | 106 (100.0%) | 42 (100.0%) |
Real Estate & Mortgages in Gilman City
Real Estate and Mortgage Overview in Gilman City
| Characteristic | Without Mortgage | With Mortgage |
| Housing Units | 56 | 50 |
| Median Property Value | $52,900 | $67,300 |
| Median Household Income | $53,750 | $0 |
| Monthly Housing Costs | $520 | $0 |
| Real Estate Taxes | $317 | $0 |
Property Value by Mortgage Status in Gilman City
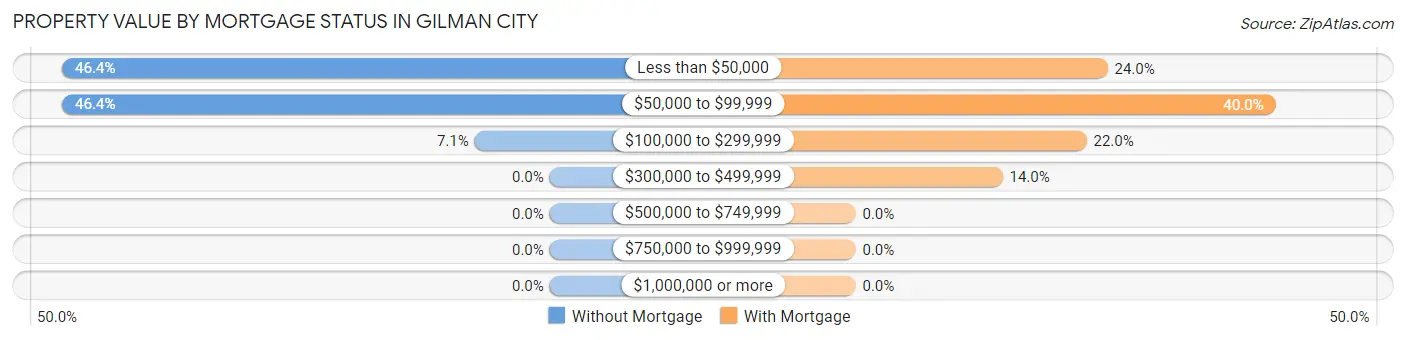
| Property Value | Without Mortgage | With Mortgage |
| Less than $50,000 | 26 (46.4%) | 12 (24.0%) |
| $50,000 to $99,999 | 26 (46.4%) | 20 (40.0%) |
| $100,000 to $299,999 | 4 (7.1%) | 11 (22.0%) |
| $300,000 to $499,999 | 0 (0.0%) | 7 (14.0%) |
| $500,000 to $749,999 | 0 (0.0%) | 0 (0.0%) |
| $750,000 to $999,999 | 0 (0.0%) | 0 (0.0%) |
| $1,000,000 or more | 0 (0.0%) | 0 (0.0%) |
| Total | 56 (100.0%) | 50 (100.0%) |
Household Income by Mortgage Status in Gilman City
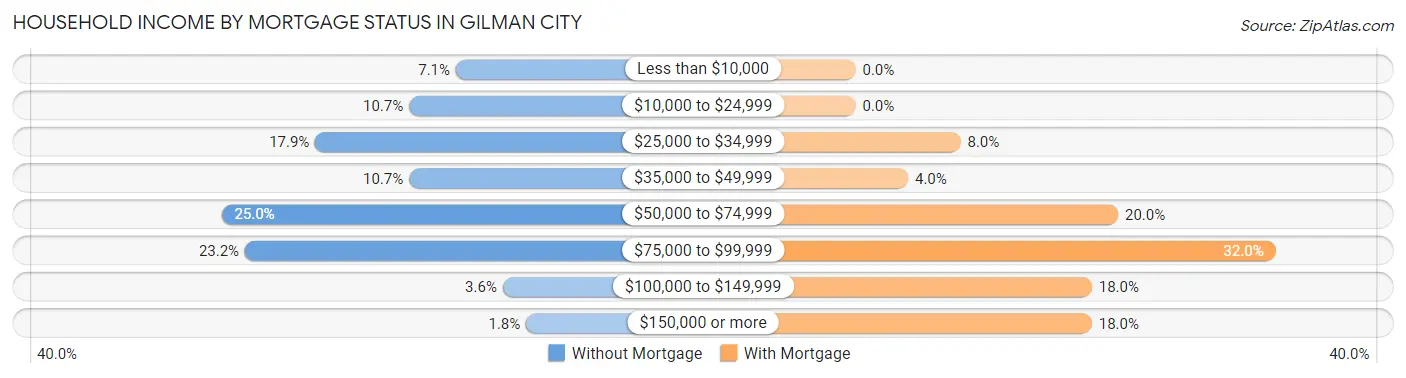
| Household Income | Without Mortgage | With Mortgage |
| Less than $10,000 | 4 (7.1%) | 0 (0.0%) |
| $10,000 to $24,999 | 6 (10.7%) | 0 (0.0%) |
| $25,000 to $34,999 | 10 (17.9%) | 4 (8.0%) |
| $35,000 to $49,999 | 6 (10.7%) | 2 (4.0%) |
| $50,000 to $74,999 | 14 (25.0%) | 10 (20.0%) |
| $75,000 to $99,999 | 13 (23.2%) | 16 (32.0%) |
| $100,000 to $149,999 | 2 (3.6%) | 9 (18.0%) |
| $150,000 or more | 1 (1.8%) | 9 (18.0%) |
| Total | 56 (100.0%) | 50 (100.0%) |
Property Value to Household Income Ratio in Gilman City
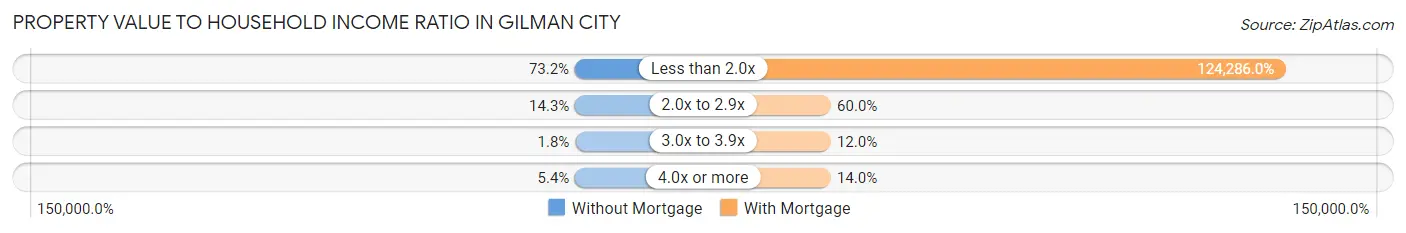
| Value-to-Income Ratio | Without Mortgage | With Mortgage |
| Less than 2.0x | 41 (73.2%) | 62,143 (124,286.0%) |
| 2.0x to 2.9x | 8 (14.3%) | 30 (60.0%) |
| 3.0x to 3.9x | 1 (1.8%) | 6 (12.0%) |
| 4.0x or more | 3 (5.4%) | 7 (14.0%) |
| Total | 56 (100.0%) | 50 (100.0%) |
Real Estate Taxes by Mortgage Status in Gilman City
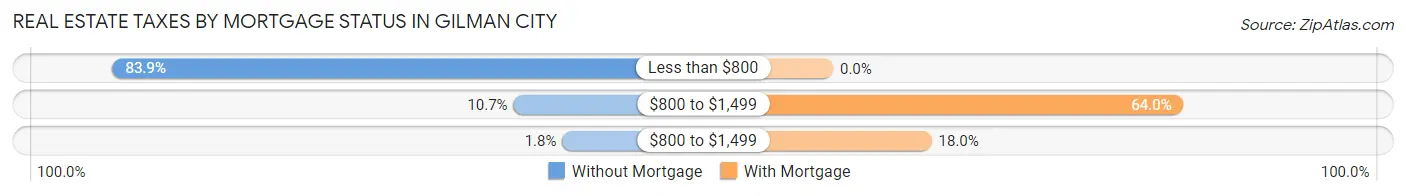
| Property Taxes | Without Mortgage | With Mortgage |
| Less than $800 | 47 (83.9%) | 0 (0.0%) |
| $800 to $1,499 | 6 (10.7%) | 32 (64.0%) |
| $800 to $1,499 | 1 (1.8%) | 9 (18.0%) |
| Total | 56 (100.0%) | 50 (100.0%) |
Health & Disability in Gilman City
Health Insurance Coverage by Age in Gilman City
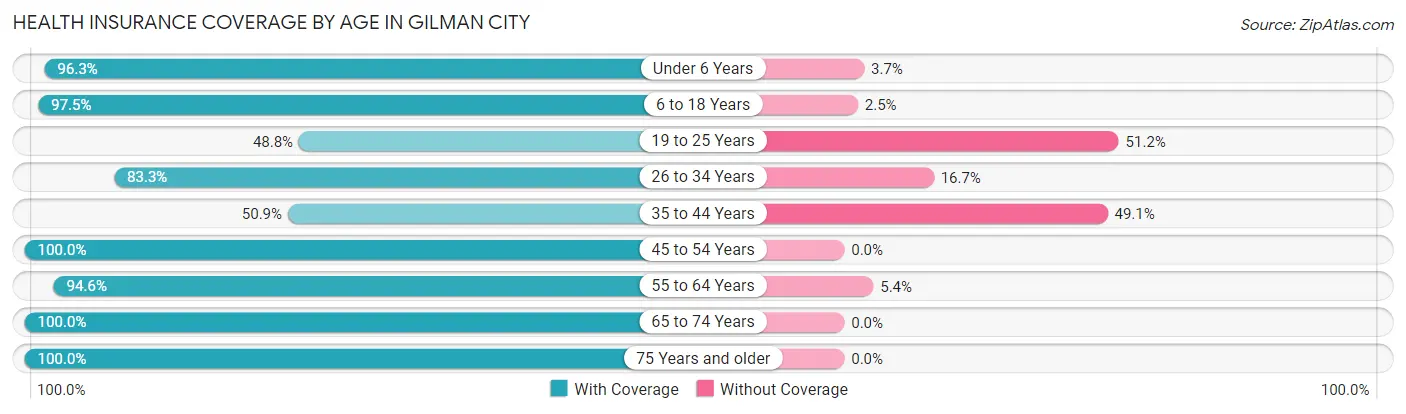
| Age Bracket | With Coverage | Without Coverage |
| Under 6 Years | 26 (96.3%) | 1 (3.7%) |
| 6 to 18 Years | 77 (97.5%) | 2 (2.5%) |
| 19 to 25 Years | 21 (48.8%) | 22 (51.2%) |
| 26 to 34 Years | 30 (83.3%) | 6 (16.7%) |
| 35 to 44 Years | 28 (50.9%) | 27 (49.1%) |
| 45 to 54 Years | 79 (100.0%) | 0 (0.0%) |
| 55 to 64 Years | 35 (94.6%) | 2 (5.4%) |
| 65 to 74 Years | 33 (100.0%) | 0 (0.0%) |
| 75 Years and older | 23 (100.0%) | 0 (0.0%) |
| Total | 352 (85.4%) | 60 (14.6%) |
Health Insurance Coverage by Citizenship Status in Gilman City
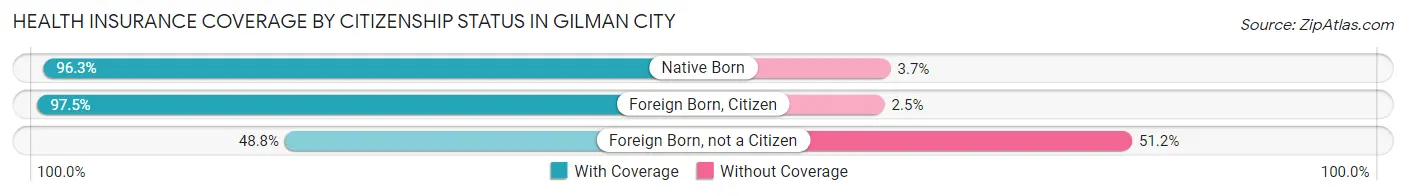
| Citizenship Status | With Coverage | Without Coverage |
| Native Born | 26 (96.3%) | 1 (3.7%) |
| Foreign Born, Citizen | 77 (97.5%) | 2 (2.5%) |
| Foreign Born, not a Citizen | 21 (48.8%) | 22 (51.2%) |
Health Insurance Coverage by Household Income in Gilman City
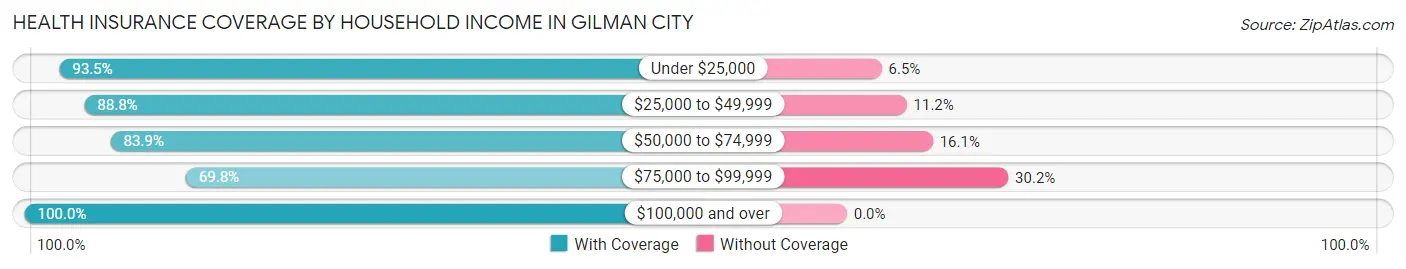
| Household Income | With Coverage | Without Coverage |
| Under $25,000 | 43 (93.5%) | 3 (6.5%) |
| $25,000 to $49,999 | 95 (88.8%) | 12 (11.2%) |
| $50,000 to $74,999 | 99 (83.9%) | 19 (16.1%) |
| $75,000 to $99,999 | 60 (69.8%) | 26 (30.2%) |
| $100,000 and over | 55 (100.0%) | 0 (0.0%) |
Public vs Private Health Insurance Coverage by Age in Gilman City
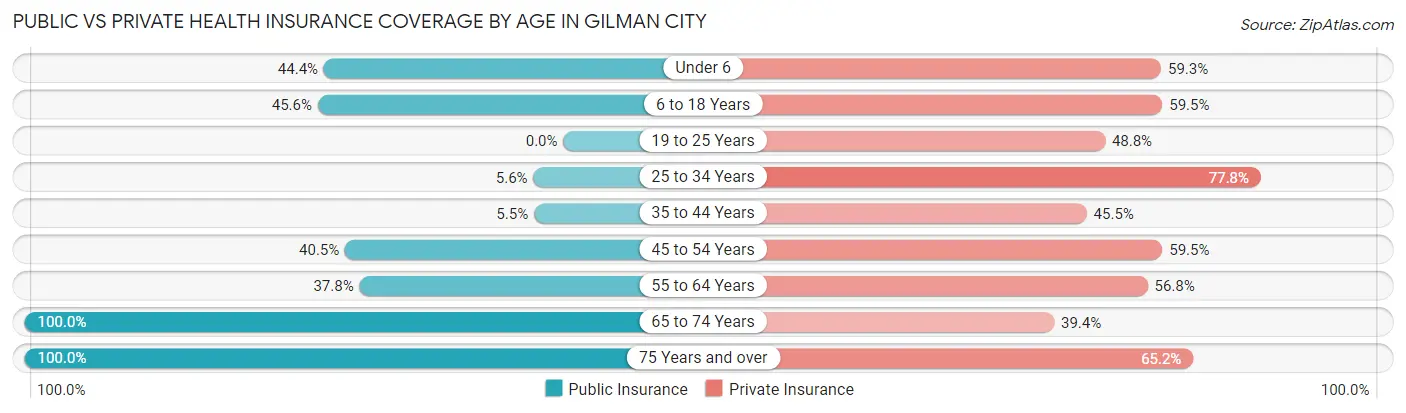
| Age Bracket | Public Insurance | Private Insurance |
| Under 6 | 12 (44.4%) | 16 (59.3%) |
| 6 to 18 Years | 36 (45.6%) | 47 (59.5%) |
| 19 to 25 Years | 0 (0.0%) | 21 (48.8%) |
| 25 to 34 Years | 2 (5.6%) | 28 (77.8%) |
| 35 to 44 Years | 3 (5.4%) | 25 (45.5%) |
| 45 to 54 Years | 32 (40.5%) | 47 (59.5%) |
| 55 to 64 Years | 14 (37.8%) | 21 (56.8%) |
| 65 to 74 Years | 33 (100.0%) | 13 (39.4%) |
| 75 Years and over | 23 (100.0%) | 15 (65.2%) |
| Total | 155 (37.6%) | 233 (56.6%) |
Disability Status by Sex by Age in Gilman City
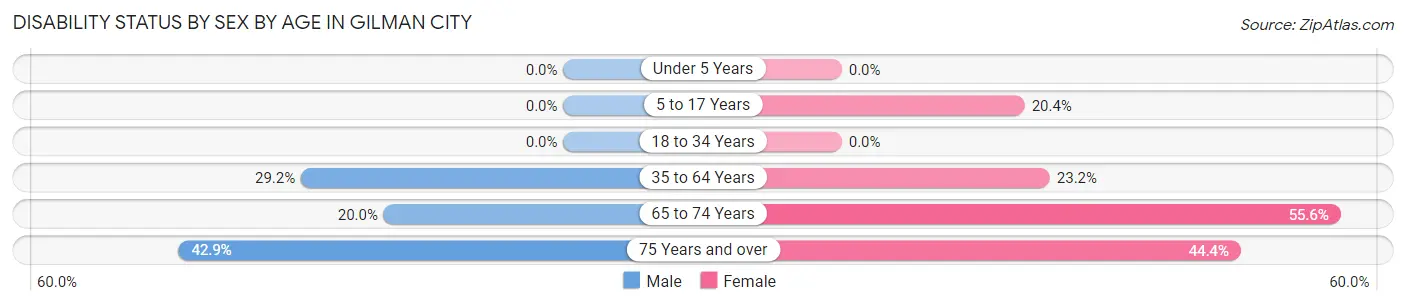
| Age Bracket | Male | Female |
| Under 5 Years | 0 (0.0%) | 0 (0.0%) |
| 5 to 17 Years | 0 (0.0%) | 11 (20.4%) |
| 18 to 34 Years | 0 (0.0%) | 0 (0.0%) |
| 35 to 64 Years | 26 (29.2%) | 19 (23.2%) |
| 65 to 74 Years | 3 (20.0%) | 10 (55.6%) |
| 75 Years and over | 6 (42.9%) | 4 (44.4%) |
Disability Class by Sex by Age in Gilman City
Disability Class: Hearing Difficulty
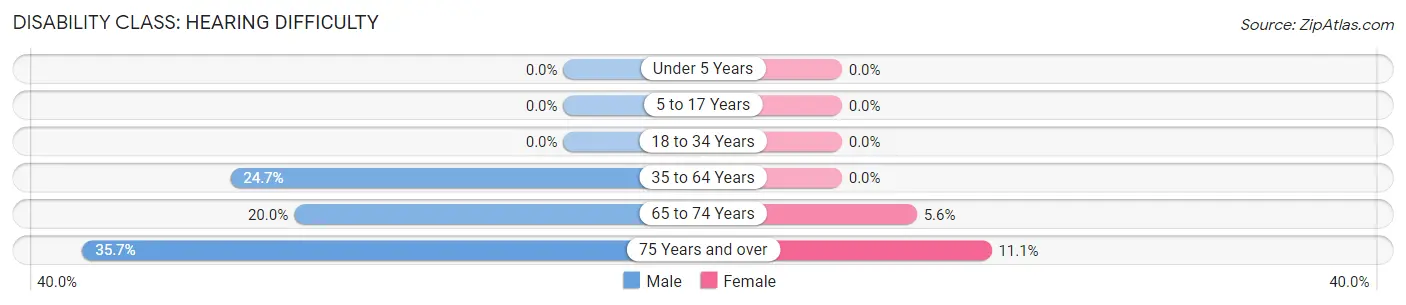
| Age Bracket | Male | Female |
| Under 5 Years | 0 (0.0%) | 0 (0.0%) |
| 5 to 17 Years | 0 (0.0%) | 0 (0.0%) |
| 18 to 34 Years | 0 (0.0%) | 0 (0.0%) |
| 35 to 64 Years | 22 (24.7%) | 0 (0.0%) |
| 65 to 74 Years | 3 (20.0%) | 1 (5.6%) |
| 75 Years and over | 5 (35.7%) | 1 (11.1%) |
Disability Class: Vision Difficulty
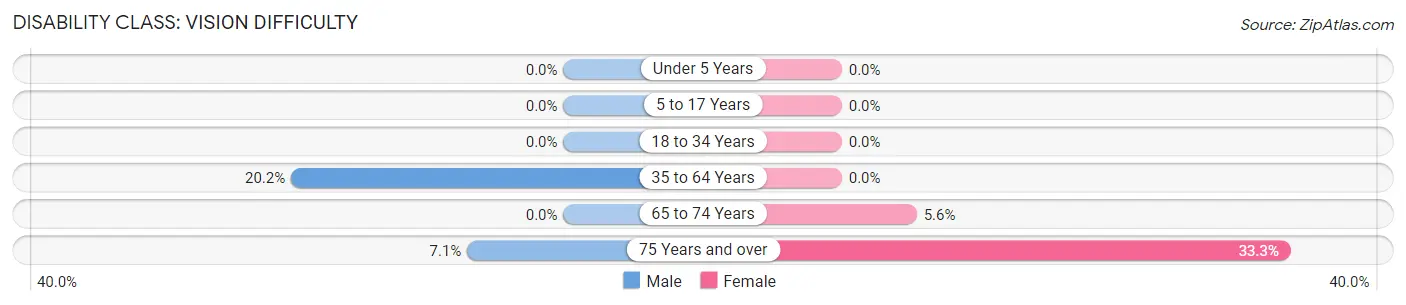
| Age Bracket | Male | Female |
| Under 5 Years | 0 (0.0%) | 0 (0.0%) |
| 5 to 17 Years | 0 (0.0%) | 0 (0.0%) |
| 18 to 34 Years | 0 (0.0%) | 0 (0.0%) |
| 35 to 64 Years | 18 (20.2%) | 0 (0.0%) |
| 65 to 74 Years | 0 (0.0%) | 1 (5.6%) |
| 75 Years and over | 1 (7.1%) | 3 (33.3%) |
Disability Class: Cognitive Difficulty
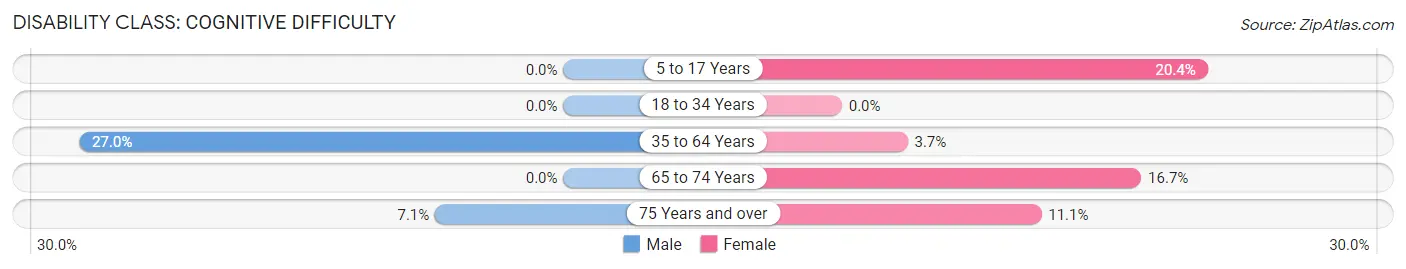
| Age Bracket | Male | Female |
| 5 to 17 Years | 0 (0.0%) | 11 (20.4%) |
| 18 to 34 Years | 0 (0.0%) | 0 (0.0%) |
| 35 to 64 Years | 24 (27.0%) | 3 (3.7%) |
| 65 to 74 Years | 0 (0.0%) | 3 (16.7%) |
| 75 Years and over | 1 (7.1%) | 1 (11.1%) |
Disability Class: Ambulatory Difficulty
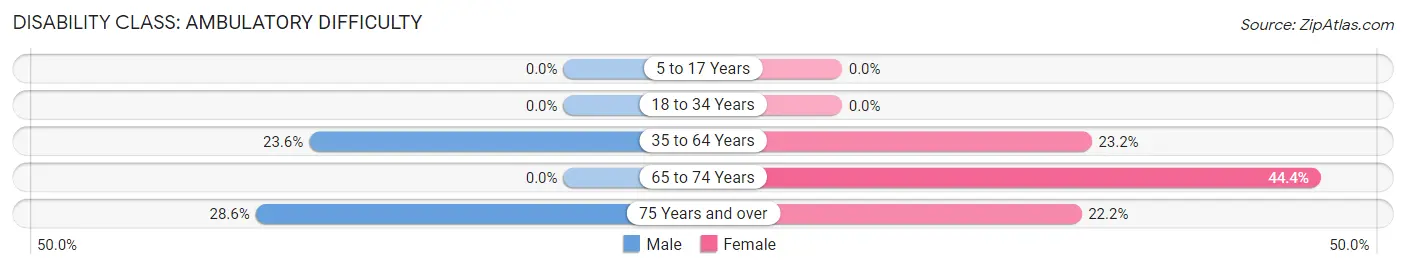
| Age Bracket | Male | Female |
| 5 to 17 Years | 0 (0.0%) | 0 (0.0%) |
| 18 to 34 Years | 0 (0.0%) | 0 (0.0%) |
| 35 to 64 Years | 21 (23.6%) | 19 (23.2%) |
| 65 to 74 Years | 0 (0.0%) | 8 (44.4%) |
| 75 Years and over | 4 (28.6%) | 2 (22.2%) |
Disability Class: Self-Care Difficulty
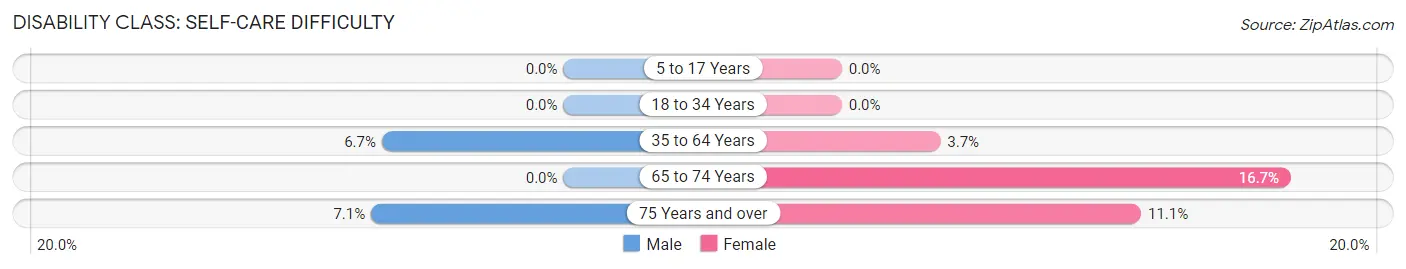
| Age Bracket | Male | Female |
| 5 to 17 Years | 0 (0.0%) | 0 (0.0%) |
| 18 to 34 Years | 0 (0.0%) | 0 (0.0%) |
| 35 to 64 Years | 6 (6.7%) | 3 (3.7%) |
| 65 to 74 Years | 0 (0.0%) | 3 (16.7%) |
| 75 Years and over | 1 (7.1%) | 1 (11.1%) |
Technology Access in Gilman City
Computing Device Access in Gilman City
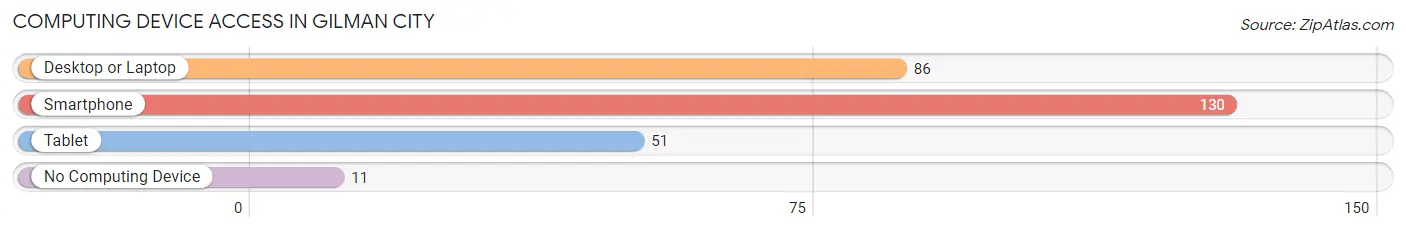
| Device Type | # Households | % Households |
| Desktop or Laptop | 86 | 58.1% |
| Smartphone | 130 | 87.8% |
| Tablet | 51 | 34.5% |
| No Computing Device | 11 | 7.4% |
| Total | 148 | 100.0% |
Internet Access in Gilman City
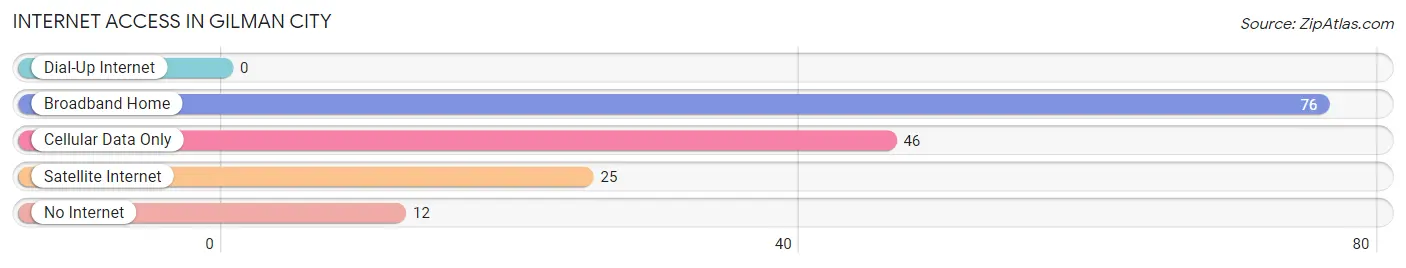
| Internet Type | # Households | % Households |
| Dial-Up Internet | 0 | 0.0% |
| Broadband Home | 76 | 51.3% |
| Cellular Data Only | 46 | 31.1% |
| Satellite Internet | 25 | 16.9% |
| No Internet | 12 | 8.1% |
| Total | 148 | 100.0% |
Gilman City Summary
Gilman City is a small town located in Harrison County, Missouri. It is situated in the northwest corner of the state, near the Iowa border. The town was founded in 1871 and has a population of approximately 500 people.
Geography
Gilman City is located in the northwest corner of Missouri, near the Iowa border. It is situated in the Missouri River Valley, which is part of the larger Mississippi River Valley. The town is surrounded by rolling hills and is located in a rural area. The nearest major city is St. Joseph, which is about 40 miles away.
The climate in Gilman City is typical of the Midwest, with hot summers and cold winters. The average temperature in the summer is around 80 degrees Fahrenheit, while the average temperature in the winter is around 30 degrees Fahrenheit. The town receives an average of 40 inches of precipitation per year.
Economy
The economy of Gilman City is largely based on agriculture. The town is home to several farms, which produce a variety of crops, including corn, soybeans, and wheat. The town also has a few small businesses, including a grocery store, a hardware store, and a few restaurants.
Demographics
As of the 2010 census, the population of Gilman City was 498 people. The racial makeup of the town was 97.2% White, 0.2% African American, 0.2% Native American, 0.2% Asian, 0.2% from other races, and 1.8% from two or more races. The median household income was $37,500, and the median family income was $41,250.
History
Gilman City was founded in 1871 by a group of settlers from Iowa. The town was named after one of the settlers, William Gilman. The town quickly grew and by the early 1900s, it had a population of over 500 people.
In the early 1900s, the town was a major center for the production of coal. The coal mines in the area provided jobs for many of the town’s residents. The coal industry declined in the mid-1900s, and the town’s population began to decline as well.
Today, Gilman City is a small, rural town. It is home to a few small businesses and farms, and the town’s population has remained relatively stable over the past few decades. The town is a popular destination for tourists, who come to enjoy the town’s rural charm and peaceful atmosphere.
Common Questions
What is Per Capita Income in Gilman City?
Per Capita income in Gilman City is $21,961.
What is the Median Family Income in Gilman City?
Median Family Income in Gilman City is $62,083.
What is the Median Household income in Gilman City?
Median Household Income in Gilman City is $50,714.
What is Income or Wage Gap in Gilman City?
Income or Wage Gap in Gilman City is 38.2%.
Women in Gilman City earn 61.8 cents for every dollar earned by a man.
What is Inequality or Gini Index in Gilman City?
Inequality or Gini Index in Gilman City is 0.35.
What is the Total Population of Gilman City?
Total Population of Gilman City is 412.
What is the Total Male Population of Gilman City?
Total Male Population of Gilman City is 210.
What is the Total Female Population of Gilman City?
Total Female Population of Gilman City is 202.
What is the Ratio of Males per 100 Females in Gilman City?
There are 103.96 Males per 100 Females in Gilman City.
What is the Ratio of Females per 100 Males in Gilman City?
There are 96.19 Females per 100 Males in Gilman City.
What is the Median Population Age in Gilman City?
Median Population Age in Gilman City is 42.1 Years.
What is the Average Family Size in Gilman City
Average Family Size in Gilman City is 3.4 People.
What is the Average Household Size in Gilman City
Average Household Size in Gilman City is 2.8 People.
How Large is the Labor Force in Gilman City?
There are 172 People in the Labor Forcein in Gilman City.
What is the Percentage of People in the Labor Force in Gilman City?
54.1% of People are in the Labor Force in Gilman City.
What is the Unemployment Rate in Gilman City?
Unemployment Rate in Gilman City is 1.7%.