Gasconade, MO Map & Demographics
Gasconade Map
Gasconade Overview
$31,743
PER CAPITA INCOME
$71,250
AVG FAMILY INCOME
$49,375
AVG HOUSEHOLD INCOME
0.57
INEQUALITY / GINI INDEX
254
TOTAL POPULATION
164
MALE POPULATION
90
FEMALE POPULATION
182.22
MALES / 100 FEMALES
54.88
FEMALES / 100 MALES
34.3
MEDIAN AGE
4.8
AVG FAMILY SIZE
3.8
AVG HOUSEHOLD SIZE
165
LABOR FORCE [ PEOPLE ]
70.2%
PERCENT IN LABOR FORCE
4.8%
UNEMPLOYMENT RATE
Gasconade Area Codes
Income in Gasconade
Income Overview in Gasconade
Per Capita Income in Gasconade is $31,743, while median incomes of families and households are $71,250 and $49,375 respectively.
| Characteristic | Number | Measure |
| Per Capita Income | 254 | $31,743 |
| Median Family Income | 48 | $71,250 |
| Mean Family Income | 48 | $119,394 |
| Median Household Income | 67 | $49,375 |
| Mean Household Income | 67 | $95,322 |
| Income Deficit | 48 | $0 |
| Wage / Income Gap (%) | 254 | 0.00% |
| Wage / Income Gap ($) | 254 | 100.00¢ per $1 |
| Gini / Inequality Index | 254 | 0.57 |
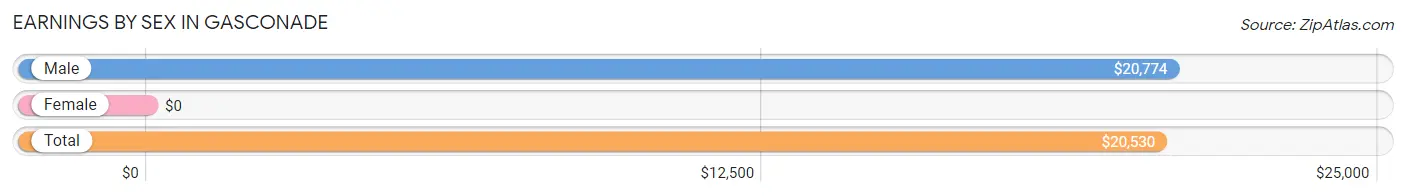
Earnings by Sex in Gasconade
| Sex | Number | Average Earnings |
| Male | 133 (77.3%) | $20,774 |
| Female | 39 (22.7%) | $0 |
| Total | 172 (100.0%) | $20,530 |
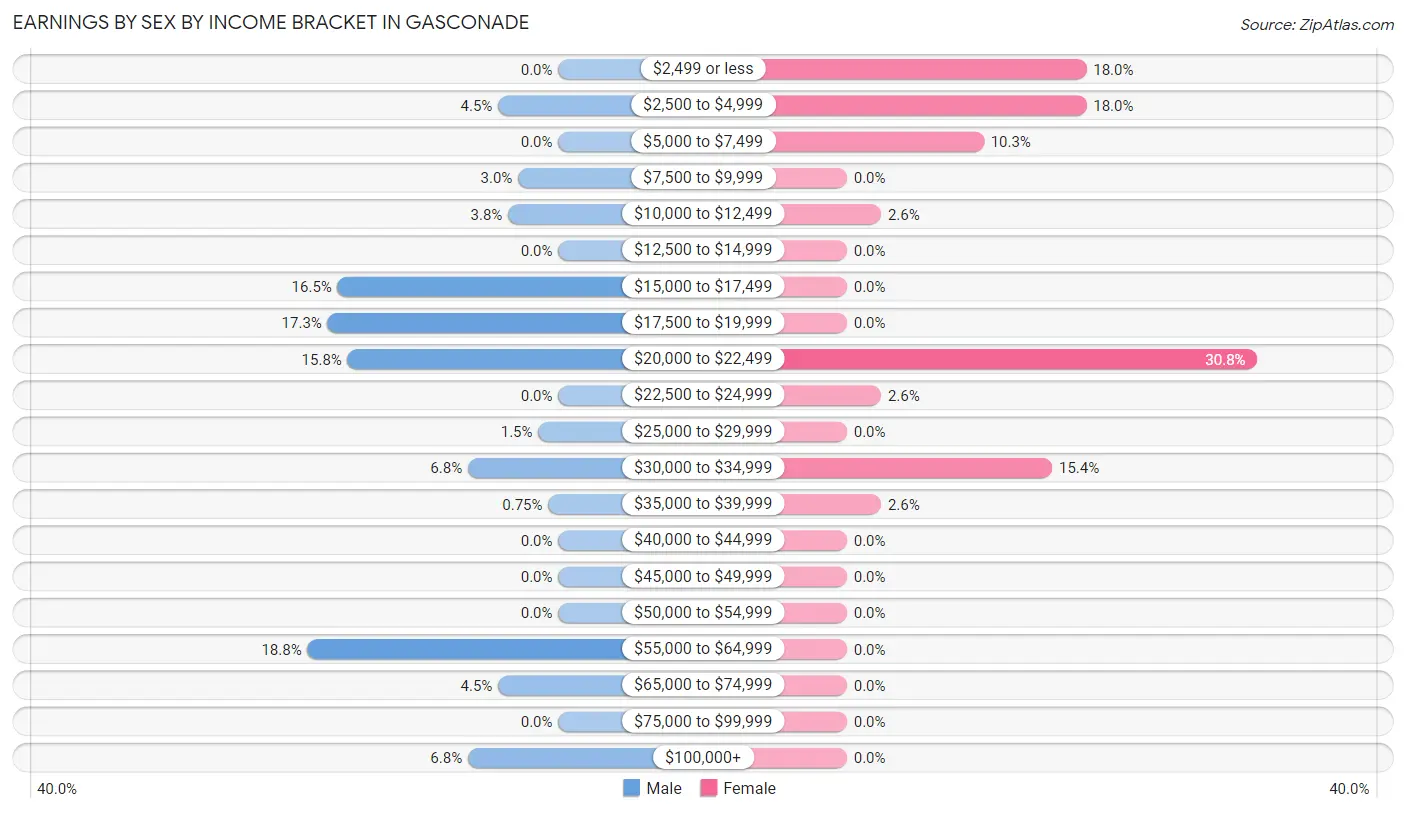
Earnings by Sex by Income Bracket in Gasconade
The most common earnings brackets in Gasconade are $55,000 to $64,999 for men (25 | 18.8%) and $20,000 to $22,499 for women (12 | 30.8%).
| Income | Male | Female |
| $2,499 or less | 0 (0.0%) | 7 (17.9%) |
| $2,500 to $4,999 | 6 (4.5%) | 7 (17.9%) |
| $5,000 to $7,499 | 0 (0.0%) | 4 (10.3%) |
| $7,500 to $9,999 | 4 (3.0%) | 0 (0.0%) |
| $10,000 to $12,499 | 5 (3.8%) | 1 (2.6%) |
| $12,500 to $14,999 | 0 (0.0%) | 0 (0.0%) |
| $15,000 to $17,499 | 22 (16.5%) | 0 (0.0%) |
| $17,500 to $19,999 | 23 (17.3%) | 0 (0.0%) |
| $20,000 to $22,499 | 21 (15.8%) | 12 (30.8%) |
| $22,500 to $24,999 | 0 (0.0%) | 1 (2.6%) |
| $25,000 to $29,999 | 2 (1.5%) | 0 (0.0%) |
| $30,000 to $34,999 | 9 (6.8%) | 6 (15.4%) |
| $35,000 to $39,999 | 1 (0.7%) | 1 (2.6%) |
| $40,000 to $44,999 | 0 (0.0%) | 0 (0.0%) |
| $45,000 to $49,999 | 0 (0.0%) | 0 (0.0%) |
| $50,000 to $54,999 | 0 (0.0%) | 0 (0.0%) |
| $55,000 to $64,999 | 25 (18.8%) | 0 (0.0%) |
| $65,000 to $74,999 | 6 (4.5%) | 0 (0.0%) |
| $75,000 to $99,999 | 0 (0.0%) | 0 (0.0%) |
| $100,000+ | 9 (6.8%) | 0 (0.0%) |
| Total | 133 (100.0%) | 39 (100.0%) |
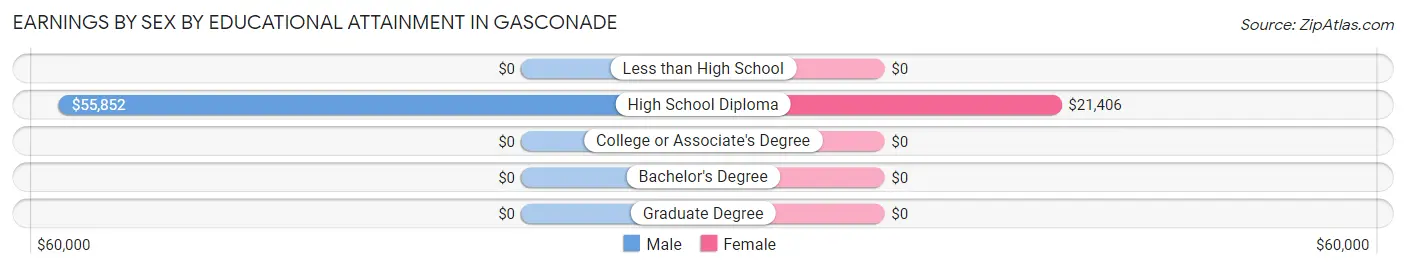
Earnings by Sex by Educational Attainment in Gasconade
Average earnings in Gasconade are $55,568 for men and $20,781 for women, a difference of 62.6%. Men with an educational attainment of high school diploma enjoy the highest average annual earnings of $55,852, while those with high school diploma education earn the least with $55,852. Women with an educational attainment of high school diploma earn the most with the average annual earnings of $21,406, while those with high school diploma education have the smallest earnings of $21,406.
| Educational Attainment | Male Income | Female Income |
| Less than High School | - | - |
| High School Diploma | $55,852 | $21,406 |
| College or Associate's Degree | - | - |
| Bachelor's Degree | - | - |
| Graduate Degree | - | - |
| Total | $55,568 | $20,781 |
Family Income in Gasconade
Family Income Brackets in Gasconade
According to the Gasconade family income data, there are 15 families falling into the $100,000 to $149,999 income range, which is the most common income bracket and makes up 31.2% of all families.
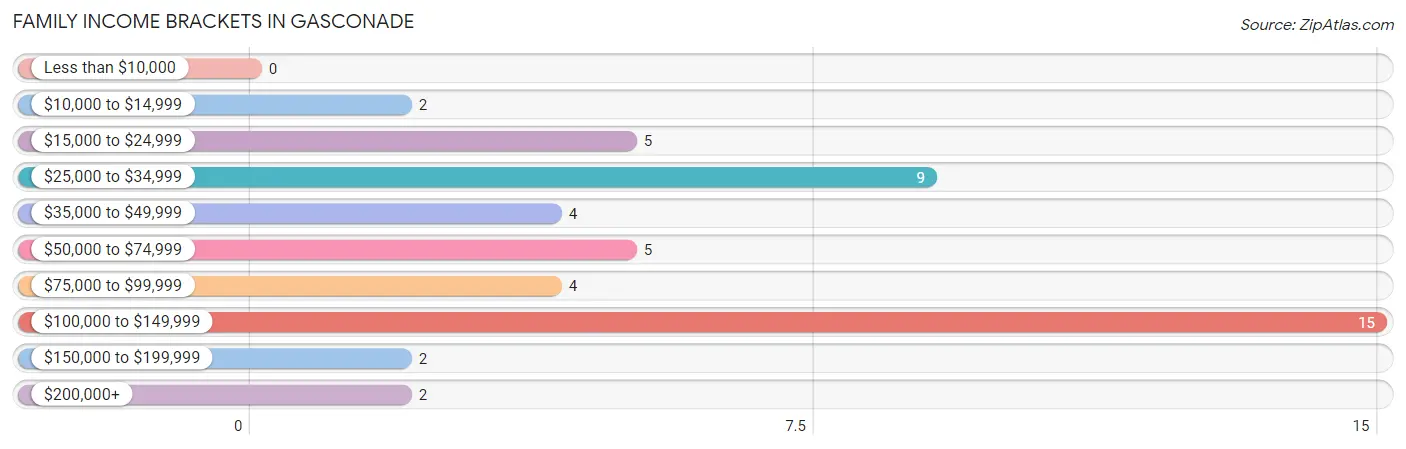
| Income Bracket | # Families | % Families |
| Less than $10,000 | 0 | 0.0% |
| $10,000 to $14,999 | 2 | 4.2% |
| $15,000 to $24,999 | 5 | 10.4% |
| $25,000 to $34,999 | 9 | 18.8% |
| $35,000 to $49,999 | 4 | 8.3% |
| $50,000 to $74,999 | 5 | 10.4% |
| $75,000 to $99,999 | 4 | 8.3% |
| $100,000 to $149,999 | 15 | 31.3% |
| $150,000 to $199,999 | 2 | 4.2% |
| $200,000+ | 2 | 4.2% |
Family Income by Famaliy Size in Gasconade
5-person families (11 | 22.9%) account for the highest median family income in Gasconade with $135,781 per family, while 5-person families (11 | 22.9%) have the highest median income of $27,156 per family member.
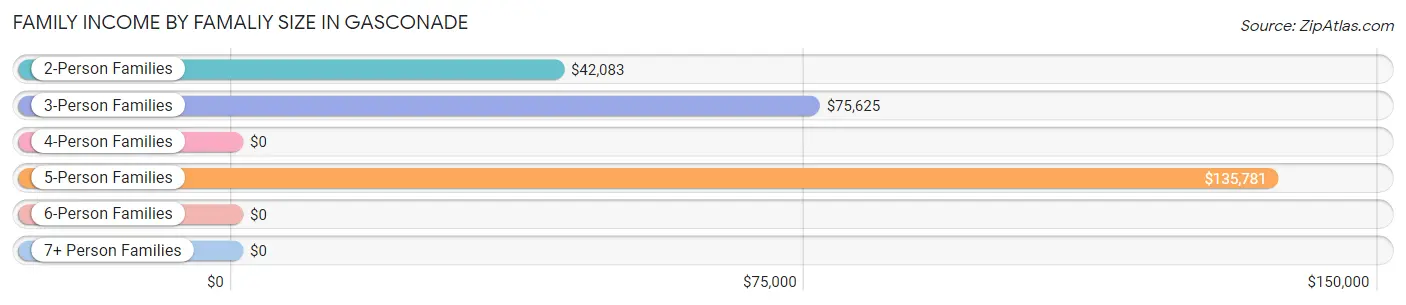
| Income Bracket | # Families | Median Income |
| 2-Person Families | 19 (39.6%) | $42,083 |
| 3-Person Families | 14 (29.2%) | $75,625 |
| 4-Person Families | 2 (4.2%) | $0 |
| 5-Person Families | 11 (22.9%) | $135,781 |
| 6-Person Families | 0 (0.0%) | $0 |
| 7+ Person Families | 2 (4.2%) | $0 |
| Total | 48 (100.0%) | $71,250 |
Family Income by Number of Earners in Gasconade
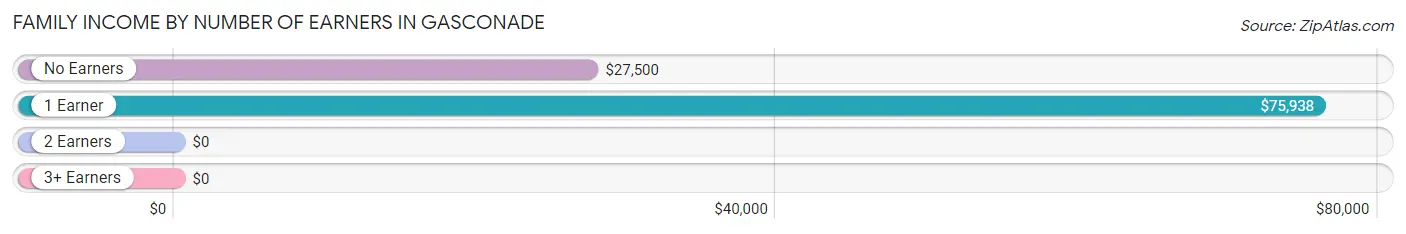
| Number of Earners | # Families | Median Income |
| No Earners | 10 (20.8%) | $27,500 |
| 1 Earner | 9 (18.8%) | $75,938 |
| 2 Earners | 19 (39.6%) | $0 |
| 3+ Earners | 10 (20.8%) | $0 |
| Total | 48 (100.0%) | $71,250 |
Household Income in Gasconade
Household Income Brackets in Gasconade
With 15 households falling in the category, the $100,000 to $149,999 income range is the most frequent in Gasconade, accounting for 22.4% of all households. In contrast, only 2 households (3.0%) fall into the $10,000 to $14,999 income bracket, making it the least populous group.
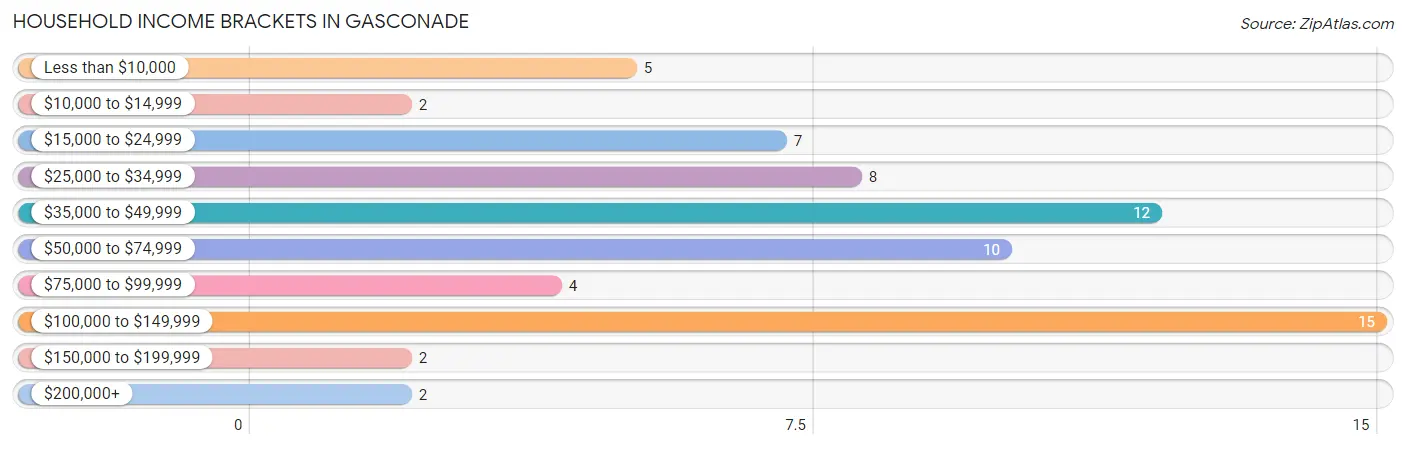
| Income Bracket | # Households | % Households |
| Less than $10,000 | 5 | 7.5% |
| $10,000 to $14,999 | 2 | 3.0% |
| $15,000 to $24,999 | 7 | 10.4% |
| $25,000 to $34,999 | 8 | 11.9% |
| $35,000 to $49,999 | 12 | 17.9% |
| $50,000 to $74,999 | 10 | 14.9% |
| $75,000 to $99,999 | 4 | 6.0% |
| $100,000 to $149,999 | 15 | 22.4% |
| $150,000 to $199,999 | 2 | 3.0% |
| $200,000+ | 2 | 3.0% |
Household Income by Householder Age in Gasconade
The median household income in Gasconade is $49,375, with the highest median household income of $135,313 found in the 25 to 44 years age bracket for the primary householder. A total of 14 households (20.9%) fall into this category. Meanwhile, the 15 to 24 years age bracket for the primary householder has the lowest median household income of $0, with 3 households (4.5%) in this group.
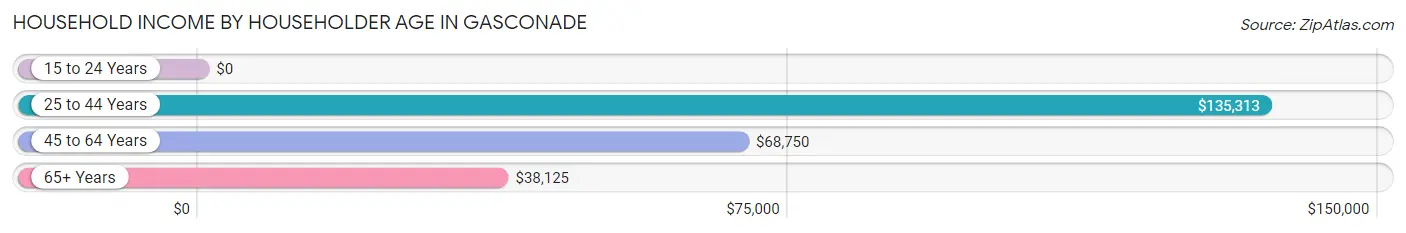
| Income Bracket | # Households | Median Income |
| 15 to 24 Years | 3 (4.5%) | $0 |
| 25 to 44 Years | 14 (20.9%) | $135,313 |
| 45 to 64 Years | 31 (46.3%) | $68,750 |
| 65+ Years | 19 (28.4%) | $38,125 |
| Total | 67 (100.0%) | $49,375 |
Poverty in Gasconade
Income Below Poverty by Sex and Age in Gasconade
With 6.1% poverty level for males and 17.8% for females among the residents of Gasconade, 35 to 44 year old males and 6 to 11 year old females are the most vulnerable to poverty, with 9 males (60.0%) and 4 females (66.7%) in their respective age groups living below the poverty level.
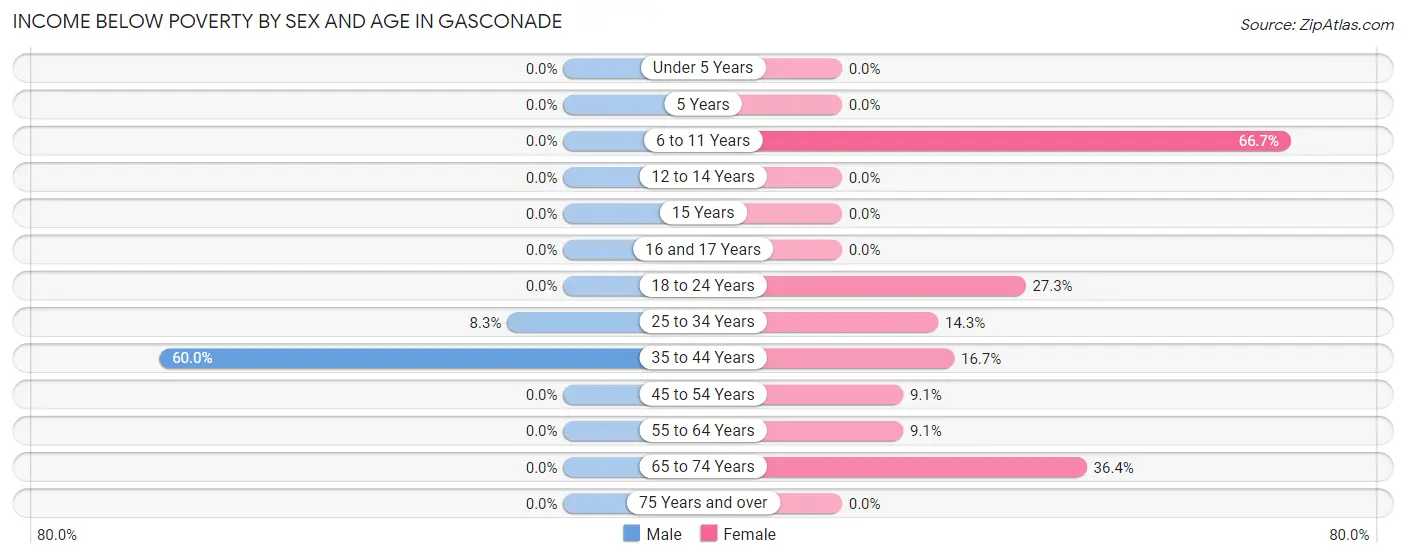
| Age Bracket | Male | Female |
| Under 5 Years | 0 (0.0%) | 0 (0.0%) |
| 5 Years | 0 (0.0%) | 0 (0.0%) |
| 6 to 11 Years | 0 (0.0%) | 4 (66.7%) |
| 12 to 14 Years | 0 (0.0%) | 0 (0.0%) |
| 15 Years | 0 (0.0%) | 0 (0.0%) |
| 16 and 17 Years | 0 (0.0%) | 0 (0.0%) |
| 18 to 24 Years | 0 (0.0%) | 3 (27.3%) |
| 25 to 34 Years | 1 (8.3%) | 1 (14.3%) |
| 35 to 44 Years | 9 (60.0%) | 2 (16.7%) |
| 45 to 54 Years | 0 (0.0%) | 1 (9.1%) |
| 55 to 64 Years | 0 (0.0%) | 1 (9.1%) |
| 65 to 74 Years | 0 (0.0%) | 4 (36.4%) |
| 75 Years and over | 0 (0.0%) | 0 (0.0%) |
| Total | 10 (6.1%) | 16 (17.8%) |
Income Above Poverty by Sex and Age in Gasconade
According to the poverty statistics in Gasconade, males aged 5 years and females aged under 5 years are the age groups that are most secure financially, with 100.0% of males and 100.0% of females in these age groups living above the poverty line.
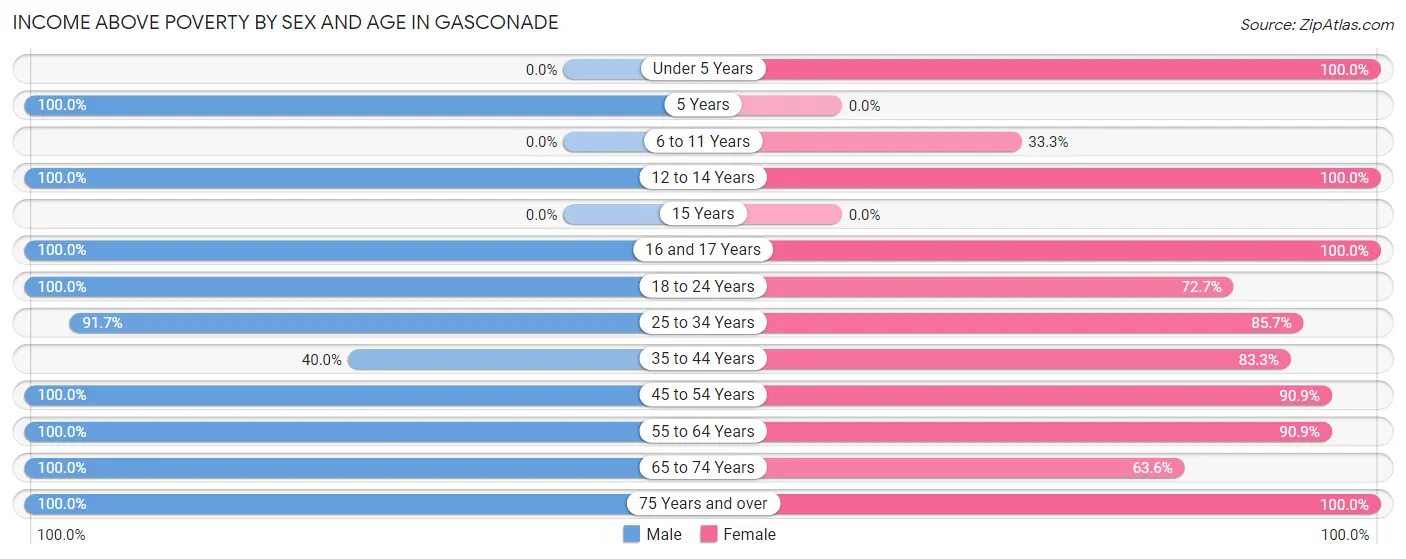
| Age Bracket | Male | Female |
| Under 5 Years | 0 (0.0%) | 8 (100.0%) |
| 5 Years | 1 (100.0%) | 0 (0.0%) |
| 6 to 11 Years | 0 (0.0%) | 2 (33.3%) |
| 12 to 14 Years | 3 (100.0%) | 1 (100.0%) |
| 15 Years | 0 (0.0%) | 0 (0.0%) |
| 16 and 17 Years | 19 (100.0%) | 10 (100.0%) |
| 18 to 24 Years | 52 (100.0%) | 8 (72.7%) |
| 25 to 34 Years | 11 (91.7%) | 6 (85.7%) |
| 35 to 44 Years | 6 (40.0%) | 10 (83.3%) |
| 45 to 54 Years | 39 (100.0%) | 10 (90.9%) |
| 55 to 64 Years | 10 (100.0%) | 10 (90.9%) |
| 65 to 74 Years | 10 (100.0%) | 7 (63.6%) |
| 75 Years and over | 3 (100.0%) | 2 (100.0%) |
| Total | 154 (93.9%) | 74 (82.2%) |
Income Below Poverty Among Married-Couple Families in Gasconade
The poverty statistics for married-couple families in Gasconade show that 6.5% or 2 of the total 31 families live below the poverty line. Families with 1 or 2 children have the highest poverty rate of 20.0%, comprising of 2 families. On the other hand, families with no children have the lowest poverty rate of 0.0%, which includes 0 families.
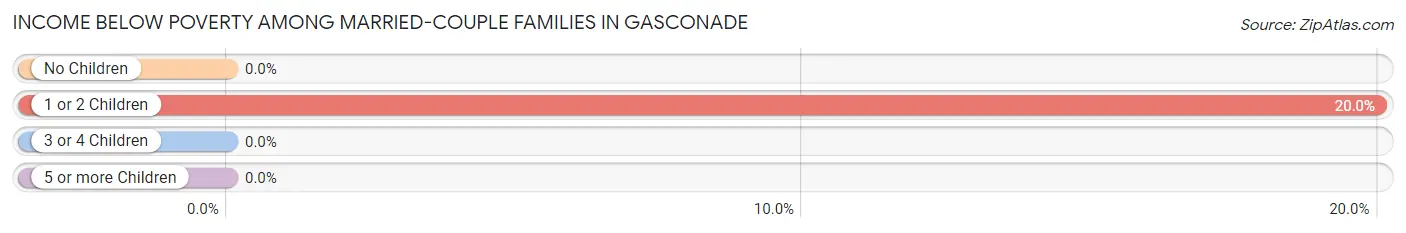
| Children | Above Poverty | Below Poverty |
| No Children | 18 (100.0%) | 0 (0.0%) |
| 1 or 2 Children | 8 (80.0%) | 2 (20.0%) |
| 3 or 4 Children | 3 (100.0%) | 0 (0.0%) |
| 5 or more Children | 0 (0.0%) | 0 (0.0%) |
| Total | 29 (93.5%) | 2 (6.5%) |
Income Below Poverty Among Single-Parent Households in Gasconade
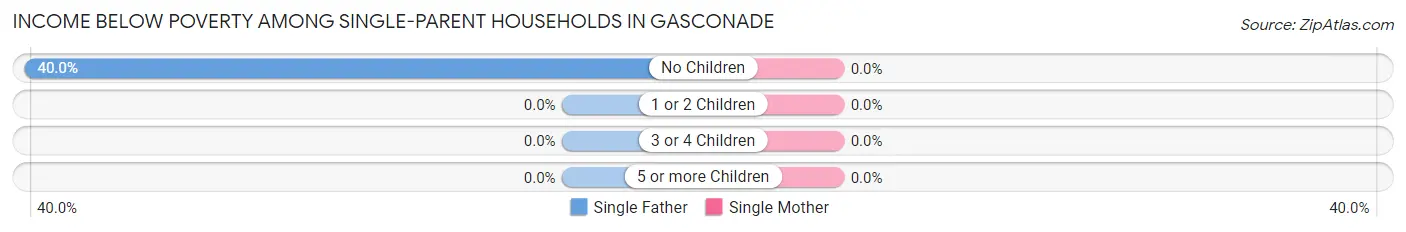
| Children | Single Father | Single Mother |
| No Children | 2 (40.0%) | 0 (0.0%) |
| 1 or 2 Children | 0 (0.0%) | 0 (0.0%) |
| 3 or 4 Children | 0 (0.0%) | 0 (0.0%) |
| 5 or more Children | 0 (0.0%) | 0 (0.0%) |
| Total | 2 (16.7%) | 0 (0.0%) |
Income Below Poverty Among Married-Couple vs Single-Parent Households in Gasconade
The poverty data for Gasconade shows that 2 of the married-couple family households (6.5%) and 2 of the single-parent households (11.8%) are living below the poverty level. Within the married-couple family households, those with 1 or 2 children have the highest poverty rate, with 2 households (20.0%) falling below the poverty line. Among the single-parent households, those with no children have the highest poverty rate, with 2 household (20.0%) living below poverty.
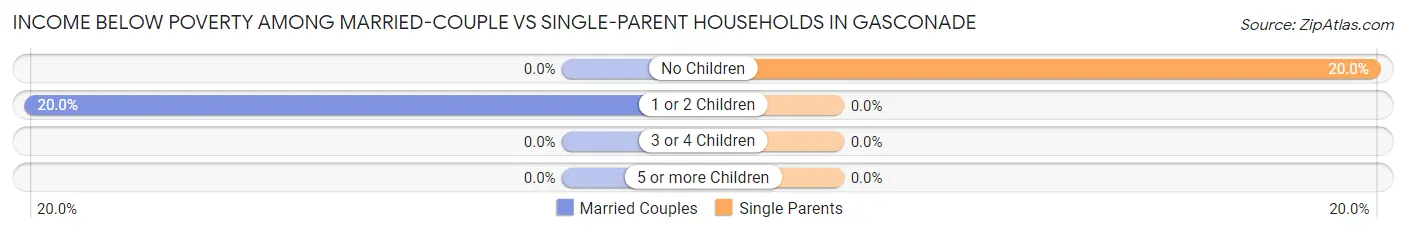
| Children | Married-Couple Families | Single-Parent Households |
| No Children | 0 (0.0%) | 2 (20.0%) |
| 1 or 2 Children | 2 (20.0%) | 0 (0.0%) |
| 3 or 4 Children | 0 (0.0%) | 0 (0.0%) |
| 5 or more Children | 0 (0.0%) | 0 (0.0%) |
| Total | 2 (6.5%) | 2 (11.8%) |
Race in Gasconade
The most populous races in Gasconade are White / Caucasian (170 | 66.9%), Hawaiian / Pacific (62 | 24.4%), and Two or more Races (22 | 8.7%).
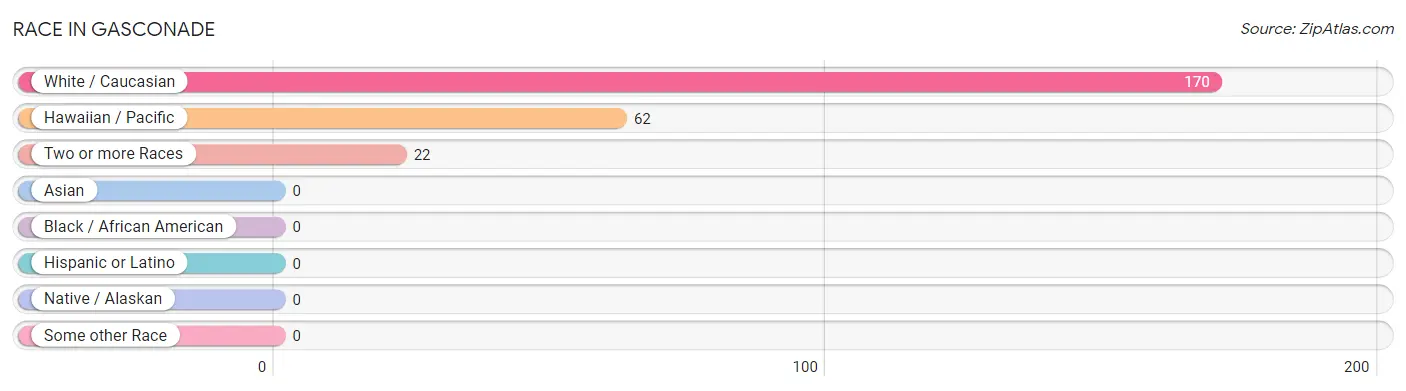
| Race | # Population | % Population |
| Asian | 0 | 0.0% |
| Black / African American | 0 | 0.0% |
| Hawaiian / Pacific | 62 | 24.4% |
| Hispanic or Latino | 0 | 0.0% |
| Native / Alaskan | 0 | 0.0% |
| White / Caucasian | 170 | 66.9% |
| Two or more Races | 22 | 8.7% |
| Some other Race | 0 | 0.0% |
| Total | 254 | 100.0% |
Ancestry in Gasconade
The most populous ancestries reported in Gasconade are Irish (69 | 27.2%), German (31 | 12.2%), Polish (28 | 11.0%), English (26 | 10.2%), and American (25 | 9.8%), together accounting for 70.5% of all Gasconade residents.
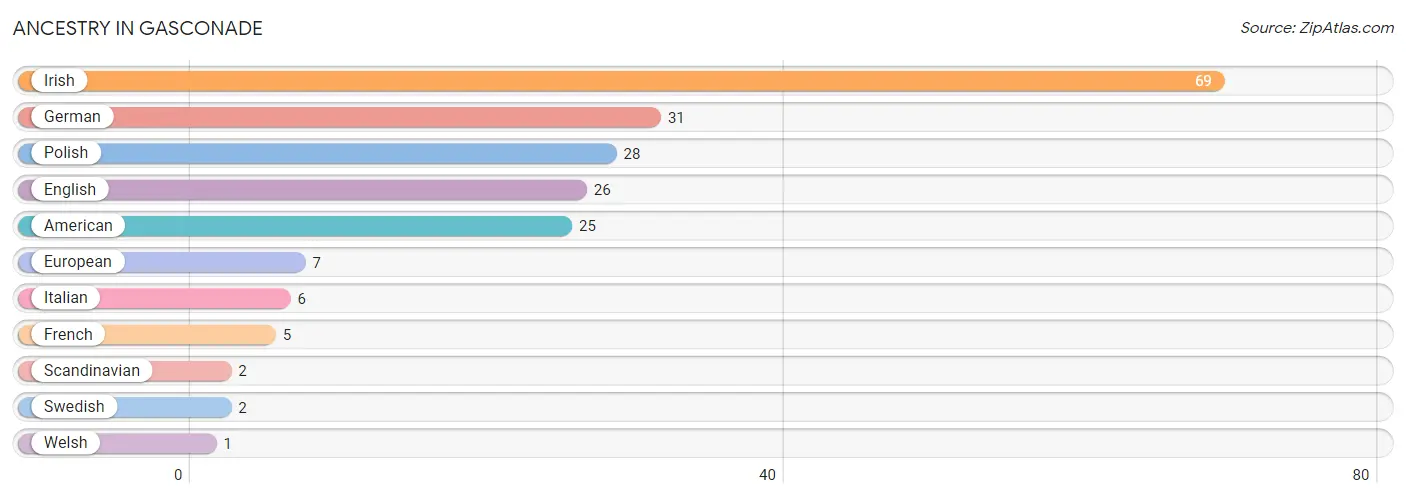
| Ancestry | # Population | % Population |
| American | 25 | 9.8% |
| English | 26 | 10.2% |
| European | 7 | 2.8% |
| French | 5 | 2.0% |
| German | 31 | 12.2% |
| Irish | 69 | 27.2% |
| Italian | 6 | 2.4% |
| Polish | 28 | 11.0% |
| Scandinavian | 2 | 0.8% |
| Swedish | 2 | 0.8% |
| Welsh | 1 | 0.4% | View All 11 Rows |
Immigrants in Gasconade

| Immigration Origin | # Population | % Population | View All 0 Rows |
Sex and Age in Gasconade
Sex and Age in Gasconade
The most populous age groups in Gasconade are 15 to 19 Years (39 | 23.8%) for men and 15 to 19 Years (17 | 18.9%) for women.
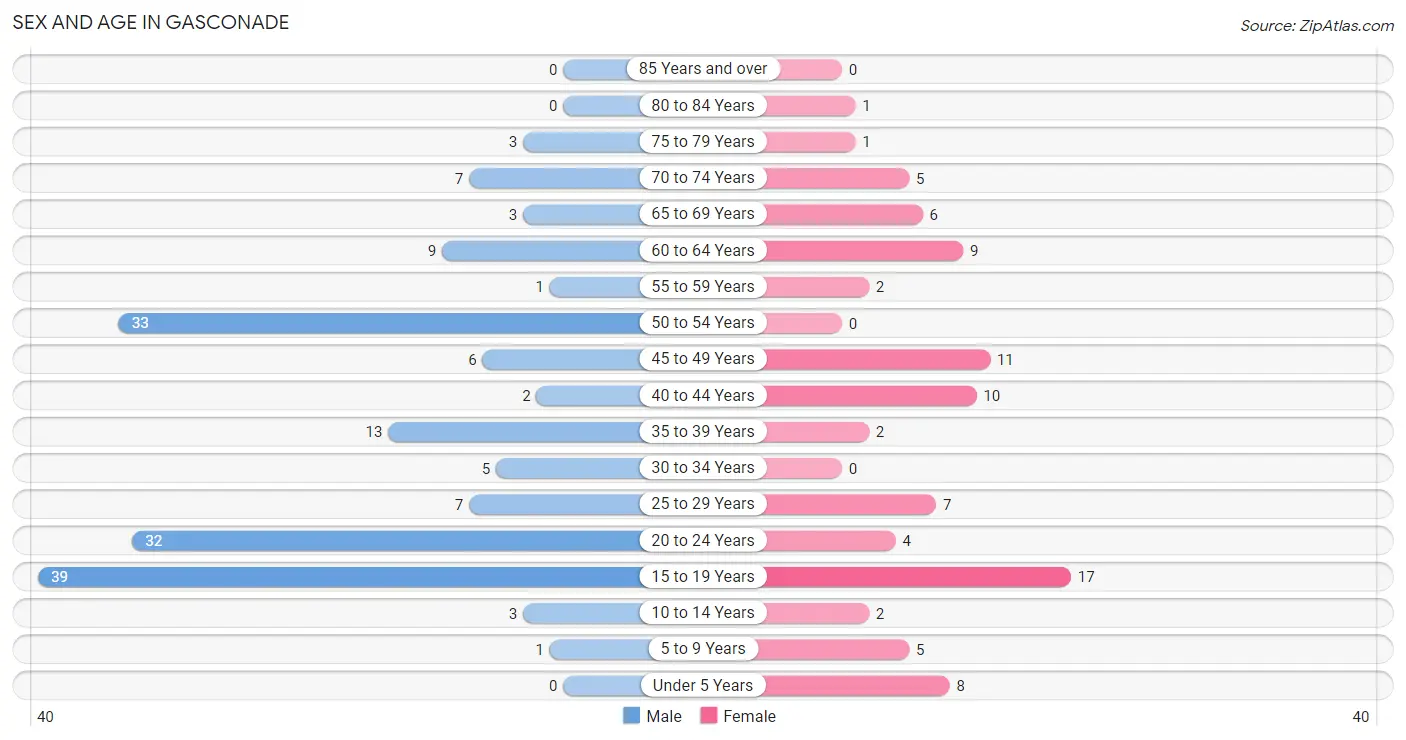
| Age Bracket | Male | Female |
| Under 5 Years | 0 (0.0%) | 8 (8.9%) |
| 5 to 9 Years | 1 (0.6%) | 5 (5.6%) |
| 10 to 14 Years | 3 (1.8%) | 2 (2.2%) |
| 15 to 19 Years | 39 (23.8%) | 17 (18.9%) |
| 20 to 24 Years | 32 (19.5%) | 4 (4.4%) |
| 25 to 29 Years | 7 (4.3%) | 7 (7.8%) |
| 30 to 34 Years | 5 (3.0%) | 0 (0.0%) |
| 35 to 39 Years | 13 (7.9%) | 2 (2.2%) |
| 40 to 44 Years | 2 (1.2%) | 10 (11.1%) |
| 45 to 49 Years | 6 (3.7%) | 11 (12.2%) |
| 50 to 54 Years | 33 (20.1%) | 0 (0.0%) |
| 55 to 59 Years | 1 (0.6%) | 2 (2.2%) |
| 60 to 64 Years | 9 (5.5%) | 9 (10.0%) |
| 65 to 69 Years | 3 (1.8%) | 6 (6.7%) |
| 70 to 74 Years | 7 (4.3%) | 5 (5.6%) |
| 75 to 79 Years | 3 (1.8%) | 1 (1.1%) |
| 80 to 84 Years | 0 (0.0%) | 1 (1.1%) |
| 85 Years and over | 0 (0.0%) | 0 (0.0%) |
| Total | 164 (100.0%) | 90 (100.0%) |
Families and Households in Gasconade
Median Family Size in Gasconade
The median family size in Gasconade is 4.75 persons per family, with married-couple families (31 | 64.6%) accounting for the largest median family size of 6 persons per family. On the other hand, single female/mother families (5 | 10.4%) represent the smallest median family size with 1.60 persons per family.
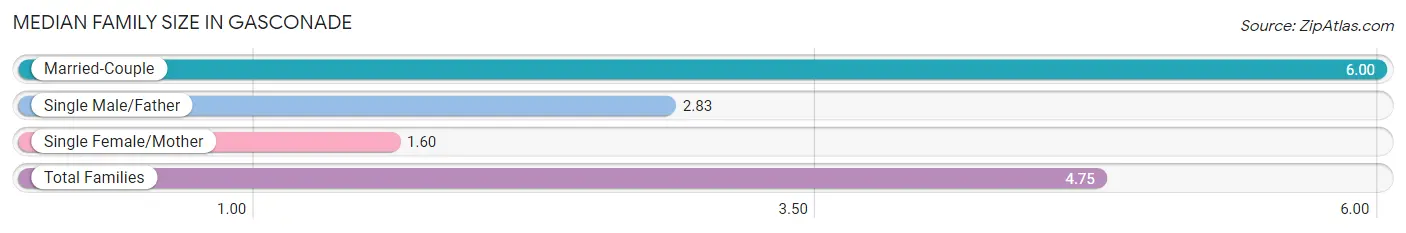
| Family Type | # Families | Family Size |
| Married-Couple | 31 (64.6%) | 6.00 |
| Single Male/Father | 12 (25.0%) | 2.83 |
| Single Female/Mother | 5 (10.4%) | 1.60 |
| Total Families | 48 (100.0%) | 4.75 |
Median Household Size in Gasconade
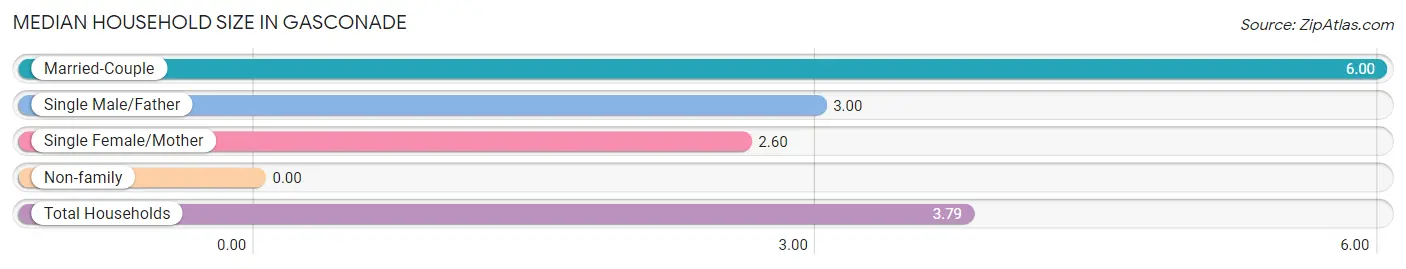
| Household Type | # Households | Household Size |
| Married-Couple | 31 (46.3%) | 6.00 |
| Single Male/Father | 12 (17.9%) | 3.00 |
| Single Female/Mother | 5 (7.5%) | 2.60 |
| Non-family | 19 (28.4%) | - |
| Total Households | 67 (100.0%) | 3.79 |
Household Size by Marriage Status in Gasconade
Out of a total of 67 households in Gasconade, 48 (71.6%) are family households, while 19 (28.4%) are nonfamily households. The most numerous type of family households are 3-person households, comprising 18, and the most common type of nonfamily households are 1-person households, comprising 19.
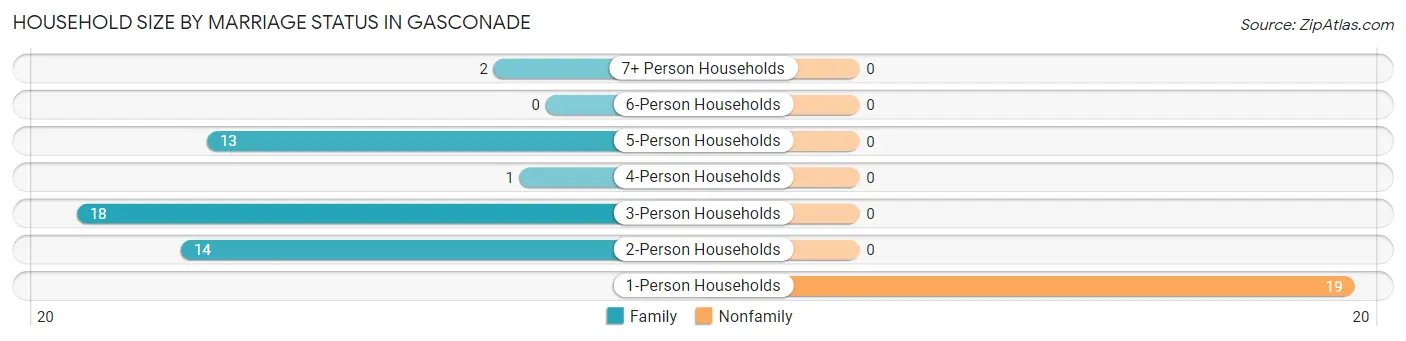
| Household Size | Family Households | Nonfamily Households |
| 1-Person Households | - | 19 (28.4%) |
| 2-Person Households | 14 (20.9%) | 0 (0.0%) |
| 3-Person Households | 18 (26.9%) | 0 (0.0%) |
| 4-Person Households | 1 (1.5%) | 0 (0.0%) |
| 5-Person Households | 13 (19.4%) | 0 (0.0%) |
| 6-Person Households | 0 (0.0%) | 0 (0.0%) |
| 7+ Person Households | 2 (3.0%) | 0 (0.0%) |
| Total | 48 (71.6%) | 19 (28.4%) |
Female Fertility in Gasconade
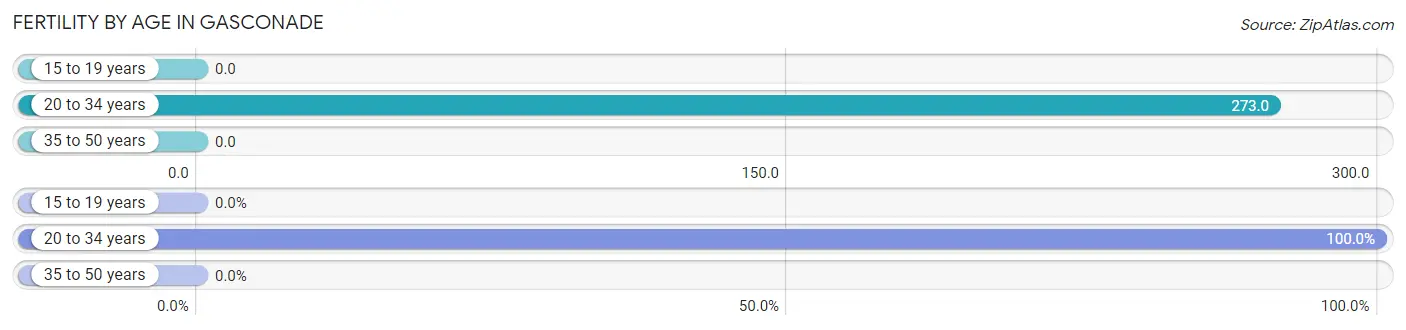
Fertility by Age in Gasconade
Average fertility rate in Gasconade is 59.0 births per 1,000 women. Women in the age bracket of 20 to 34 years have the highest fertility rate with 273.0 births per 1,000 women. Women in the age bracket of 20 to 34 years acount for 100.0% of all women with births.
| Age Bracket | Women with Births | Births / 1,000 Women |
| 15 to 19 years | 0 (0.0%) | 0.0 |
| 20 to 34 years | 3 (100.0%) | 273.0 |
| 35 to 50 years | 0 (0.0%) | 0.0 |
| Total | 3 (100.0%) | 59.0 |
Fertility by Age by Marriage Status in Gasconade
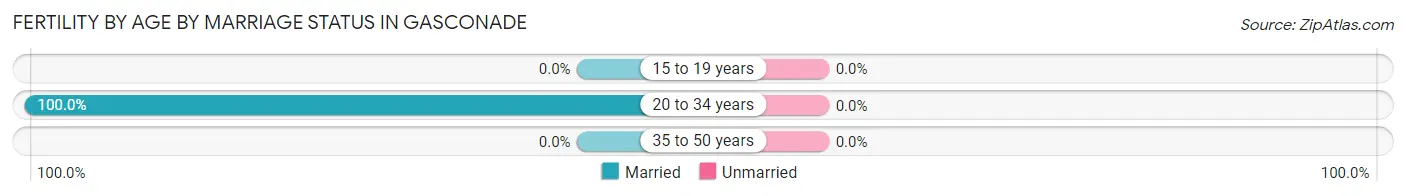
| Age Bracket | Married | Unmarried |
| 15 to 19 years | 0 (0.0%) | 0 (0.0%) |
| 20 to 34 years | 3 (100.0%) | 0 (0.0%) |
| 35 to 50 years | 0 (0.0%) | 0 (0.0%) |
| Total | 3 (100.0%) | 0 (0.0%) |
Fertility by Education in Gasconade
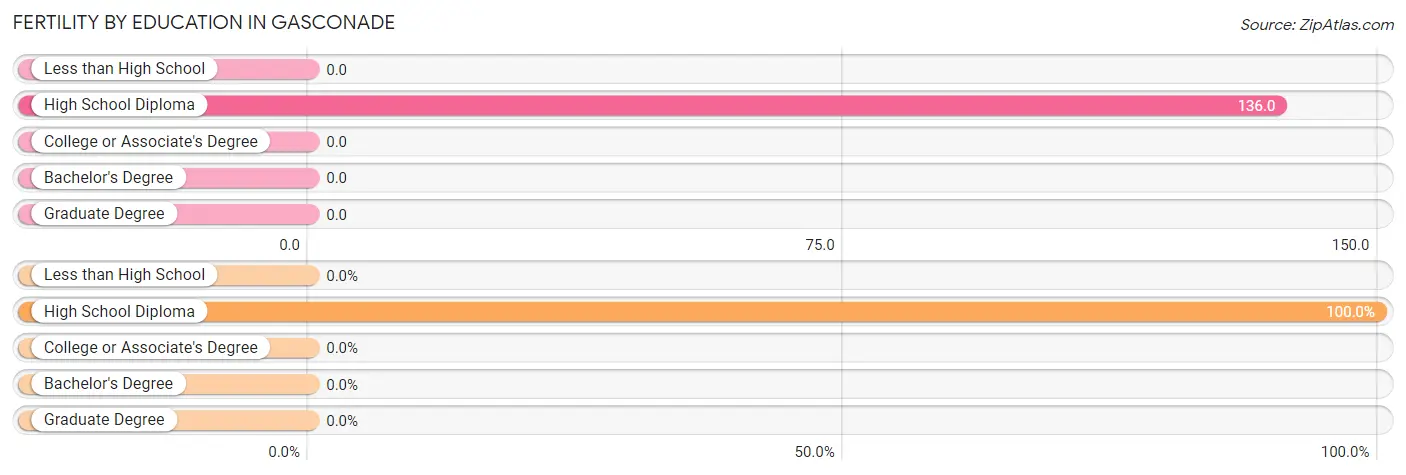
| Educational Attainment | Women with Births | Births / 1,000 Women |
| Less than High School | 0 (0.0%) | 0.0 |
| High School Diploma | 3 (100.0%) | 136.0 |
| College or Associate's Degree | 0 (0.0%) | 0.0 |
| Bachelor's Degree | 0 (0.0%) | 0.0 |
| Graduate Degree | 0 (0.0%) | 0.0 |
| Total | 3 (100.0%) | 59.0 |
Fertility by Education by Marriage Status in Gasconade
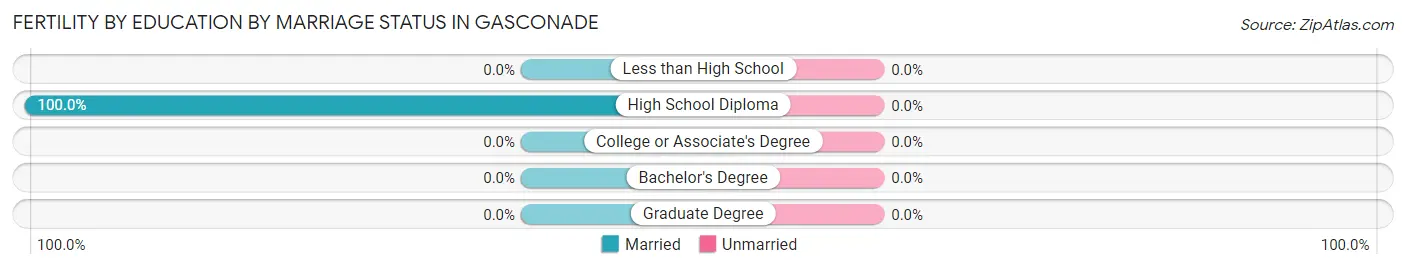
| Educational Attainment | Married | Unmarried |
| Less than High School | 0 (0.0%) | 0 (0.0%) |
| High School Diploma | 3 (100.0%) | 0 (0.0%) |
| College or Associate's Degree | 0 (0.0%) | 0 (0.0%) |
| Bachelor's Degree | 0 (0.0%) | 0 (0.0%) |
| Graduate Degree | 0 (0.0%) | 0 (0.0%) |
| Total | 3 (100.0%) | 0 (0.0%) |
Employment Characteristics in Gasconade
Employment by Class of Employer in Gasconade
Among the 157 employed individuals in Gasconade, private company employees (131 | 83.4%), self-employed (not incorporated) (16 | 10.2%), and local government employees (5 | 3.2%) make up the most common classes of employment.
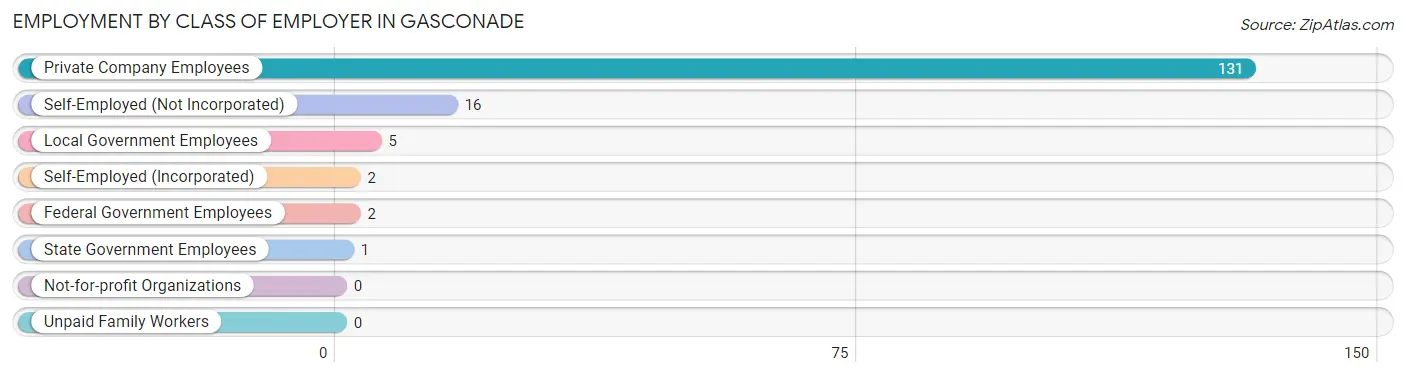
| Employer Class | # Employees | % Employees |
| Private Company Employees | 131 | 83.4% |
| Self-Employed (Incorporated) | 2 | 1.3% |
| Self-Employed (Not Incorporated) | 16 | 10.2% |
| Not-for-profit Organizations | 0 | 0.0% |
| Local Government Employees | 5 | 3.2% |
| State Government Employees | 1 | 0.6% |
| Federal Government Employees | 2 | 1.3% |
| Unpaid Family Workers | 0 | 0.0% |
| Total | 157 | 100.0% |
Employment Status by Age in Gasconade
According to the labor force statistics for Gasconade, out of the total population over 16 years of age (235), 70.2% or 165 individuals are in the labor force, with 4.8% or 8 of them unemployed. The age group with the highest labor force participation rate is 25 to 29 years, with 100.0% or 14 individuals in the labor force. Within the labor force, the 45 to 54 years age range has the highest percentage of unemployed individuals, with 10.0% or 4 of them being unemployed.
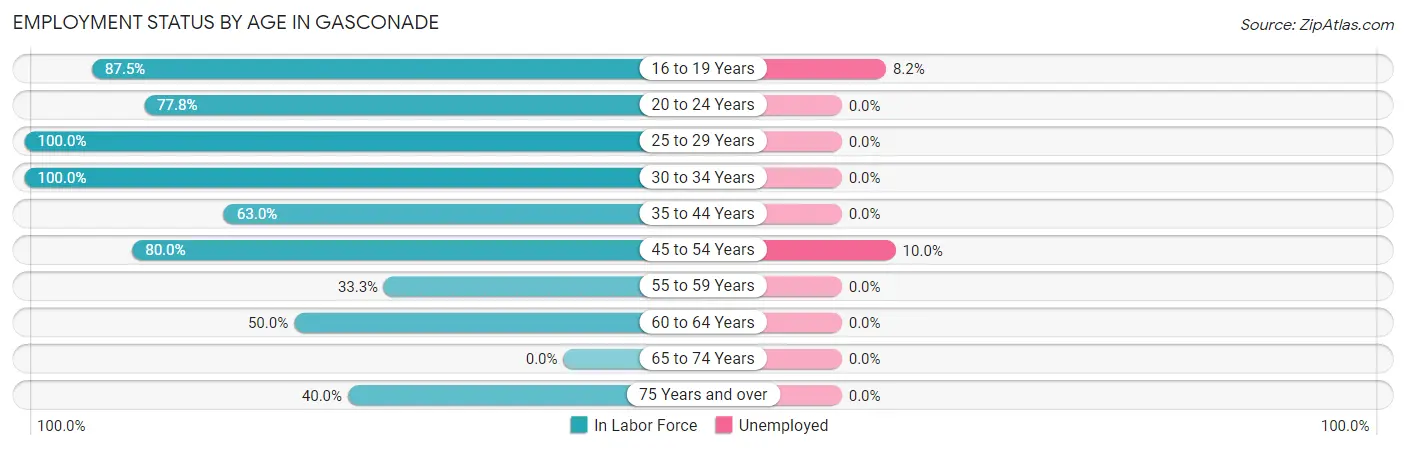
| Age Bracket | In Labor Force | Unemployed |
| 16 to 19 Years | 49 (87.5%) | 4 (8.2%) |
| 20 to 24 Years | 28 (77.8%) | 0 (0.0%) |
| 25 to 29 Years | 14 (100.0%) | 0 (0.0%) |
| 30 to 34 Years | 5 (100.0%) | 0 (0.0%) |
| 35 to 44 Years | 17 (63.0%) | 0 (0.0%) |
| 45 to 54 Years | 40 (80.0%) | 4 (10.0%) |
| 55 to 59 Years | 1 (33.3%) | 0 (0.0%) |
| 60 to 64 Years | 9 (50.0%) | 0 (0.0%) |
| 65 to 74 Years | 0 (0.0%) | 0 (0.0%) |
| 75 Years and over | 2 (40.0%) | 0 (0.0%) |
| Total | 165 (70.2%) | 8 (4.8%) |
Employment Status by Educational Attainment in Gasconade
According to labor force statistics for Gasconade, 73.5% of individuals (86) out of the total population between 25 and 64 years of age (117) are in the labor force, with 4.7% or 4 of them being unemployed. The group with the highest labor force participation rate are those with the educational attainment of high school diploma, with 89.7% or 70 individuals in the labor force. Within the labor force, individuals with less than high school education have the highest percentage of unemployment, with 14.3% or 1 of them being unemployed.
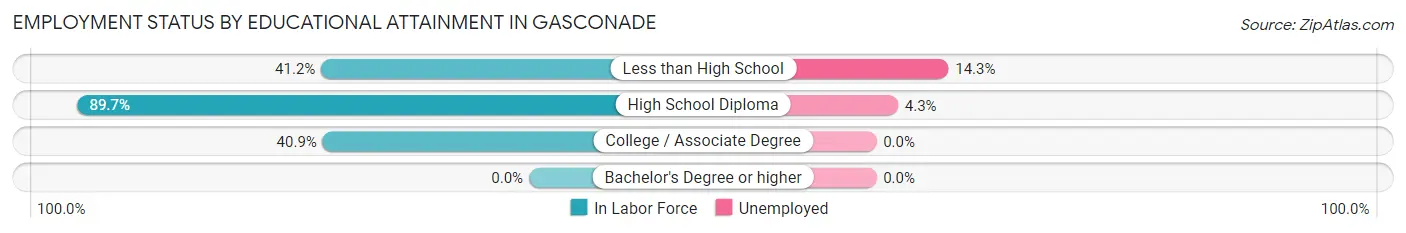
| Educational Attainment | In Labor Force | Unemployed |
| Less than High School | 7 (41.2%) | 2 (14.3%) |
| High School Diploma | 70 (89.7%) | 3 (4.3%) |
| College / Associate Degree | 9 (40.9%) | 0 (0.0%) |
| Bachelor's Degree or higher | 0 (0.0%) | 0 (0.0%) |
| Total | 86 (73.5%) | 5 (4.7%) |
Employment Occupations by Sex in Gasconade
Management, Business, Science and Arts Occupations
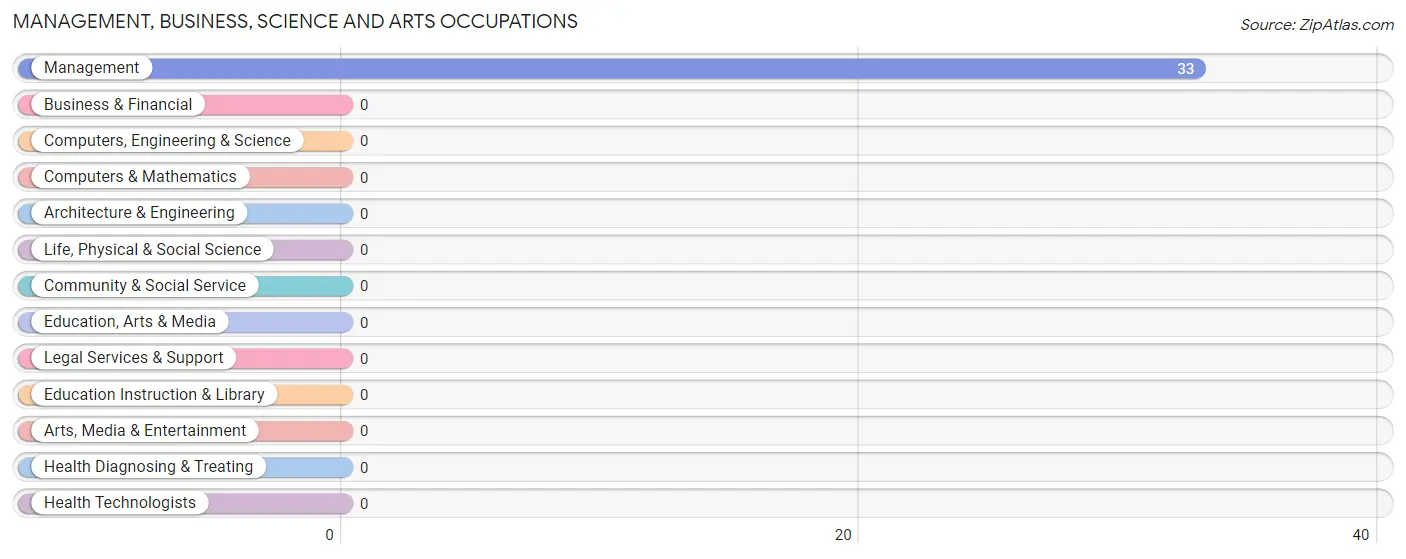
The most common Management, Business, Science and Arts occupations in Gasconade are , and Management (33 | 21.0%).
Management, Business, Science and Arts Occupations by Sex
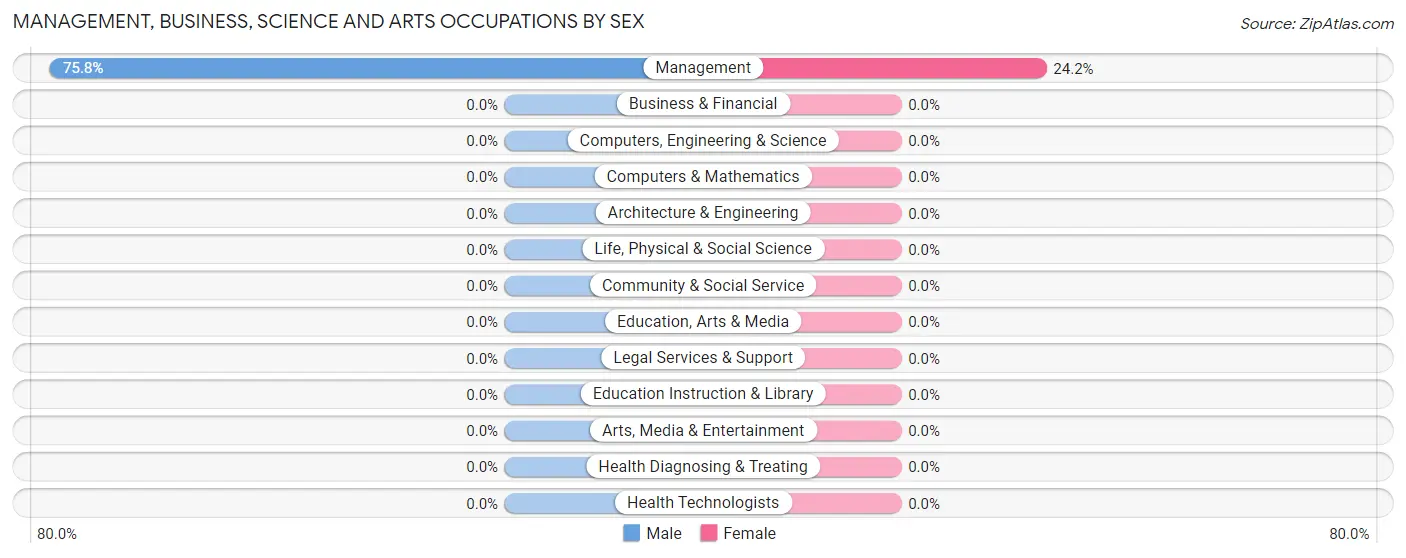
| Occupation | Male | Female |
| Management | 25 (75.8%) | 8 (24.2%) |
| Business & Financial | 0 (0.0%) | 0 (0.0%) |
| Computers, Engineering & Science | 0 (0.0%) | 0 (0.0%) |
| Computers & Mathematics | 0 (0.0%) | 0 (0.0%) |
| Architecture & Engineering | 0 (0.0%) | 0 (0.0%) |
| Life, Physical & Social Science | 0 (0.0%) | 0 (0.0%) |
| Community & Social Service | 0 (0.0%) | 0 (0.0%) |
| Education, Arts & Media | 0 (0.0%) | 0 (0.0%) |
| Legal Services & Support | 0 (0.0%) | 0 (0.0%) |
| Education Instruction & Library | 0 (0.0%) | 0 (0.0%) |
| Arts, Media & Entertainment | 0 (0.0%) | 0 (0.0%) |
| Health Diagnosing & Treating | 0 (0.0%) | 0 (0.0%) |
| Health Technologists | 0 (0.0%) | 0 (0.0%) |
| Total (Category) | 25 (75.8%) | 8 (24.2%) |
| Total (Overall) | 130 (82.8%) | 27 (17.2%) |
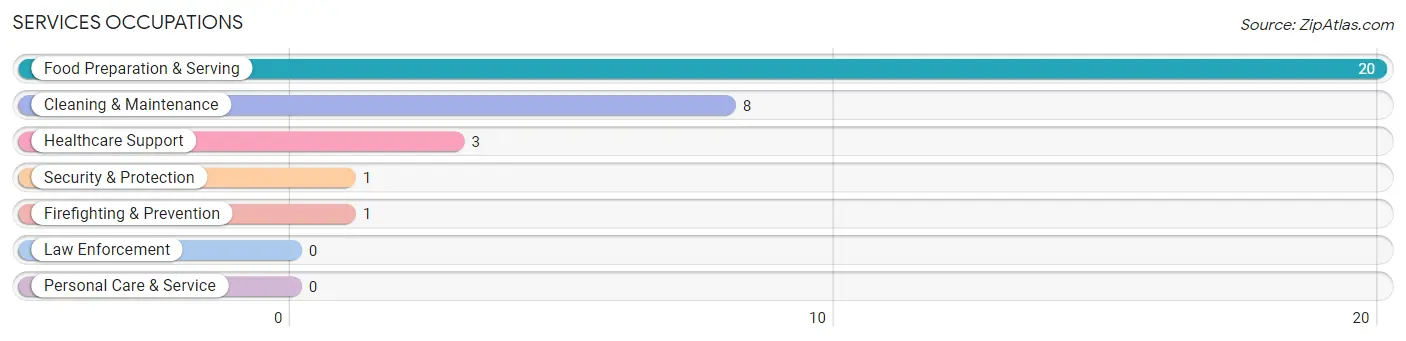
Services Occupations
The most common Services occupations in Gasconade are Food Preparation & Serving (20 | 12.7%), Cleaning & Maintenance (8 | 5.1%), Healthcare Support (3 | 1.9%), Security & Protection (1 | 0.6%), and Firefighting & Prevention (1 | 0.6%).
Services Occupations by Sex
Within the Services occupations in Gasconade, the most male-oriented occupations are Security & Protection (100.0%), Firefighting & Prevention (100.0%), and Food Preparation & Serving (100.0%), while the most female-oriented occupations are Healthcare Support (100.0%), and Cleaning & Maintenance (37.5%).
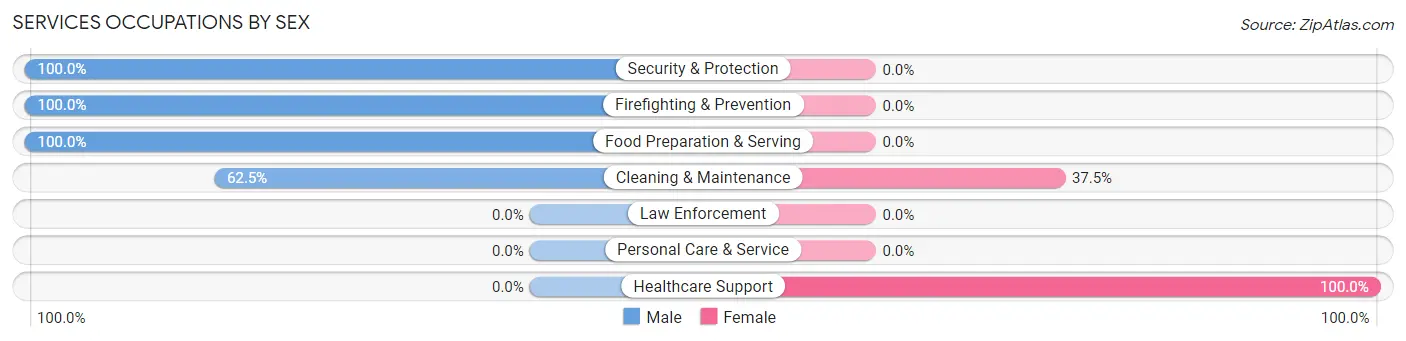
| Occupation | Male | Female |
| Healthcare Support | 0 (0.0%) | 3 (100.0%) |
| Security & Protection | 1 (100.0%) | 0 (0.0%) |
| Firefighting & Prevention | 1 (100.0%) | 0 (0.0%) |
| Law Enforcement | 0 (0.0%) | 0 (0.0%) |
| Food Preparation & Serving | 20 (100.0%) | 0 (0.0%) |
| Cleaning & Maintenance | 5 (62.5%) | 3 (37.5%) |
| Personal Care & Service | 0 (0.0%) | 0 (0.0%) |
| Total (Category) | 26 (81.2%) | 6 (18.8%) |
| Total (Overall) | 130 (82.8%) | 27 (17.2%) |
Sales and Office Occupations
The most common Sales and Office occupations in Gasconade are Sales & Related (30 | 19.1%), and Office & Administration (5 | 3.2%).

Sales and Office Occupations by Sex

| Occupation | Male | Female |
| Sales & Related | 23 (76.7%) | 7 (23.3%) |
| Office & Administration | 4 (80.0%) | 1 (20.0%) |
| Total (Category) | 27 (77.1%) | 8 (22.9%) |
| Total (Overall) | 130 (82.8%) | 27 (17.2%) |
Natural Resources, Construction and Maintenance Occupations
The most common Natural Resources, Construction and Maintenance occupations in Gasconade are , and Construction & Extraction (11 | 7.0%).

Natural Resources, Construction and Maintenance Occupations by Sex

| Occupation | Male | Female |
| Farming, Fishing & Forestry | 0 (0.0%) | 0 (0.0%) |
| Construction & Extraction | 11 (100.0%) | 0 (0.0%) |
| Installation, Maintenance & Repair | 0 (0.0%) | 0 (0.0%) |
| Total (Category) | 11 (100.0%) | 0 (0.0%) |
| Total (Overall) | 130 (82.8%) | 27 (17.2%) |
Production, Transportation and Moving Occupations
The most common Production, Transportation and Moving occupations in Gasconade are Transportation (24 | 15.3%), Production (15 | 9.6%), and Material Moving (7 | 4.5%).
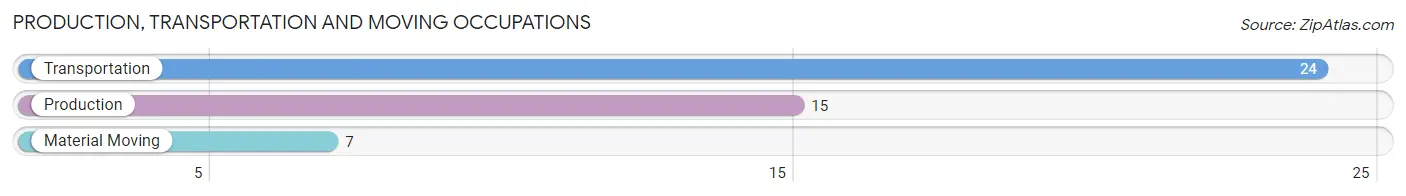
Production, Transportation and Moving Occupations by Sex
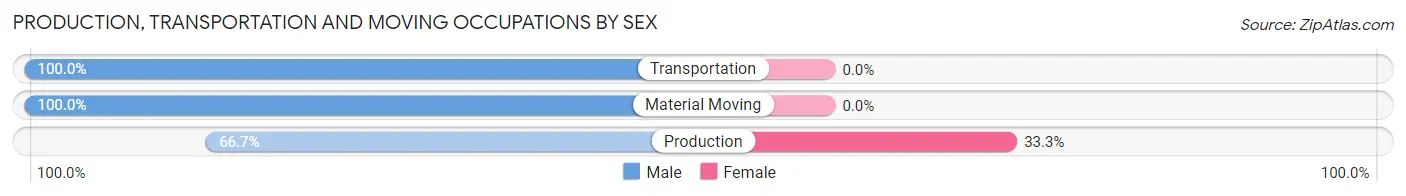
| Occupation | Male | Female |
| Production | 10 (66.7%) | 5 (33.3%) |
| Transportation | 24 (100.0%) | 0 (0.0%) |
| Material Moving | 7 (100.0%) | 0 (0.0%) |
| Total (Category) | 41 (89.1%) | 5 (10.9%) |
| Total (Overall) | 130 (82.8%) | 27 (17.2%) |
Employment Industries by Sex in Gasconade
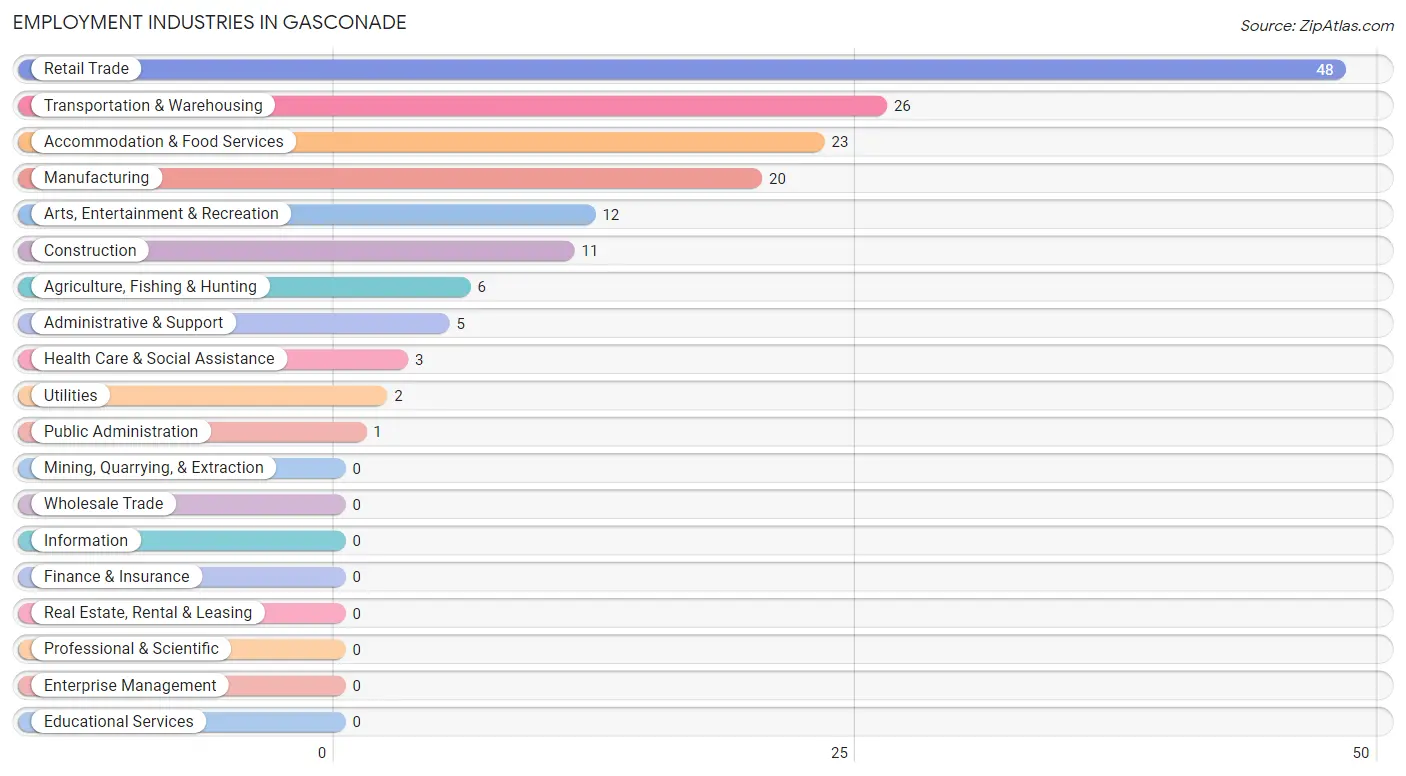
Employment Industries in Gasconade
The major employment industries in Gasconade include Retail Trade (48 | 30.6%), Transportation & Warehousing (26 | 16.6%), Accommodation & Food Services (23 | 14.6%), Manufacturing (20 | 12.7%), and Arts, Entertainment & Recreation (12 | 7.6%).
Employment Industries by Sex in Gasconade
The Gasconade industries that see more men than women are Agriculture, Fishing & Hunting (100.0%), Construction (100.0%), and Transportation & Warehousing (100.0%), whereas the industries that tend to have a higher number of women are Health Care & Social Assistance (100.0%), Arts, Entertainment & Recreation (75.0%), and Administrative & Support (60.0%).
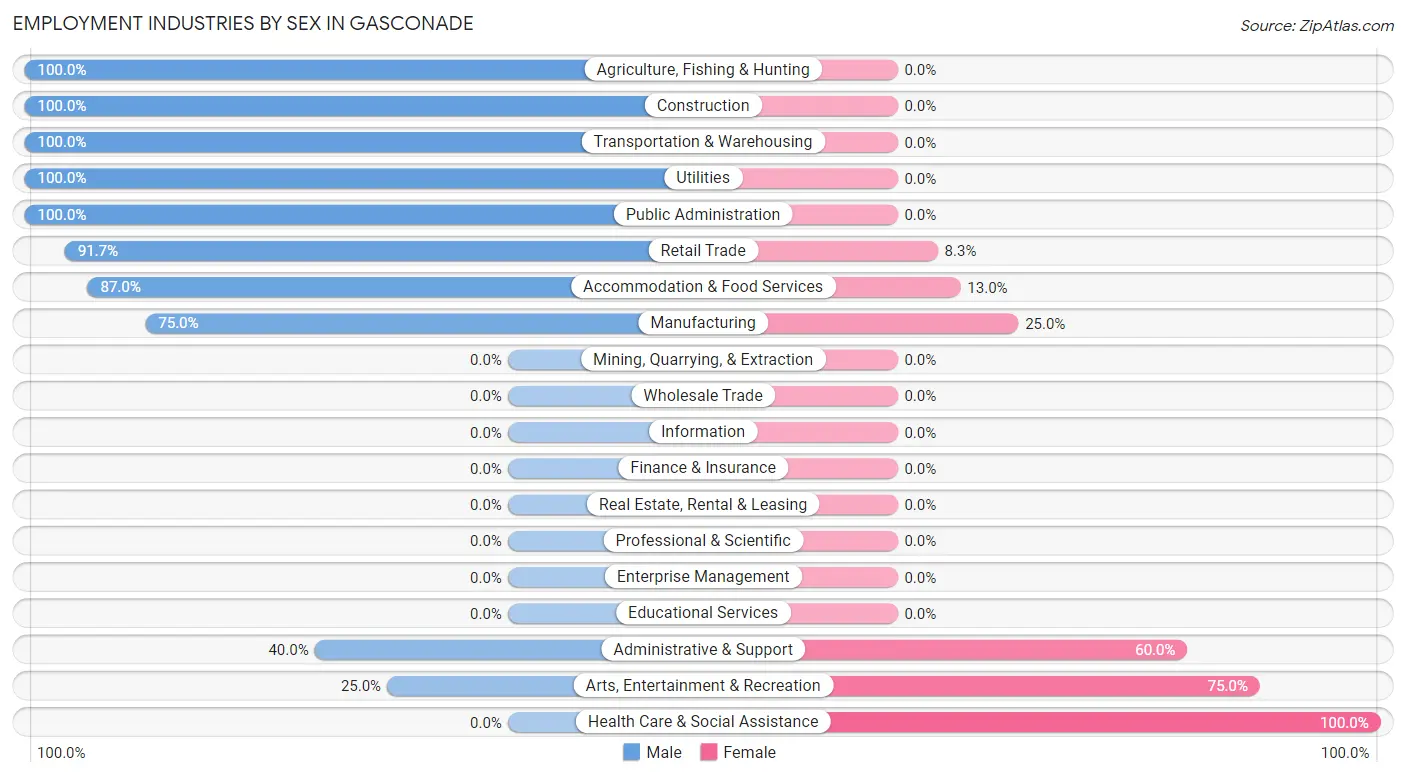
| Industry | Male | Female |
| Agriculture, Fishing & Hunting | 6 (100.0%) | 0 (0.0%) |
| Mining, Quarrying, & Extraction | 0 (0.0%) | 0 (0.0%) |
| Construction | 11 (100.0%) | 0 (0.0%) |
| Manufacturing | 15 (75.0%) | 5 (25.0%) |
| Wholesale Trade | 0 (0.0%) | 0 (0.0%) |
| Retail Trade | 44 (91.7%) | 4 (8.3%) |
| Transportation & Warehousing | 26 (100.0%) | 0 (0.0%) |
| Utilities | 2 (100.0%) | 0 (0.0%) |
| Information | 0 (0.0%) | 0 (0.0%) |
| Finance & Insurance | 0 (0.0%) | 0 (0.0%) |
| Real Estate, Rental & Leasing | 0 (0.0%) | 0 (0.0%) |
| Professional & Scientific | 0 (0.0%) | 0 (0.0%) |
| Enterprise Management | 0 (0.0%) | 0 (0.0%) |
| Administrative & Support | 2 (40.0%) | 3 (60.0%) |
| Educational Services | 0 (0.0%) | 0 (0.0%) |
| Health Care & Social Assistance | 0 (0.0%) | 3 (100.0%) |
| Arts, Entertainment & Recreation | 3 (25.0%) | 9 (75.0%) |
| Accommodation & Food Services | 20 (87.0%) | 3 (13.0%) |
| Public Administration | 1 (100.0%) | 0 (0.0%) |
| Total | 130 (82.8%) | 27 (17.2%) |
Education in Gasconade
School Enrollment in Gasconade
The most common levels of schooling among the 63 students in Gasconade are high school (29 | 46.0%), college / undergraduate (20 | 31.8%), and elementary school (5 | 7.9%).
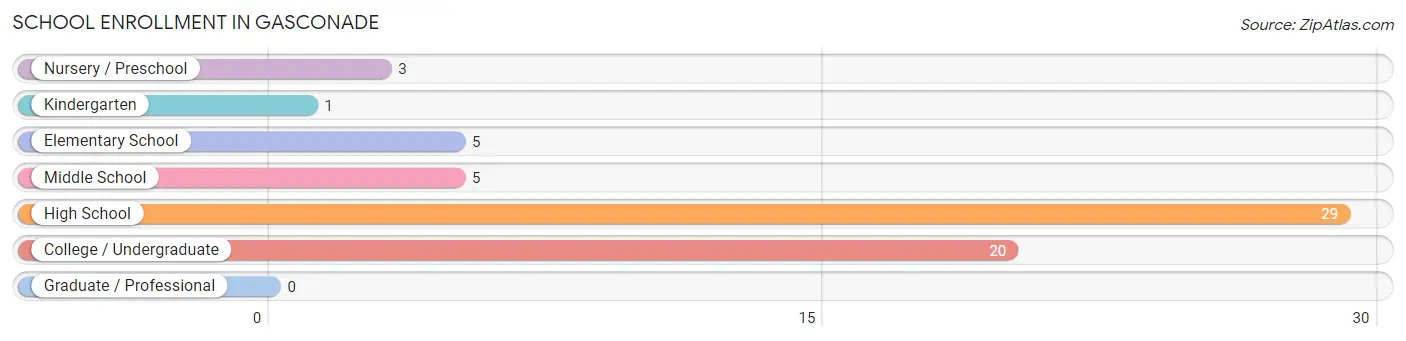
| School Level | # Students | % Students |
| Nursery / Preschool | 3 | 4.8% |
| Kindergarten | 1 | 1.6% |
| Elementary School | 5 | 7.9% |
| Middle School | 5 | 7.9% |
| High School | 29 | 46.0% |
| College / Undergraduate | 20 | 31.8% |
| Graduate / Professional | 0 | 0.0% |
| Total | 63 | 100.0% |
School Enrollment by Age by Funding Source in Gasconade
Out of a total of 63 students who are enrolled in schools in Gasconade, 2 (3.2%) attend a private institution, while the remaining 61 (96.8%) are enrolled in public schools. The age group of 3 to 4 year olds has the highest likelihood of being enrolled in private schools, with 2 (66.7% in the age bracket) enrolled. Conversely, the age group of 5 to 9 year old has the lowest likelihood of being enrolled in a private school, with 6 (100.0% in the age bracket) attending a public institution.
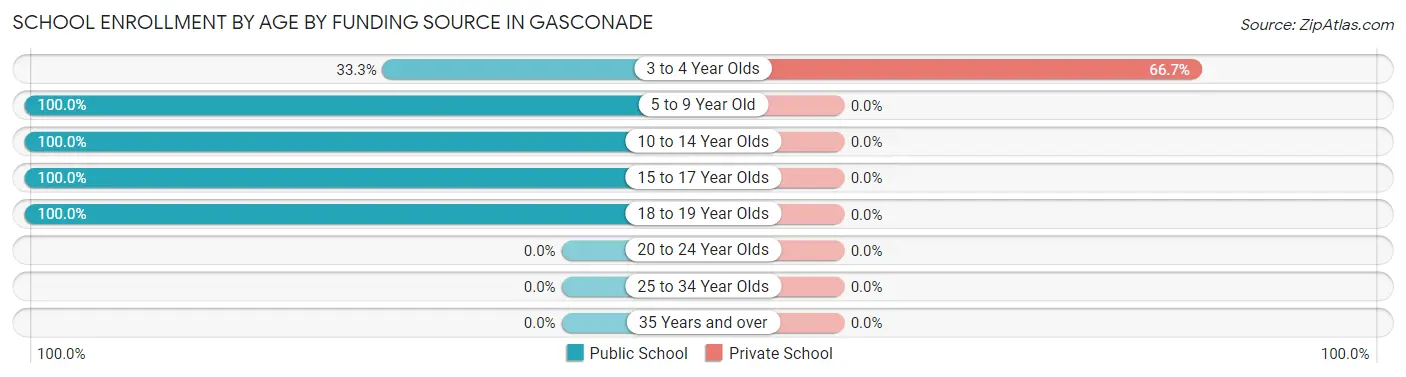
| Age Bracket | Public School | Private School |
| 3 to 4 Year Olds | 1 (33.3%) | 2 (66.7%) |
| 5 to 9 Year Old | 6 (100.0%) | 0 (0.0%) |
| 10 to 14 Year Olds | 5 (100.0%) | 0 (0.0%) |
| 15 to 17 Year Olds | 26 (100.0%) | 0 (0.0%) |
| 18 to 19 Year Olds | 23 (100.0%) | 0 (0.0%) |
| 20 to 24 Year Olds | 0 (0.0%) | 0 (0.0%) |
| 25 to 34 Year Olds | 0 (0.0%) | 0 (0.0%) |
| 35 Years and over | 0 (0.0%) | 0 (0.0%) |
| Total | 61 (96.8%) | 2 (3.2%) |
Educational Attainment by Field of Study in Gasconade
, and liberal arts & history (2 | 100.0%) are the most common fields of study among 2 individuals in Gasconade who have obtained a bachelor's degree or higher.
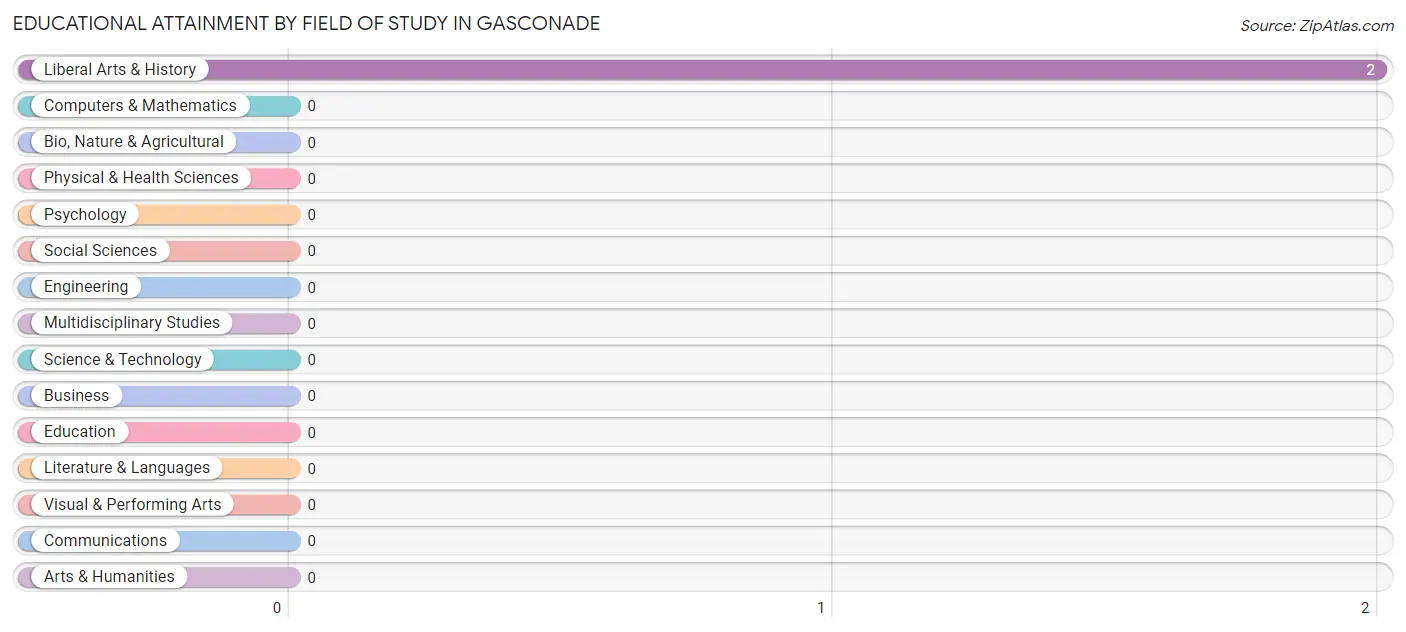
| Field of Study | # Graduates | % Graduates |
| Computers & Mathematics | 0 | 0.0% |
| Bio, Nature & Agricultural | 0 | 0.0% |
| Physical & Health Sciences | 0 | 0.0% |
| Psychology | 0 | 0.0% |
| Social Sciences | 0 | 0.0% |
| Engineering | 0 | 0.0% |
| Multidisciplinary Studies | 0 | 0.0% |
| Science & Technology | 0 | 0.0% |
| Business | 0 | 0.0% |
| Education | 0 | 0.0% |
| Literature & Languages | 0 | 0.0% |
| Liberal Arts & History | 2 | 100.0% |
| Visual & Performing Arts | 0 | 0.0% |
| Communications | 0 | 0.0% |
| Arts & Humanities | 0 | 0.0% |
| Total | 2 | 100.0% |
Transportation & Commute in Gasconade
Vehicle Availability by Sex in Gasconade
The most prevalent vehicle ownership categories in Gasconade are males with 5 or more vehicles (82, accounting for 63.1%) and females with 5 or more vehicles (8, making up 303.7%).
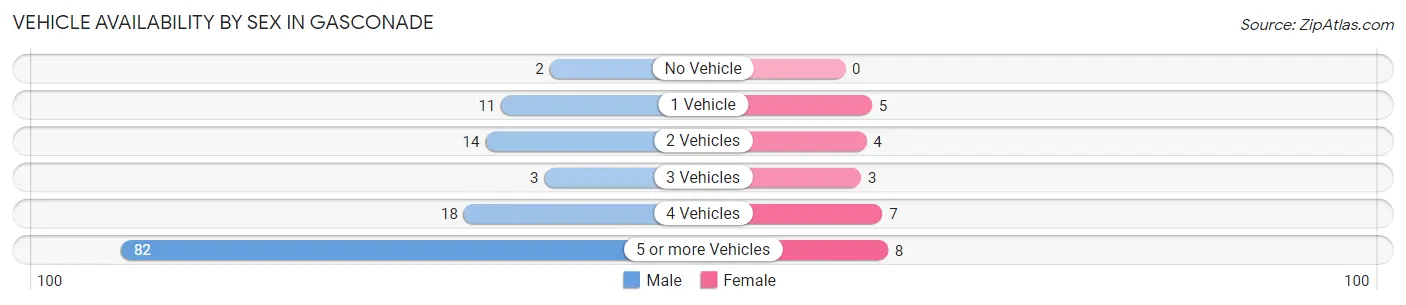
| Vehicles Available | Male | Female |
| No Vehicle | 2 (1.5%) | 0 (0.0%) |
| 1 Vehicle | 11 (8.5%) | 5 (18.5%) |
| 2 Vehicles | 14 (10.8%) | 4 (14.8%) |
| 3 Vehicles | 3 (2.3%) | 3 (11.1%) |
| 4 Vehicles | 18 (13.9%) | 7 (25.9%) |
| 5 or more Vehicles | 82 (63.1%) | 8 (29.6%) |
| Total | 130 (100.0%) | 27 (100.0%) |
Commute Time in Gasconade
The most frequently occuring commute durations in Gasconade are 10 to 14 minutes (50 commuters, 31.9%), 30 to 34 minutes (27 commuters, 17.2%), and 15 to 19 minutes (25 commuters, 15.9%).
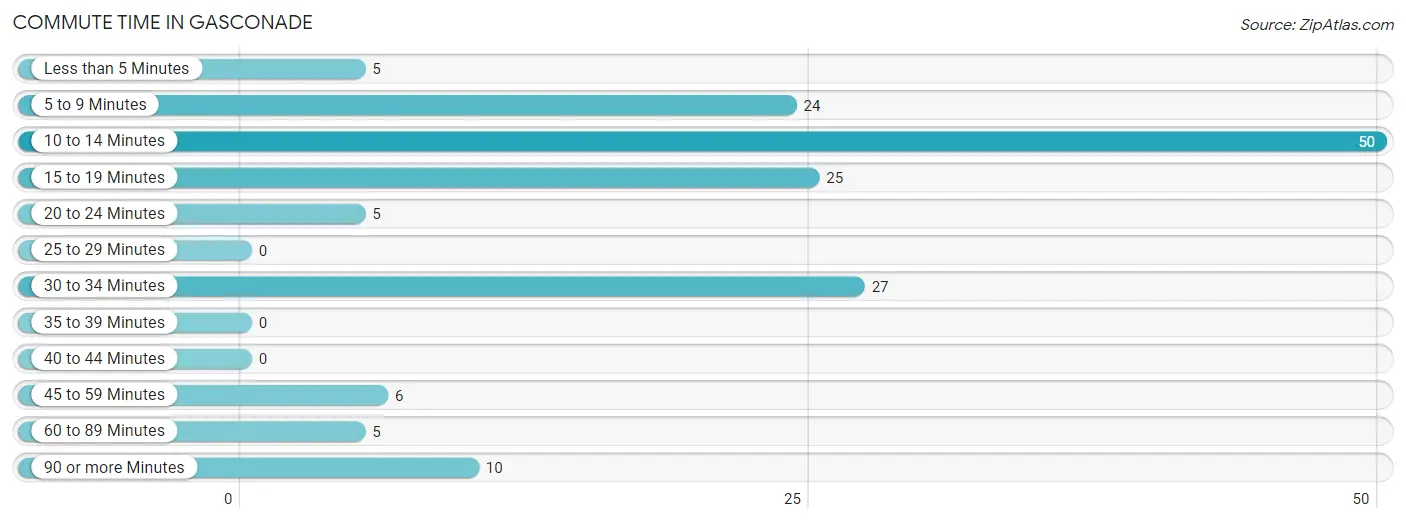
| Commute Time | # Commuters | % Commuters |
| Less than 5 Minutes | 5 | 3.2% |
| 5 to 9 Minutes | 24 | 15.3% |
| 10 to 14 Minutes | 50 | 31.9% |
| 15 to 19 Minutes | 25 | 15.9% |
| 20 to 24 Minutes | 5 | 3.2% |
| 25 to 29 Minutes | 0 | 0.0% |
| 30 to 34 Minutes | 27 | 17.2% |
| 35 to 39 Minutes | 0 | 0.0% |
| 40 to 44 Minutes | 0 | 0.0% |
| 45 to 59 Minutes | 6 | 3.8% |
| 60 to 89 Minutes | 5 | 3.2% |
| 90 or more Minutes | 10 | 6.4% |
Commute Time by Sex in Gasconade
The most common commute times in Gasconade are 10 to 14 minutes (42 commuters, 32.3%) for males and 15 to 19 minutes (14 commuters, 51.8%) for females.
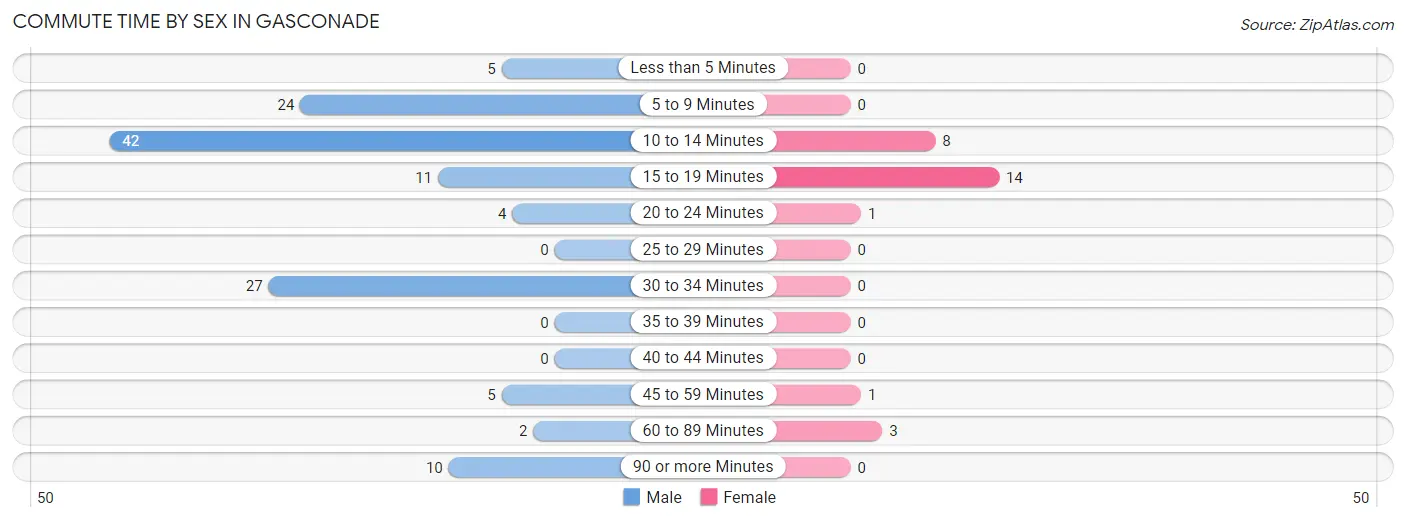
| Commute Time | Male | Female |
| Less than 5 Minutes | 5 (3.8%) | 0 (0.0%) |
| 5 to 9 Minutes | 24 (18.5%) | 0 (0.0%) |
| 10 to 14 Minutes | 42 (32.3%) | 8 (29.6%) |
| 15 to 19 Minutes | 11 (8.5%) | 14 (51.8%) |
| 20 to 24 Minutes | 4 (3.1%) | 1 (3.7%) |
| 25 to 29 Minutes | 0 (0.0%) | 0 (0.0%) |
| 30 to 34 Minutes | 27 (20.8%) | 0 (0.0%) |
| 35 to 39 Minutes | 0 (0.0%) | 0 (0.0%) |
| 40 to 44 Minutes | 0 (0.0%) | 0 (0.0%) |
| 45 to 59 Minutes | 5 (3.8%) | 1 (3.7%) |
| 60 to 89 Minutes | 2 (1.5%) | 3 (11.1%) |
| 90 or more Minutes | 10 (7.7%) | 0 (0.0%) |
Time of Departure to Work by Sex in Gasconade
The most frequent times of departure to work in Gasconade are 5:30 AM to 5:59 AM (45, 34.6%) for males and 5:30 AM to 5:59 AM (8, 29.6%) for females.
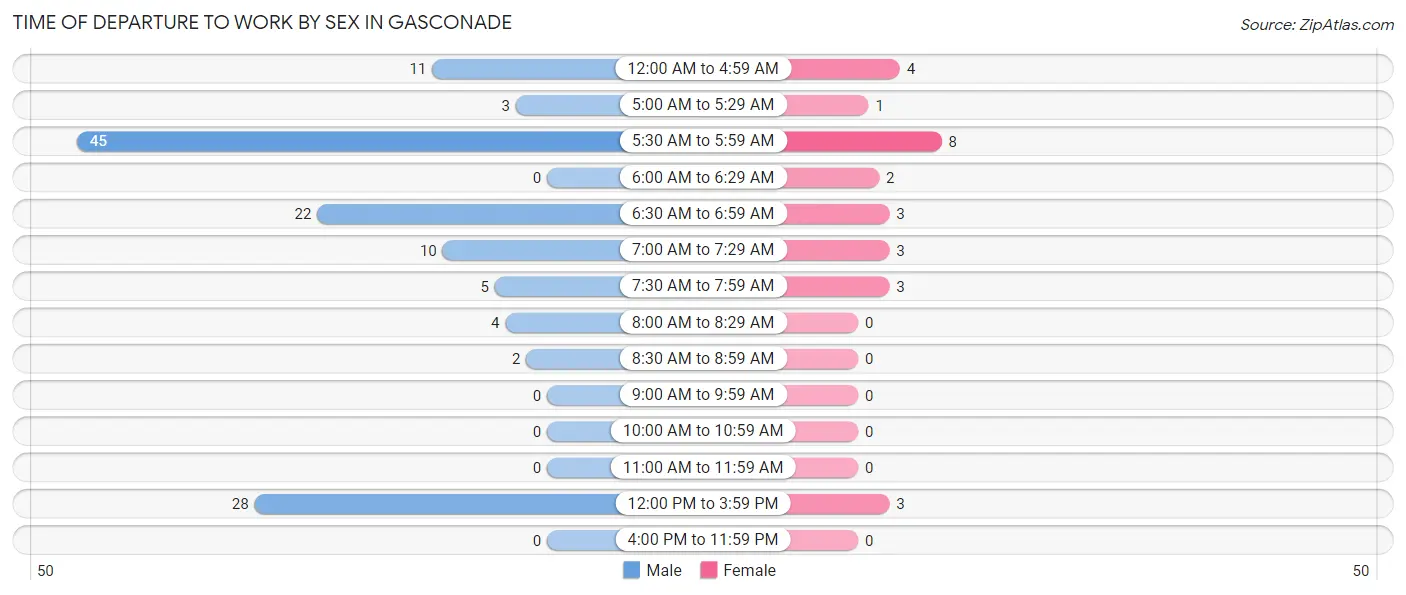
| Time of Departure | Male | Female |
| 12:00 AM to 4:59 AM | 11 (8.5%) | 4 (14.8%) |
| 5:00 AM to 5:29 AM | 3 (2.3%) | 1 (3.7%) |
| 5:30 AM to 5:59 AM | 45 (34.6%) | 8 (29.6%) |
| 6:00 AM to 6:29 AM | 0 (0.0%) | 2 (7.4%) |
| 6:30 AM to 6:59 AM | 22 (16.9%) | 3 (11.1%) |
| 7:00 AM to 7:29 AM | 10 (7.7%) | 3 (11.1%) |
| 7:30 AM to 7:59 AM | 5 (3.8%) | 3 (11.1%) |
| 8:00 AM to 8:29 AM | 4 (3.1%) | 0 (0.0%) |
| 8:30 AM to 8:59 AM | 2 (1.5%) | 0 (0.0%) |
| 9:00 AM to 9:59 AM | 0 (0.0%) | 0 (0.0%) |
| 10:00 AM to 10:59 AM | 0 (0.0%) | 0 (0.0%) |
| 11:00 AM to 11:59 AM | 0 (0.0%) | 0 (0.0%) |
| 12:00 PM to 3:59 PM | 28 (21.5%) | 3 (11.1%) |
| 4:00 PM to 11:59 PM | 0 (0.0%) | 0 (0.0%) |
| Total | 130 (100.0%) | 27 (100.0%) |
Housing Occupancy in Gasconade
Occupancy by Ownership in Gasconade
Of the total 67 dwellings in Gasconade, owner-occupied units account for 65 (97.0%), while renter-occupied units make up 2 (3.0%).
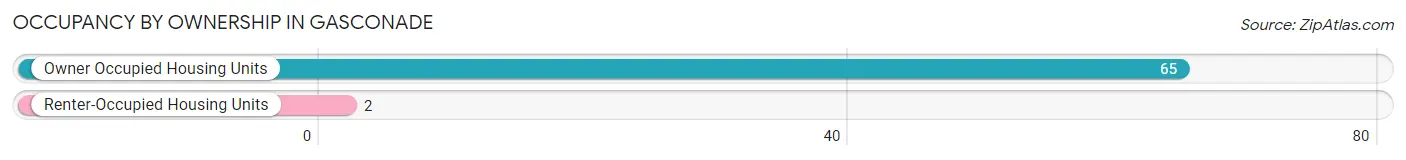
| Occupancy | # Housing Units | % Housing Units |
| Owner Occupied Housing Units | 65 | 97.0% |
| Renter-Occupied Housing Units | 2 | 3.0% |
| Total Occupied Housing Units | 67 | 100.0% |
Occupancy by Household Size in Gasconade
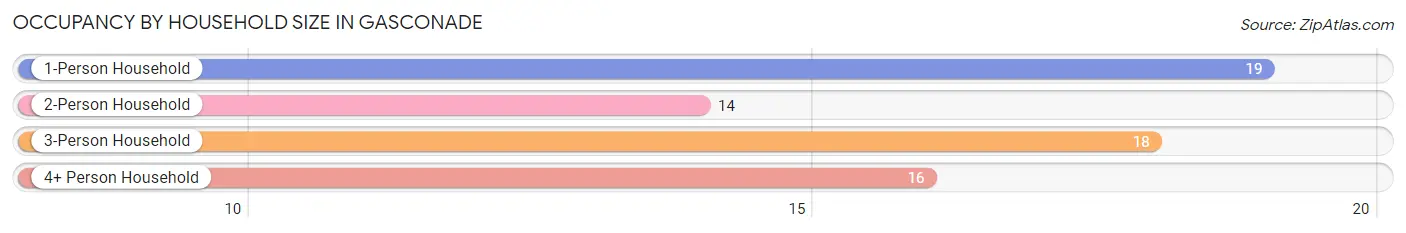
| Household Size | # Housing Units | % Housing Units |
| 1-Person Household | 19 | 28.4% |
| 2-Person Household | 14 | 20.9% |
| 3-Person Household | 18 | 26.9% |
| 4+ Person Household | 16 | 23.9% |
| Total Housing Units | 67 | 100.0% |
Occupancy by Ownership by Household Size in Gasconade
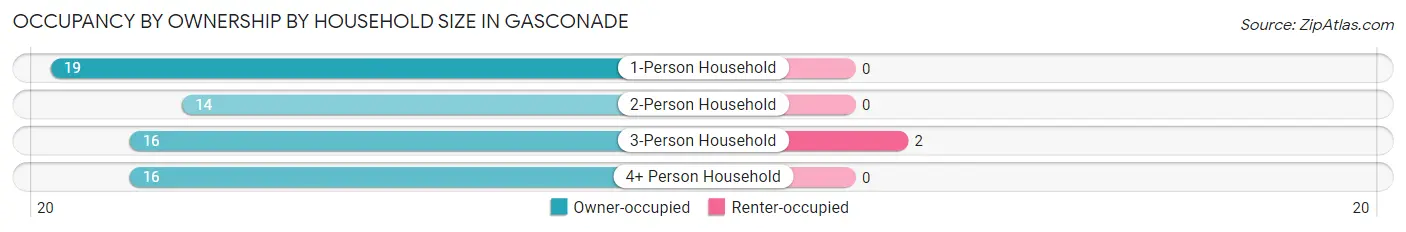
| Household Size | Owner-occupied | Renter-occupied |
| 1-Person Household | 19 (100.0%) | 0 (0.0%) |
| 2-Person Household | 14 (100.0%) | 0 (0.0%) |
| 3-Person Household | 16 (88.9%) | 2 (11.1%) |
| 4+ Person Household | 16 (100.0%) | 0 (0.0%) |
| Total Housing Units | 65 (97.0%) | 2 (3.0%) |
Occupancy by Educational Attainment in Gasconade
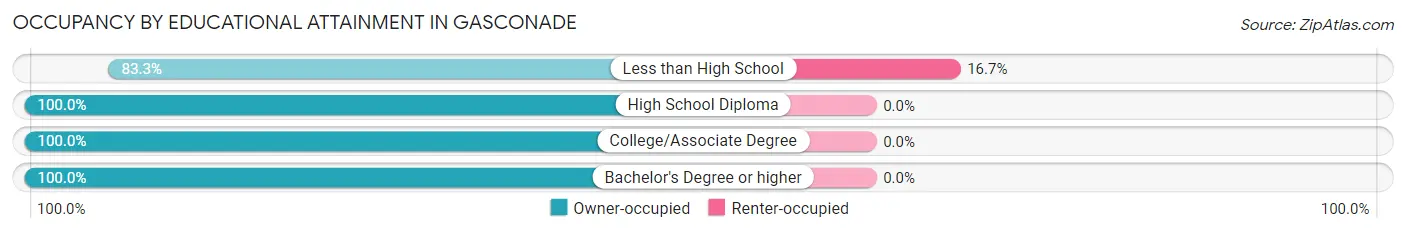
| Household Size | Owner-occupied | Renter-occupied |
| Less than High School | 10 (83.3%) | 2 (16.7%) |
| High School Diploma | 41 (100.0%) | 0 (0.0%) |
| College/Associate Degree | 12 (100.0%) | 0 (0.0%) |
| Bachelor's Degree or higher | 2 (100.0%) | 0 (0.0%) |
Occupancy by Age of Householder in Gasconade

| Age Bracket | # Households | % Households |
| Under 35 Years | 3 | 4.5% |
| 35 to 44 Years | 14 | 20.9% |
| 45 to 54 Years | 21 | 31.3% |
| 55 to 64 Years | 10 | 14.9% |
| 65 to 74 Years | 14 | 20.9% |
| 75 to 84 Years | 5 | 7.5% |
| 85 Years and Over | 0 | 0.0% |
| Total | 67 | 100.0% |
Housing Finances in Gasconade
Median Income by Occupancy in Gasconade
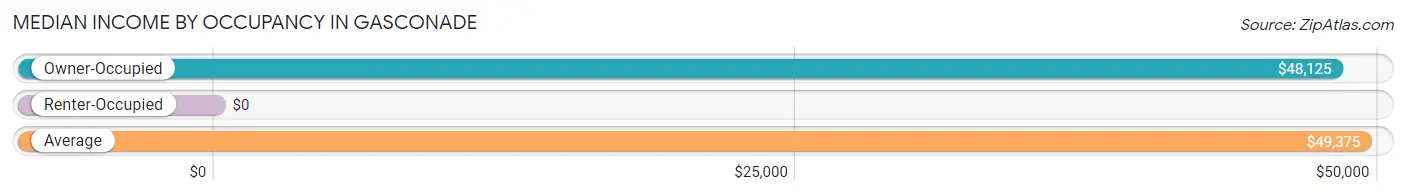
| Occupancy Type | # Households | Median Income |
| Owner-Occupied | 65 (97.0%) | $48,125 |
| Renter-Occupied | 2 (3.0%) | $0 |
| Average | 67 (100.0%) | $49,375 |
Occupancy by Householder Income Bracket in Gasconade
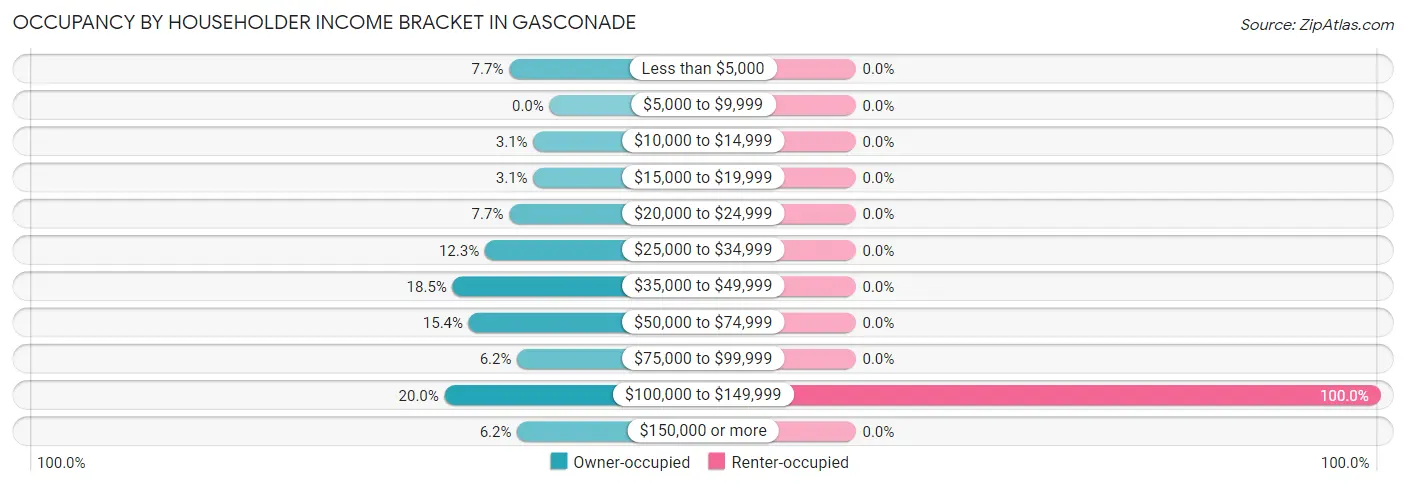
| Income Bracket | Owner-occupied | Renter-occupied |
| Less than $5,000 | 5 (7.7%) | 0 (0.0%) |
| $5,000 to $9,999 | 0 (0.0%) | 0 (0.0%) |
| $10,000 to $14,999 | 2 (3.1%) | 0 (0.0%) |
| $15,000 to $19,999 | 2 (3.1%) | 0 (0.0%) |
| $20,000 to $24,999 | 5 (7.7%) | 0 (0.0%) |
| $25,000 to $34,999 | 8 (12.3%) | 0 (0.0%) |
| $35,000 to $49,999 | 12 (18.5%) | 0 (0.0%) |
| $50,000 to $74,999 | 10 (15.4%) | 0 (0.0%) |
| $75,000 to $99,999 | 4 (6.1%) | 0 (0.0%) |
| $100,000 to $149,999 | 13 (20.0%) | 2 (100.0%) |
| $150,000 or more | 4 (6.1%) | 0 (0.0%) |
| Total | 65 (100.0%) | 2 (100.0%) |
Monthly Housing Cost Tiers in Gasconade
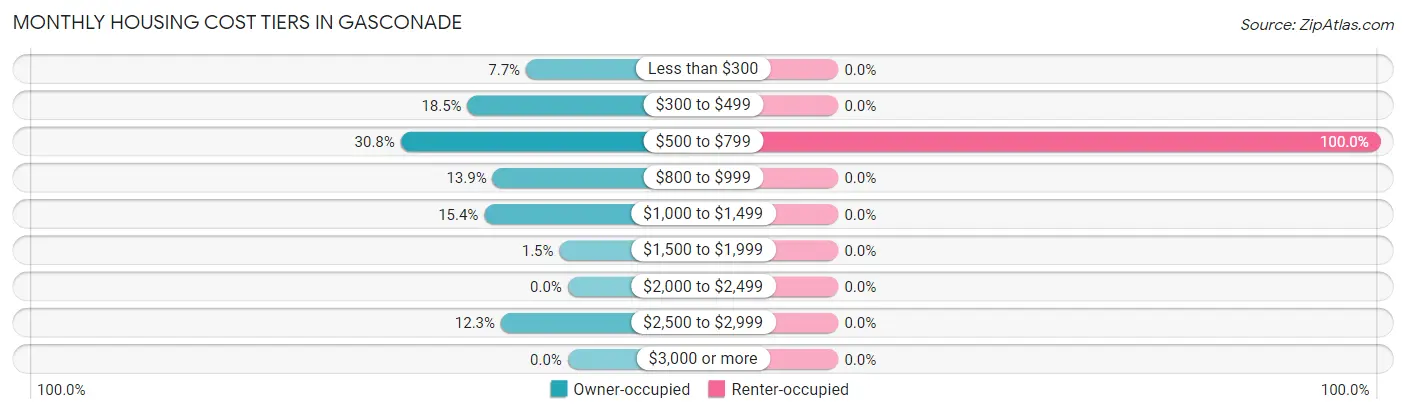
| Monthly Cost | Owner-occupied | Renter-occupied |
| Less than $300 | 5 (7.7%) | 0 (0.0%) |
| $300 to $499 | 12 (18.5%) | 0 (0.0%) |
| $500 to $799 | 20 (30.8%) | 2 (100.0%) |
| $800 to $999 | 9 (13.9%) | 0 (0.0%) |
| $1,000 to $1,499 | 10 (15.4%) | 0 (0.0%) |
| $1,500 to $1,999 | 1 (1.5%) | 0 (0.0%) |
| $2,000 to $2,499 | 0 (0.0%) | 0 (0.0%) |
| $2,500 to $2,999 | 8 (12.3%) | 0 (0.0%) |
| $3,000 or more | 0 (0.0%) | 0 (0.0%) |
| Total | 65 (100.0%) | 2 (100.0%) |
Physical Housing Characteristics in Gasconade
Housing Structures in Gasconade
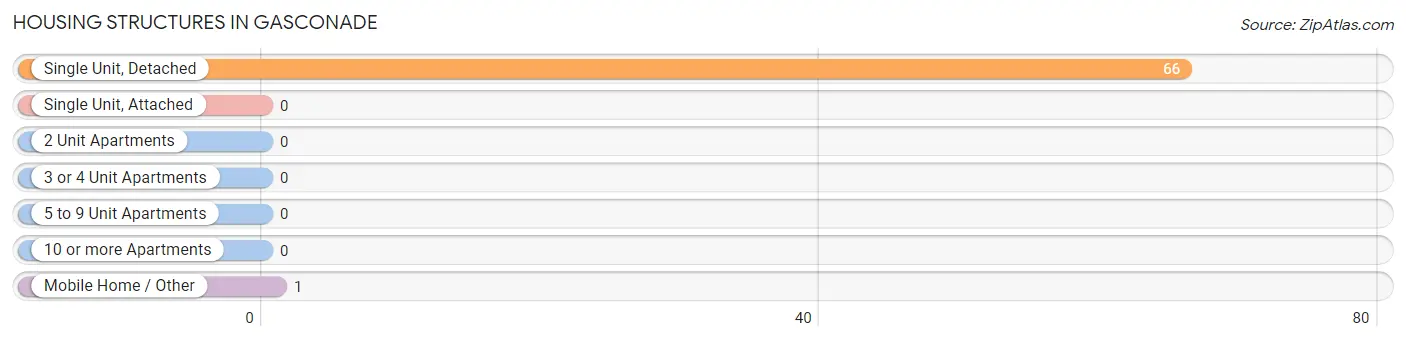
| Structure Type | # Housing Units | % Housing Units |
| Single Unit, Detached | 66 | 98.5% |
| Single Unit, Attached | 0 | 0.0% |
| 2 Unit Apartments | 0 | 0.0% |
| 3 or 4 Unit Apartments | 0 | 0.0% |
| 5 to 9 Unit Apartments | 0 | 0.0% |
| 10 or more Apartments | 0 | 0.0% |
| Mobile Home / Other | 1 | 1.5% |
| Total | 67 | 100.0% |
Housing Structures by Occupancy in Gasconade
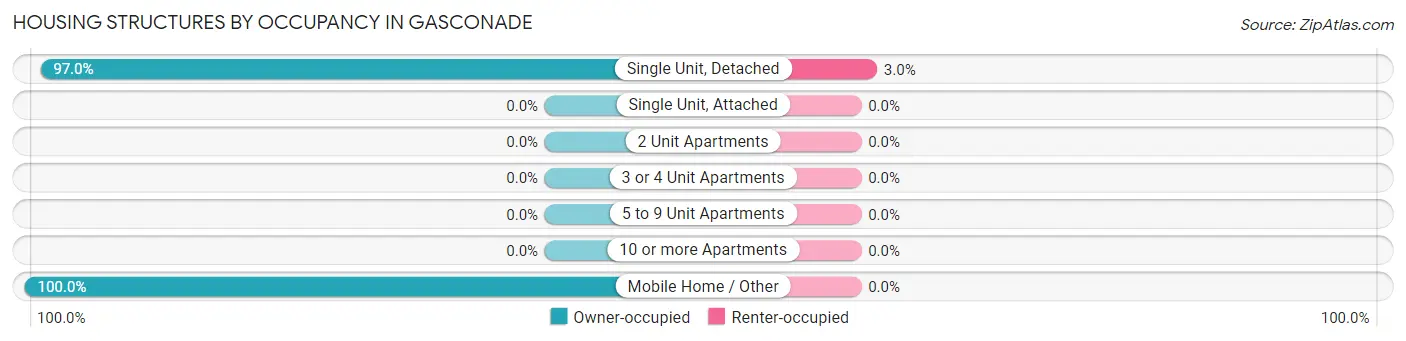
| Structure Type | Owner-occupied | Renter-occupied |
| Single Unit, Detached | 64 (97.0%) | 2 (3.0%) |
| Single Unit, Attached | 0 (0.0%) | 0 (0.0%) |
| 2 Unit Apartments | 0 (0.0%) | 0 (0.0%) |
| 3 or 4 Unit Apartments | 0 (0.0%) | 0 (0.0%) |
| 5 to 9 Unit Apartments | 0 (0.0%) | 0 (0.0%) |
| 10 or more Apartments | 0 (0.0%) | 0 (0.0%) |
| Mobile Home / Other | 1 (100.0%) | 0 (0.0%) |
| Total | 65 (97.0%) | 2 (3.0%) |
Housing Structures by Number of Rooms in Gasconade
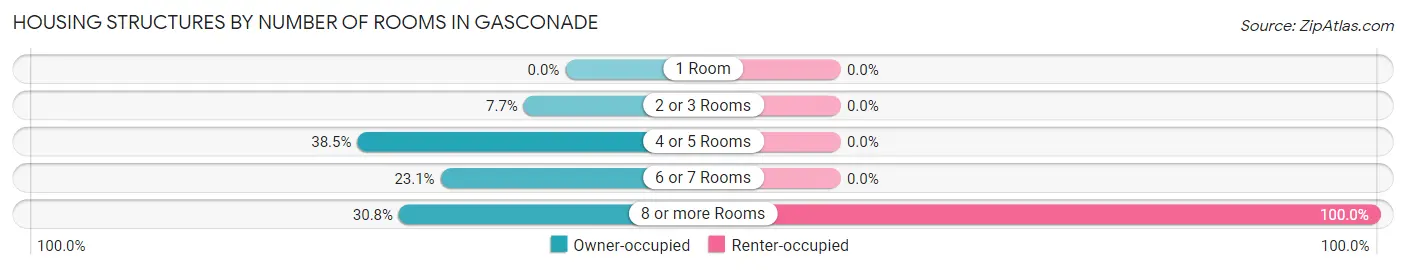
| Number of Rooms | Owner-occupied | Renter-occupied |
| 1 Room | 0 (0.0%) | 0 (0.0%) |
| 2 or 3 Rooms | 5 (7.7%) | 0 (0.0%) |
| 4 or 5 Rooms | 25 (38.5%) | 0 (0.0%) |
| 6 or 7 Rooms | 15 (23.1%) | 0 (0.0%) |
| 8 or more Rooms | 20 (30.8%) | 2 (100.0%) |
| Total | 65 (100.0%) | 2 (100.0%) |
Housing Structure by Heating Type in Gasconade
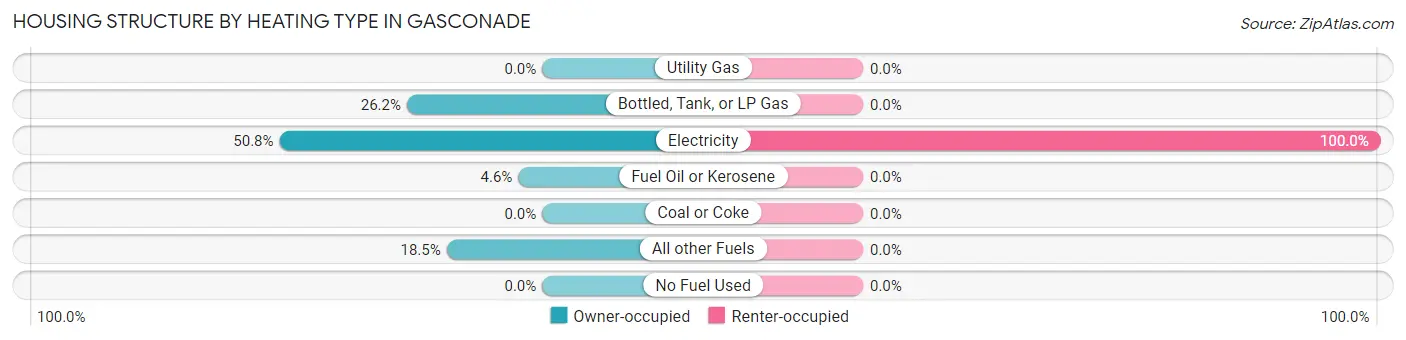
| Heating Type | Owner-occupied | Renter-occupied |
| Utility Gas | 0 (0.0%) | 0 (0.0%) |
| Bottled, Tank, or LP Gas | 17 (26.2%) | 0 (0.0%) |
| Electricity | 33 (50.8%) | 2 (100.0%) |
| Fuel Oil or Kerosene | 3 (4.6%) | 0 (0.0%) |
| Coal or Coke | 0 (0.0%) | 0 (0.0%) |
| All other Fuels | 12 (18.5%) | 0 (0.0%) |
| No Fuel Used | 0 (0.0%) | 0 (0.0%) |
| Total | 65 (100.0%) | 2 (100.0%) |
Household Vehicle Usage in Gasconade
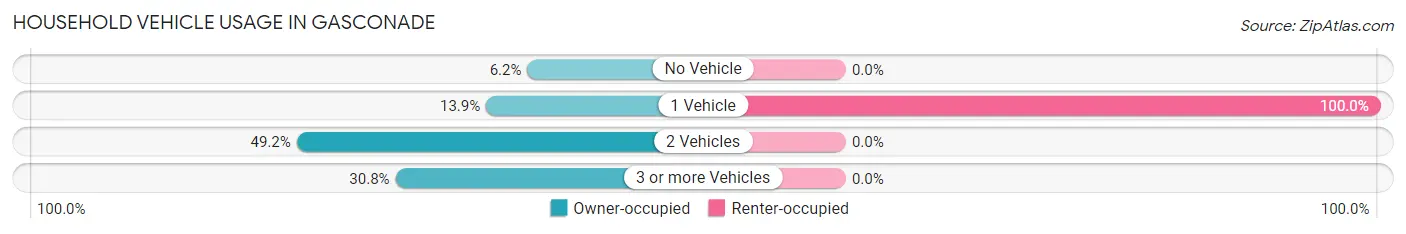
| Vehicles per Household | Owner-occupied | Renter-occupied |
| No Vehicle | 4 (6.1%) | 0 (0.0%) |
| 1 Vehicle | 9 (13.9%) | 2 (100.0%) |
| 2 Vehicles | 32 (49.2%) | 0 (0.0%) |
| 3 or more Vehicles | 20 (30.8%) | 0 (0.0%) |
| Total | 65 (100.0%) | 2 (100.0%) |
Real Estate & Mortgages in Gasconade
Real Estate and Mortgage Overview in Gasconade
| Characteristic | Without Mortgage | With Mortgage |
| Housing Units | 23 | 42 |
| Median Property Value | - | - |
| Median Household Income | $38,750 | $2 |
| Monthly Housing Costs | $439 | $0 |
| Real Estate Taxes | $860 | $0 |
Property Value by Mortgage Status in Gasconade
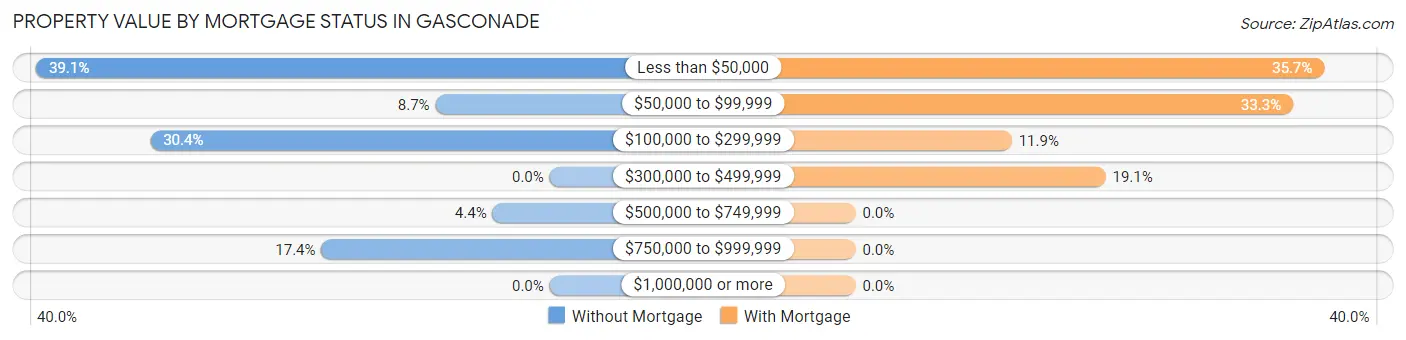
| Property Value | Without Mortgage | With Mortgage |
| Less than $50,000 | 9 (39.1%) | 15 (35.7%) |
| $50,000 to $99,999 | 2 (8.7%) | 14 (33.3%) |
| $100,000 to $299,999 | 7 (30.4%) | 5 (11.9%) |
| $300,000 to $499,999 | 0 (0.0%) | 8 (19.1%) |
| $500,000 to $749,999 | 1 (4.3%) | 0 (0.0%) |
| $750,000 to $999,999 | 4 (17.4%) | 0 (0.0%) |
| $1,000,000 or more | 0 (0.0%) | 0 (0.0%) |
| Total | 23 (100.0%) | 42 (100.0%) |
Household Income by Mortgage Status in Gasconade
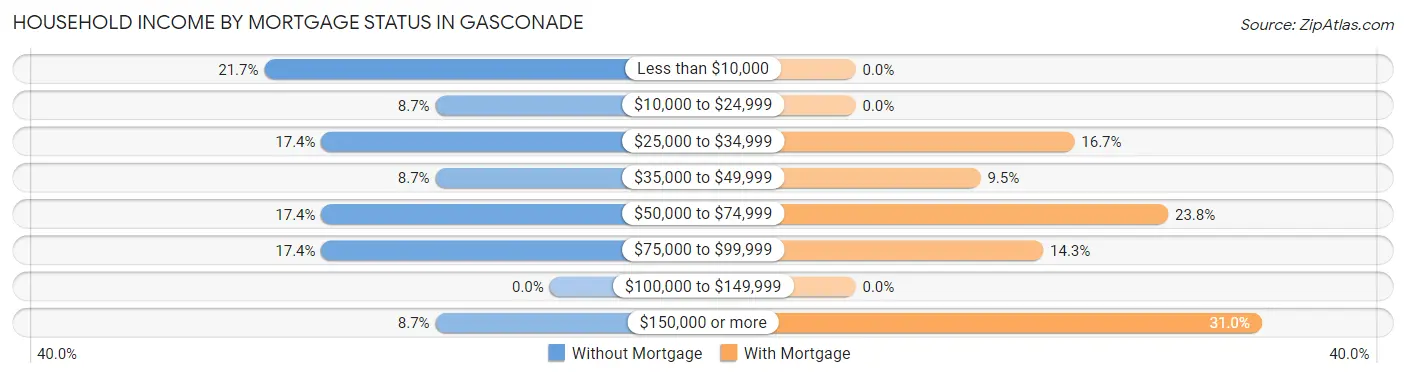
| Household Income | Without Mortgage | With Mortgage |
| Less than $10,000 | 5 (21.7%) | 0 (0.0%) |
| $10,000 to $24,999 | 2 (8.7%) | 0 (0.0%) |
| $25,000 to $34,999 | 4 (17.4%) | 7 (16.7%) |
| $35,000 to $49,999 | 2 (8.7%) | 4 (9.5%) |
| $50,000 to $74,999 | 4 (17.4%) | 10 (23.8%) |
| $75,000 to $99,999 | 4 (17.4%) | 6 (14.3%) |
| $100,000 to $149,999 | 0 (0.0%) | 0 (0.0%) |
| $150,000 or more | 2 (8.7%) | 13 (30.9%) |
| Total | 23 (100.0%) | 42 (100.0%) |
Property Value to Household Income Ratio in Gasconade
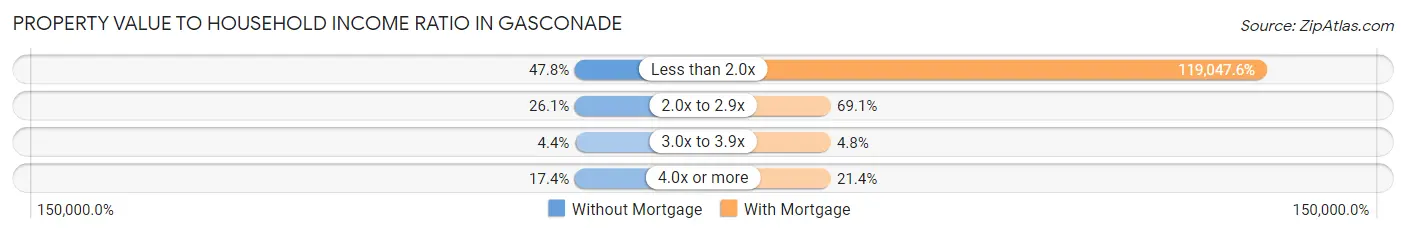
| Value-to-Income Ratio | Without Mortgage | With Mortgage |
| Less than 2.0x | 11 (47.8%) | 50,000 (119,047.6%) |
| 2.0x to 2.9x | 6 (26.1%) | 29 (69.1%) |
| 3.0x to 3.9x | 1 (4.3%) | 2 (4.8%) |
| 4.0x or more | 4 (17.4%) | 9 (21.4%) |
| Total | 23 (100.0%) | 42 (100.0%) |
Real Estate Taxes by Mortgage Status in Gasconade
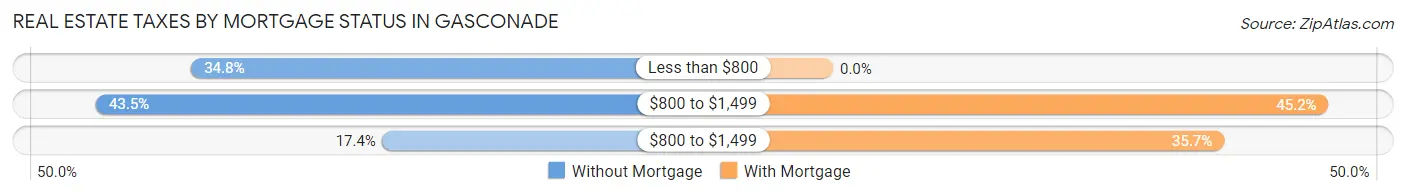
| Property Taxes | Without Mortgage | With Mortgage |
| Less than $800 | 8 (34.8%) | 0 (0.0%) |
| $800 to $1,499 | 10 (43.5%) | 19 (45.2%) |
| $800 to $1,499 | 4 (17.4%) | 15 (35.7%) |
| Total | 23 (100.0%) | 42 (100.0%) |
Health & Disability in Gasconade
Health Insurance Coverage by Age in Gasconade
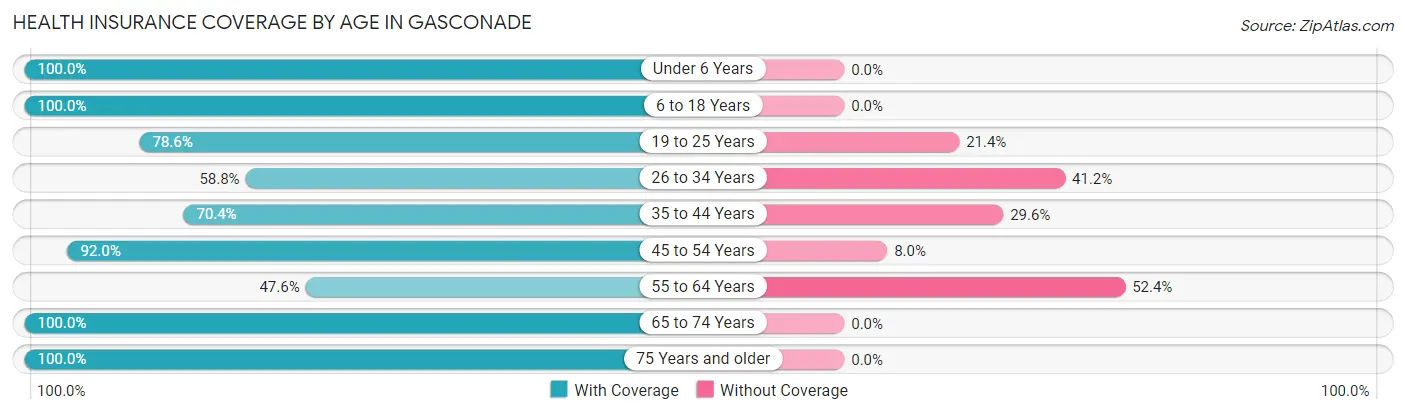
| Age Bracket | With Coverage | Without Coverage |
| Under 6 Years | 9 (100.0%) | 0 (0.0%) |
| 6 to 18 Years | 62 (100.0%) | 0 (0.0%) |
| 19 to 25 Years | 33 (78.6%) | 9 (21.4%) |
| 26 to 34 Years | 10 (58.8%) | 7 (41.2%) |
| 35 to 44 Years | 19 (70.4%) | 8 (29.6%) |
| 45 to 54 Years | 46 (92.0%) | 4 (8.0%) |
| 55 to 64 Years | 10 (47.6%) | 11 (52.4%) |
| 65 to 74 Years | 21 (100.0%) | 0 (0.0%) |
| 75 Years and older | 5 (100.0%) | 0 (0.0%) |
| Total | 215 (84.7%) | 39 (15.3%) |
Health Insurance Coverage by Citizenship Status in Gasconade

| Citizenship Status | With Coverage | Without Coverage |
| Native Born | 9 (100.0%) | 0 (0.0%) |
| Foreign Born, Citizen | 62 (100.0%) | 0 (0.0%) |
| Foreign Born, not a Citizen | 33 (78.6%) | 9 (21.4%) |
Health Insurance Coverage by Household Income in Gasconade
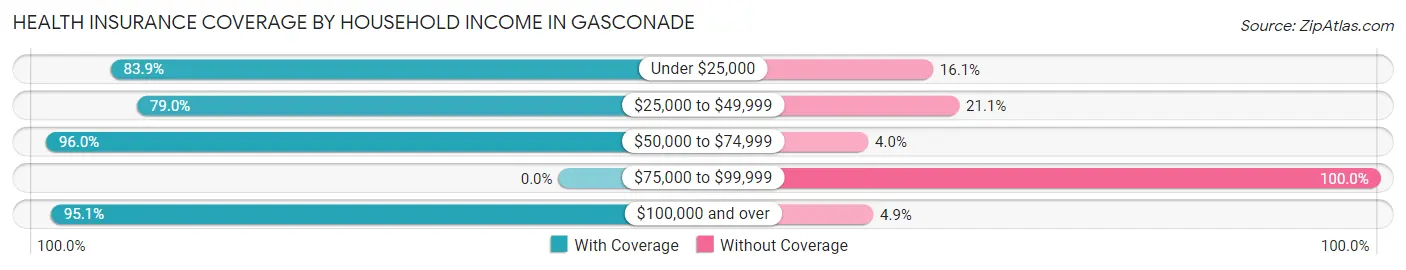
| Household Income | With Coverage | Without Coverage |
| Under $25,000 | 26 (83.9%) | 5 (16.1%) |
| $25,000 to $49,999 | 30 (78.9%) | 8 (21.0%) |
| $50,000 to $74,999 | 24 (96.0%) | 1 (4.0%) |
| $75,000 to $99,999 | 0 (0.0%) | 18 (100.0%) |
| $100,000 and over | 135 (95.1%) | 7 (4.9%) |
Public vs Private Health Insurance Coverage by Age in Gasconade
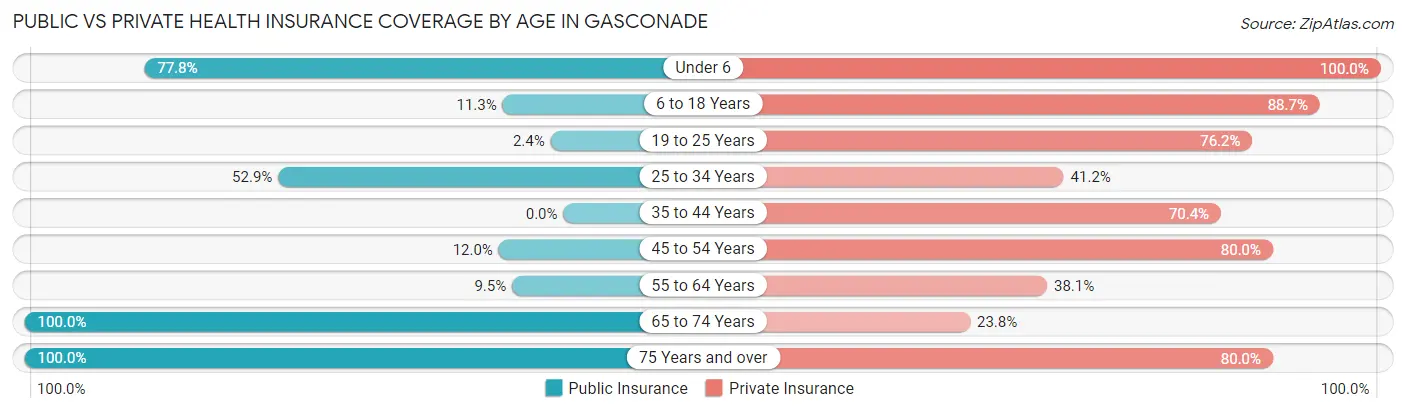
| Age Bracket | Public Insurance | Private Insurance |
| Under 6 | 7 (77.8%) | 9 (100.0%) |
| 6 to 18 Years | 7 (11.3%) | 55 (88.7%) |
| 19 to 25 Years | 1 (2.4%) | 32 (76.2%) |
| 25 to 34 Years | 9 (52.9%) | 7 (41.2%) |
| 35 to 44 Years | 0 (0.0%) | 19 (70.4%) |
| 45 to 54 Years | 6 (12.0%) | 40 (80.0%) |
| 55 to 64 Years | 2 (9.5%) | 8 (38.1%) |
| 65 to 74 Years | 21 (100.0%) | 5 (23.8%) |
| 75 Years and over | 5 (100.0%) | 4 (80.0%) |
| Total | 58 (22.8%) | 179 (70.5%) |
Disability Status by Sex by Age in Gasconade
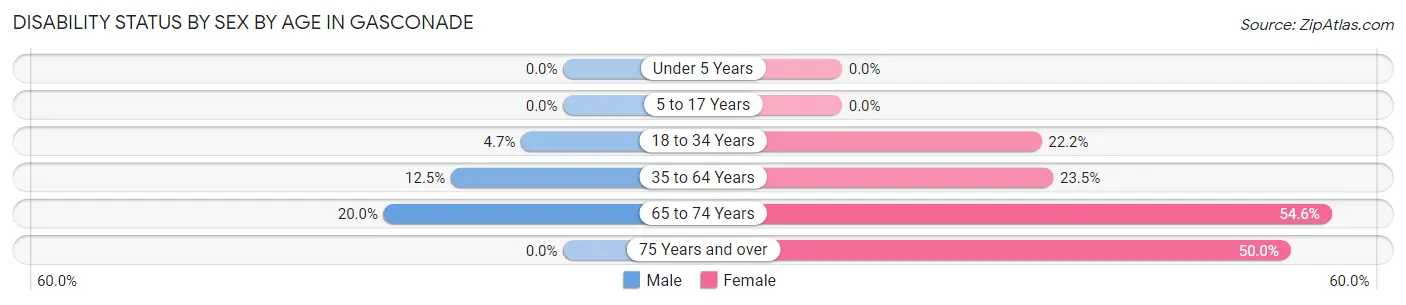
| Age Bracket | Male | Female |
| Under 5 Years | 0 (0.0%) | 0 (0.0%) |
| 5 to 17 Years | 0 (0.0%) | 0 (0.0%) |
| 18 to 34 Years | 3 (4.7%) | 4 (22.2%) |
| 35 to 64 Years | 8 (12.5%) | 8 (23.5%) |
| 65 to 74 Years | 2 (20.0%) | 6 (54.5%) |
| 75 Years and over | 0 (0.0%) | 1 (50.0%) |
Disability Class by Sex by Age in Gasconade
Disability Class: Hearing Difficulty
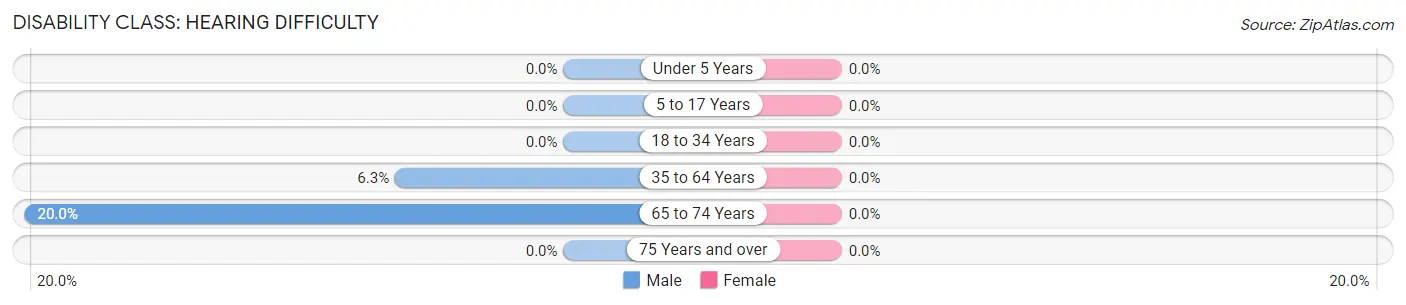
| Age Bracket | Male | Female |
| Under 5 Years | 0 (0.0%) | 0 (0.0%) |
| 5 to 17 Years | 0 (0.0%) | 0 (0.0%) |
| 18 to 34 Years | 0 (0.0%) | 0 (0.0%) |
| 35 to 64 Years | 4 (6.2%) | 0 (0.0%) |
| 65 to 74 Years | 2 (20.0%) | 0 (0.0%) |
| 75 Years and over | 0 (0.0%) | 0 (0.0%) |
Disability Class: Vision Difficulty
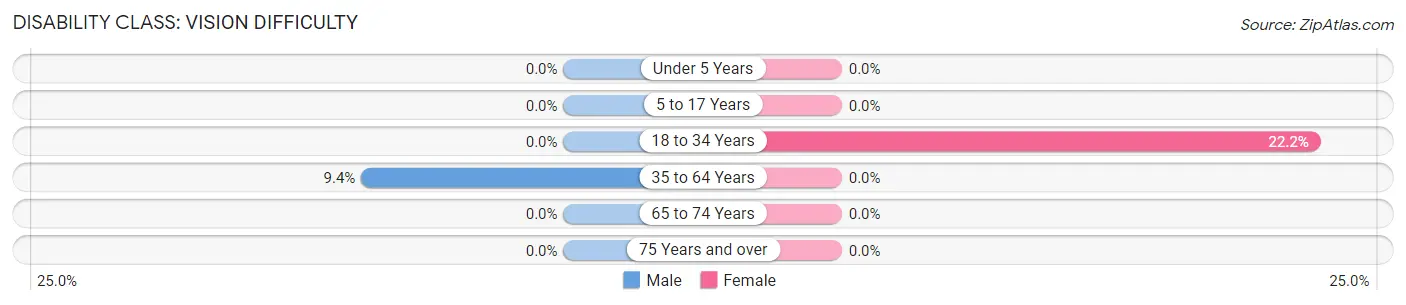
| Age Bracket | Male | Female |
| Under 5 Years | 0 (0.0%) | 0 (0.0%) |
| 5 to 17 Years | 0 (0.0%) | 0 (0.0%) |
| 18 to 34 Years | 0 (0.0%) | 4 (22.2%) |
| 35 to 64 Years | 6 (9.4%) | 0 (0.0%) |
| 65 to 74 Years | 0 (0.0%) | 0 (0.0%) |
| 75 Years and over | 0 (0.0%) | 0 (0.0%) |
Disability Class: Cognitive Difficulty
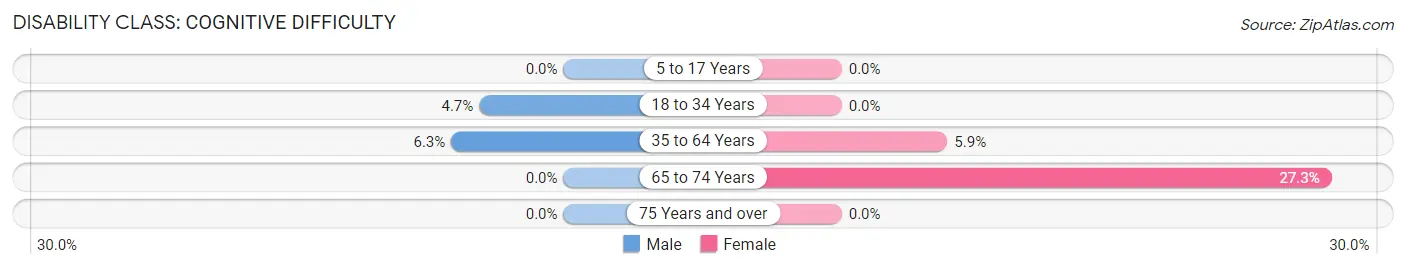
| Age Bracket | Male | Female |
| 5 to 17 Years | 0 (0.0%) | 0 (0.0%) |
| 18 to 34 Years | 3 (4.7%) | 0 (0.0%) |
| 35 to 64 Years | 4 (6.2%) | 2 (5.9%) |
| 65 to 74 Years | 0 (0.0%) | 3 (27.3%) |
| 75 Years and over | 0 (0.0%) | 0 (0.0%) |
Disability Class: Ambulatory Difficulty
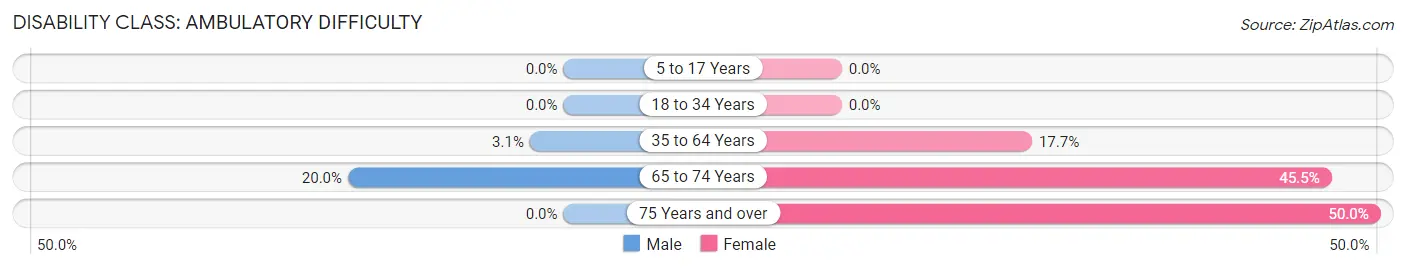
| Age Bracket | Male | Female |
| 5 to 17 Years | 0 (0.0%) | 0 (0.0%) |
| 18 to 34 Years | 0 (0.0%) | 0 (0.0%) |
| 35 to 64 Years | 2 (3.1%) | 6 (17.6%) |
| 65 to 74 Years | 2 (20.0%) | 5 (45.5%) |
| 75 Years and over | 0 (0.0%) | 1 (50.0%) |
Disability Class: Self-Care Difficulty
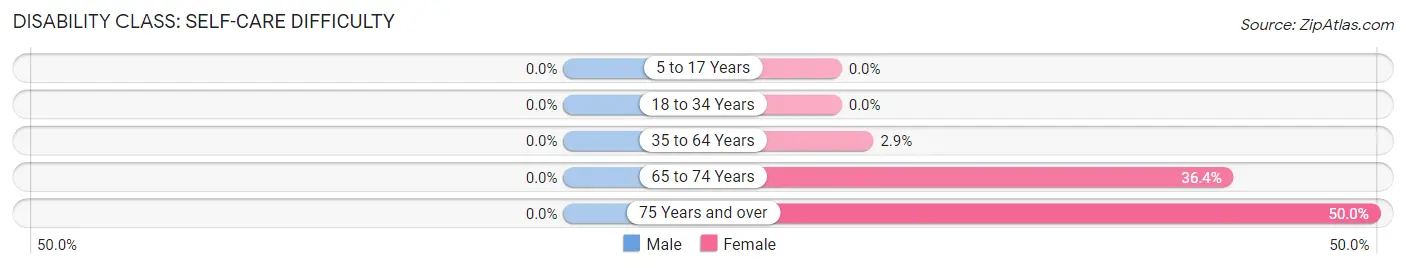
| Age Bracket | Male | Female |
| 5 to 17 Years | 0 (0.0%) | 0 (0.0%) |
| 18 to 34 Years | 0 (0.0%) | 0 (0.0%) |
| 35 to 64 Years | 0 (0.0%) | 1 (2.9%) |
| 65 to 74 Years | 0 (0.0%) | 4 (36.4%) |
| 75 Years and over | 0 (0.0%) | 1 (50.0%) |
Technology Access in Gasconade
Computing Device Access in Gasconade
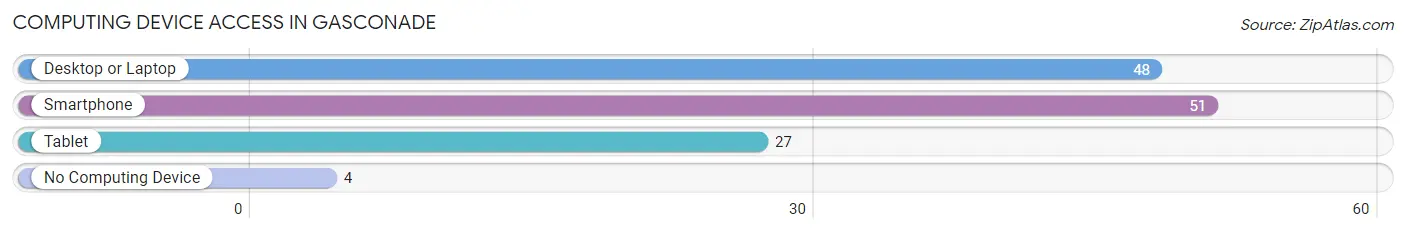
| Device Type | # Households | % Households |
| Desktop or Laptop | 48 | 71.6% |
| Smartphone | 51 | 76.1% |
| Tablet | 27 | 40.3% |
| No Computing Device | 4 | 6.0% |
| Total | 67 | 100.0% |
Internet Access in Gasconade
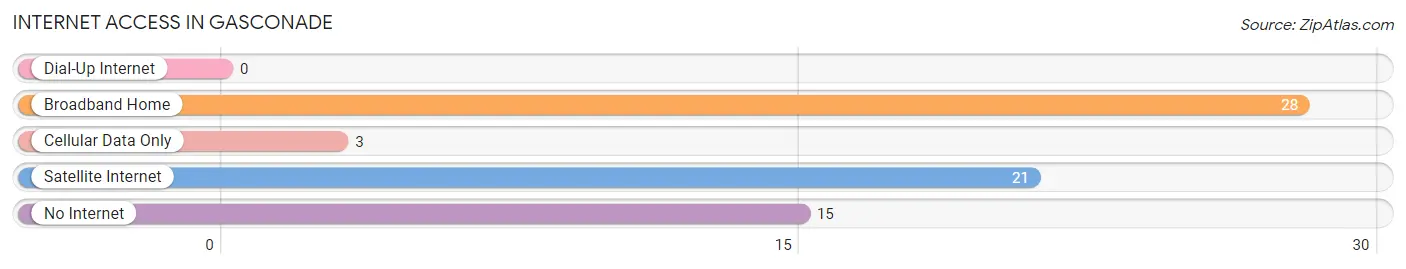
| Internet Type | # Households | % Households |
| Dial-Up Internet | 0 | 0.0% |
| Broadband Home | 28 | 41.8% |
| Cellular Data Only | 3 | 4.5% |
| Satellite Internet | 21 | 31.3% |
| No Internet | 15 | 22.4% |
| Total | 67 | 100.0% |
Gasconade Summary
History
Gasconade, Missouri is a small town located in the heart of the Ozarks. It was founded in 1845 by a group of settlers from Gascony, France, who were looking for a new home in the United States. The town was named after the Gascony region of France, and the settlers brought with them their French culture and language.
The town was originally a farming community, and the settlers grew corn, wheat, and other crops. The town also had a small sawmill and a gristmill. In the late 1800s, the town began to grow and prosper as a trading center for the surrounding area. The town was also home to a number of businesses, including a hotel, a general store, a blacksmith shop, and a post office.
In the early 1900s, the town began to experience a period of growth and development. The railroad arrived in the town in 1906, and this allowed for the transportation of goods and people to and from the town. This also allowed for the growth of the town’s economy, as it became a hub for the surrounding area.
The town continued to grow and prosper throughout the 20th century. In the 1950s, the town was home to a number of businesses, including a bank, a grocery store, a hardware store, and a movie theater. The town also had a number of churches, including the First Baptist Church, the First Methodist Church, and the First Presbyterian Church.
In the late 20th century, the town began to experience a period of decline. The railroad stopped running in the town in the 1970s, and this caused the town’s economy to suffer. The town also experienced a decrease in population, as many of the town’s residents moved away in search of better opportunities.
Today, Gasconade is a small town with a population of just over 500 people. The town is still home to a number of businesses, including a bank, a grocery store, a hardware store, and a movie theater. The town also has a number of churches, including the First Baptist Church, the First Methodist Church, and the First Presbyterian Church.
Geography
Gasconade is located in the Ozarks region of Missouri. The town is situated in the Gasconade River Valley, which is surrounded by rolling hills and forests. The town is located about 40 miles south of St. Louis and about 30 miles north of Springfield.
The town is located at an elevation of about 800 feet above sea level. The climate in the area is humid subtropical, with hot summers and mild winters. The average annual temperature in the area is around 60 degrees Fahrenheit.
Economy
The economy of Gasconade is largely based on agriculture and tourism. The town is home to a number of farms, which produce corn, wheat, soybeans, and other crops. The town is also home to a number of businesses, including a bank, a grocery store, a hardware store, and a movie theater.
The town is also home to a number of tourist attractions, including the Gasconade River, which is a popular destination for fishing and canoeing. The town is also home to a number of historic sites, including the Gasconade County Courthouse, which was built in 1845.
Demographics
As of the 2010 census, the population of Gasconade was 514. The racial makeup of the town was 97.3% White, 0.6% African American, 0.2% Native American, 0.2% Asian, 0.2% from other races, and 1.7% from two or more races. Hispanic or Latino of any race were 0.8% of the population.
The median income for a household in the town was $37,500, and the median income for a family was $45,000. The per capita income for the town was $19,000. About 11.3% of families and 14.2% of the population were below the poverty line, including 18.2% of those under age 18 and 8.3% of those age 65 or over.
Common Questions
What is Per Capita Income in Gasconade?
Per Capita income in Gasconade is $31,743.
What is the Median Family Income in Gasconade?
Median Family Income in Gasconade is $71,250.
What is the Median Household income in Gasconade?
Median Household Income in Gasconade is $49,375.
What is Inequality or Gini Index in Gasconade?
Inequality or Gini Index in Gasconade is 0.57.
What is the Total Population of Gasconade?
Total Population of Gasconade is 254.
What is the Total Male Population of Gasconade?
Total Male Population of Gasconade is 164.
What is the Total Female Population of Gasconade?
Total Female Population of Gasconade is 90.
What is the Ratio of Males per 100 Females in Gasconade?
There are 182.22 Males per 100 Females in Gasconade.
What is the Ratio of Females per 100 Males in Gasconade?
There are 54.88 Females per 100 Males in Gasconade.
What is the Median Population Age in Gasconade?
Median Population Age in Gasconade is 34.3 Years.
What is the Average Family Size in Gasconade
Average Family Size in Gasconade is 4.8 People.
What is the Average Household Size in Gasconade
Average Household Size in Gasconade is 3.8 People.
How Large is the Labor Force in Gasconade?
There are 165 People in the Labor Forcein in Gasconade.
What is the Percentage of People in the Labor Force in Gasconade?
70.2% of People are in the Labor Force in Gasconade.
What is the Unemployment Rate in Gasconade?
Unemployment Rate in Gasconade is 4.8%.