Gallatin, MO Map & Demographics
Gallatin Map
Gallatin Overview
$22,627
PER CAPITA INCOME
$51,991
AVG FAMILY INCOME
$39,500
AVG HOUSEHOLD INCOME
55.4%
WAGE / INCOME GAP [ % ]
44.6¢/ $1
WAGE / INCOME GAP [ $ ]
0.43
INEQUALITY / GINI INDEX
1,747
TOTAL POPULATION
875
MALE POPULATION
872
FEMALE POPULATION
100.34
MALES / 100 FEMALES
99.66
FEMALES / 100 MALES
36.4
MEDIAN AGE
3.2
AVG FAMILY SIZE
2.4
AVG HOUSEHOLD SIZE
666
LABOR FORCE [ PEOPLE ]
51.5%
PERCENT IN LABOR FORCE
4.7%
UNEMPLOYMENT RATE
Gallatin Zip Codes
Gallatin Area Codes
Income in Gallatin
Income Overview in Gallatin
Per Capita Income in Gallatin is $22,627, while median incomes of families and households are $51,991 and $39,500 respectively.
| Characteristic | Number | Measure |
| Per Capita Income | 1,747 | $22,627 |
| Median Family Income | 403 | $51,991 |
| Mean Family Income | 403 | $69,680 |
| Median Household Income | 710 | $39,500 |
| Mean Household Income | 710 | $54,364 |
| Income Deficit | 403 | $0 |
| Wage / Income Gap (%) | 1,747 | 55.43% |
| Wage / Income Gap ($) | 1,747 | 44.57¢ per $1 |
| Gini / Inequality Index | 1,747 | 0.43 |
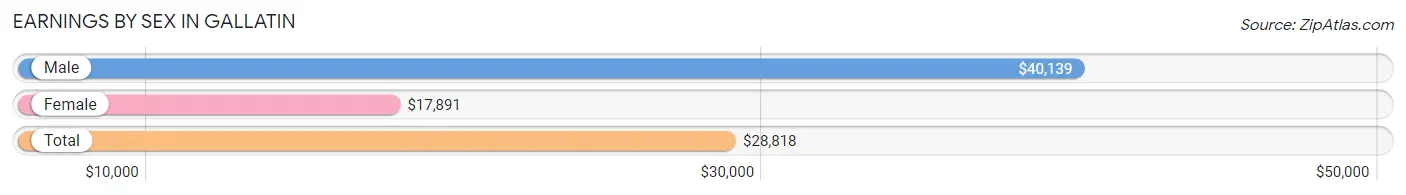
Earnings by Sex in Gallatin
Average Earnings in Gallatin are $28,818, $40,139 for men and $17,891 for women, a difference of 55.4%.
| Sex | Number | Average Earnings |
| Male | 394 (54.8%) | $40,139 |
| Female | 325 (45.2%) | $17,891 |
| Total | 719 (100.0%) | $28,818 |
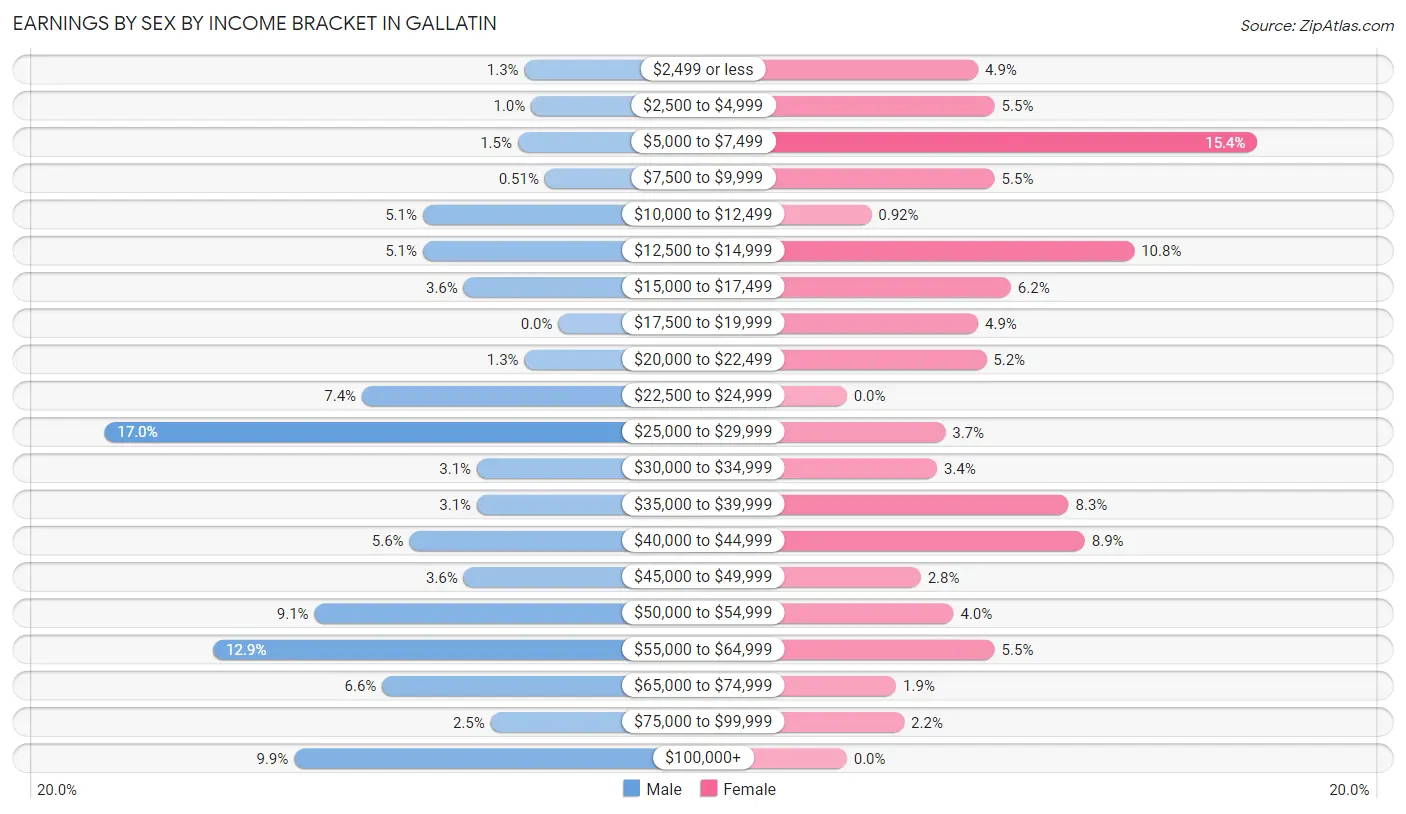
Earnings by Sex by Income Bracket in Gallatin
The most common earnings brackets in Gallatin are $25,000 to $29,999 for men (67 | 17.0%) and $5,000 to $7,499 for women (50 | 15.4%).
| Income | Male | Female |
| $2,499 or less | 5 (1.3%) | 16 (4.9%) |
| $2,500 to $4,999 | 4 (1.0%) | 18 (5.5%) |
| $5,000 to $7,499 | 6 (1.5%) | 50 (15.4%) |
| $7,500 to $9,999 | 2 (0.5%) | 18 (5.5%) |
| $10,000 to $12,499 | 20 (5.1%) | 3 (0.9%) |
| $12,500 to $14,999 | 20 (5.1%) | 35 (10.8%) |
| $15,000 to $17,499 | 14 (3.5%) | 20 (6.1%) |
| $17,500 to $19,999 | 0 (0.0%) | 16 (4.9%) |
| $20,000 to $22,499 | 5 (1.3%) | 17 (5.2%) |
| $22,500 to $24,999 | 29 (7.4%) | 0 (0.0%) |
| $25,000 to $29,999 | 67 (17.0%) | 12 (3.7%) |
| $30,000 to $34,999 | 12 (3.0%) | 11 (3.4%) |
| $35,000 to $39,999 | 12 (3.0%) | 27 (8.3%) |
| $40,000 to $44,999 | 22 (5.6%) | 29 (8.9%) |
| $45,000 to $49,999 | 14 (3.5%) | 9 (2.8%) |
| $50,000 to $54,999 | 36 (9.1%) | 13 (4.0%) |
| $55,000 to $64,999 | 51 (12.9%) | 18 (5.5%) |
| $65,000 to $74,999 | 26 (6.6%) | 6 (1.8%) |
| $75,000 to $99,999 | 10 (2.5%) | 7 (2.1%) |
| $100,000+ | 39 (9.9%) | 0 (0.0%) |
| Total | 394 (100.0%) | 325 (100.0%) |
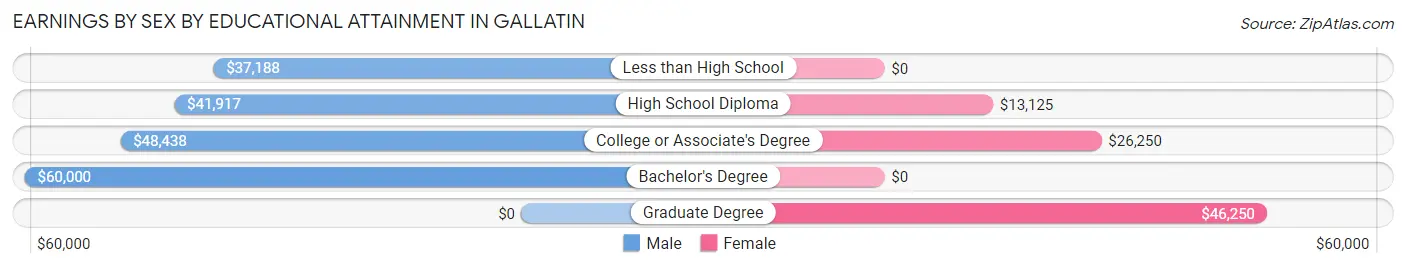
Earnings by Sex by Educational Attainment in Gallatin
Average earnings in Gallatin are $50,875 for men and $21,324 for women, a difference of 58.1%. Men with an educational attainment of bachelor's degree enjoy the highest average annual earnings of $60,000, while those with less than high school education earn the least with $37,188. Women with an educational attainment of graduate degree earn the most with the average annual earnings of $46,250, while those with high school diploma education have the smallest earnings of $13,125.
| Educational Attainment | Male Income | Female Income |
| Less than High School | $37,188 | $0 |
| High School Diploma | $41,917 | $13,125 |
| College or Associate's Degree | $48,438 | $26,250 |
| Bachelor's Degree | $60,000 | $0 |
| Graduate Degree | - | - |
| Total | $50,875 | $21,324 |
Family Income in Gallatin
Family Income Brackets in Gallatin
According to the Gallatin family income data, there are 87 families falling into the $50,000 to $74,999 income range, which is the most common income bracket and makes up 21.6% of all families. Conversely, the less than $10,000 income bracket is the least frequent group with only 14 families (3.5%) belonging to this category.
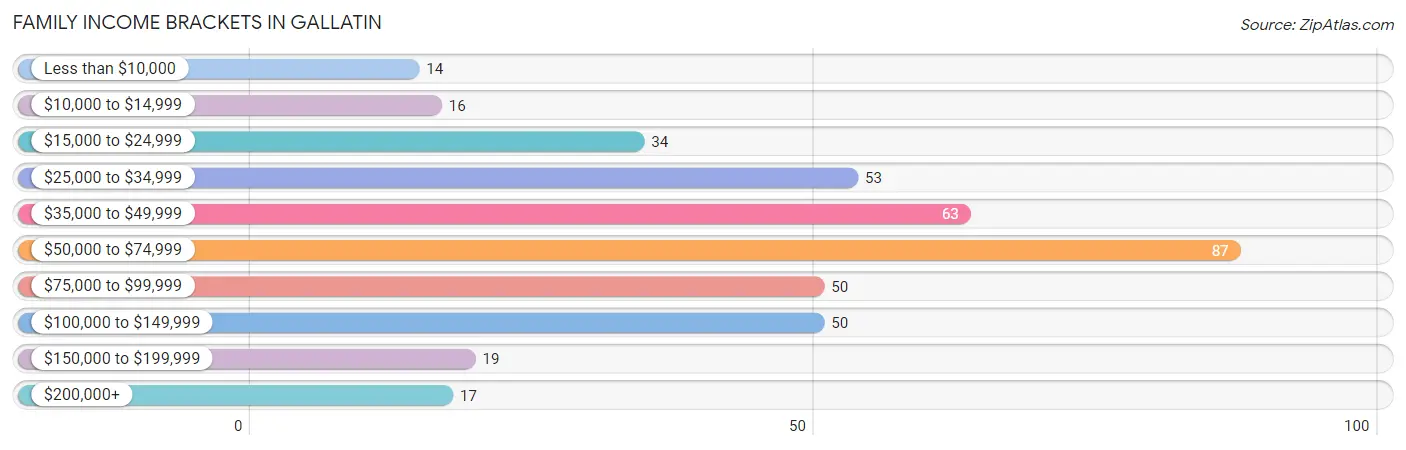
| Income Bracket | # Families | % Families |
| Less than $10,000 | 14 | 3.5% |
| $10,000 to $14,999 | 16 | 4.0% |
| $15,000 to $24,999 | 34 | 8.4% |
| $25,000 to $34,999 | 53 | 13.2% |
| $35,000 to $49,999 | 63 | 15.6% |
| $50,000 to $74,999 | 87 | 21.6% |
| $75,000 to $99,999 | 50 | 12.4% |
| $100,000 to $149,999 | 50 | 12.4% |
| $150,000 to $199,999 | 19 | 4.7% |
| $200,000+ | 17 | 4.2% |
Family Income by Famaliy Size in Gallatin
4-person families (67 | 16.6%) account for the highest median family income in Gallatin with $69,205 per family, while 2-person families (172 | 42.7%) have the highest median income of $29,166 per family member.
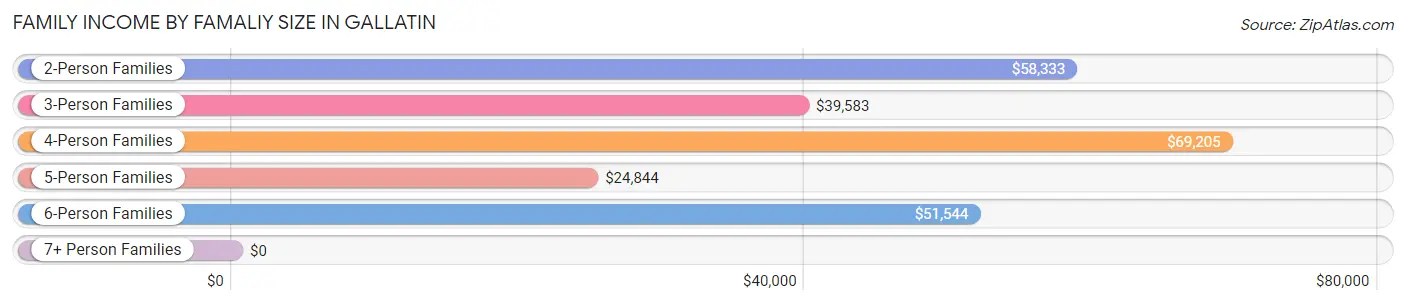
| Income Bracket | # Families | Median Income |
| 2-Person Families | 172 (42.7%) | $58,333 |
| 3-Person Families | 81 (20.1%) | $39,583 |
| 4-Person Families | 67 (16.6%) | $69,205 |
| 5-Person Families | 44 (10.9%) | $24,844 |
| 6-Person Families | 25 (6.2%) | $51,544 |
| 7+ Person Families | 14 (3.5%) | $0 |
| Total | 403 (100.0%) | $51,991 |
Family Income by Number of Earners in Gallatin
The median family income in Gallatin is $51,991, with families comprising 3+ earners (23) having the highest median family income of $119,375, while families with 1 earner (183) have the lowest median family income of $37,321, accounting for 5.7% and 45.4% of families, respectively.
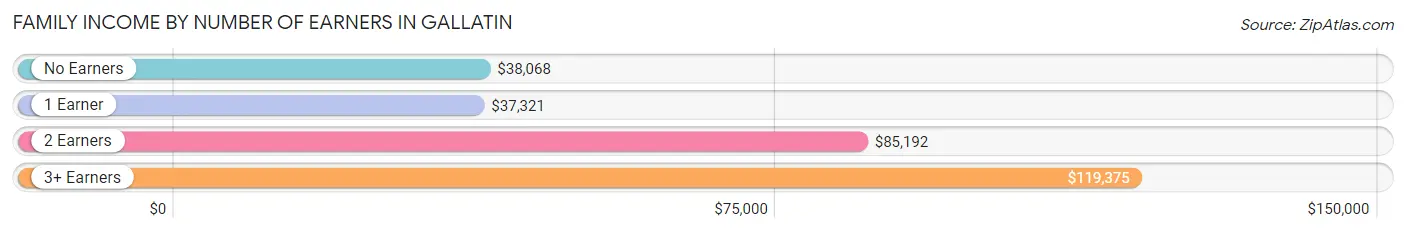
| Number of Earners | # Families | Median Income |
| No Earners | 75 (18.6%) | $38,068 |
| 1 Earner | 183 (45.4%) | $37,321 |
| 2 Earners | 122 (30.3%) | $85,192 |
| 3+ Earners | 23 (5.7%) | $119,375 |
| Total | 403 (100.0%) | $51,991 |
Household Income in Gallatin
Household Income Brackets in Gallatin
With 151 households falling in the category, the $50,000 to $74,999 income range is the most frequent in Gallatin, accounting for 21.3% of all households. In contrast, only 17 households (2.4%) fall into the $200,000+ income bracket, making it the least populous group.
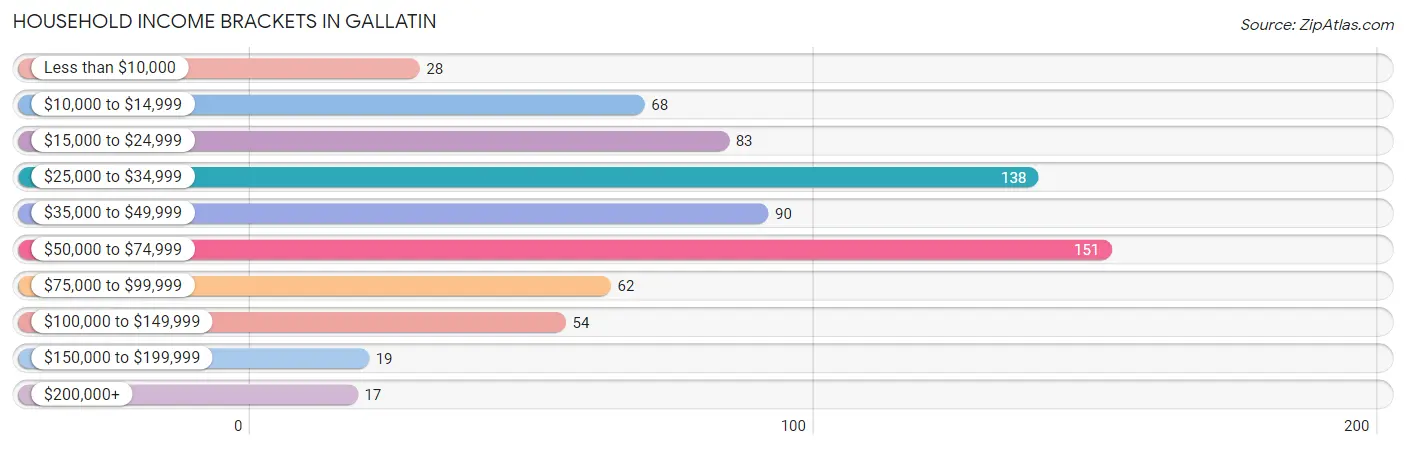
| Income Bracket | # Households | % Households |
| Less than $10,000 | 28 | 3.9% |
| $10,000 to $14,999 | 68 | 9.6% |
| $15,000 to $24,999 | 83 | 11.7% |
| $25,000 to $34,999 | 138 | 19.4% |
| $35,000 to $49,999 | 90 | 12.7% |
| $50,000 to $74,999 | 151 | 21.3% |
| $75,000 to $99,999 | 62 | 8.7% |
| $100,000 to $149,999 | 54 | 7.6% |
| $150,000 to $199,999 | 19 | 2.7% |
| $200,000+ | 17 | 2.4% |
Household Income by Householder Age in Gallatin
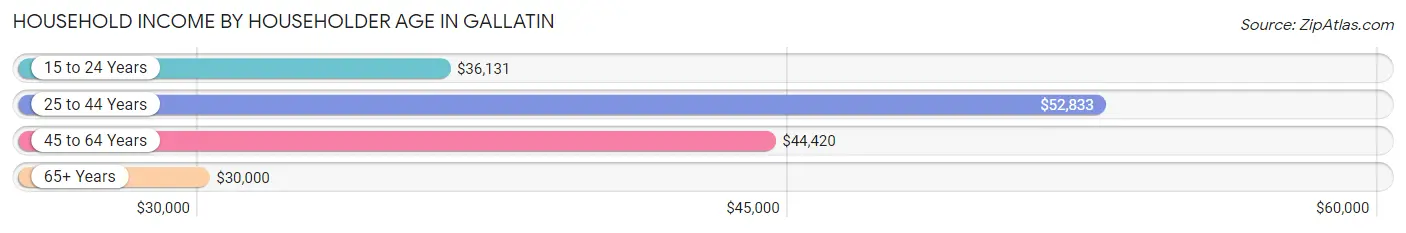
The median household income in Gallatin is $39,500, with the highest median household income of $52,833 found in the 25 to 44 years age bracket for the primary householder. A total of 180 households (25.4%) fall into this category. Meanwhile, the 65+ years age bracket for the primary householder has the lowest median household income of $30,000, with 250 households (35.2%) in this group.
| Income Bracket | # Households | Median Income |
| 15 to 24 Years | 61 (8.6%) | $36,131 |
| 25 to 44 Years | 180 (25.4%) | $52,833 |
| 45 to 64 Years | 219 (30.8%) | $44,420 |
| 65+ Years | 250 (35.2%) | $30,000 |
| Total | 710 (100.0%) | $39,500 |
Poverty in Gallatin
Income Below Poverty by Sex and Age in Gallatin
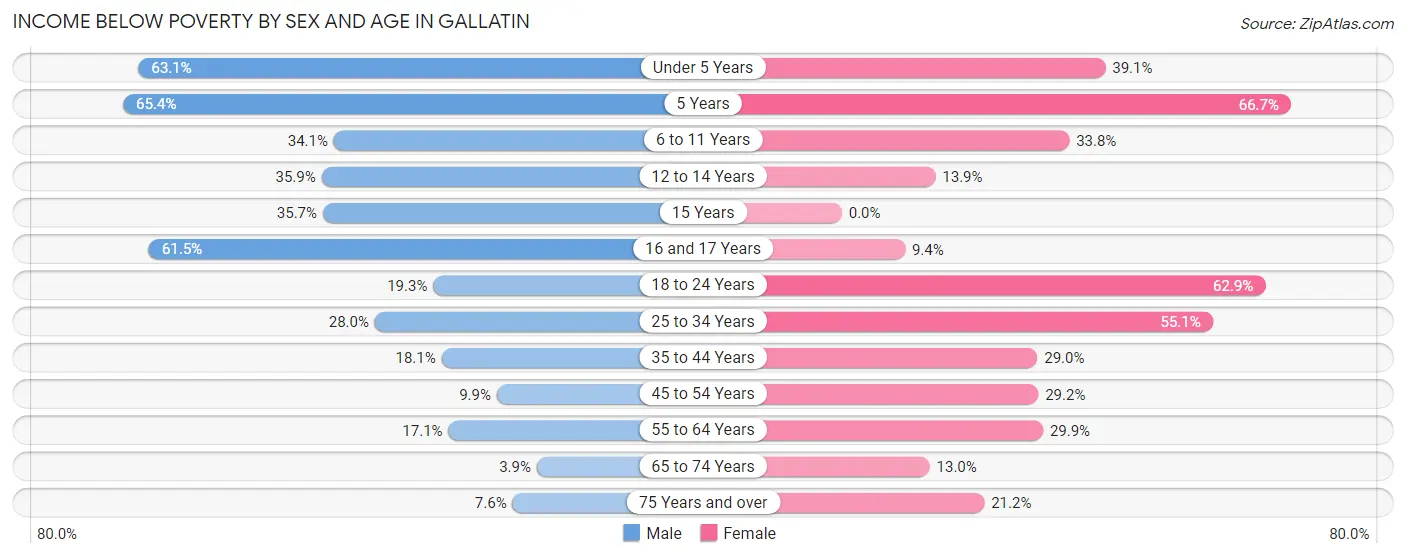
With 24.6% poverty level for males and 33.6% for females among the residents of Gallatin, 5 year old males and 5 year old females are the most vulnerable to poverty, with 17 males (65.4%) and 10 females (66.7%) in their respective age groups living below the poverty level.
| Age Bracket | Male | Female |
| Under 5 Years | 53 (63.1%) | 27 (39.1%) |
| 5 Years | 17 (65.4%) | 10 (66.7%) |
| 6 to 11 Years | 30 (34.1%) | 26 (33.8%) |
| 12 to 14 Years | 14 (35.9%) | 5 (13.9%) |
| 15 Years | 5 (35.7%) | 0 (0.0%) |
| 16 and 17 Years | 8 (61.5%) | 3 (9.4%) |
| 18 to 24 Years | 17 (19.3%) | 44 (62.9%) |
| 25 to 34 Years | 21 (28.0%) | 60 (55.0%) |
| 35 to 44 Years | 17 (18.1%) | 27 (29.0%) |
| 45 to 54 Years | 8 (9.9%) | 35 (29.2%) |
| 55 to 64 Years | 14 (17.1%) | 23 (29.9%) |
| 65 to 74 Years | 5 (3.9%) | 12 (13.0%) |
| 75 Years and over | 4 (7.5%) | 11 (21.1%) |
| Total | 213 (24.6%) | 283 (33.6%) |
Income Above Poverty by Sex and Age in Gallatin
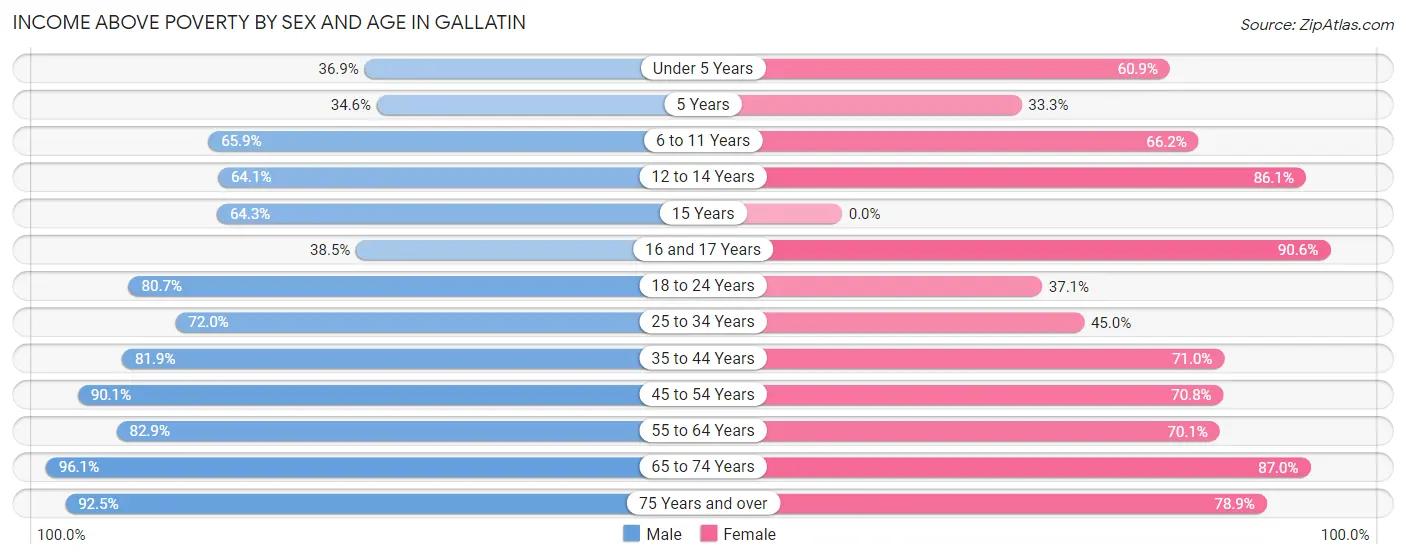
According to the poverty statistics in Gallatin, males aged 65 to 74 years and females aged 16 and 17 years are the age groups that are most secure financially, with 96.1% of males and 90.6% of females in these age groups living above the poverty line.
| Age Bracket | Male | Female |
| Under 5 Years | 31 (36.9%) | 42 (60.9%) |
| 5 Years | 9 (34.6%) | 5 (33.3%) |
| 6 to 11 Years | 58 (65.9%) | 51 (66.2%) |
| 12 to 14 Years | 25 (64.1%) | 31 (86.1%) |
| 15 Years | 9 (64.3%) | 0 (0.0%) |
| 16 and 17 Years | 5 (38.5%) | 29 (90.6%) |
| 18 to 24 Years | 71 (80.7%) | 26 (37.1%) |
| 25 to 34 Years | 54 (72.0%) | 49 (45.0%) |
| 35 to 44 Years | 77 (81.9%) | 66 (71.0%) |
| 45 to 54 Years | 73 (90.1%) | 85 (70.8%) |
| 55 to 64 Years | 68 (82.9%) | 54 (70.1%) |
| 65 to 74 Years | 122 (96.1%) | 80 (87.0%) |
| 75 Years and over | 49 (92.4%) | 41 (78.8%) |
| Total | 651 (75.3%) | 559 (66.4%) |
Income Below Poverty Among Married-Couple Families in Gallatin
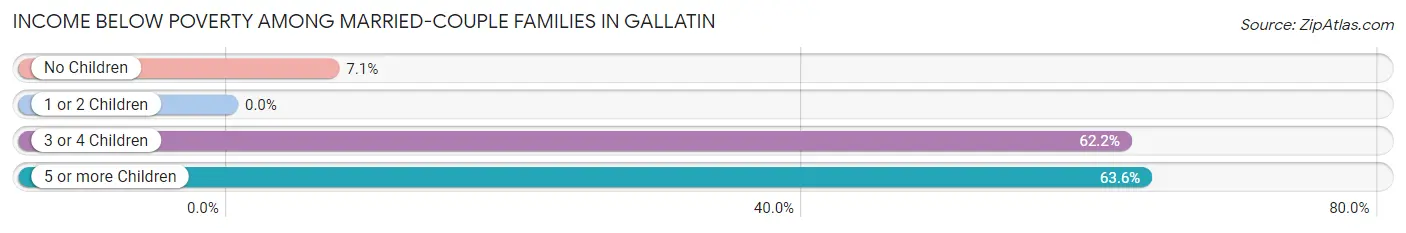
The poverty statistics for married-couple families in Gallatin show that 15.3% or 47 of the total 307 families live below the poverty line. Families with 5 or more children have the highest poverty rate of 63.6%, comprising of 7 families. On the other hand, families with 1 or 2 children have the lowest poverty rate of 0.0%, which includes 0 families.
| Children | Above Poverty | Below Poverty |
| No Children | 158 (92.9%) | 12 (7.1%) |
| 1 or 2 Children | 81 (100.0%) | 0 (0.0%) |
| 3 or 4 Children | 17 (37.8%) | 28 (62.2%) |
| 5 or more Children | 4 (36.4%) | 7 (63.6%) |
| Total | 260 (84.7%) | 47 (15.3%) |
Income Below Poverty Among Single-Parent Households in Gallatin
According to the poverty data in Gallatin, 4.3% or 2 single-father households and 52.0% or 26 single-mother households are living below the poverty line. Among single-father households, those with 1 or 2 children have the highest poverty rate, with 2 households (8.0%) experiencing poverty. Likewise, among single-mother households, those with 3 or 4 children have the highest poverty rate, with 12 households (100.0%) falling below the poverty line.
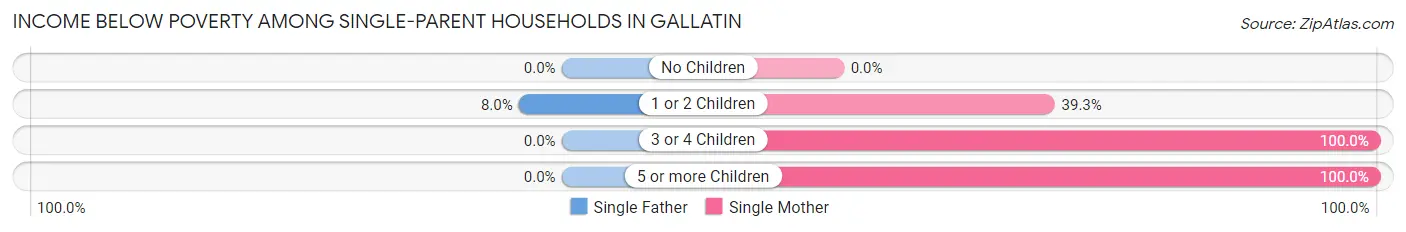
| Children | Single Father | Single Mother |
| No Children | 0 (0.0%) | 0 (0.0%) |
| 1 or 2 Children | 2 (8.0%) | 11 (39.3%) |
| 3 or 4 Children | 0 (0.0%) | 12 (100.0%) |
| 5 or more Children | 0 (0.0%) | 3 (100.0%) |
| Total | 2 (4.3%) | 26 (52.0%) |
Income Below Poverty Among Married-Couple vs Single-Parent Households in Gallatin
The poverty data for Gallatin shows that 47 of the married-couple family households (15.3%) and 28 of the single-parent households (29.2%) are living below the poverty level. Within the married-couple family households, those with 5 or more children have the highest poverty rate, with 7 households (63.6%) falling below the poverty line. Among the single-parent households, those with 3 or 4 children have the highest poverty rate, with 12 household (100.0%) living below poverty.
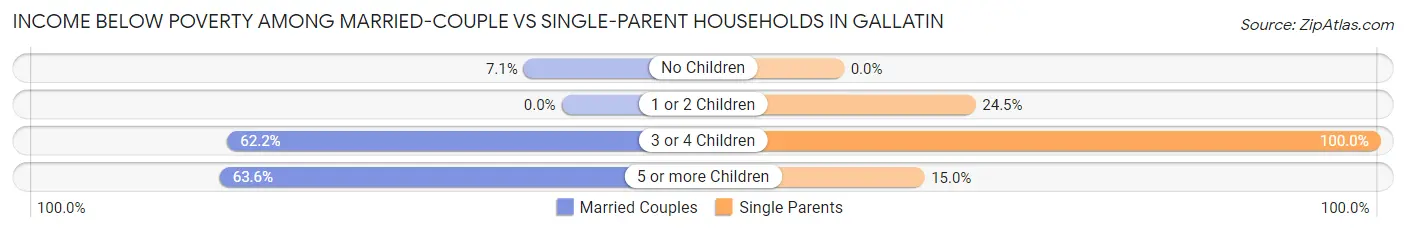
| Children | Married-Couple Families | Single-Parent Households |
| No Children | 12 (7.1%) | 0 (0.0%) |
| 1 or 2 Children | 0 (0.0%) | 13 (24.5%) |
| 3 or 4 Children | 28 (62.2%) | 12 (100.0%) |
| 5 or more Children | 7 (63.6%) | 3 (15.0%) |
| Total | 47 (15.3%) | 28 (29.2%) |
Race in Gallatin
The most populous races in Gallatin are White / Caucasian (1,671 | 95.7%), Two or more Races (66 | 3.8%), and Hispanic or Latino (46 | 2.6%).
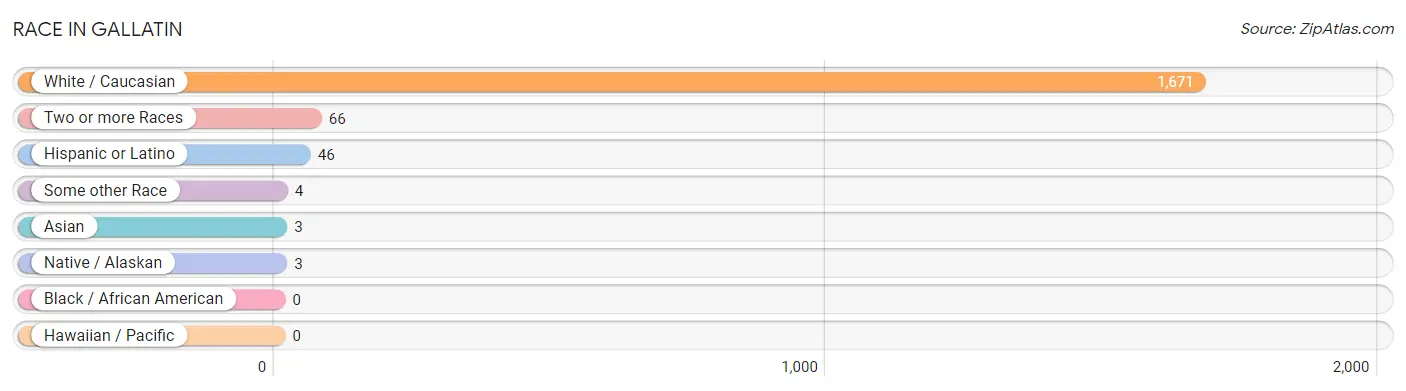
| Race | # Population | % Population |
| Asian | 3 | 0.2% |
| Black / African American | 0 | 0.0% |
| Hawaiian / Pacific | 0 | 0.0% |
| Hispanic or Latino | 46 | 2.6% |
| Native / Alaskan | 3 | 0.2% |
| White / Caucasian | 1,671 | 95.7% |
| Two or more Races | 66 | 3.8% |
| Some other Race | 4 | 0.2% |
| Total | 1,747 | 100.0% |
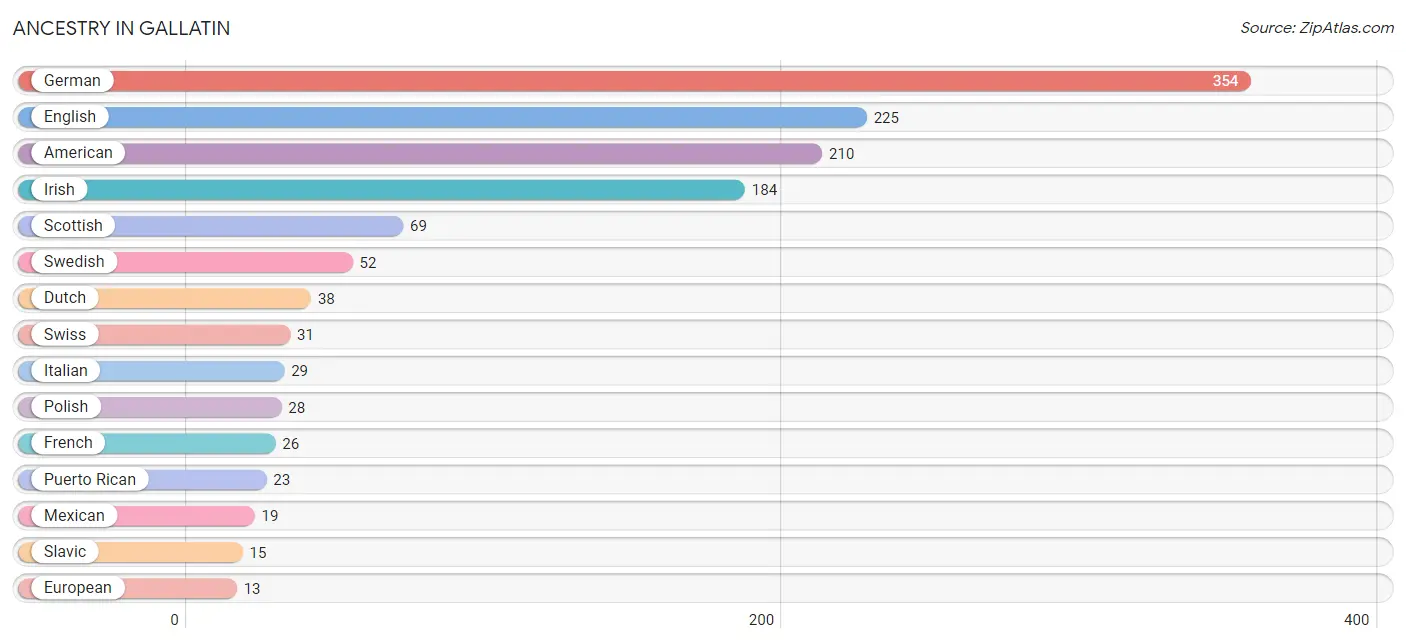
Ancestry in Gallatin
The most populous ancestries reported in Gallatin are German (354 | 20.3%), English (225 | 12.9%), American (210 | 12.0%), Irish (184 | 10.5%), and Scottish (69 | 4.0%), together accounting for 59.6% of all Gallatin residents.
| Ancestry | # Population | % Population |
| American | 210 | 12.0% |
| Bangladeshi | 3 | 0.2% |
| Blackfeet | 6 | 0.3% |
| British | 3 | 0.2% |
| Canadian | 9 | 0.5% |
| Cherokee | 2 | 0.1% |
| Chippewa | 7 | 0.4% |
| Colombian | 4 | 0.2% |
| Dutch | 38 | 2.2% |
| English | 225 | 12.9% |
| European | 13 | 0.7% |
| French | 26 | 1.5% |
| German | 354 | 20.3% |
| Irish | 184 | 10.5% |
| Italian | 29 | 1.7% |
| Lithuanian | 10 | 0.6% |
| Mexican | 19 | 1.1% |
| Norwegian | 13 | 0.7% |
| Polish | 28 | 1.6% |
| Puerto Rican | 23 | 1.3% |
| Russian | 8 | 0.5% |
| Scotch-Irish | 12 | 0.7% |
| Scottish | 69 | 4.0% |
| Sioux | 6 | 0.3% |
| Slavic | 15 | 0.9% |
| South American | 4 | 0.2% |
| Swedish | 52 | 3.0% |
| Swiss | 31 | 1.8% |
| Welsh | 3 | 0.2% | View All 29 Rows |
Immigrants in Gallatin
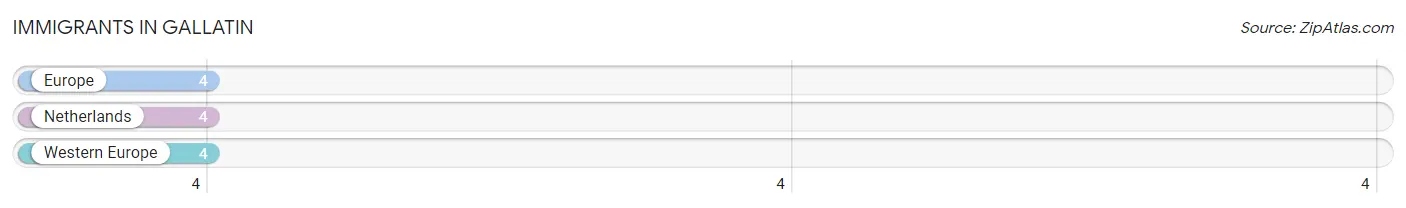
The most numerous immigrant groups reported in Gallatin came from Europe (4 | 0.2%), Netherlands (4 | 0.2%), and Western Europe (4 | 0.2%), together accounting for 0.7% of all Gallatin residents.
| Immigration Origin | # Population | % Population |
| Europe | 4 | 0.2% |
| Netherlands | 4 | 0.2% |
| Western Europe | 4 | 0.2% | View All 3 Rows |
Sex and Age in Gallatin
Sex and Age in Gallatin
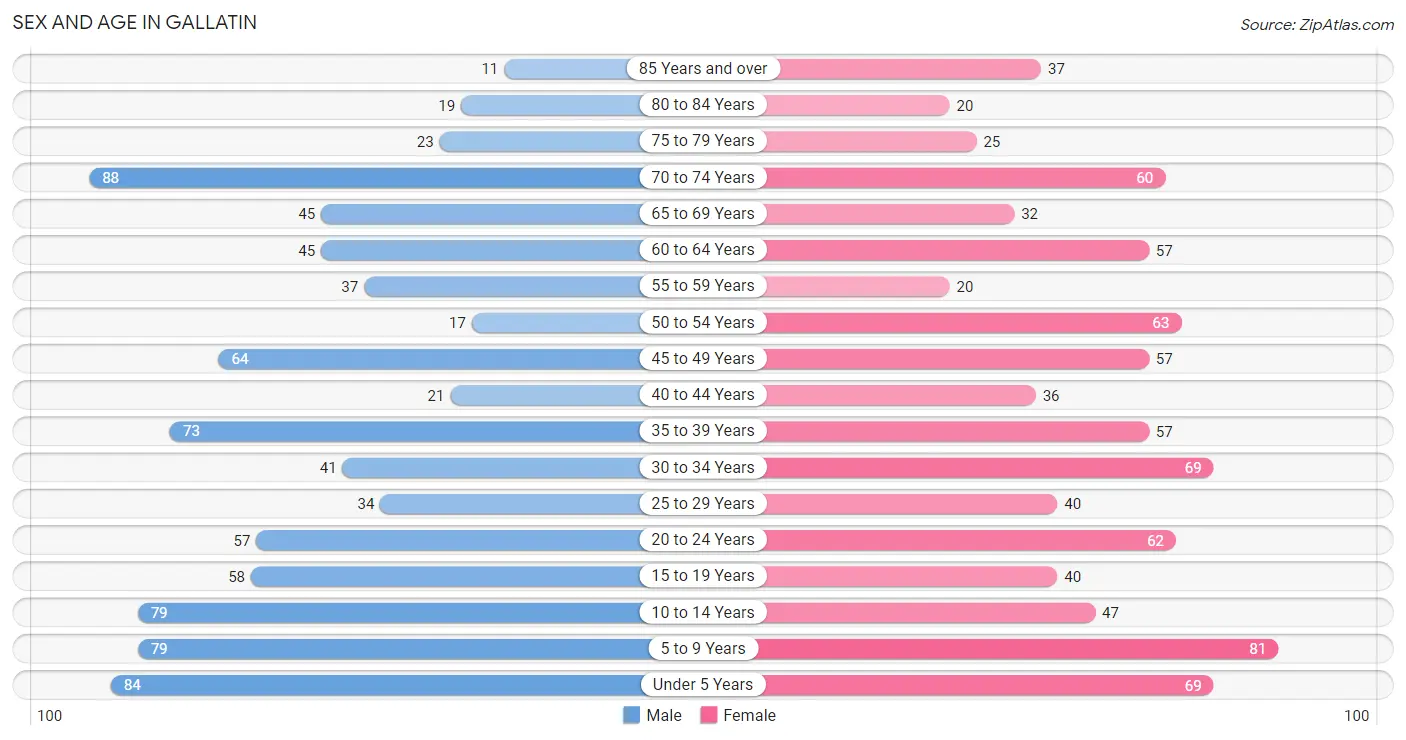
The most populous age groups in Gallatin are 70 to 74 Years (88 | 10.1%) for men and 5 to 9 Years (81 | 9.3%) for women.
| Age Bracket | Male | Female |
| Under 5 Years | 84 (9.6%) | 69 (7.9%) |
| 5 to 9 Years | 79 (9.0%) | 81 (9.3%) |
| 10 to 14 Years | 79 (9.0%) | 47 (5.4%) |
| 15 to 19 Years | 58 (6.6%) | 40 (4.6%) |
| 20 to 24 Years | 57 (6.5%) | 62 (7.1%) |
| 25 to 29 Years | 34 (3.9%) | 40 (4.6%) |
| 30 to 34 Years | 41 (4.7%) | 69 (7.9%) |
| 35 to 39 Years | 73 (8.3%) | 57 (6.5%) |
| 40 to 44 Years | 21 (2.4%) | 36 (4.1%) |
| 45 to 49 Years | 64 (7.3%) | 57 (6.5%) |
| 50 to 54 Years | 17 (1.9%) | 63 (7.2%) |
| 55 to 59 Years | 37 (4.2%) | 20 (2.3%) |
| 60 to 64 Years | 45 (5.1%) | 57 (6.5%) |
| 65 to 69 Years | 45 (5.1%) | 32 (3.7%) |
| 70 to 74 Years | 88 (10.1%) | 60 (6.9%) |
| 75 to 79 Years | 23 (2.6%) | 25 (2.9%) |
| 80 to 84 Years | 19 (2.2%) | 20 (2.3%) |
| 85 Years and over | 11 (1.3%) | 37 (4.2%) |
| Total | 875 (100.0%) | 872 (100.0%) |
Families and Households in Gallatin
Median Family Size in Gallatin
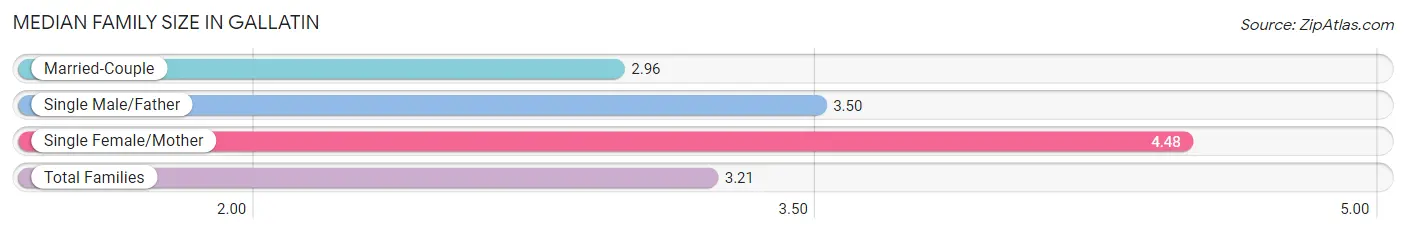
The median family size in Gallatin is 3.21 persons per family, with single female/mother families (50 | 12.4%) accounting for the largest median family size of 4.48 persons per family. On the other hand, married-couple families (307 | 76.2%) represent the smallest median family size with 2.96 persons per family.
| Family Type | # Families | Family Size |
| Married-Couple | 307 (76.2%) | 2.96 |
| Single Male/Father | 46 (11.4%) | 3.50 |
| Single Female/Mother | 50 (12.4%) | 4.48 |
| Total Families | 403 (100.0%) | 3.21 |
Median Household Size in Gallatin
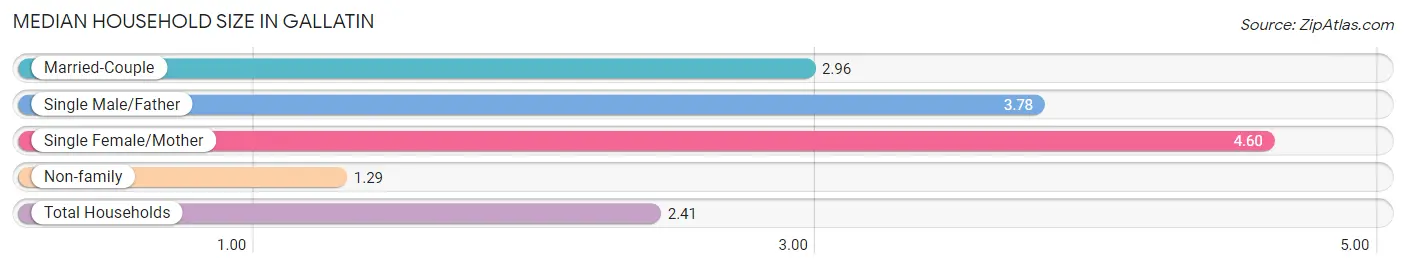
The median household size in Gallatin is 2.41 persons per household, with single female/mother households (50 | 7.0%) accounting for the largest median household size of 4.6 persons per household. non-family households (307 | 43.2%) represent the smallest median household size with 1.29 persons per household.
| Household Type | # Households | Household Size |
| Married-Couple | 307 (43.2%) | 2.96 |
| Single Male/Father | 46 (6.5%) | 3.78 |
| Single Female/Mother | 50 (7.0%) | 4.60 |
| Non-family | 307 (43.2%) | 1.29 |
| Total Households | 710 (100.0%) | 2.41 |
Household Size by Marriage Status in Gallatin
Out of a total of 710 households in Gallatin, 403 (56.8%) are family households, while 307 (43.2%) are nonfamily households. The most numerous type of family households are 2-person households, comprising 172, and the most common type of nonfamily households are 1-person households, comprising 259.
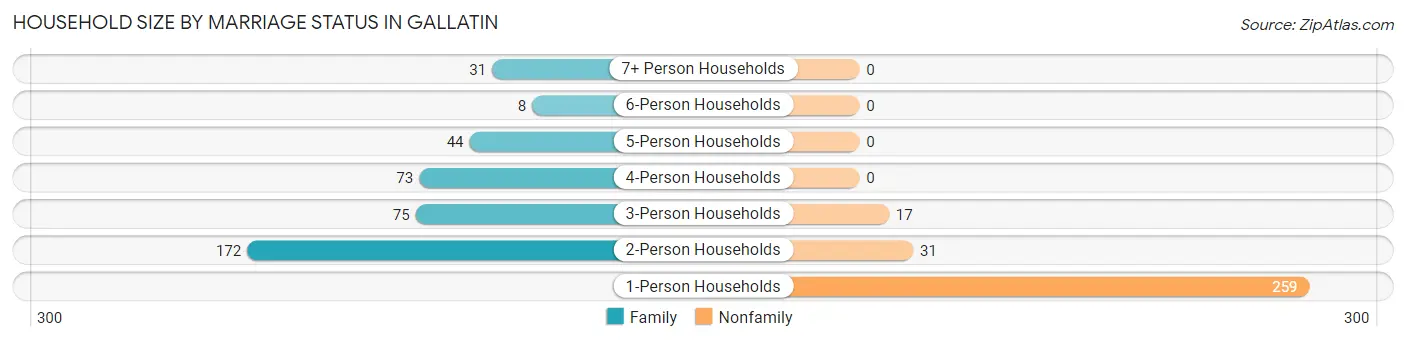
| Household Size | Family Households | Nonfamily Households |
| 1-Person Households | - | 259 (36.5%) |
| 2-Person Households | 172 (24.2%) | 31 (4.4%) |
| 3-Person Households | 75 (10.6%) | 17 (2.4%) |
| 4-Person Households | 73 (10.3%) | 0 (0.0%) |
| 5-Person Households | 44 (6.2%) | 0 (0.0%) |
| 6-Person Households | 8 (1.1%) | 0 (0.0%) |
| 7+ Person Households | 31 (4.4%) | 0 (0.0%) |
| Total | 403 (56.8%) | 307 (43.2%) |
Female Fertility in Gallatin
Fertility by Age in Gallatin
Average fertility rate in Gallatin is 117.0 births per 1,000 women. Women in the age bracket of 20 to 34 years have the highest fertility rate with 228.0 births per 1,000 women. Women in the age bracket of 20 to 34 years acount for 90.7% of all women with births.
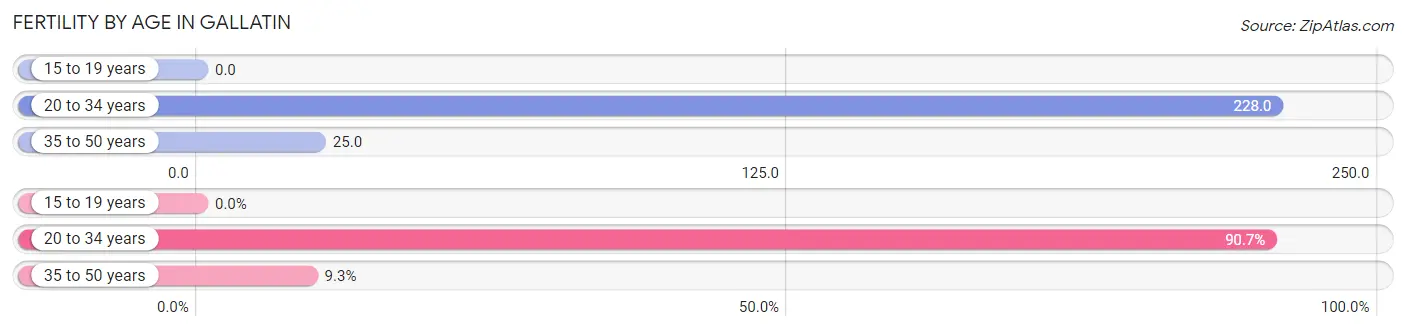
| Age Bracket | Women with Births | Births / 1,000 Women |
| 15 to 19 years | 0 (0.0%) | 0.0 |
| 20 to 34 years | 39 (90.7%) | 228.0 |
| 35 to 50 years | 4 (9.3%) | 25.0 |
| Total | 43 (100.0%) | 117.0 |
Fertility by Age by Marriage Status in Gallatin
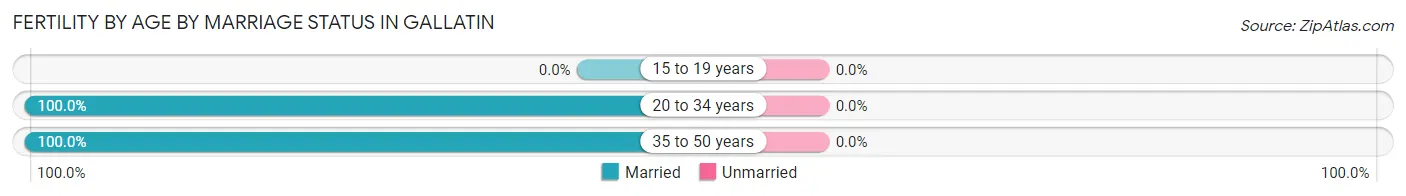
| Age Bracket | Married | Unmarried |
| 15 to 19 years | 0 (0.0%) | 0 (0.0%) |
| 20 to 34 years | 39 (100.0%) | 0 (0.0%) |
| 35 to 50 years | 4 (100.0%) | 0 (0.0%) |
| Total | 43 (100.0%) | 0 (0.0%) |
Fertility by Education in Gallatin
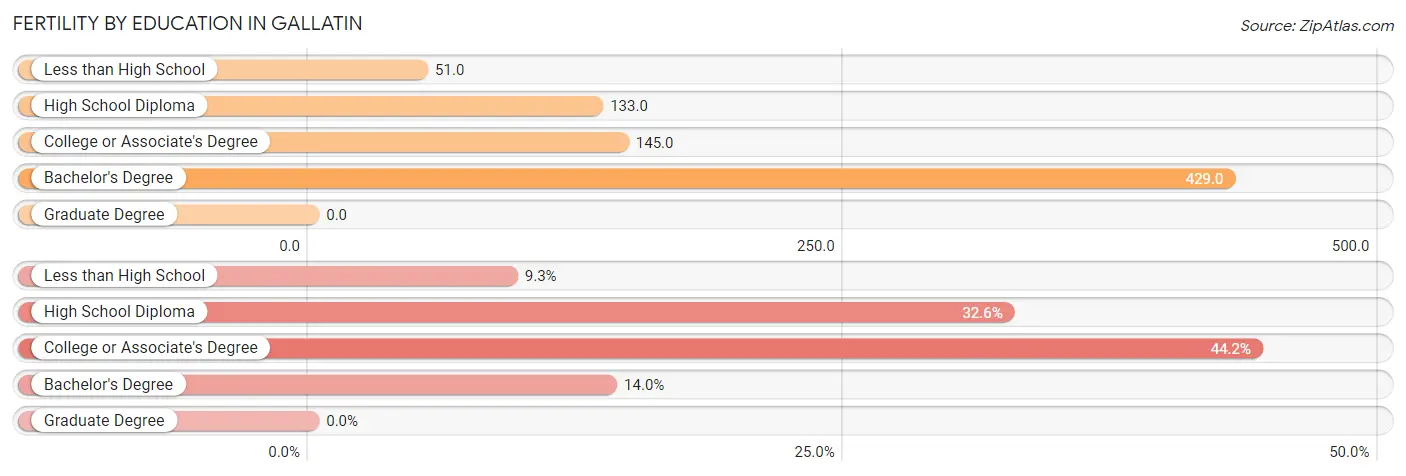
| Educational Attainment | Women with Births | Births / 1,000 Women |
| Less than High School | 4 (9.3%) | 51.0 |
| High School Diploma | 14 (32.6%) | 133.0 |
| College or Associate's Degree | 19 (44.2%) | 145.0 |
| Bachelor's Degree | 6 (14.0%) | 429.0 |
| Graduate Degree | 0 (0.0%) | 0.0 |
| Total | 43 (100.0%) | 117.0 |
Fertility by Education by Marriage Status in Gallatin
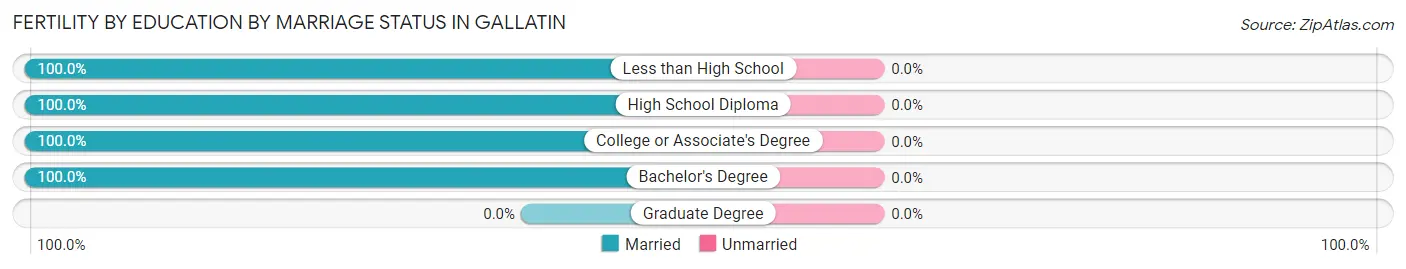
| Educational Attainment | Married | Unmarried |
| Less than High School | 4 (100.0%) | 0 (0.0%) |
| High School Diploma | 14 (100.0%) | 0 (0.0%) |
| College or Associate's Degree | 19 (100.0%) | 0 (0.0%) |
| Bachelor's Degree | 6 (100.0%) | 0 (0.0%) |
| Graduate Degree | 0 (0.0%) | 0 (0.0%) |
| Total | 43 (100.0%) | 0 (0.0%) |
Employment Characteristics in Gallatin
Employment by Class of Employer in Gallatin
Among the 628 employed individuals in Gallatin, private company employees (393 | 62.6%), local government employees (86 | 13.7%), and self-employed (not incorporated) (49 | 7.8%) make up the most common classes of employment.
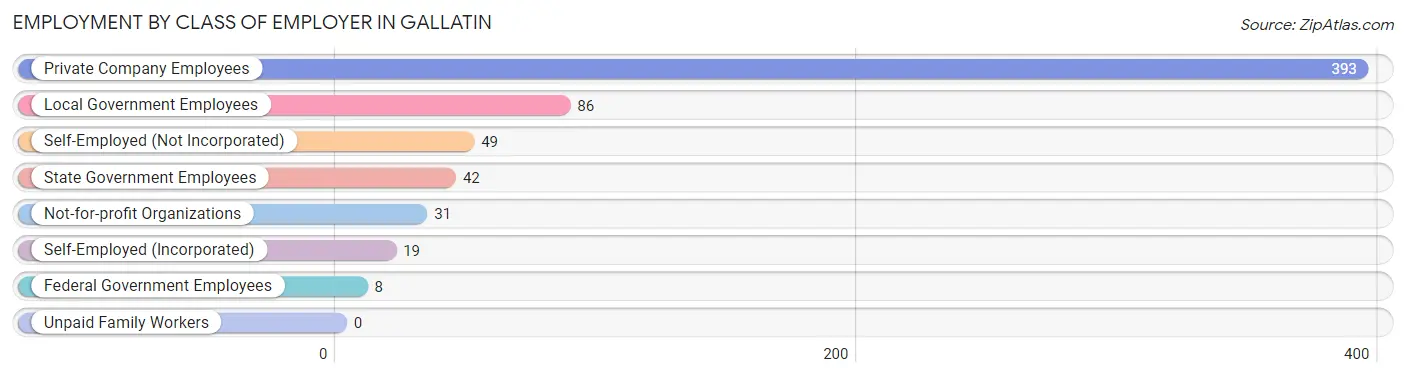
| Employer Class | # Employees | % Employees |
| Private Company Employees | 393 | 62.6% |
| Self-Employed (Incorporated) | 19 | 3.0% |
| Self-Employed (Not Incorporated) | 49 | 7.8% |
| Not-for-profit Organizations | 31 | 4.9% |
| Local Government Employees | 86 | 13.7% |
| State Government Employees | 42 | 6.7% |
| Federal Government Employees | 8 | 1.3% |
| Unpaid Family Workers | 0 | 0.0% |
| Total | 628 | 100.0% |
Employment Status by Age in Gallatin
According to the labor force statistics for Gallatin, out of the total population over 16 years of age (1,294), 51.5% or 666 individuals are in the labor force, with 4.7% or 31 of them unemployed. The age group with the highest labor force participation rate is 35 to 44 years, with 84.0% or 157 individuals in the labor force. Within the labor force, the 25 to 29 years age range has the highest percentage of unemployed individuals, with 30.2% or 13 of them being unemployed.
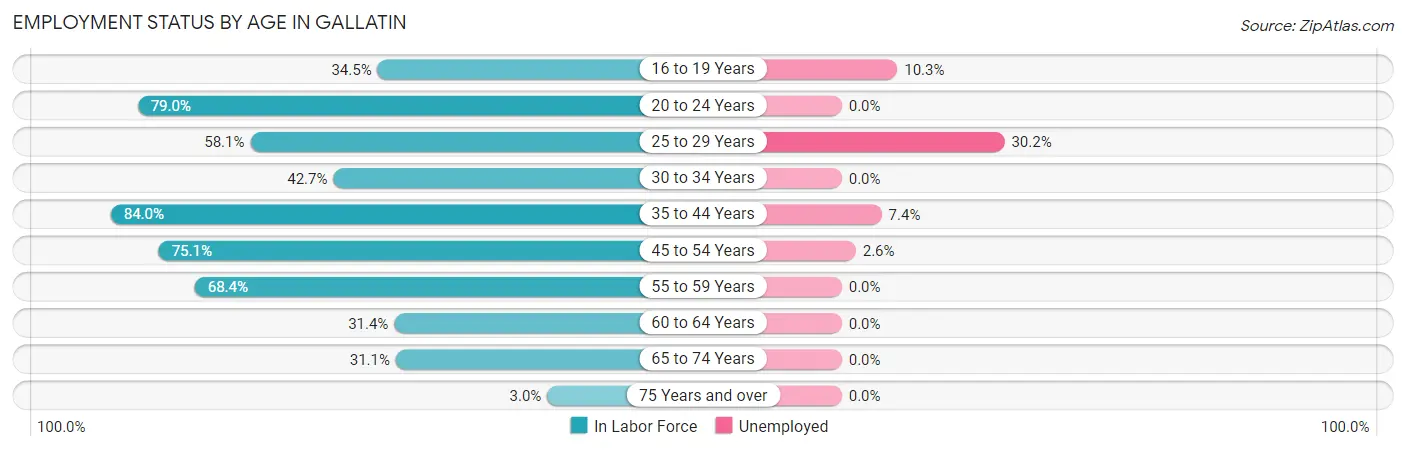
| Age Bracket | In Labor Force | Unemployed |
| 16 to 19 Years | 29 (34.5%) | 3 (10.3%) |
| 20 to 24 Years | 94 (79.0%) | 0 (0.0%) |
| 25 to 29 Years | 43 (58.1%) | 13 (30.2%) |
| 30 to 34 Years | 47 (42.7%) | 0 (0.0%) |
| 35 to 44 Years | 157 (84.0%) | 12 (7.4%) |
| 45 to 54 Years | 151 (75.1%) | 4 (2.6%) |
| 55 to 59 Years | 39 (68.4%) | 0 (0.0%) |
| 60 to 64 Years | 32 (31.4%) | 0 (0.0%) |
| 65 to 74 Years | 70 (31.1%) | 0 (0.0%) |
| 75 Years and over | 4 (3.0%) | 0 (0.0%) |
| Total | 666 (51.5%) | 31 (4.7%) |
Employment Status by Educational Attainment in Gallatin
According to labor force statistics for Gallatin, 64.2% of individuals (469) out of the total population between 25 and 64 years of age (731) are in the labor force, with 6.1% or 29 of them being unemployed. The group with the highest labor force participation rate are those with the educational attainment of bachelor's degree or higher, with 85.6% or 113 individuals in the labor force. Within the labor force, individuals with high school diploma education have the highest percentage of unemployment, with 12.5% or 20 of them being unemployed.
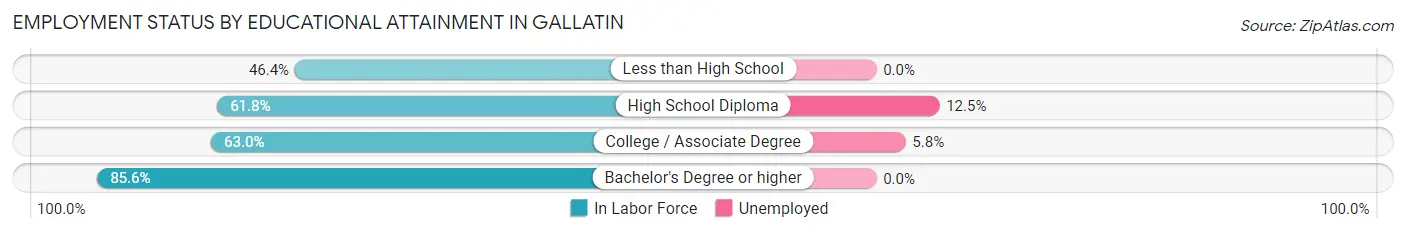
| Educational Attainment | In Labor Force | Unemployed |
| Less than High School | 51 (46.4%) | 0 (0.0%) |
| High School Diploma | 160 (61.8%) | 32 (12.5%) |
| College / Associate Degree | 145 (63.0%) | 13 (5.8%) |
| Bachelor's Degree or higher | 113 (85.6%) | 0 (0.0%) |
| Total | 469 (64.2%) | 45 (6.1%) |
Employment Occupations by Sex in Gallatin
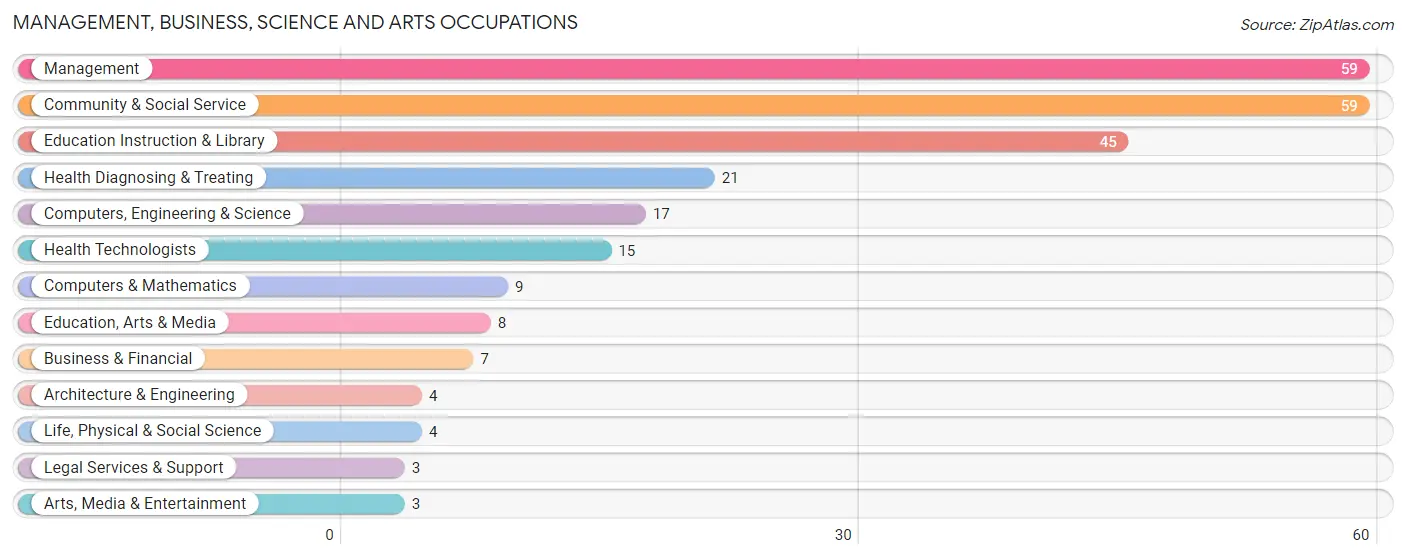
Management, Business, Science and Arts Occupations
The most common Management, Business, Science and Arts occupations in Gallatin are Management (59 | 9.4%), Community & Social Service (59 | 9.4%), Education Instruction & Library (45 | 7.2%), Health Diagnosing & Treating (21 | 3.4%), and Computers, Engineering & Science (17 | 2.7%).
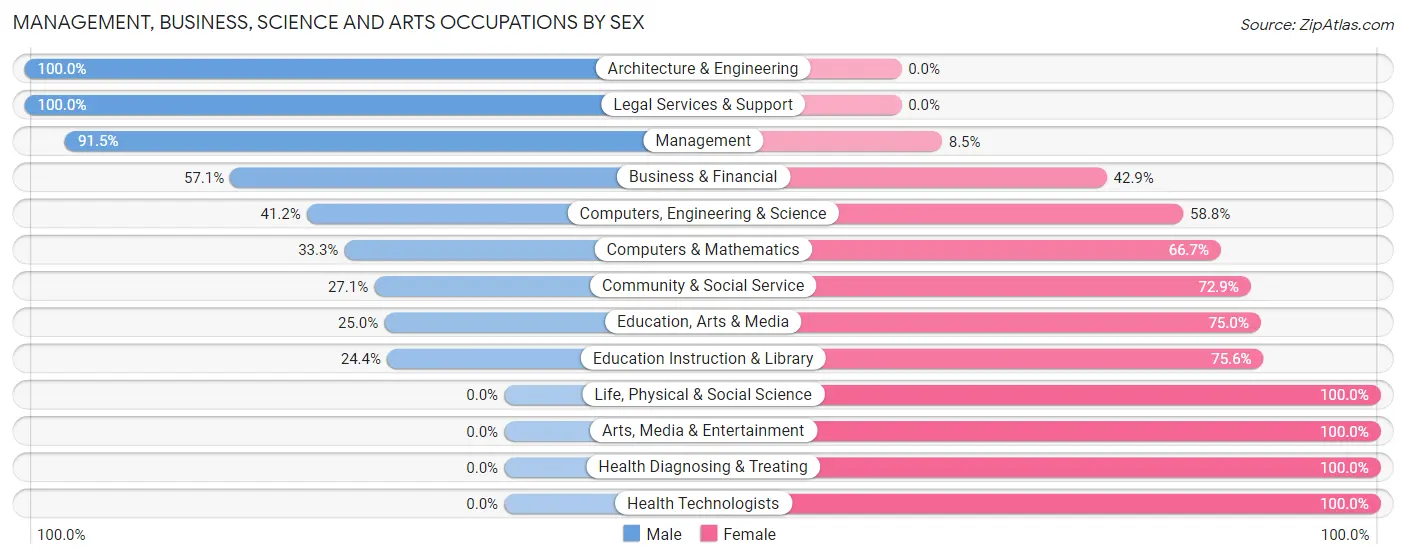
Management, Business, Science and Arts Occupations by Sex
Within the Management, Business, Science and Arts occupations in Gallatin, the most male-oriented occupations are Architecture & Engineering (100.0%), Legal Services & Support (100.0%), and Management (91.5%), while the most female-oriented occupations are Life, Physical & Social Science (100.0%), Arts, Media & Entertainment (100.0%), and Health Diagnosing & Treating (100.0%).
| Occupation | Male | Female |
| Management | 54 (91.5%) | 5 (8.5%) |
| Business & Financial | 4 (57.1%) | 3 (42.9%) |
| Computers, Engineering & Science | 7 (41.2%) | 10 (58.8%) |
| Computers & Mathematics | 3 (33.3%) | 6 (66.7%) |
| Architecture & Engineering | 4 (100.0%) | 0 (0.0%) |
| Life, Physical & Social Science | 0 (0.0%) | 4 (100.0%) |
| Community & Social Service | 16 (27.1%) | 43 (72.9%) |
| Education, Arts & Media | 2 (25.0%) | 6 (75.0%) |
| Legal Services & Support | 3 (100.0%) | 0 (0.0%) |
| Education Instruction & Library | 11 (24.4%) | 34 (75.6%) |
| Arts, Media & Entertainment | 0 (0.0%) | 3 (100.0%) |
| Health Diagnosing & Treating | 0 (0.0%) | 21 (100.0%) |
| Health Technologists | 0 (0.0%) | 15 (100.0%) |
| Total (Category) | 81 (49.7%) | 82 (50.3%) |
| Total (Overall) | 344 (54.9%) | 283 (45.1%) |
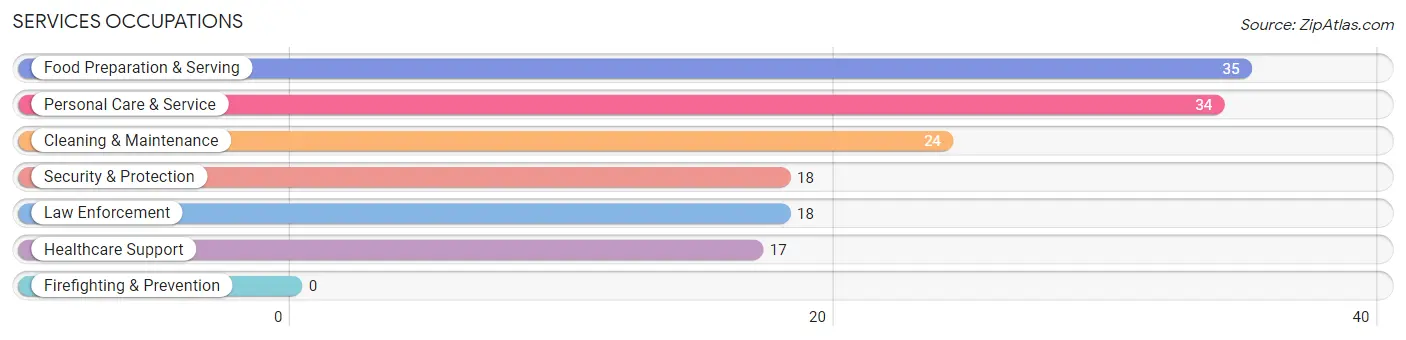
Services Occupations
The most common Services occupations in Gallatin are Food Preparation & Serving (35 | 5.6%), Personal Care & Service (34 | 5.4%), Cleaning & Maintenance (24 | 3.8%), Security & Protection (18 | 2.9%), and Law Enforcement (18 | 2.9%).
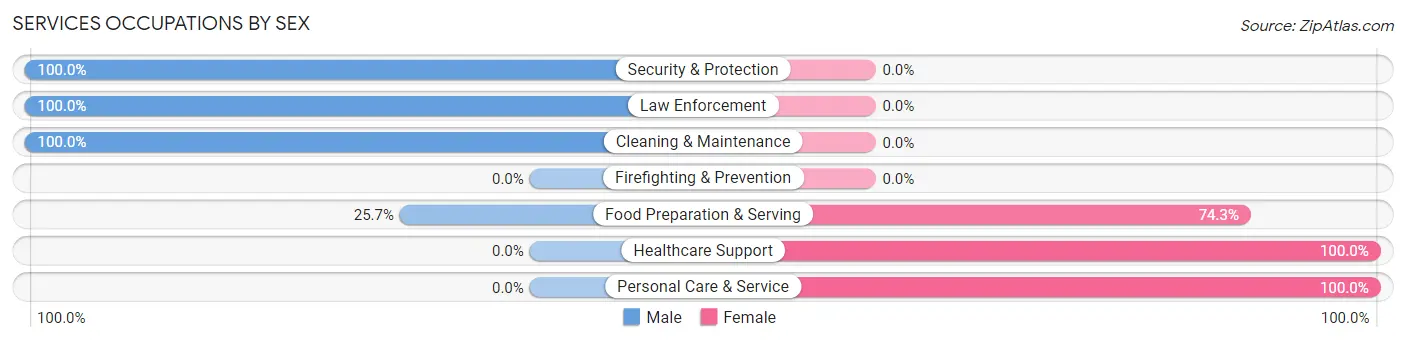
Services Occupations by Sex
Within the Services occupations in Gallatin, the most male-oriented occupations are Security & Protection (100.0%), Law Enforcement (100.0%), and Cleaning & Maintenance (100.0%), while the most female-oriented occupations are Healthcare Support (100.0%), Personal Care & Service (100.0%), and Food Preparation & Serving (74.3%).
| Occupation | Male | Female |
| Healthcare Support | 0 (0.0%) | 17 (100.0%) |
| Security & Protection | 18 (100.0%) | 0 (0.0%) |
| Firefighting & Prevention | 0 (0.0%) | 0 (0.0%) |
| Law Enforcement | 18 (100.0%) | 0 (0.0%) |
| Food Preparation & Serving | 9 (25.7%) | 26 (74.3%) |
| Cleaning & Maintenance | 24 (100.0%) | 0 (0.0%) |
| Personal Care & Service | 0 (0.0%) | 34 (100.0%) |
| Total (Category) | 51 (39.8%) | 77 (60.2%) |
| Total (Overall) | 344 (54.9%) | 283 (45.1%) |
Sales and Office Occupations
The most common Sales and Office occupations in Gallatin are Office & Administration (53 | 8.5%), and Sales & Related (43 | 6.9%).
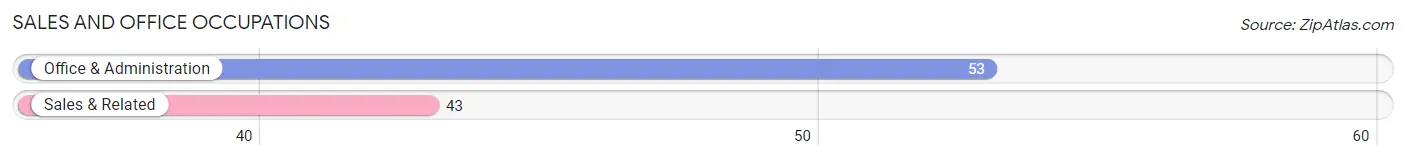
Sales and Office Occupations by Sex
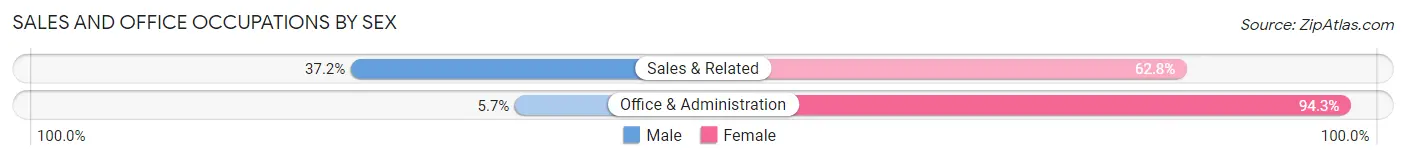
| Occupation | Male | Female |
| Sales & Related | 16 (37.2%) | 27 (62.8%) |
| Office & Administration | 3 (5.7%) | 50 (94.3%) |
| Total (Category) | 19 (19.8%) | 77 (80.2%) |
| Total (Overall) | 344 (54.9%) | 283 (45.1%) |
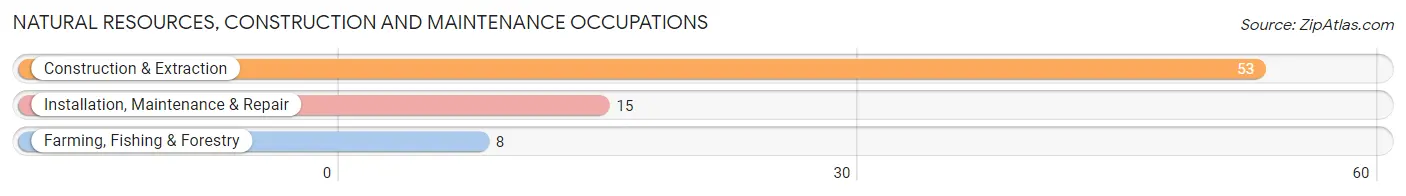
Natural Resources, Construction and Maintenance Occupations
The most common Natural Resources, Construction and Maintenance occupations in Gallatin are Construction & Extraction (53 | 8.5%), Installation, Maintenance & Repair (15 | 2.4%), and Farming, Fishing & Forestry (8 | 1.3%).
Natural Resources, Construction and Maintenance Occupations by Sex
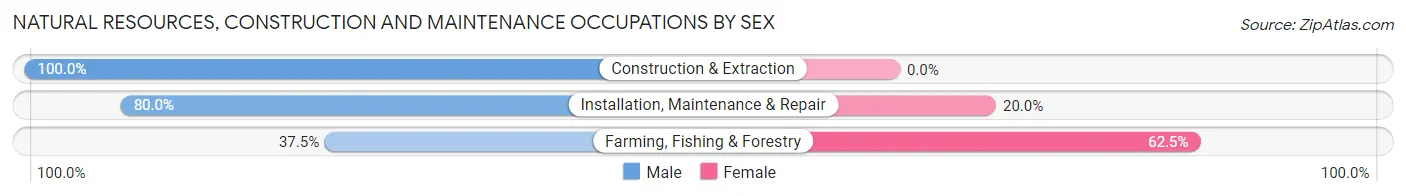
| Occupation | Male | Female |
| Farming, Fishing & Forestry | 3 (37.5%) | 5 (62.5%) |
| Construction & Extraction | 53 (100.0%) | 0 (0.0%) |
| Installation, Maintenance & Repair | 12 (80.0%) | 3 (20.0%) |
| Total (Category) | 68 (89.5%) | 8 (10.5%) |
| Total (Overall) | 344 (54.9%) | 283 (45.1%) |
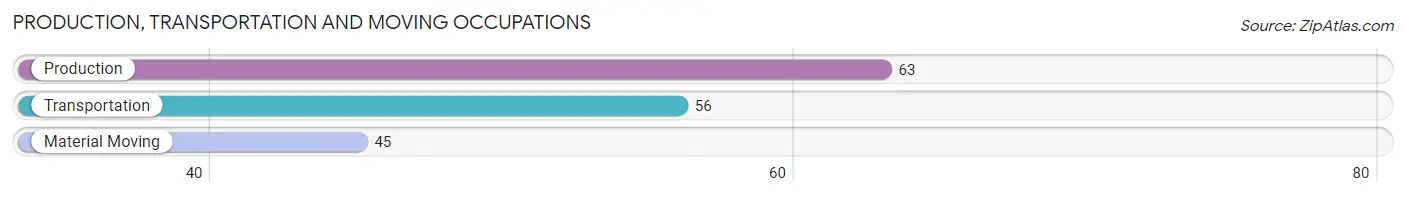
Production, Transportation and Moving Occupations
The most common Production, Transportation and Moving occupations in Gallatin are Production (63 | 10.1%), Transportation (56 | 8.9%), and Material Moving (45 | 7.2%).
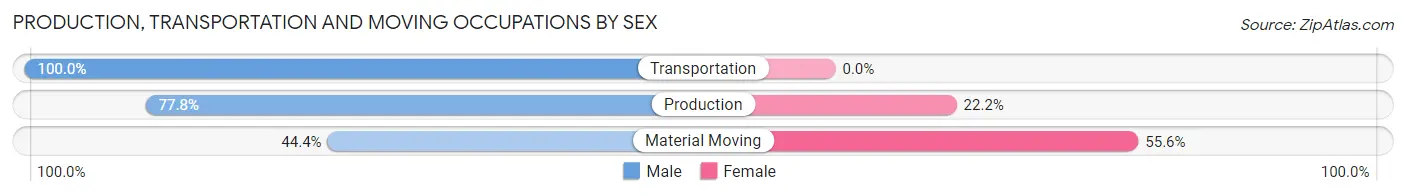
Production, Transportation and Moving Occupations by Sex
| Occupation | Male | Female |
| Production | 49 (77.8%) | 14 (22.2%) |
| Transportation | 56 (100.0%) | 0 (0.0%) |
| Material Moving | 20 (44.4%) | 25 (55.6%) |
| Total (Category) | 125 (76.2%) | 39 (23.8%) |
| Total (Overall) | 344 (54.9%) | 283 (45.1%) |
Employment Industries by Sex in Gallatin
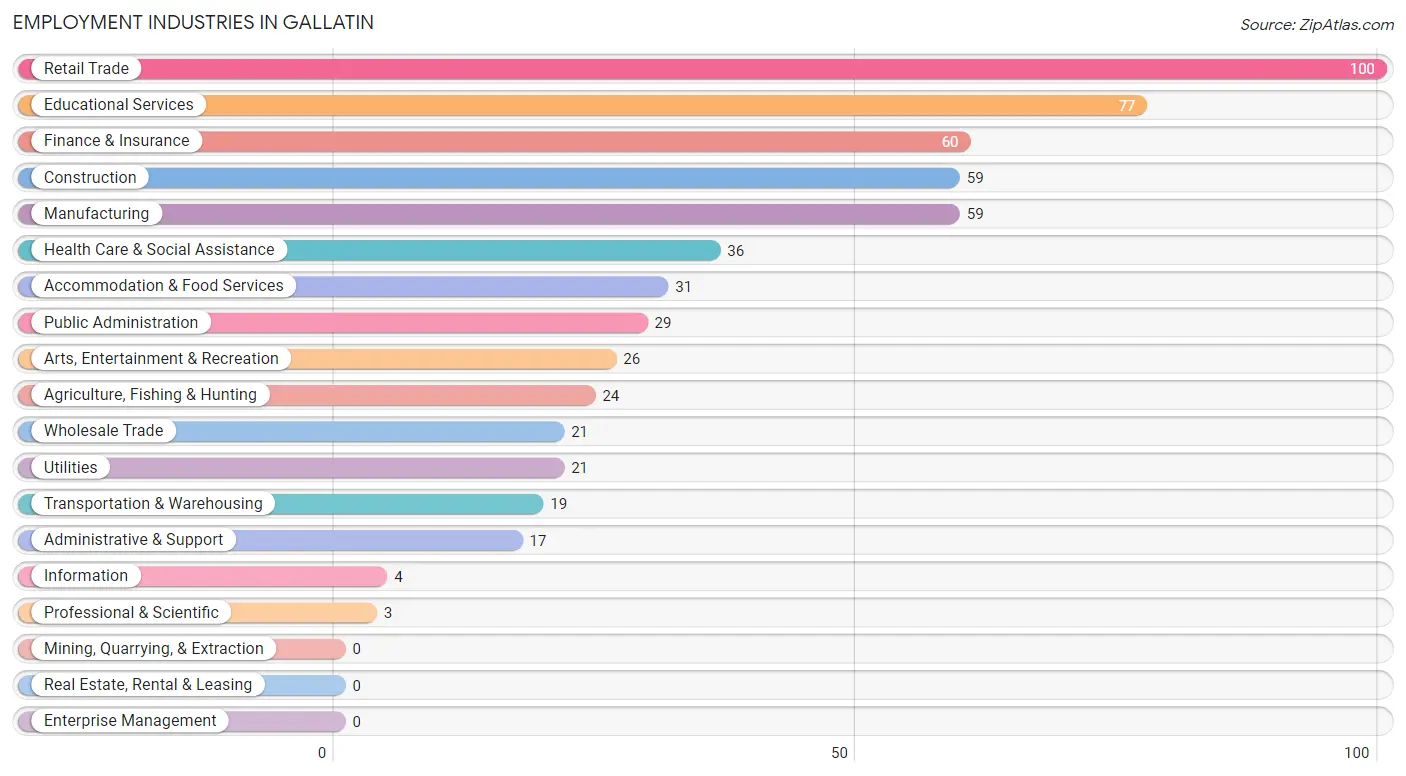
Employment Industries in Gallatin
The major employment industries in Gallatin include Retail Trade (100 | 16.0%), Educational Services (77 | 12.3%), Finance & Insurance (60 | 9.6%), Construction (59 | 9.4%), and Manufacturing (59 | 9.4%).
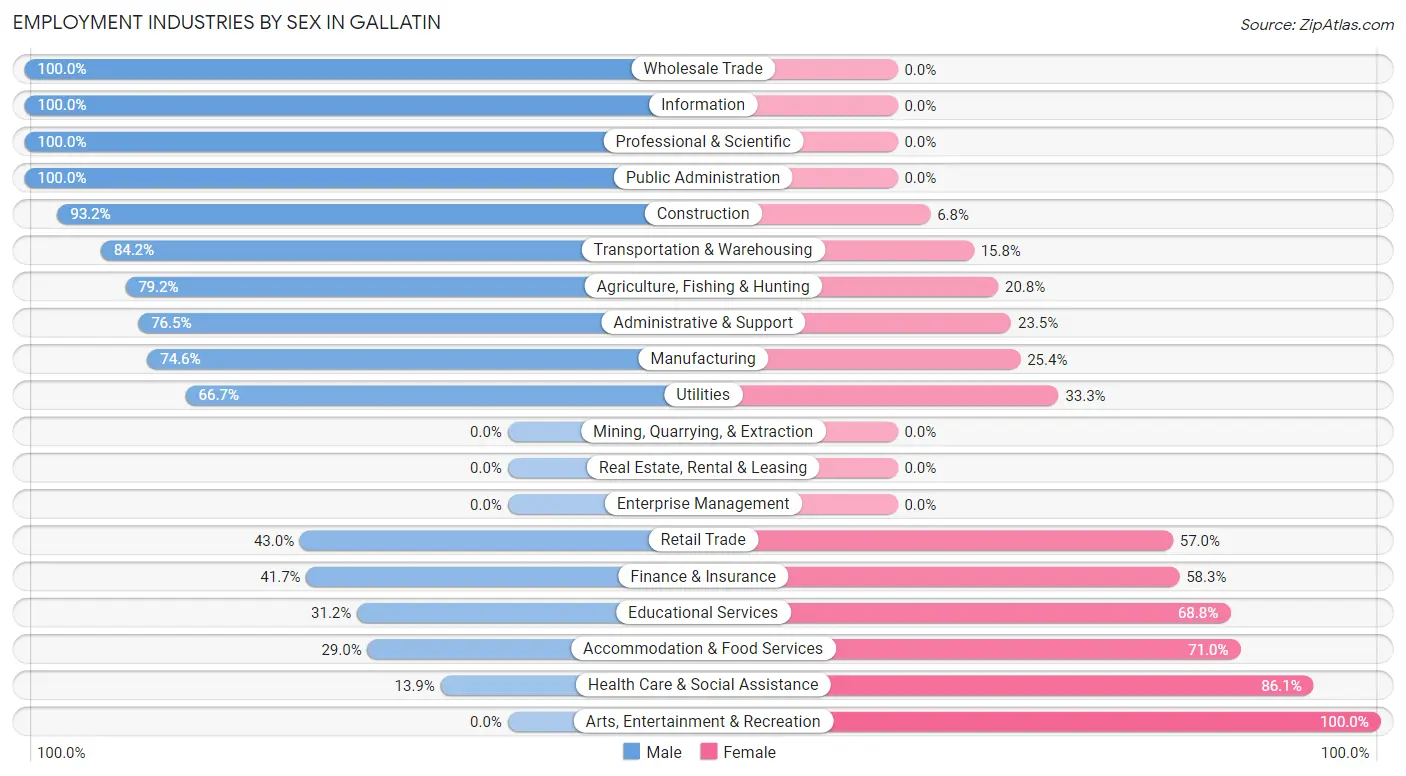
Employment Industries by Sex in Gallatin
The Gallatin industries that see more men than women are Wholesale Trade (100.0%), Information (100.0%), and Professional & Scientific (100.0%), whereas the industries that tend to have a higher number of women are Arts, Entertainment & Recreation (100.0%), Health Care & Social Assistance (86.1%), and Accommodation & Food Services (71.0%).
| Industry | Male | Female |
| Agriculture, Fishing & Hunting | 19 (79.2%) | 5 (20.8%) |
| Mining, Quarrying, & Extraction | 0 (0.0%) | 0 (0.0%) |
| Construction | 55 (93.2%) | 4 (6.8%) |
| Manufacturing | 44 (74.6%) | 15 (25.4%) |
| Wholesale Trade | 21 (100.0%) | 0 (0.0%) |
| Retail Trade | 43 (43.0%) | 57 (57.0%) |
| Transportation & Warehousing | 16 (84.2%) | 3 (15.8%) |
| Utilities | 14 (66.7%) | 7 (33.3%) |
| Information | 4 (100.0%) | 0 (0.0%) |
| Finance & Insurance | 25 (41.7%) | 35 (58.3%) |
| Real Estate, Rental & Leasing | 0 (0.0%) | 0 (0.0%) |
| Professional & Scientific | 3 (100.0%) | 0 (0.0%) |
| Enterprise Management | 0 (0.0%) | 0 (0.0%) |
| Administrative & Support | 13 (76.5%) | 4 (23.5%) |
| Educational Services | 24 (31.2%) | 53 (68.8%) |
| Health Care & Social Assistance | 5 (13.9%) | 31 (86.1%) |
| Arts, Entertainment & Recreation | 0 (0.0%) | 26 (100.0%) |
| Accommodation & Food Services | 9 (29.0%) | 22 (71.0%) |
| Public Administration | 29 (100.0%) | 0 (0.0%) |
| Total | 344 (54.9%) | 283 (45.1%) |
Education in Gallatin
School Enrollment in Gallatin
The most common levels of schooling among the 426 students in Gallatin are elementary school (137 | 32.2%), middle school (98 | 23.0%), and high school (59 | 13.9%).
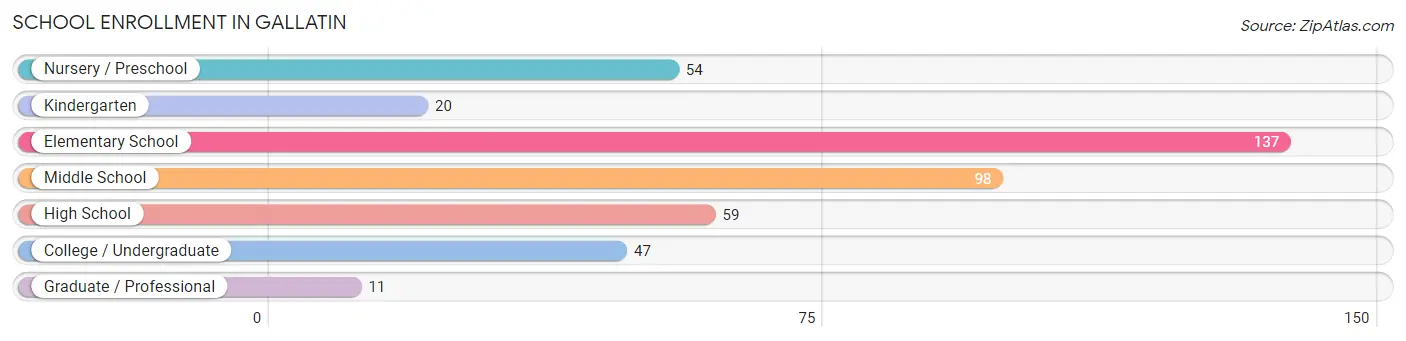
| School Level | # Students | % Students |
| Nursery / Preschool | 54 | 12.7% |
| Kindergarten | 20 | 4.7% |
| Elementary School | 137 | 32.2% |
| Middle School | 98 | 23.0% |
| High School | 59 | 13.9% |
| College / Undergraduate | 47 | 11.0% |
| Graduate / Professional | 11 | 2.6% |
| Total | 426 | 100.0% |
School Enrollment by Age by Funding Source in Gallatin
Out of a total of 426 students who are enrolled in schools in Gallatin, 89 (20.9%) attend a private institution, while the remaining 337 (79.1%) are enrolled in public schools. The age group of 20 to 24 year olds has the highest likelihood of being enrolled in private schools, with 23 (100.0% in the age bracket) enrolled. Conversely, the age group of 18 to 19 year olds has the lowest likelihood of being enrolled in a private school, with 5 (100.0% in the age bracket) attending a public institution.
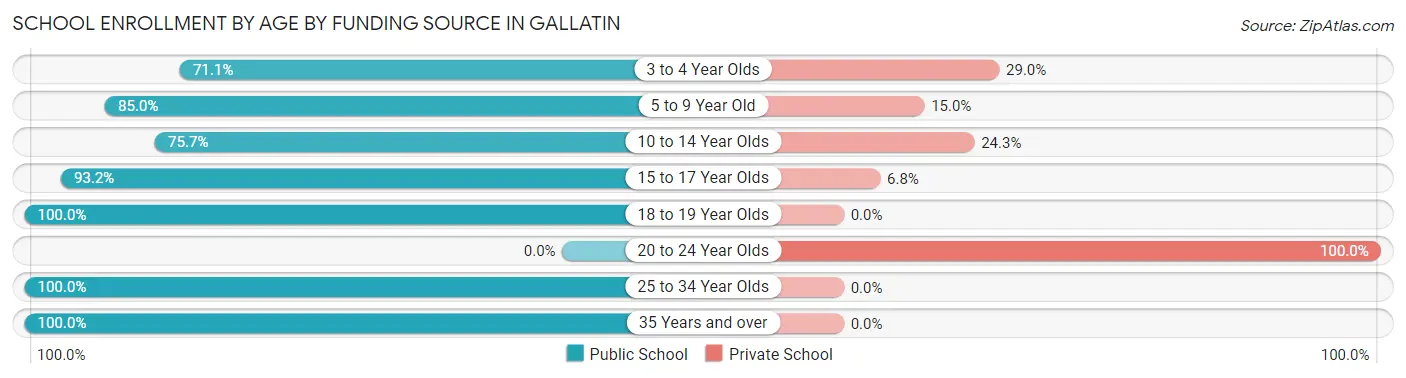
| Age Bracket | Public School | Private School |
| 3 to 4 Year Olds | 27 (71.1%) | 11 (28.9%) |
| 5 to 9 Year Old | 136 (85.0%) | 24 (15.0%) |
| 10 to 14 Year Olds | 84 (75.7%) | 27 (24.3%) |
| 15 to 17 Year Olds | 55 (93.2%) | 4 (6.8%) |
| 18 to 19 Year Olds | 5 (100.0%) | 0 (0.0%) |
| 20 to 24 Year Olds | 0 (0.0%) | 23 (100.0%) |
| 25 to 34 Year Olds | 10 (100.0%) | 0 (0.0%) |
| 35 Years and over | 20 (100.0%) | 0 (0.0%) |
| Total | 337 (79.1%) | 89 (20.9%) |
Educational Attainment by Field of Study in Gallatin
Bio, nature & agricultural (71 | 30.5%), education (68 | 29.2%), science & technology (22 | 9.4%), business (20 | 8.6%), and literature & languages (14 | 6.0%) are the most common fields of study among 233 individuals in Gallatin who have obtained a bachelor's degree or higher.
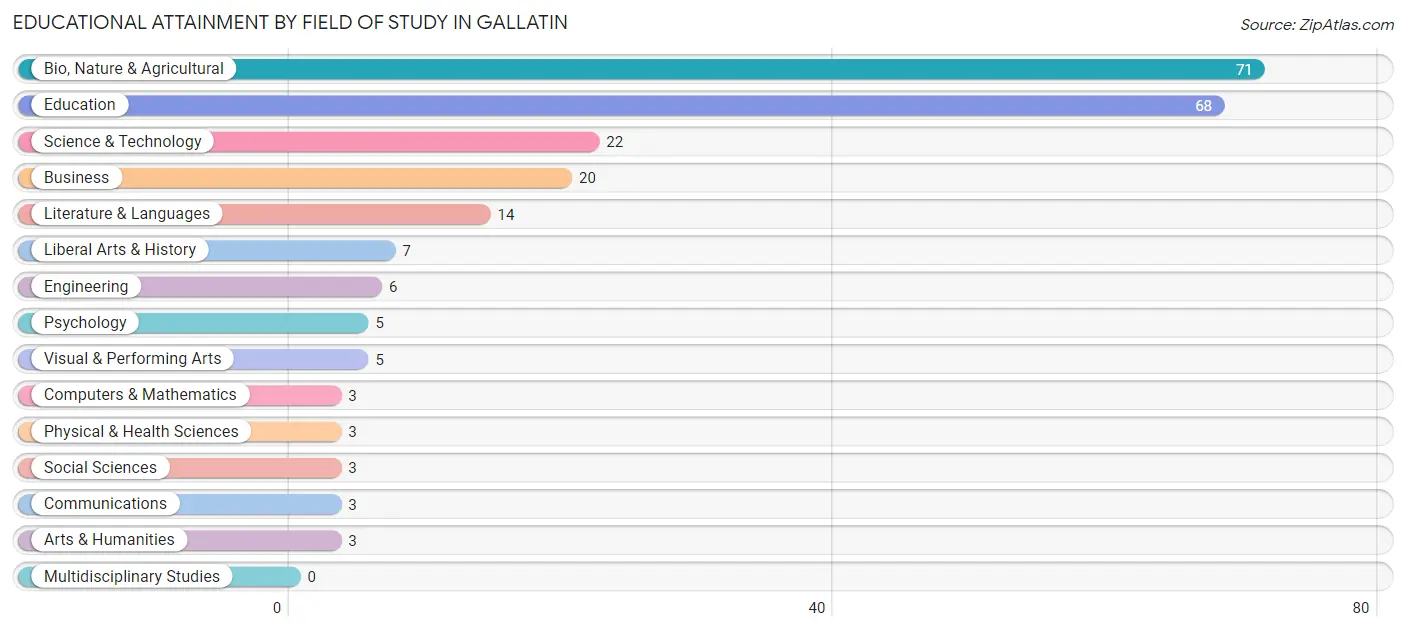
| Field of Study | # Graduates | % Graduates |
| Computers & Mathematics | 3 | 1.3% |
| Bio, Nature & Agricultural | 71 | 30.5% |
| Physical & Health Sciences | 3 | 1.3% |
| Psychology | 5 | 2.1% |
| Social Sciences | 3 | 1.3% |
| Engineering | 6 | 2.6% |
| Multidisciplinary Studies | 0 | 0.0% |
| Science & Technology | 22 | 9.4% |
| Business | 20 | 8.6% |
| Education | 68 | 29.2% |
| Literature & Languages | 14 | 6.0% |
| Liberal Arts & History | 7 | 3.0% |
| Visual & Performing Arts | 5 | 2.1% |
| Communications | 3 | 1.3% |
| Arts & Humanities | 3 | 1.3% |
| Total | 233 | 100.0% |
Transportation & Commute in Gallatin
Vehicle Availability by Sex in Gallatin
The most prevalent vehicle ownership categories in Gallatin are males with 2 vehicles (117, accounting for 33.2%) and females with 2 vehicles (93, making up 42.4%).
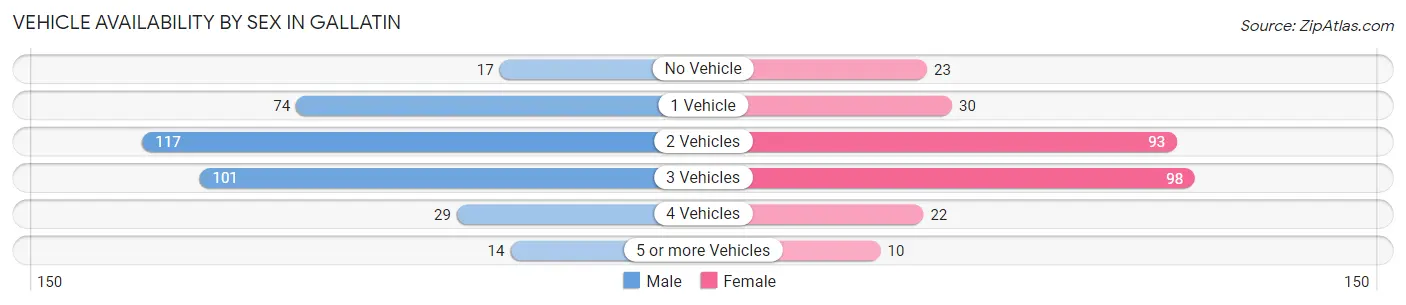
| Vehicles Available | Male | Female |
| No Vehicle | 17 (4.8%) | 23 (8.3%) |
| 1 Vehicle | 74 (21.0%) | 30 (10.9%) |
| 2 Vehicles | 117 (33.2%) | 93 (33.7%) |
| 3 Vehicles | 101 (28.7%) | 98 (35.5%) |
| 4 Vehicles | 29 (8.2%) | 22 (8.0%) |
| 5 or more Vehicles | 14 (4.0%) | 10 (3.6%) |
| Total | 352 (100.0%) | 276 (100.0%) |
Commute Time in Gallatin
The most frequently occuring commute durations in Gallatin are 5 to 9 minutes (109 commuters, 18.0%), 60 to 89 minutes (82 commuters, 13.6%), and less than 5 minutes (74 commuters, 12.2%).
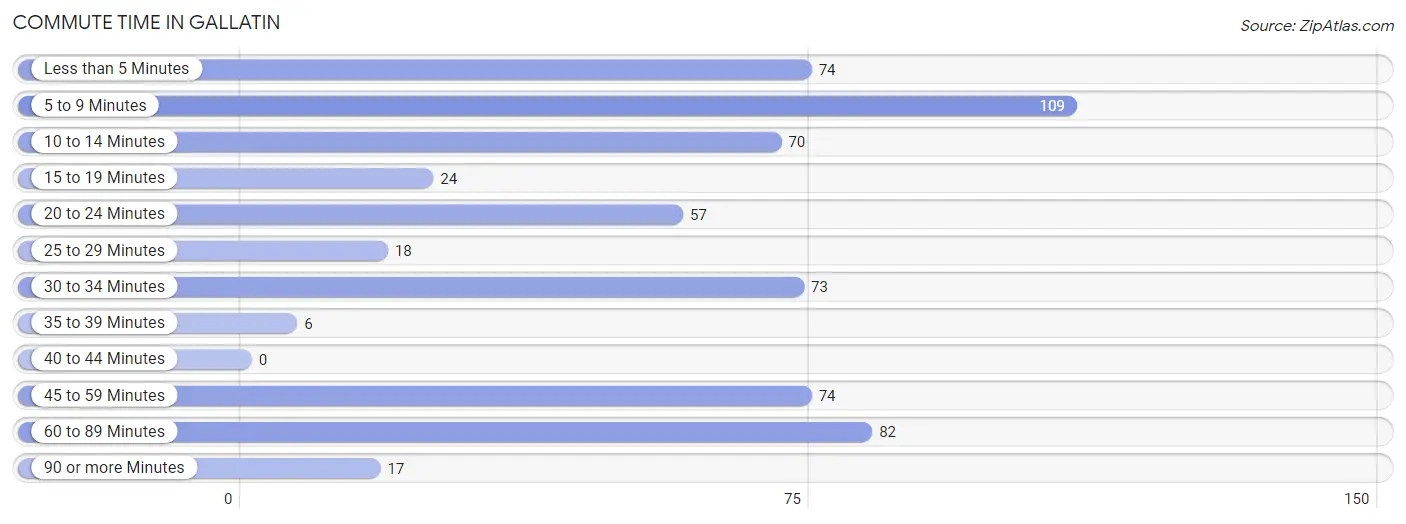
| Commute Time | # Commuters | % Commuters |
| Less than 5 Minutes | 74 | 12.2% |
| 5 to 9 Minutes | 109 | 18.0% |
| 10 to 14 Minutes | 70 | 11.6% |
| 15 to 19 Minutes | 24 | 4.0% |
| 20 to 24 Minutes | 57 | 9.4% |
| 25 to 29 Minutes | 18 | 3.0% |
| 30 to 34 Minutes | 73 | 12.1% |
| 35 to 39 Minutes | 6 | 1.0% |
| 40 to 44 Minutes | 0 | 0.0% |
| 45 to 59 Minutes | 74 | 12.2% |
| 60 to 89 Minutes | 82 | 13.6% |
| 90 or more Minutes | 17 | 2.8% |
Commute Time by Sex in Gallatin
The most common commute times in Gallatin are 5 to 9 minutes (57 commuters, 16.9%) for males and 5 to 9 minutes (52 commuters, 19.5%) for females.
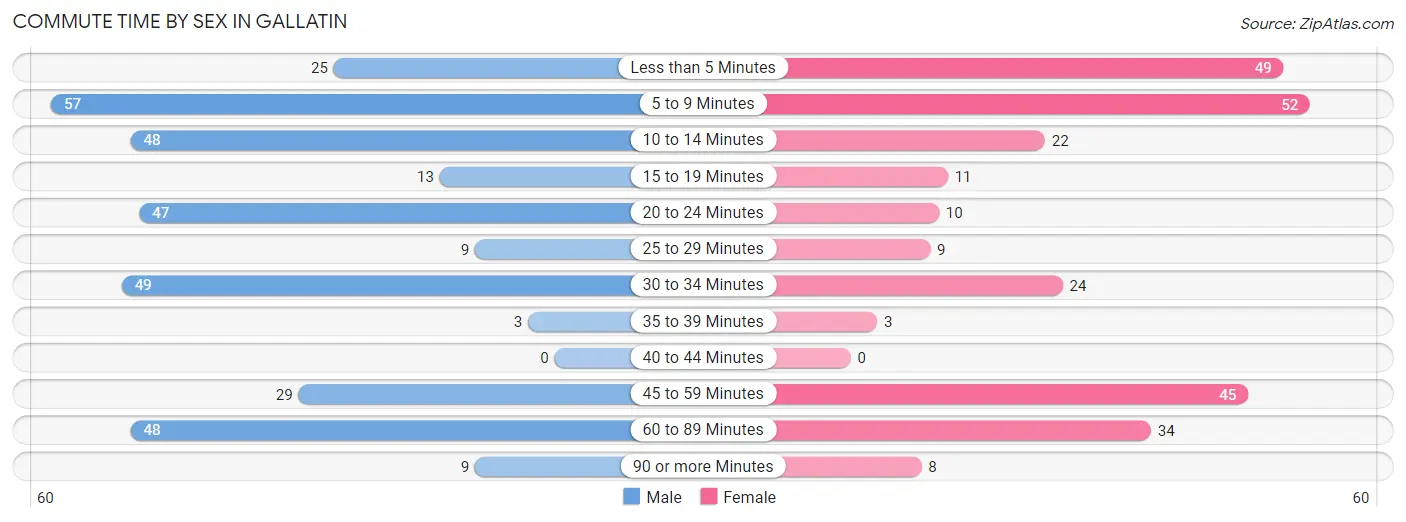
| Commute Time | Male | Female |
| Less than 5 Minutes | 25 (7.4%) | 49 (18.3%) |
| 5 to 9 Minutes | 57 (16.9%) | 52 (19.5%) |
| 10 to 14 Minutes | 48 (14.2%) | 22 (8.2%) |
| 15 to 19 Minutes | 13 (3.9%) | 11 (4.1%) |
| 20 to 24 Minutes | 47 (14.0%) | 10 (3.7%) |
| 25 to 29 Minutes | 9 (2.7%) | 9 (3.4%) |
| 30 to 34 Minutes | 49 (14.5%) | 24 (9.0%) |
| 35 to 39 Minutes | 3 (0.9%) | 3 (1.1%) |
| 40 to 44 Minutes | 0 (0.0%) | 0 (0.0%) |
| 45 to 59 Minutes | 29 (8.6%) | 45 (16.9%) |
| 60 to 89 Minutes | 48 (14.2%) | 34 (12.7%) |
| 90 or more Minutes | 9 (2.7%) | 8 (3.0%) |
Time of Departure to Work by Sex in Gallatin
The most frequent times of departure to work in Gallatin are 7:30 AM to 7:59 AM (49, 14.5%) for males and 7:00 AM to 7:29 AM (106, 39.7%) for females.
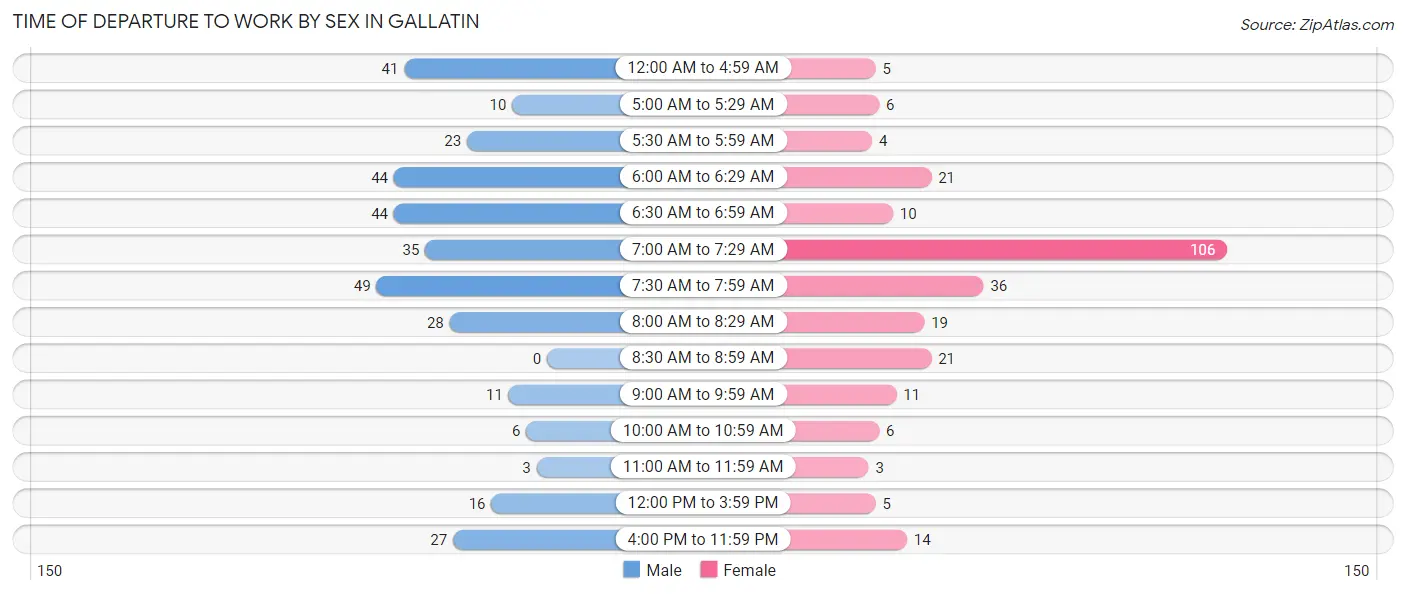
| Time of Departure | Male | Female |
| 12:00 AM to 4:59 AM | 41 (12.2%) | 5 (1.9%) |
| 5:00 AM to 5:29 AM | 10 (3.0%) | 6 (2.2%) |
| 5:30 AM to 5:59 AM | 23 (6.8%) | 4 (1.5%) |
| 6:00 AM to 6:29 AM | 44 (13.1%) | 21 (7.9%) |
| 6:30 AM to 6:59 AM | 44 (13.1%) | 10 (3.7%) |
| 7:00 AM to 7:29 AM | 35 (10.4%) | 106 (39.7%) |
| 7:30 AM to 7:59 AM | 49 (14.5%) | 36 (13.5%) |
| 8:00 AM to 8:29 AM | 28 (8.3%) | 19 (7.1%) |
| 8:30 AM to 8:59 AM | 0 (0.0%) | 21 (7.9%) |
| 9:00 AM to 9:59 AM | 11 (3.3%) | 11 (4.1%) |
| 10:00 AM to 10:59 AM | 6 (1.8%) | 6 (2.2%) |
| 11:00 AM to 11:59 AM | 3 (0.9%) | 3 (1.1%) |
| 12:00 PM to 3:59 PM | 16 (4.8%) | 5 (1.9%) |
| 4:00 PM to 11:59 PM | 27 (8.0%) | 14 (5.2%) |
| Total | 337 (100.0%) | 267 (100.0%) |
Housing Occupancy in Gallatin
Occupancy by Ownership in Gallatin
Of the total 710 dwellings in Gallatin, owner-occupied units account for 418 (58.9%), while renter-occupied units make up 292 (41.1%).
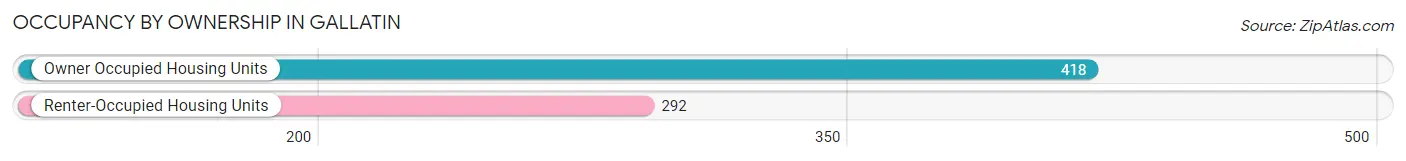
| Occupancy | # Housing Units | % Housing Units |
| Owner Occupied Housing Units | 418 | 58.9% |
| Renter-Occupied Housing Units | 292 | 41.1% |
| Total Occupied Housing Units | 710 | 100.0% |
Occupancy by Household Size in Gallatin
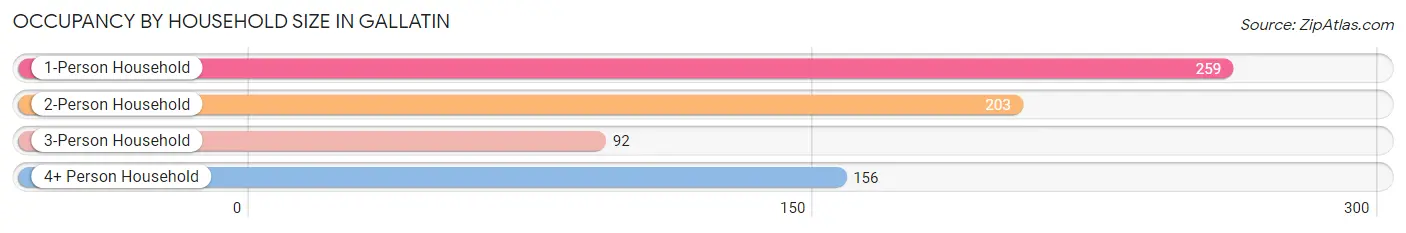
| Household Size | # Housing Units | % Housing Units |
| 1-Person Household | 259 | 36.5% |
| 2-Person Household | 203 | 28.6% |
| 3-Person Household | 92 | 13.0% |
| 4+ Person Household | 156 | 22.0% |
| Total Housing Units | 710 | 100.0% |
Occupancy by Ownership by Household Size in Gallatin
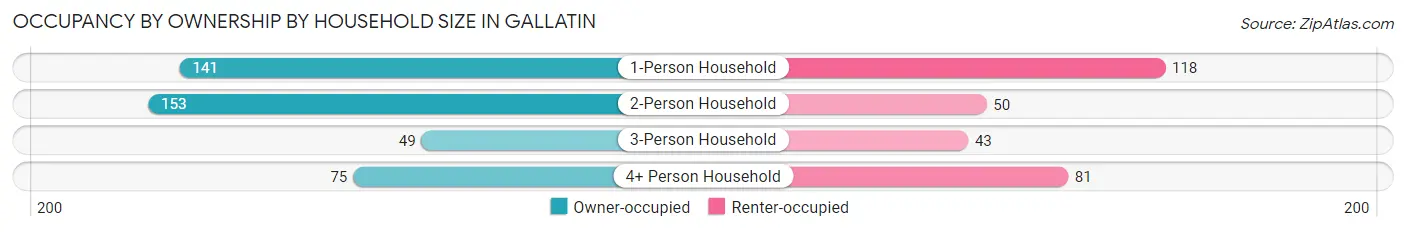
| Household Size | Owner-occupied | Renter-occupied |
| 1-Person Household | 141 (54.4%) | 118 (45.6%) |
| 2-Person Household | 153 (75.4%) | 50 (24.6%) |
| 3-Person Household | 49 (53.3%) | 43 (46.7%) |
| 4+ Person Household | 75 (48.1%) | 81 (51.9%) |
| Total Housing Units | 418 (58.9%) | 292 (41.1%) |
Occupancy by Educational Attainment in Gallatin
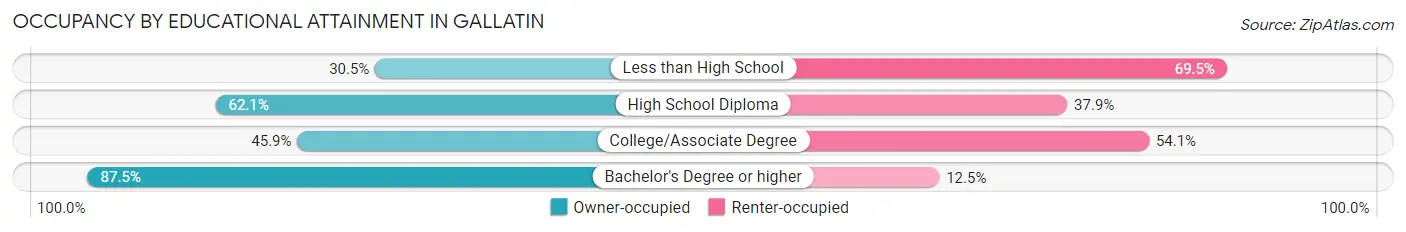
| Household Size | Owner-occupied | Renter-occupied |
| Less than High School | 25 (30.5%) | 57 (69.5%) |
| High School Diploma | 146 (62.1%) | 89 (37.9%) |
| College/Associate Degree | 107 (45.9%) | 126 (54.1%) |
| Bachelor's Degree or higher | 140 (87.5%) | 20 (12.5%) |
Occupancy by Age of Householder in Gallatin
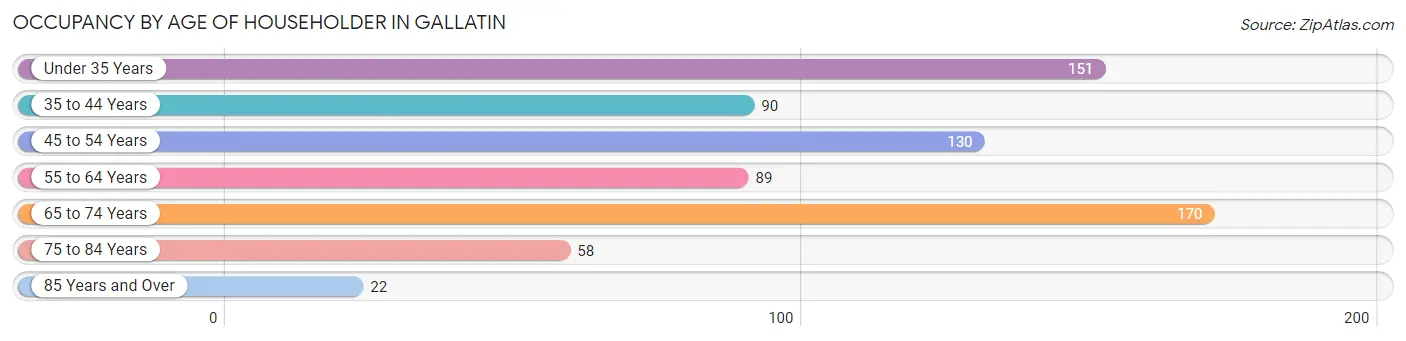
| Age Bracket | # Households | % Households |
| Under 35 Years | 151 | 21.3% |
| 35 to 44 Years | 90 | 12.7% |
| 45 to 54 Years | 130 | 18.3% |
| 55 to 64 Years | 89 | 12.5% |
| 65 to 74 Years | 170 | 23.9% |
| 75 to 84 Years | 58 | 8.2% |
| 85 Years and Over | 22 | 3.1% |
| Total | 710 | 100.0% |
Housing Finances in Gallatin
Median Income by Occupancy in Gallatin
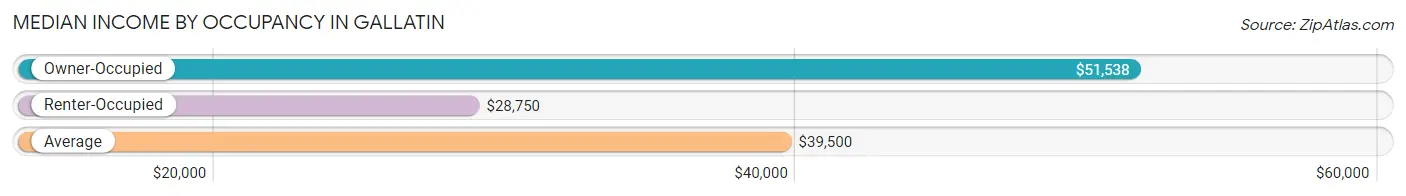
| Occupancy Type | # Households | Median Income |
| Owner-Occupied | 418 (58.9%) | $51,538 |
| Renter-Occupied | 292 (41.1%) | $28,750 |
| Average | 710 (100.0%) | $39,500 |
Occupancy by Householder Income Bracket in Gallatin
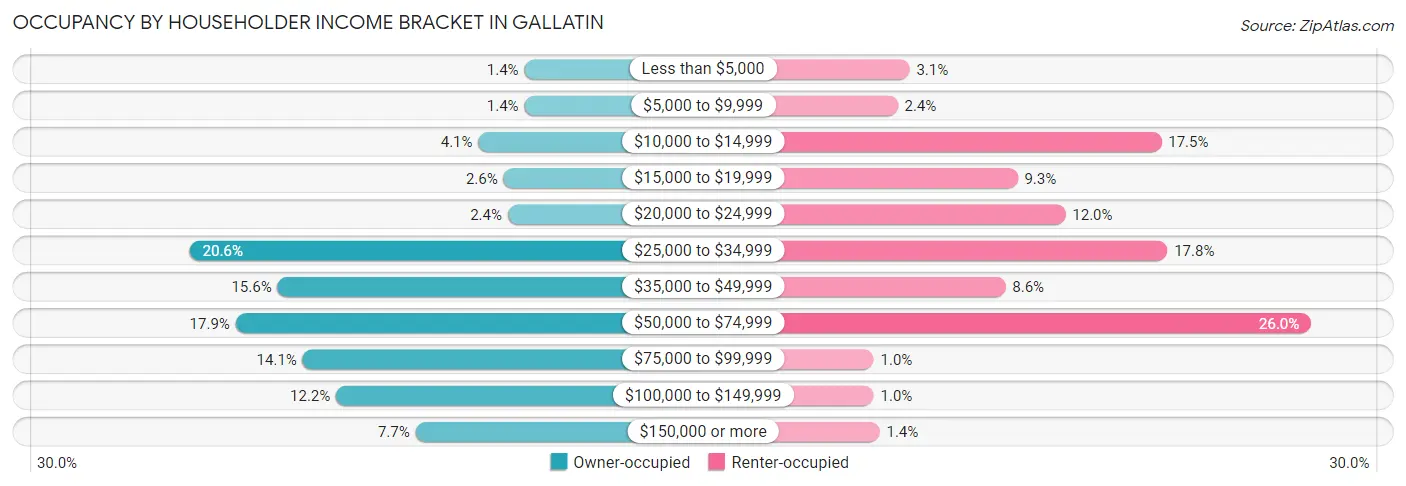
| Income Bracket | Owner-occupied | Renter-occupied |
| Less than $5,000 | 6 (1.4%) | 9 (3.1%) |
| $5,000 to $9,999 | 6 (1.4%) | 7 (2.4%) |
| $10,000 to $14,999 | 17 (4.1%) | 51 (17.5%) |
| $15,000 to $19,999 | 11 (2.6%) | 27 (9.2%) |
| $20,000 to $24,999 | 10 (2.4%) | 35 (12.0%) |
| $25,000 to $34,999 | 86 (20.6%) | 52 (17.8%) |
| $35,000 to $49,999 | 65 (15.5%) | 25 (8.6%) |
| $50,000 to $74,999 | 75 (17.9%) | 76 (26.0%) |
| $75,000 to $99,999 | 59 (14.1%) | 3 (1.0%) |
| $100,000 to $149,999 | 51 (12.2%) | 3 (1.0%) |
| $150,000 or more | 32 (7.7%) | 4 (1.4%) |
| Total | 418 (100.0%) | 292 (100.0%) |
Monthly Housing Cost Tiers in Gallatin
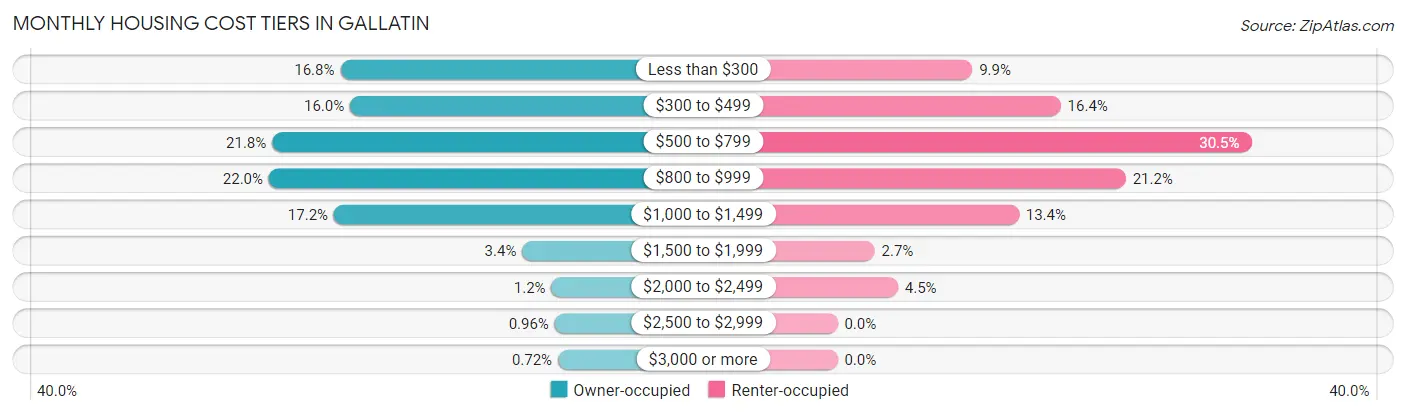
| Monthly Cost | Owner-occupied | Renter-occupied |
| Less than $300 | 70 (16.8%) | 29 (9.9%) |
| $300 to $499 | 67 (16.0%) | 48 (16.4%) |
| $500 to $799 | 91 (21.8%) | 89 (30.5%) |
| $800 to $999 | 92 (22.0%) | 62 (21.2%) |
| $1,000 to $1,499 | 72 (17.2%) | 39 (13.4%) |
| $1,500 to $1,999 | 14 (3.4%) | 8 (2.7%) |
| $2,000 to $2,499 | 5 (1.2%) | 13 (4.4%) |
| $2,500 to $2,999 | 4 (1.0%) | 0 (0.0%) |
| $3,000 or more | 3 (0.7%) | 0 (0.0%) |
| Total | 418 (100.0%) | 292 (100.0%) |
Physical Housing Characteristics in Gallatin
Housing Structures in Gallatin
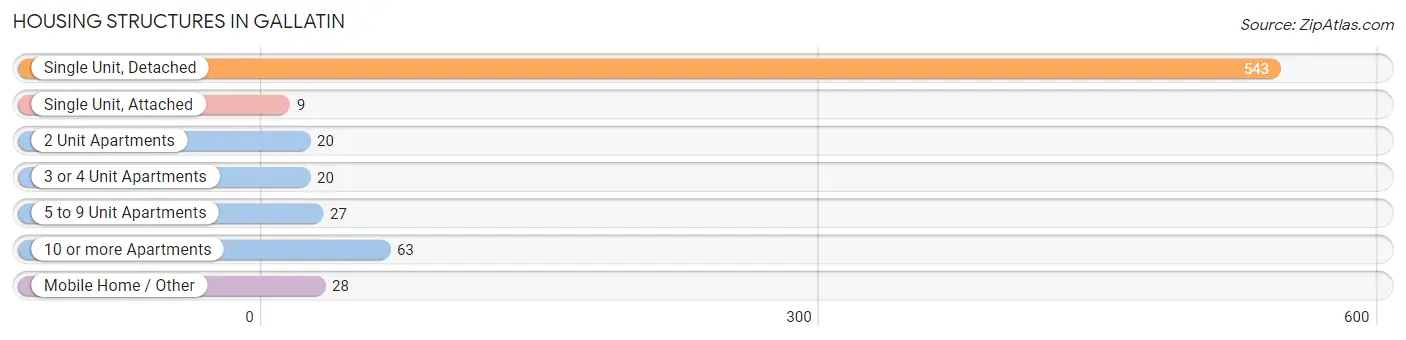
| Structure Type | # Housing Units | % Housing Units |
| Single Unit, Detached | 543 | 76.5% |
| Single Unit, Attached | 9 | 1.3% |
| 2 Unit Apartments | 20 | 2.8% |
| 3 or 4 Unit Apartments | 20 | 2.8% |
| 5 to 9 Unit Apartments | 27 | 3.8% |
| 10 or more Apartments | 63 | 8.9% |
| Mobile Home / Other | 28 | 3.9% |
| Total | 710 | 100.0% |
Housing Structures by Occupancy in Gallatin
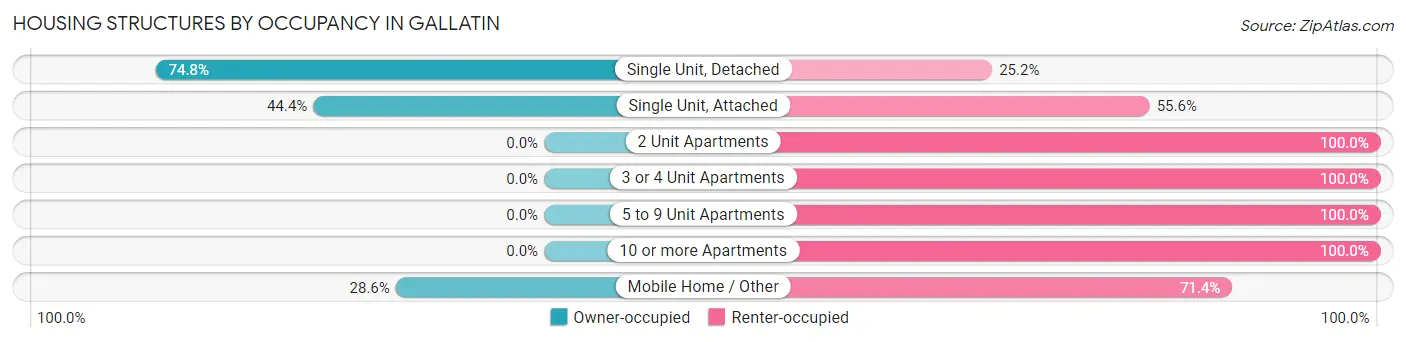
| Structure Type | Owner-occupied | Renter-occupied |
| Single Unit, Detached | 406 (74.8%) | 137 (25.2%) |
| Single Unit, Attached | 4 (44.4%) | 5 (55.6%) |
| 2 Unit Apartments | 0 (0.0%) | 20 (100.0%) |
| 3 or 4 Unit Apartments | 0 (0.0%) | 20 (100.0%) |
| 5 to 9 Unit Apartments | 0 (0.0%) | 27 (100.0%) |
| 10 or more Apartments | 0 (0.0%) | 63 (100.0%) |
| Mobile Home / Other | 8 (28.6%) | 20 (71.4%) |
| Total | 418 (58.9%) | 292 (41.1%) |
Housing Structures by Number of Rooms in Gallatin
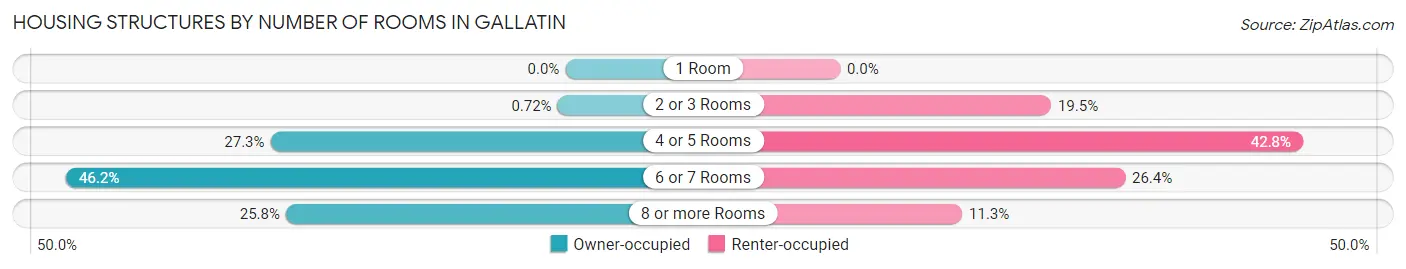
| Number of Rooms | Owner-occupied | Renter-occupied |
| 1 Room | 0 (0.0%) | 0 (0.0%) |
| 2 or 3 Rooms | 3 (0.7%) | 57 (19.5%) |
| 4 or 5 Rooms | 114 (27.3%) | 125 (42.8%) |
| 6 or 7 Rooms | 193 (46.2%) | 77 (26.4%) |
| 8 or more Rooms | 108 (25.8%) | 33 (11.3%) |
| Total | 418 (100.0%) | 292 (100.0%) |
Housing Structure by Heating Type in Gallatin
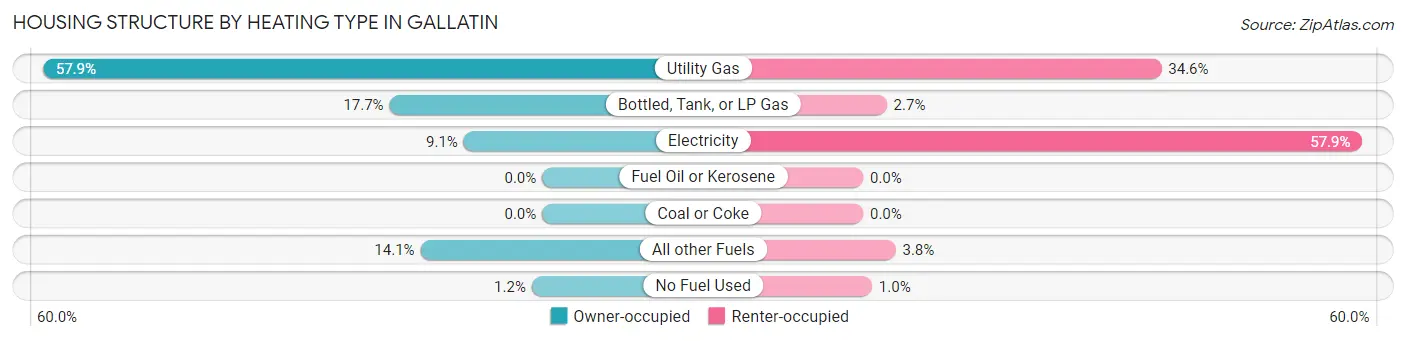
| Heating Type | Owner-occupied | Renter-occupied |
| Utility Gas | 242 (57.9%) | 101 (34.6%) |
| Bottled, Tank, or LP Gas | 74 (17.7%) | 8 (2.7%) |
| Electricity | 38 (9.1%) | 169 (57.9%) |
| Fuel Oil or Kerosene | 0 (0.0%) | 0 (0.0%) |
| Coal or Coke | 0 (0.0%) | 0 (0.0%) |
| All other Fuels | 59 (14.1%) | 11 (3.8%) |
| No Fuel Used | 5 (1.2%) | 3 (1.0%) |
| Total | 418 (100.0%) | 292 (100.0%) |
Household Vehicle Usage in Gallatin
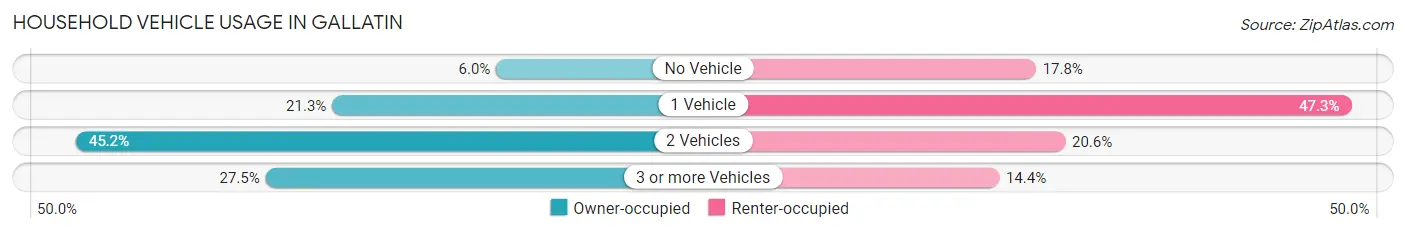
| Vehicles per Household | Owner-occupied | Renter-occupied |
| No Vehicle | 25 (6.0%) | 52 (17.8%) |
| 1 Vehicle | 89 (21.3%) | 138 (47.3%) |
| 2 Vehicles | 189 (45.2%) | 60 (20.5%) |
| 3 or more Vehicles | 115 (27.5%) | 42 (14.4%) |
| Total | 418 (100.0%) | 292 (100.0%) |
Real Estate & Mortgages in Gallatin
Real Estate and Mortgage Overview in Gallatin
| Characteristic | Without Mortgage | With Mortgage |
| Housing Units | 234 | 184 |
| Median Property Value | $128,800 | $105,900 |
| Median Household Income | $45,000 | $6 |
| Monthly Housing Costs | $441 | $3 |
| Real Estate Taxes | $599 | $0 |
Property Value by Mortgage Status in Gallatin
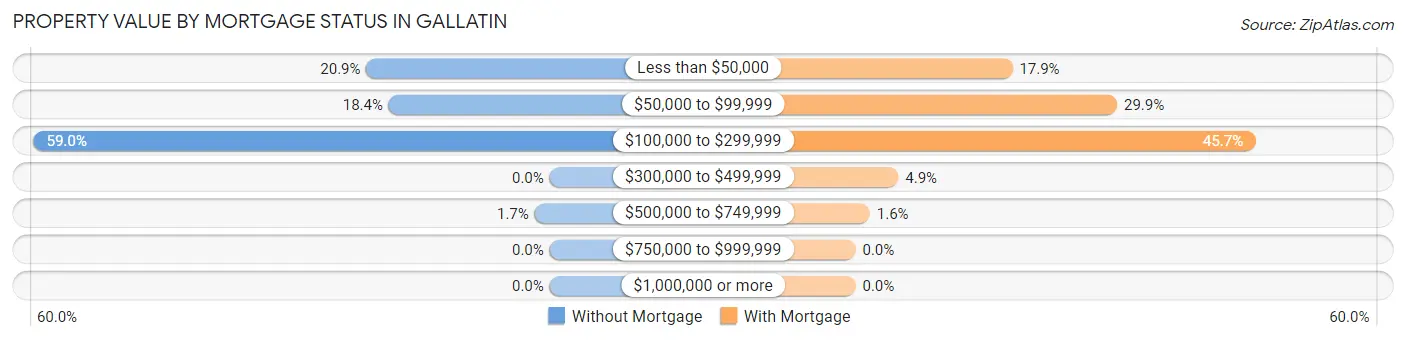
| Property Value | Without Mortgage | With Mortgage |
| Less than $50,000 | 49 (20.9%) | 33 (17.9%) |
| $50,000 to $99,999 | 43 (18.4%) | 55 (29.9%) |
| $100,000 to $299,999 | 138 (59.0%) | 84 (45.7%) |
| $300,000 to $499,999 | 0 (0.0%) | 9 (4.9%) |
| $500,000 to $749,999 | 4 (1.7%) | 3 (1.6%) |
| $750,000 to $999,999 | 0 (0.0%) | 0 (0.0%) |
| $1,000,000 or more | 0 (0.0%) | 0 (0.0%) |
| Total | 234 (100.0%) | 184 (100.0%) |
Household Income by Mortgage Status in Gallatin
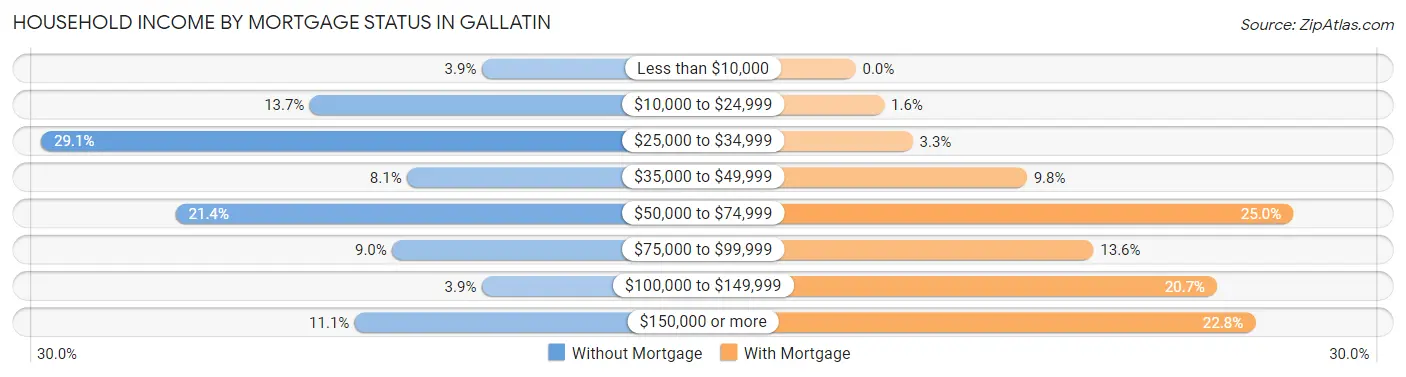
| Household Income | Without Mortgage | With Mortgage |
| Less than $10,000 | 9 (3.8%) | 0 (0.0%) |
| $10,000 to $24,999 | 32 (13.7%) | 3 (1.6%) |
| $25,000 to $34,999 | 68 (29.1%) | 6 (3.3%) |
| $35,000 to $49,999 | 19 (8.1%) | 18 (9.8%) |
| $50,000 to $74,999 | 50 (21.4%) | 46 (25.0%) |
| $75,000 to $99,999 | 21 (9.0%) | 25 (13.6%) |
| $100,000 to $149,999 | 9 (3.8%) | 38 (20.6%) |
| $150,000 or more | 26 (11.1%) | 42 (22.8%) |
| Total | 234 (100.0%) | 184 (100.0%) |
Property Value to Household Income Ratio in Gallatin
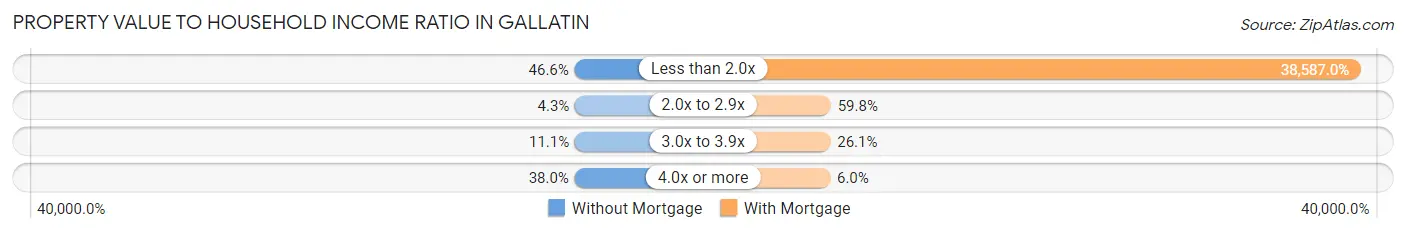
| Value-to-Income Ratio | Without Mortgage | With Mortgage |
| Less than 2.0x | 109 (46.6%) | 71,000 (38,587.0%) |
| 2.0x to 2.9x | 10 (4.3%) | 110 (59.8%) |
| 3.0x to 3.9x | 26 (11.1%) | 48 (26.1%) |
| 4.0x or more | 89 (38.0%) | 11 (6.0%) |
| Total | 234 (100.0%) | 184 (100.0%) |
Real Estate Taxes by Mortgage Status in Gallatin
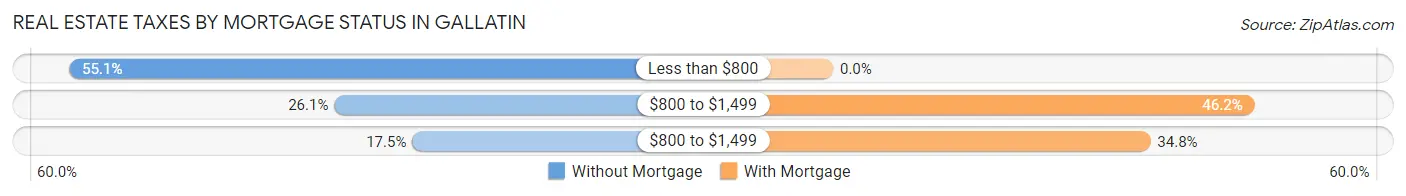
| Property Taxes | Without Mortgage | With Mortgage |
| Less than $800 | 129 (55.1%) | 0 (0.0%) |
| $800 to $1,499 | 61 (26.1%) | 85 (46.2%) |
| $800 to $1,499 | 41 (17.5%) | 64 (34.8%) |
| Total | 234 (100.0%) | 184 (100.0%) |
Health & Disability in Gallatin
Health Insurance Coverage by Age in Gallatin
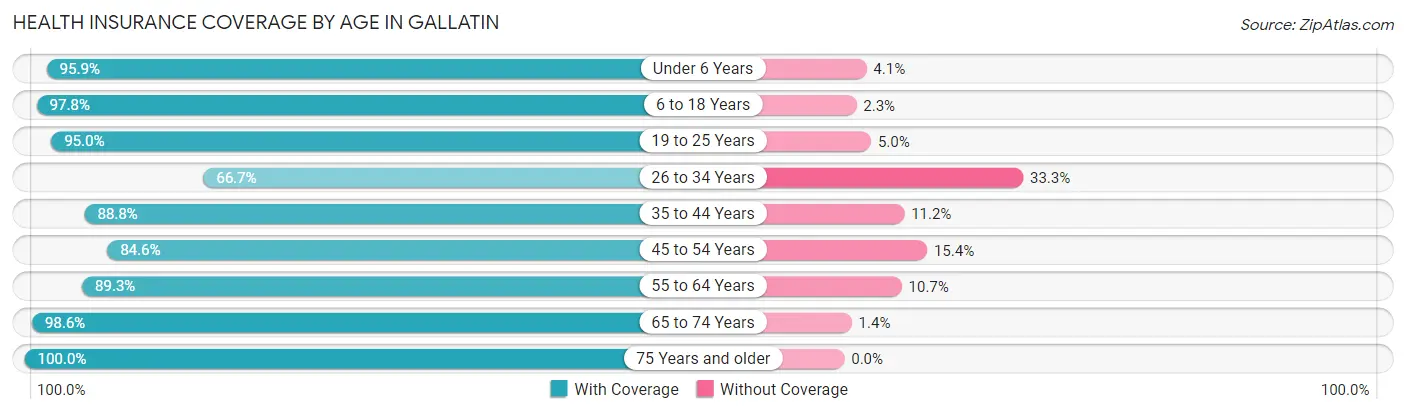
| Age Bracket | With Coverage | Without Coverage |
| Under 6 Years | 186 (95.9%) | 8 (4.1%) |
| 6 to 18 Years | 304 (97.8%) | 7 (2.2%) |
| 19 to 25 Years | 153 (95.0%) | 8 (5.0%) |
| 26 to 34 Years | 116 (66.7%) | 58 (33.3%) |
| 35 to 44 Years | 159 (88.8%) | 20 (11.2%) |
| 45 to 54 Years | 170 (84.6%) | 31 (15.4%) |
| 55 to 64 Years | 142 (89.3%) | 17 (10.7%) |
| 65 to 74 Years | 216 (98.6%) | 3 (1.4%) |
| 75 Years and older | 105 (100.0%) | 0 (0.0%) |
| Total | 1,551 (91.1%) | 152 (8.9%) |
Health Insurance Coverage by Citizenship Status in Gallatin
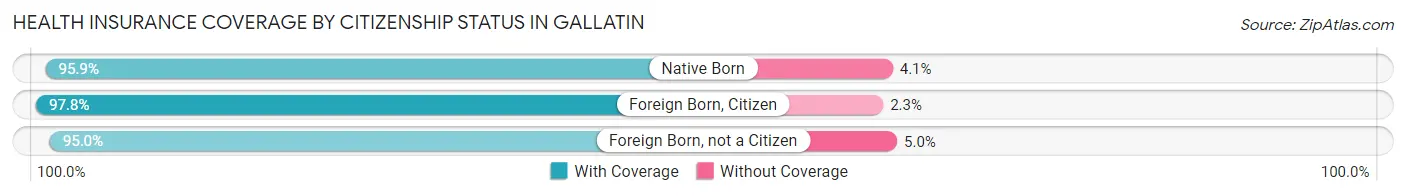
| Citizenship Status | With Coverage | Without Coverage |
| Native Born | 186 (95.9%) | 8 (4.1%) |
| Foreign Born, Citizen | 304 (97.8%) | 7 (2.2%) |
| Foreign Born, not a Citizen | 153 (95.0%) | 8 (5.0%) |
Health Insurance Coverage by Household Income in Gallatin
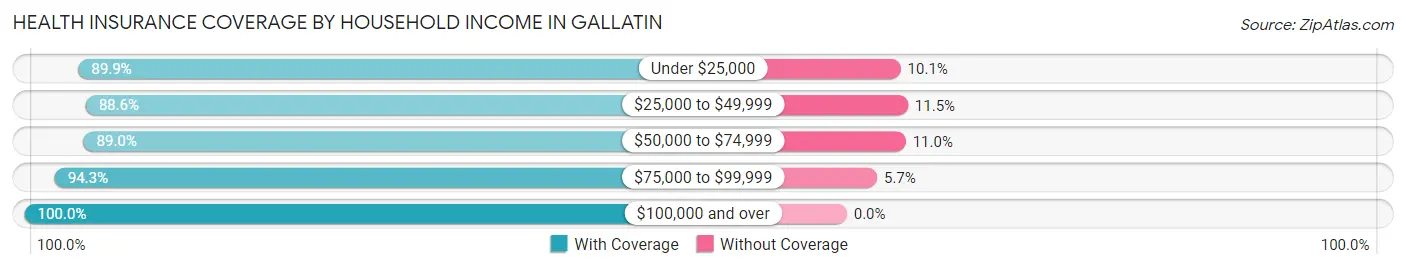
| Household Income | With Coverage | Without Coverage |
| Under $25,000 | 312 (89.9%) | 35 (10.1%) |
| $25,000 to $49,999 | 464 (88.5%) | 60 (11.5%) |
| $50,000 to $74,999 | 395 (89.0%) | 49 (11.0%) |
| $75,000 to $99,999 | 133 (94.3%) | 8 (5.7%) |
| $100,000 and over | 247 (100.0%) | 0 (0.0%) |
Public vs Private Health Insurance Coverage by Age in Gallatin
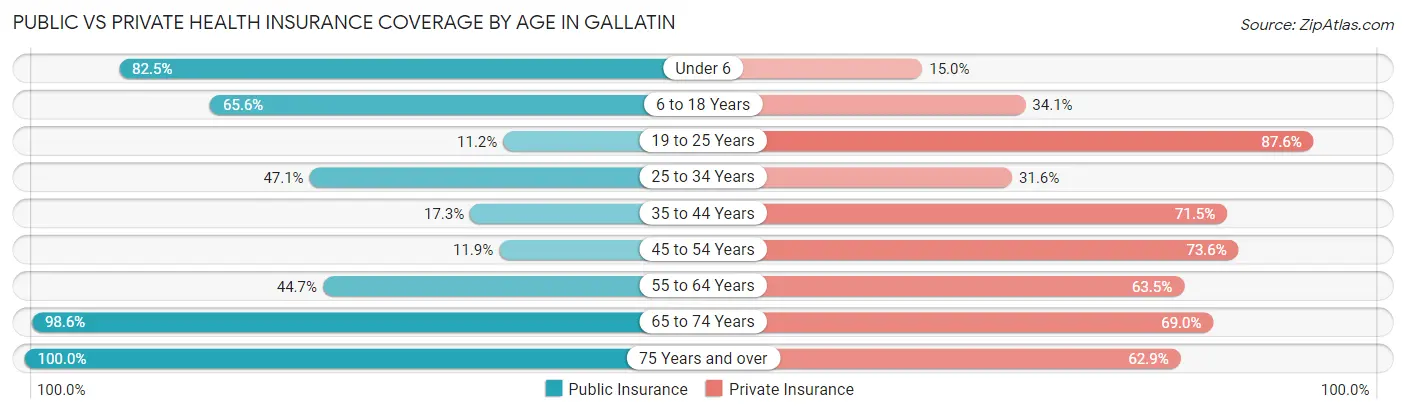
| Age Bracket | Public Insurance | Private Insurance |
| Under 6 | 160 (82.5%) | 29 (14.9%) |
| 6 to 18 Years | 204 (65.6%) | 106 (34.1%) |
| 19 to 25 Years | 18 (11.2%) | 141 (87.6%) |
| 25 to 34 Years | 82 (47.1%) | 55 (31.6%) |
| 35 to 44 Years | 31 (17.3%) | 128 (71.5%) |
| 45 to 54 Years | 24 (11.9%) | 148 (73.6%) |
| 55 to 64 Years | 71 (44.7%) | 101 (63.5%) |
| 65 to 74 Years | 216 (98.6%) | 151 (69.0%) |
| 75 Years and over | 105 (100.0%) | 66 (62.9%) |
| Total | 911 (53.5%) | 925 (54.3%) |
Disability Status by Sex by Age in Gallatin
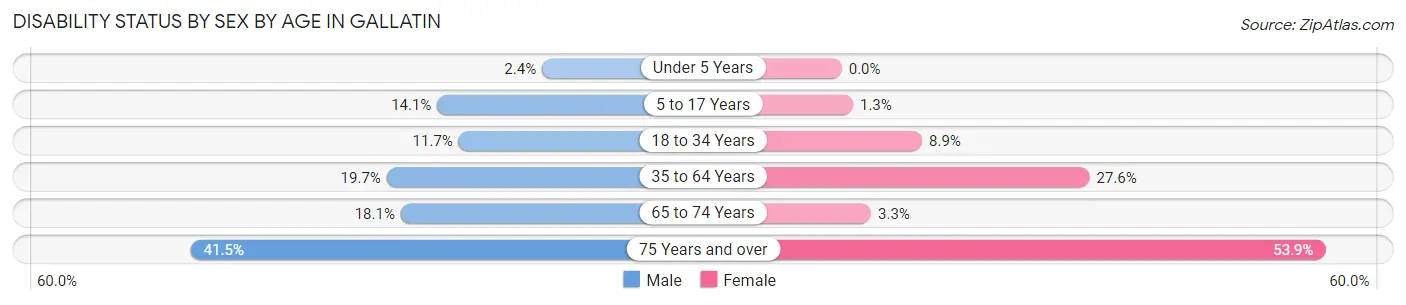
| Age Bracket | Male | Female |
| Under 5 Years | 2 (2.4%) | 0 (0.0%) |
| 5 to 17 Years | 26 (14.1%) | 2 (1.3%) |
| 18 to 34 Years | 19 (11.7%) | 16 (8.9%) |
| 35 to 64 Years | 49 (19.7%) | 80 (27.6%) |
| 65 to 74 Years | 23 (18.1%) | 3 (3.3%) |
| 75 Years and over | 22 (41.5%) | 28 (53.8%) |
Disability Class by Sex by Age in Gallatin
Disability Class: Hearing Difficulty
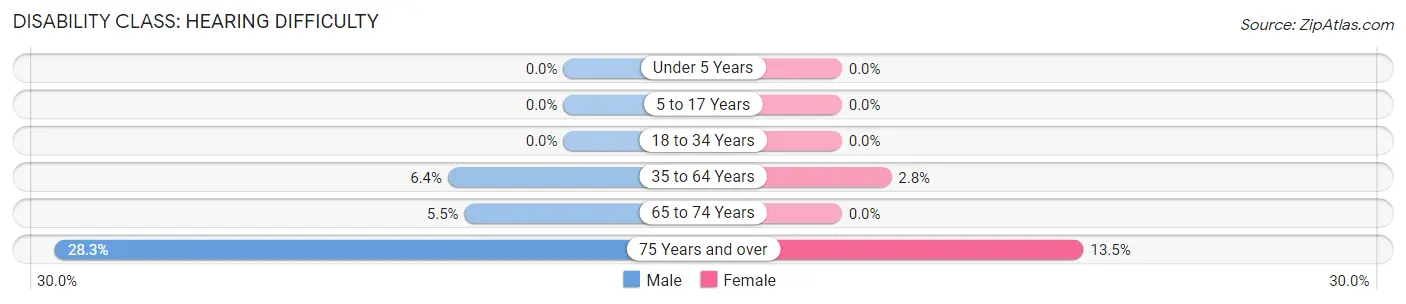
| Age Bracket | Male | Female |
| Under 5 Years | 0 (0.0%) | 0 (0.0%) |
| 5 to 17 Years | 0 (0.0%) | 0 (0.0%) |
| 18 to 34 Years | 0 (0.0%) | 0 (0.0%) |
| 35 to 64 Years | 16 (6.4%) | 8 (2.8%) |
| 65 to 74 Years | 7 (5.5%) | 0 (0.0%) |
| 75 Years and over | 15 (28.3%) | 7 (13.5%) |
Disability Class: Vision Difficulty
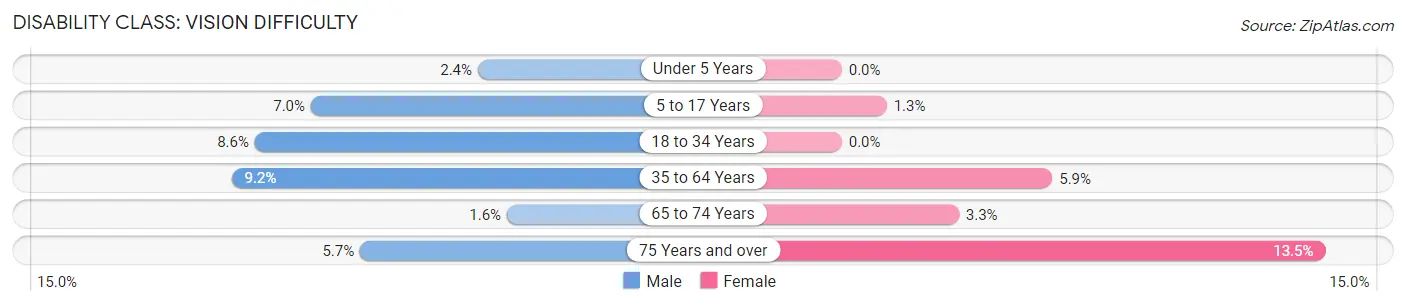
| Age Bracket | Male | Female |
| Under 5 Years | 2 (2.4%) | 0 (0.0%) |
| 5 to 17 Years | 13 (7.0%) | 2 (1.3%) |
| 18 to 34 Years | 14 (8.6%) | 0 (0.0%) |
| 35 to 64 Years | 23 (9.2%) | 17 (5.9%) |
| 65 to 74 Years | 2 (1.6%) | 3 (3.3%) |
| 75 Years and over | 3 (5.7%) | 7 (13.5%) |
Disability Class: Cognitive Difficulty
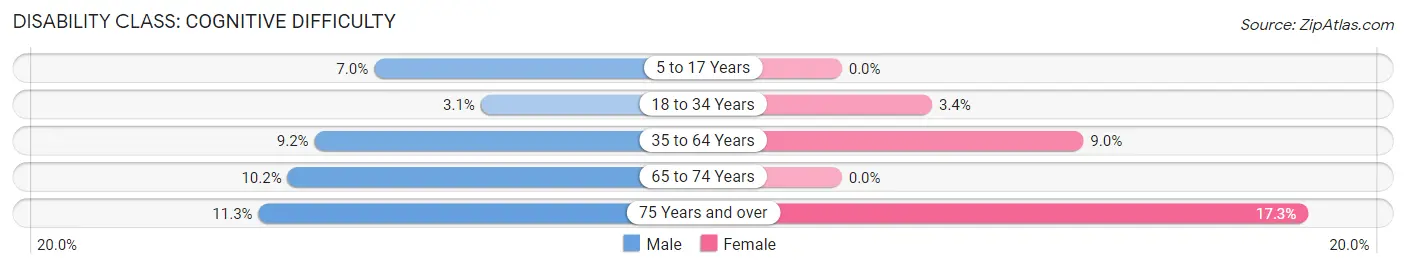
| Age Bracket | Male | Female |
| 5 to 17 Years | 13 (7.0%) | 0 (0.0%) |
| 18 to 34 Years | 5 (3.1%) | 6 (3.4%) |
| 35 to 64 Years | 23 (9.2%) | 26 (9.0%) |
| 65 to 74 Years | 13 (10.2%) | 0 (0.0%) |
| 75 Years and over | 6 (11.3%) | 9 (17.3%) |
Disability Class: Ambulatory Difficulty
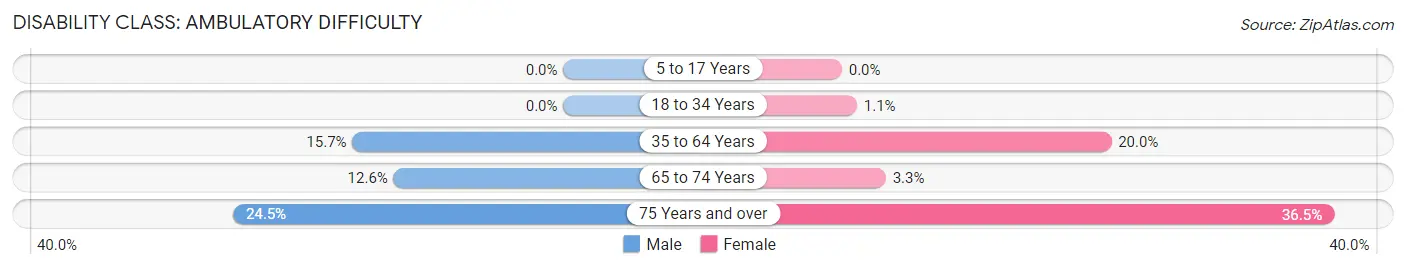
| Age Bracket | Male | Female |
| 5 to 17 Years | 0 (0.0%) | 0 (0.0%) |
| 18 to 34 Years | 0 (0.0%) | 2 (1.1%) |
| 35 to 64 Years | 39 (15.7%) | 58 (20.0%) |
| 65 to 74 Years | 16 (12.6%) | 3 (3.3%) |
| 75 Years and over | 13 (24.5%) | 19 (36.5%) |
Disability Class: Self-Care Difficulty
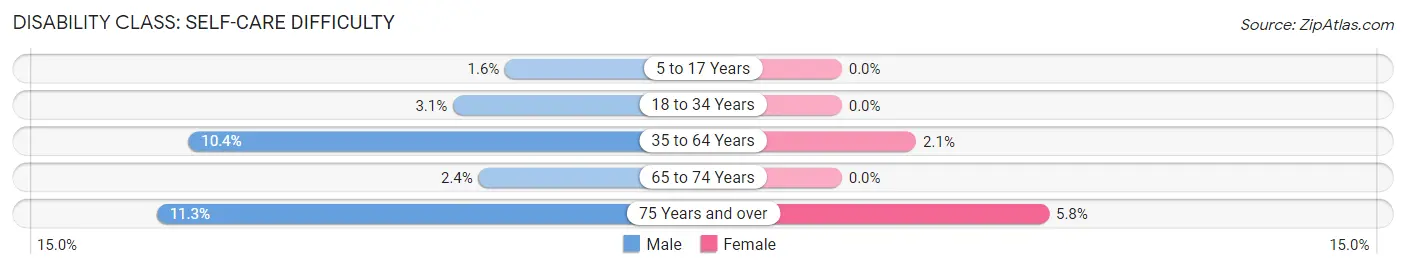
| Age Bracket | Male | Female |
| 5 to 17 Years | 3 (1.6%) | 0 (0.0%) |
| 18 to 34 Years | 5 (3.1%) | 0 (0.0%) |
| 35 to 64 Years | 26 (10.4%) | 6 (2.1%) |
| 65 to 74 Years | 3 (2.4%) | 0 (0.0%) |
| 75 Years and over | 6 (11.3%) | 3 (5.8%) |
Technology Access in Gallatin
Computing Device Access in Gallatin
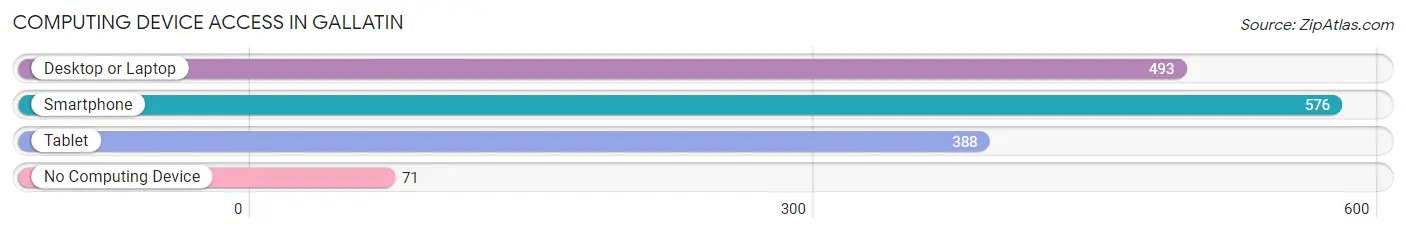
| Device Type | # Households | % Households |
| Desktop or Laptop | 493 | 69.4% |
| Smartphone | 576 | 81.1% |
| Tablet | 388 | 54.6% |
| No Computing Device | 71 | 10.0% |
| Total | 710 | 100.0% |
Internet Access in Gallatin
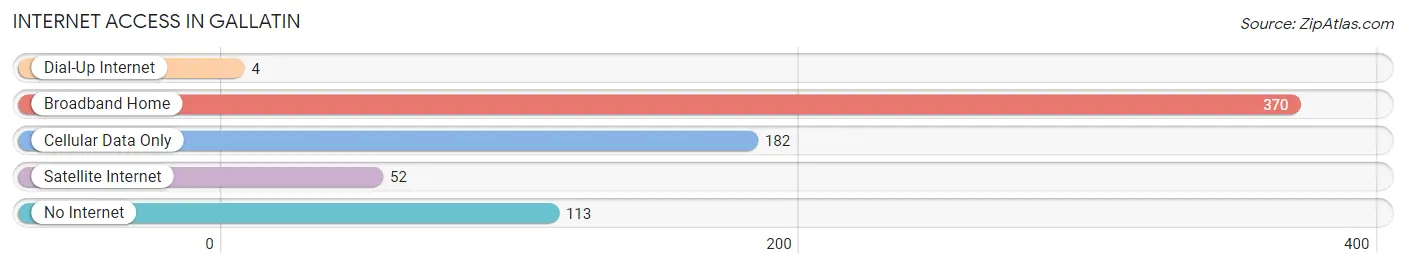
| Internet Type | # Households | % Households |
| Dial-Up Internet | 4 | 0.6% |
| Broadband Home | 370 | 52.1% |
| Cellular Data Only | 182 | 25.6% |
| Satellite Internet | 52 | 7.3% |
| No Internet | 113 | 15.9% |
| Total | 710 | 100.0% |
Gallatin Summary
History
The city of Gallatin, Missouri is located in Daviess County, in the northwest corner of the state. It is situated on the banks of the Grand River, and is the county seat of Daviess County. The city was founded in 1837, and was named after Albert Gallatin, the fourth United States Secretary of the Treasury.
Gallatin was originally a small farming community, and the first settlers were mostly of German and Irish descent. The town was incorporated in 1845, and the first mayor was William H. Smith. The town grew slowly, but steadily, and by the late 19th century, it had become a thriving commercial center.
The city was a major stop on the Hannibal and St. Joseph Railroad, which connected St. Joseph, Missouri to Hannibal, Missouri. This railroad was a major factor in the growth of the city, and it allowed for the transportation of goods and people to and from the city.
In the early 20th century, Gallatin was a major center for the production of tobacco. The city was home to several tobacco warehouses, and the tobacco industry was a major source of employment for the city.
The city was also home to several manufacturing plants, including a shoe factory, a furniture factory, and a canning factory. These factories provided employment for many of the city's residents.
In the late 20th century, the city experienced a decline in its manufacturing industry, and many of the factories closed. However, the city has since experienced a resurgence in its economy, and it is now home to several businesses, including a winery, a brewery, and a distillery.
Geography
Gallatin is located in the northwest corner of Missouri, in Daviess County. It is situated on the banks of the Grand River, and is approximately 40 miles north of Kansas City. The city has a total area of 2.2 square miles, and is located at an elevation of 890 feet.
The climate in Gallatin is humid continental, with hot summers and cold winters. The average annual temperature is 54 degrees Fahrenheit, and the average annual precipitation is 39 inches.
Economy
The economy of Gallatin is largely based on agriculture and tourism. The city is home to several wineries, breweries, and distilleries, and these businesses attract many visitors to the city.
The city is also home to several manufacturing plants, including a shoe factory, a furniture factory, and a canning factory. These factories provide employment for many of the city's residents.
The city is also home to several retail stores, restaurants, and other businesses. The city is served by several major highways, and is a major transportation hub for the region.
Demographics
As of the 2010 census, the population of Gallatin was 2,845. The racial makeup of the city was 97.3% White, 0.7% African American, 0.3% Native American, 0.2% Asian, 0.1% Pacific Islander, 0.3% from other races, and 1.2% from two or more races. Hispanic or Latino of any race were 1.2% of the population.
The median household income in Gallatin was $37,917, and the median family income was $45,938. The per capita income in the city was $19,945. About 11.3% of the population was below the poverty line.
Common Questions
What is Per Capita Income in Gallatin?
Per Capita income in Gallatin is $22,627.
What is the Median Family Income in Gallatin?
Median Family Income in Gallatin is $51,991.
What is the Median Household income in Gallatin?
Median Household Income in Gallatin is $39,500.
What is Income or Wage Gap in Gallatin?
Income or Wage Gap in Gallatin is 55.4%.
Women in Gallatin earn 44.6 cents for every dollar earned by a man.
What is Inequality or Gini Index in Gallatin?
Inequality or Gini Index in Gallatin is 0.43.
What is the Total Population of Gallatin?
Total Population of Gallatin is 1,747.
What is the Total Male Population of Gallatin?
Total Male Population of Gallatin is 875.
What is the Total Female Population of Gallatin?
Total Female Population of Gallatin is 872.
What is the Ratio of Males per 100 Females in Gallatin?
There are 100.34 Males per 100 Females in Gallatin.
What is the Ratio of Females per 100 Males in Gallatin?
There are 99.66 Females per 100 Males in Gallatin.
What is the Median Population Age in Gallatin?
Median Population Age in Gallatin is 36.4 Years.
What is the Average Family Size in Gallatin
Average Family Size in Gallatin is 3.2 People.
What is the Average Household Size in Gallatin
Average Household Size in Gallatin is 2.4 People.
How Large is the Labor Force in Gallatin?
There are 666 People in the Labor Forcein in Gallatin.
What is the Percentage of People in the Labor Force in Gallatin?
51.5% of People are in the Labor Force in Gallatin.
What is the Unemployment Rate in Gallatin?
Unemployment Rate in Gallatin is 4.7%.