Zip Codes with the Highest Percentage of Population Employed in Professional & Scientific Services in Florissant, MO
RELATED REPORTS & OPTIONS
Professional & Scientific Services
Florissant
Compare Zip Codes
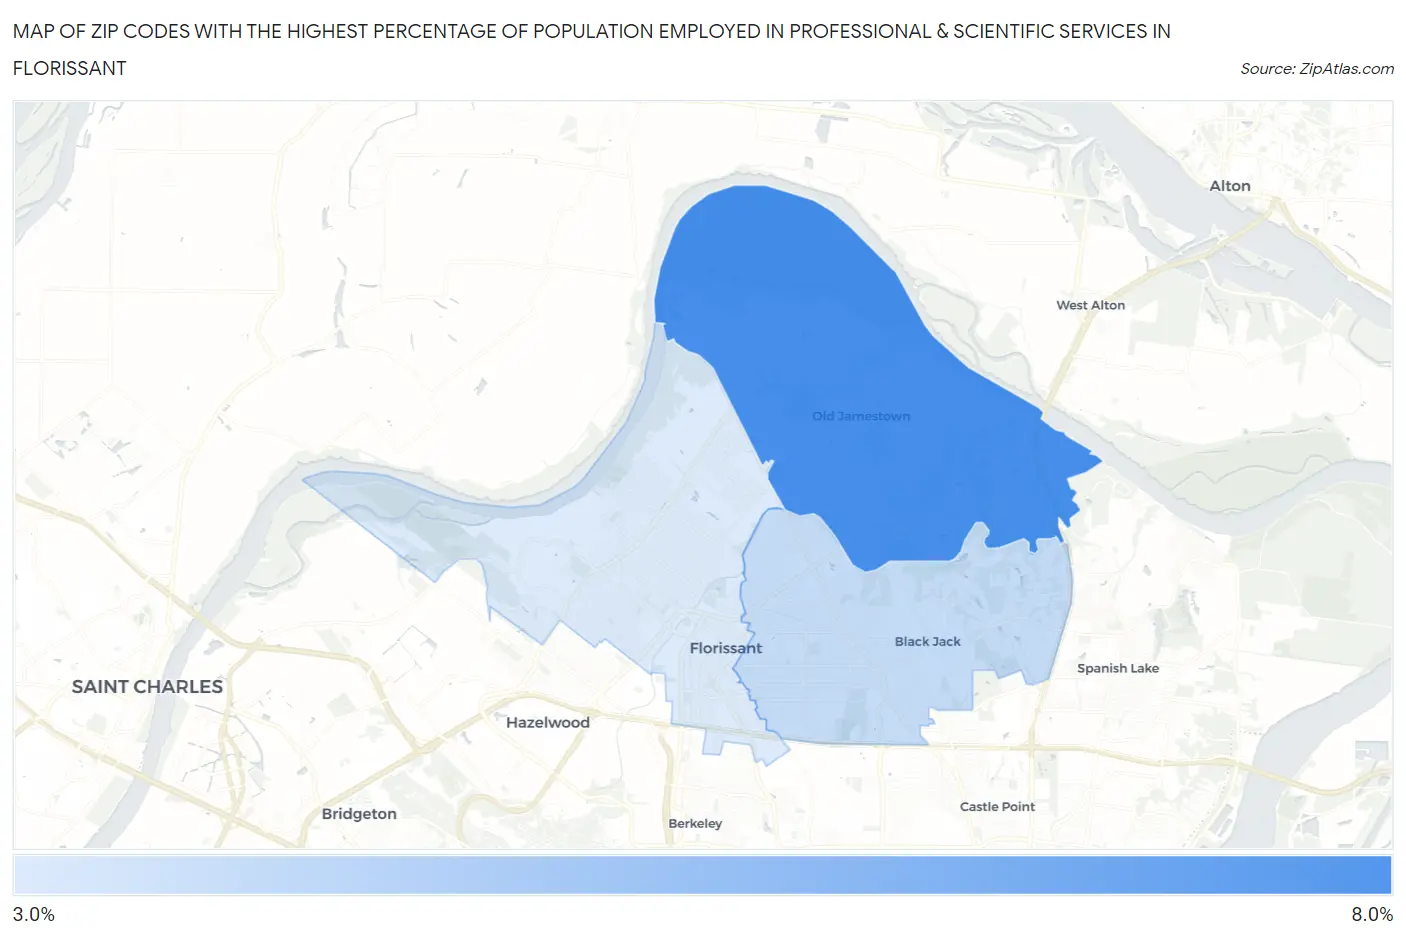
Map of Zip Codes with the Highest Percentage of Population Employed in Professional & Scientific Services in Florissant
0.0%
8.0%
Zip Codes with the Highest Percentage of Population Employed in Professional & Scientific Services in Florissant, MO
| Zip Code | % Employed | vs State | vs National | |
| 1. | 63034 | 6.7% | 6.3%(+0.374)#179 | 7.8%(-1.18)#8,733 |
| 2. | 63033 | 4.3% | 6.3%(-2.01)#306 | 7.8%(-3.57)#14,294 |
| 3. | 63031 | 3.9% | 6.3%(-2.41)#340 | 7.8%(-3.97)#15,488 |
1
Common Questions
What are the Top Zip Codes with the Highest Percentage of Population Employed in Professional & Scientific Services in Florissant, MO?
Top Zip Codes with the Highest Percentage of Population Employed in Professional & Scientific Services in Florissant, MO are:
What zip code has the Highest Percentage of Population Employed in Professional & Scientific Services in Florissant, MO?
63034 has the Highest Percentage of Population Employed in Professional & Scientific Services in Florissant, MO with 6.7%.
What is the Percentage of Population Employed in Professional & Scientific Services in Florissant, MO?
Percentage of Population Employed in Professional & Scientific Services in Florissant is 4.6%.
What is the Percentage of Population Employed in Professional & Scientific Services in Missouri?
Percentage of Population Employed in Professional & Scientific Services in Missouri is 6.3%.
What is the Percentage of Population Employed in Professional & Scientific Services in the United States?
Percentage of Population Employed in Professional & Scientific Services in the United States is 7.8%.