Zip Codes with the Highest Percentage of Black / African American Population in Florissant, MO
RELATED REPORTS & OPTIONS
Black / African American
Florissant
Compare Zip Codes
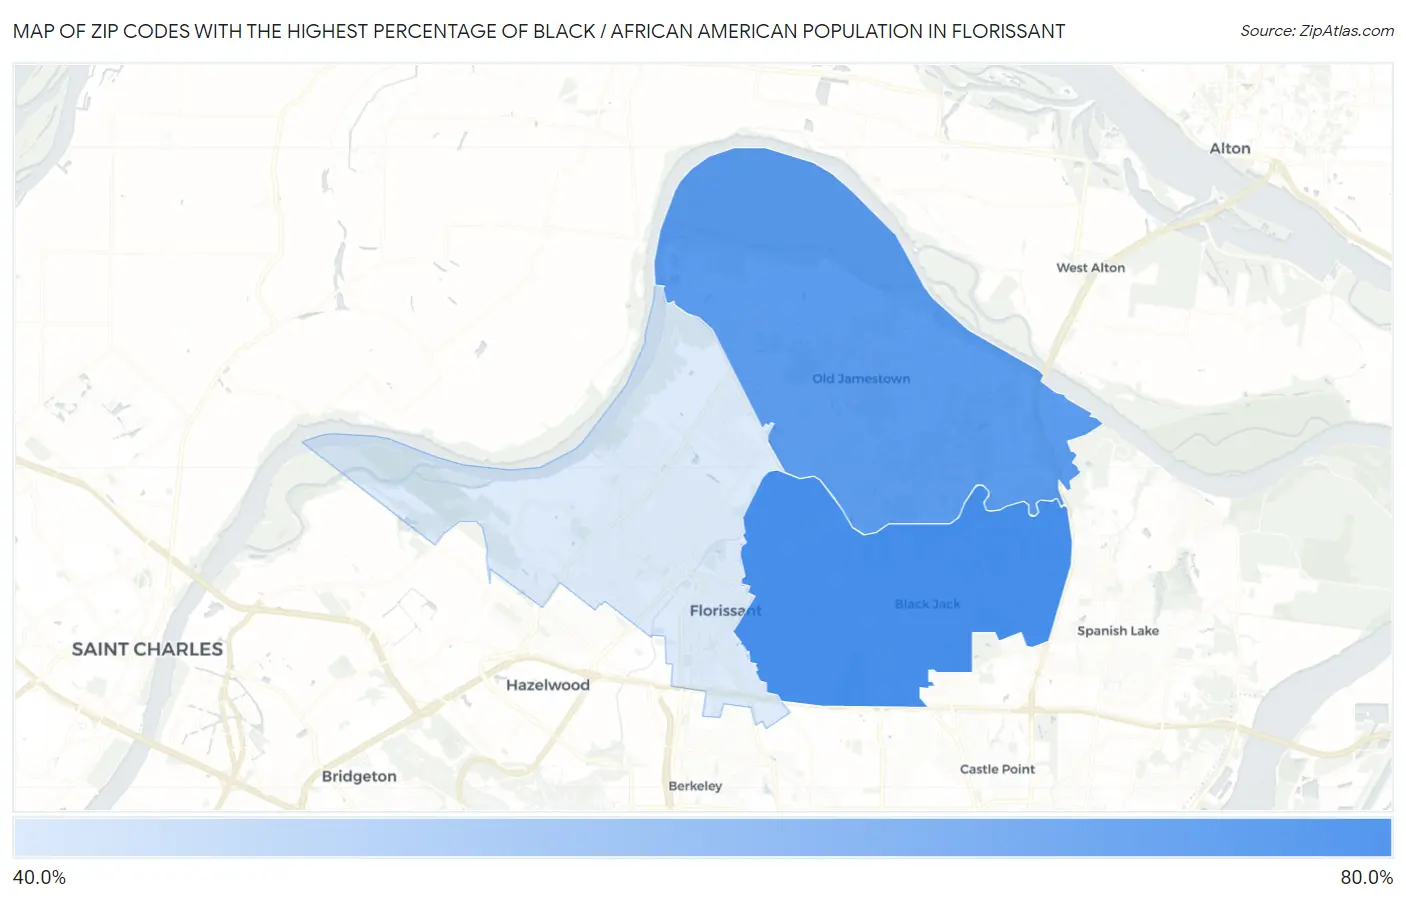
Map of Zip Codes with the Highest Percentage of Black / African American Population in Florissant
0.0%
80.0%
Zip Codes with the Highest Percentage of Black / African American Population in Florissant, MO
| Zip Code | Black / African American | vs State | vs National | |
| 1. | 63033 | 68.6% | 11.3%(+57.4)#17 | 12.5%(+56.2)#580 |
| 2. | 63034 | 64.3% | 11.3%(+53.0)#21 | 12.5%(+51.8)#710 |
| 3. | 63031 | 40.0% | 11.3%(+28.7)#37 | 12.5%(+27.5)#1,849 |
1
Common Questions
What are the Top Zip Codes with the Highest Percentage of Black / African American Population in Florissant, MO?
Top Zip Codes with the Highest Percentage of Black / African American Population in Florissant, MO are:
What zip code has the Highest Percentage of Black / African American Population in Florissant, MO?
63033 has the Highest Percentage of Black / African American Population in Florissant, MO with 68.6%.
What is the Percentage of Black / African American Population in Florissant, MO?
Percentage of Black / African American Population in Florissant is 40.7%.
What is the Percentage of Black / African American Population in Missouri?
Percentage of Black / African American Population in Missouri is 11.3%.
What is the Percentage of Black / African American Population in the United States?
Percentage of Black / African American Population in the United States is 12.5%.