Edina, MO Map & Demographics
Edina Map
Edina Overview
$18,453
PER CAPITA INCOME
$67,750
AVG FAMILY INCOME
$40,714
AVG HOUSEHOLD INCOME
$13,584
FAMILY INCOME DEFICIT
0.43
INEQUALITY / GINI INDEX
1,379
TOTAL POPULATION
690
MALE POPULATION
689
FEMALE POPULATION
100.15
MALES / 100 FEMALES
99.86
FEMALES / 100 MALES
39.0
MEDIAN AGE
5.4
AVG FAMILY SIZE
3.3
AVG HOUSEHOLD SIZE
641
LABOR FORCE [ PEOPLE ]
58.9%
PERCENT IN LABOR FORCE
3.4%
UNEMPLOYMENT RATE
Edina Zip Codes
Edina Area Codes
Income in Edina
Income Overview in Edina
Per Capita Income in Edina is $18,453, while median incomes of families and households are $67,750 and $40,714 respectively.
| Characteristic | Number | Measure |
| Per Capita Income | 1,379 | $18,453 |
| Median Family Income | 203 | $67,750 |
| Mean Family Income | 203 | $69,825 |
| Median Household Income | 396 | $40,714 |
| Mean Household Income | 396 | $51,962 |
| Income Deficit | 203 | $13,584 |
| Wage / Income Gap (%) | 1,379 | 0.00% |
| Wage / Income Gap ($) | 1,379 | 100.00¢ per $1 |
| Gini / Inequality Index | 1,379 | 0.43 |
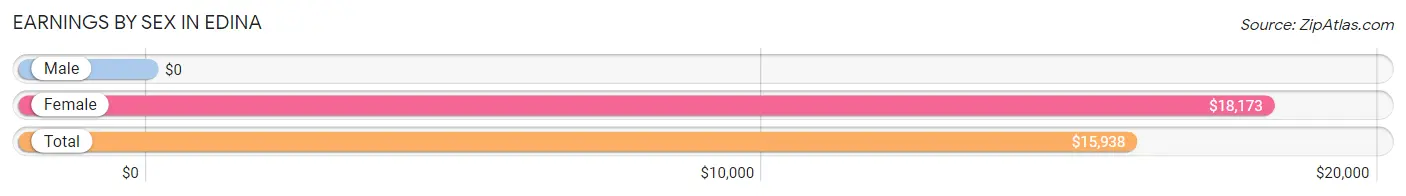
Earnings by Sex in Edina
| Sex | Number | Average Earnings |
| Male | 388 (54.4%) | $0 |
| Female | 325 (45.6%) | $18,173 |
| Total | 713 (100.0%) | $15,938 |
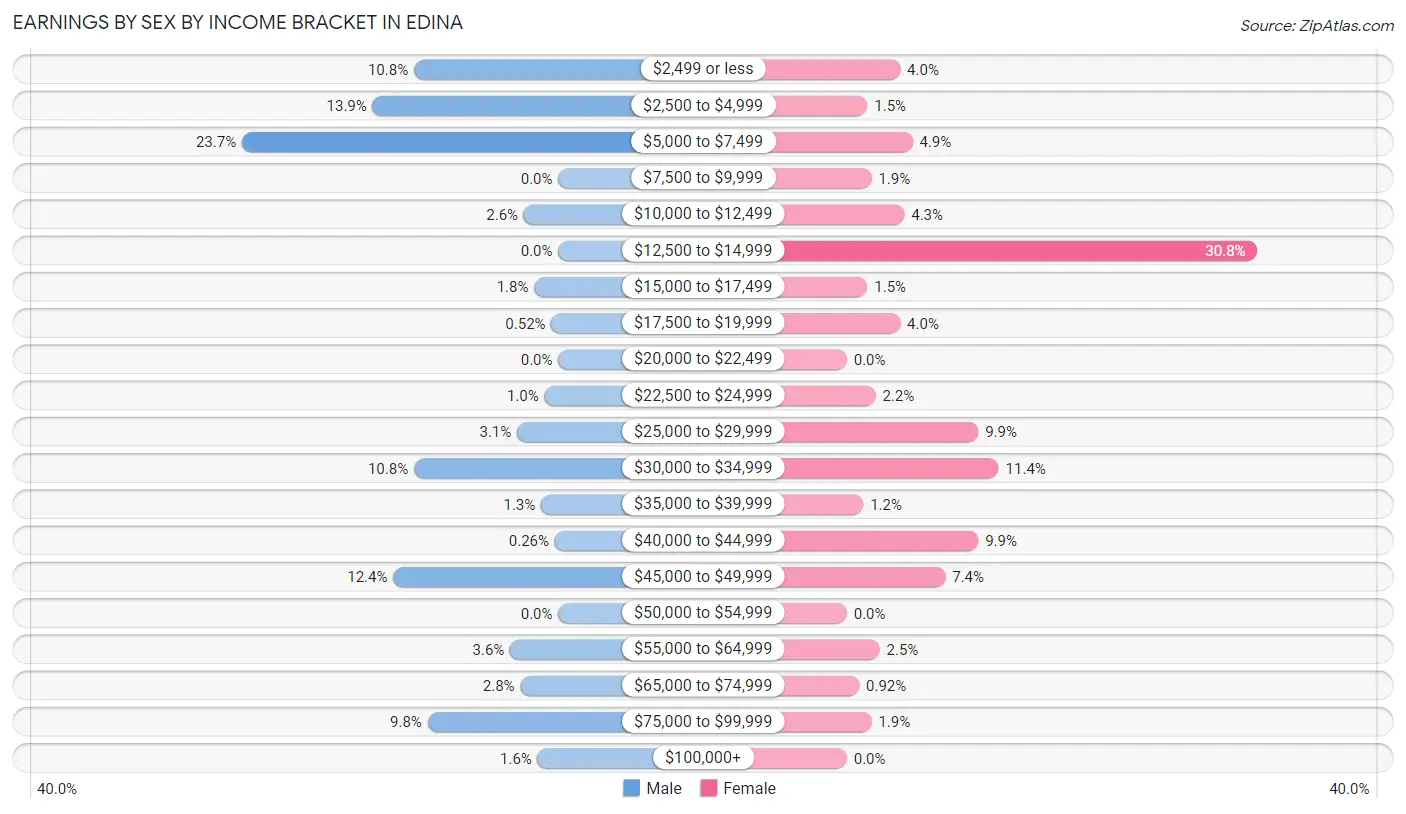
Earnings by Sex by Income Bracket in Edina
The most common earnings brackets in Edina are $5,000 to $7,499 for men (92 | 23.7%) and $12,500 to $14,999 for women (100 | 30.8%).
| Income | Male | Female |
| $2,499 or less | 42 (10.8%) | 13 (4.0%) |
| $2,500 to $4,999 | 54 (13.9%) | 5 (1.5%) |
| $5,000 to $7,499 | 92 (23.7%) | 16 (4.9%) |
| $7,500 to $9,999 | 0 (0.0%) | 6 (1.8%) |
| $10,000 to $12,499 | 10 (2.6%) | 14 (4.3%) |
| $12,500 to $14,999 | 0 (0.0%) | 100 (30.8%) |
| $15,000 to $17,499 | 7 (1.8%) | 5 (1.5%) |
| $17,500 to $19,999 | 2 (0.5%) | 13 (4.0%) |
| $20,000 to $22,499 | 0 (0.0%) | 0 (0.0%) |
| $22,500 to $24,999 | 4 (1.0%) | 7 (2.1%) |
| $25,000 to $29,999 | 12 (3.1%) | 32 (9.9%) |
| $30,000 to $34,999 | 42 (10.8%) | 37 (11.4%) |
| $35,000 to $39,999 | 5 (1.3%) | 4 (1.2%) |
| $40,000 to $44,999 | 1 (0.3%) | 32 (9.9%) |
| $45,000 to $49,999 | 48 (12.4%) | 24 (7.4%) |
| $50,000 to $54,999 | 0 (0.0%) | 0 (0.0%) |
| $55,000 to $64,999 | 14 (3.6%) | 8 (2.5%) |
| $65,000 to $74,999 | 11 (2.8%) | 3 (0.9%) |
| $75,000 to $99,999 | 38 (9.8%) | 6 (1.8%) |
| $100,000+ | 6 (1.5%) | 0 (0.0%) |
| Total | 388 (100.0%) | 325 (100.0%) |
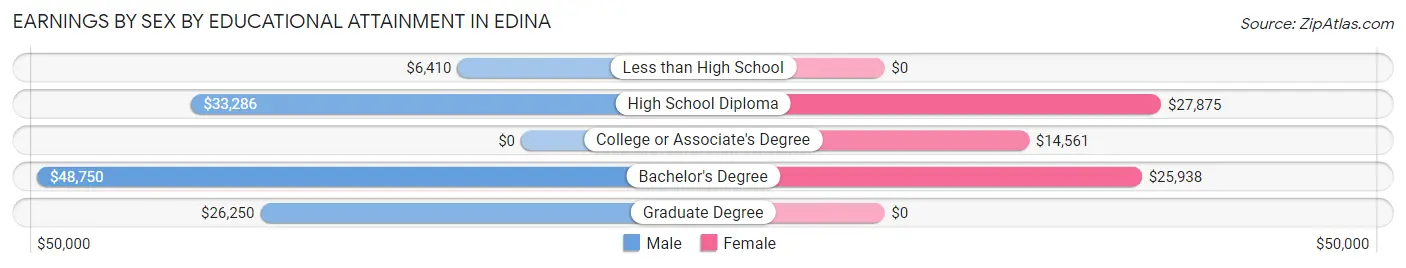
Earnings by Sex by Educational Attainment in Edina
| Educational Attainment | Male Income | Female Income |
| Less than High School | $6,410 | $0 |
| High School Diploma | $33,286 | $27,875 |
| College or Associate's Degree | - | - |
| Bachelor's Degree | $48,750 | $25,938 |
| Graduate Degree | $26,250 | $0 |
| Total | - | - |
Family Income in Edina
Family Income Brackets in Edina
According to the Edina family income data, there are 46 families falling into the $75,000 to $99,999 income range, which is the most common income bracket and makes up 22.7% of all families.
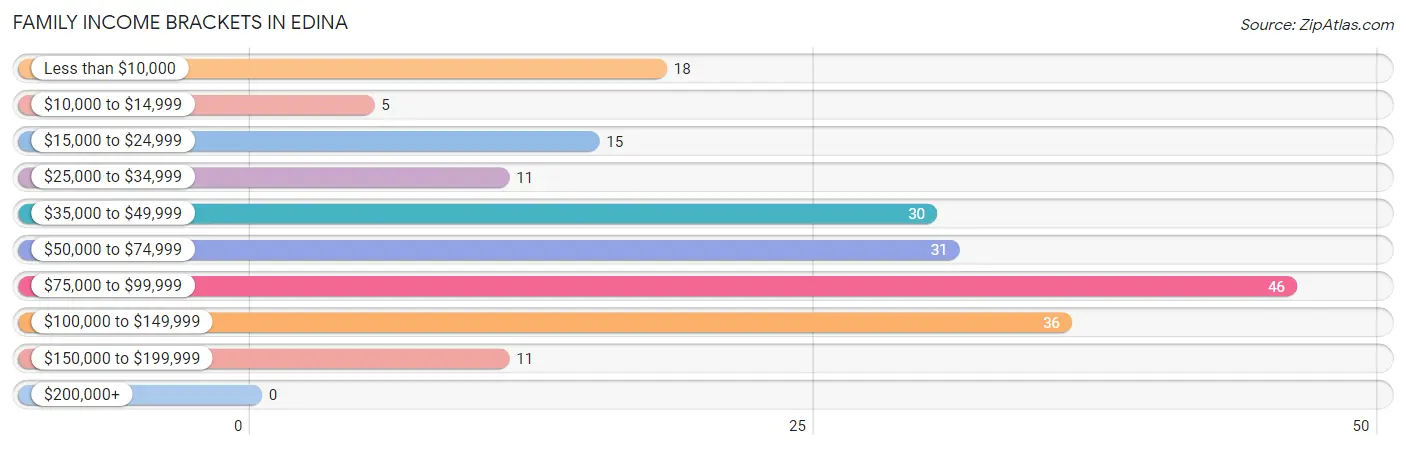
| Income Bracket | # Families | % Families |
| Less than $10,000 | 18 | 8.9% |
| $10,000 to $14,999 | 5 | 2.5% |
| $15,000 to $24,999 | 15 | 7.4% |
| $25,000 to $34,999 | 11 | 5.4% |
| $35,000 to $49,999 | 30 | 14.8% |
| $50,000 to $74,999 | 31 | 15.3% |
| $75,000 to $99,999 | 46 | 22.7% |
| $100,000 to $149,999 | 36 | 17.7% |
| $150,000 to $199,999 | 11 | 5.4% |
| $200,000+ | 0 | 0.0% |
Family Income by Famaliy Size in Edina
4-person families (69 | 34.0%) account for the highest median family income in Edina with $88,510 per family, while 2-person families (89 | 43.8%) have the highest median income of $29,375 per family member.
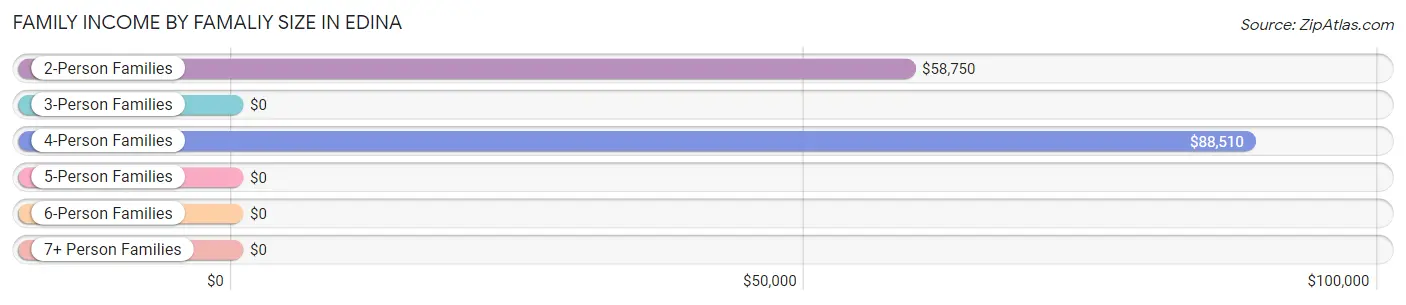
| Income Bracket | # Families | Median Income |
| 2-Person Families | 89 (43.8%) | $58,750 |
| 3-Person Families | 33 (16.3%) | $0 |
| 4-Person Families | 69 (34.0%) | $88,510 |
| 5-Person Families | 3 (1.5%) | $0 |
| 6-Person Families | 8 (3.9%) | $0 |
| 7+ Person Families | 1 (0.5%) | $0 |
| Total | 203 (100.0%) | $67,750 |
Family Income by Number of Earners in Edina
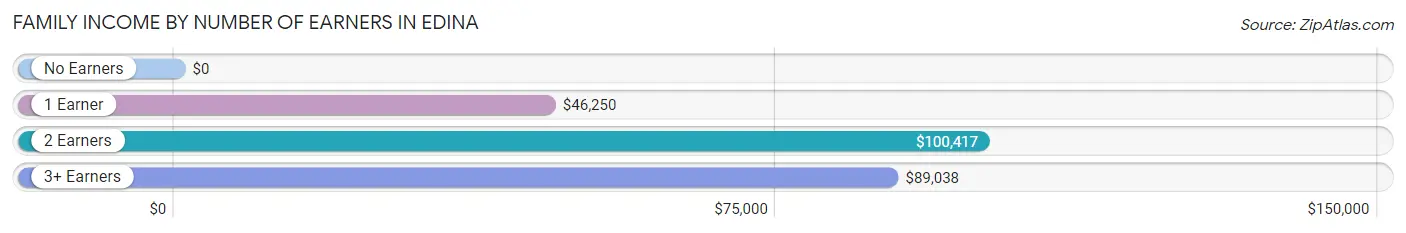
| Number of Earners | # Families | Median Income |
| No Earners | 31 (15.3%) | $0 |
| 1 Earner | 60 (29.6%) | $46,250 |
| 2 Earners | 70 (34.5%) | $100,417 |
| 3+ Earners | 42 (20.7%) | $89,038 |
| Total | 203 (100.0%) | $67,750 |
Household Income in Edina
Household Income Brackets in Edina
With 69 households falling in the category, the $35,000 to $49,999 income range is the most frequent in Edina, accounting for 17.4% of all households.
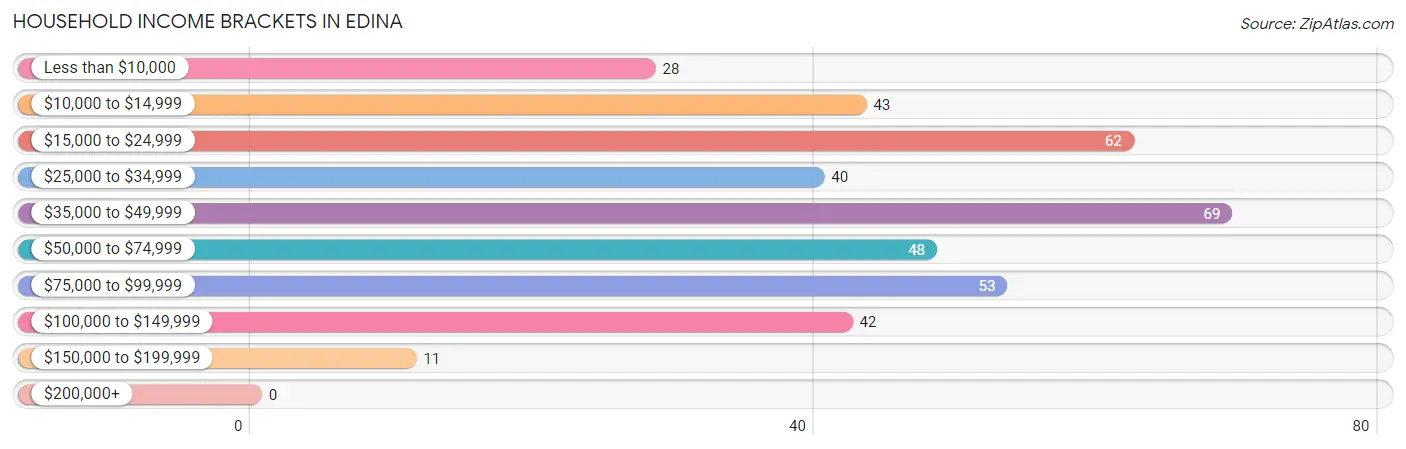
| Income Bracket | # Households | % Households |
| Less than $10,000 | 28 | 7.1% |
| $10,000 to $14,999 | 43 | 10.9% |
| $15,000 to $24,999 | 62 | 15.7% |
| $25,000 to $34,999 | 40 | 10.1% |
| $35,000 to $49,999 | 69 | 17.4% |
| $50,000 to $74,999 | 48 | 12.1% |
| $75,000 to $99,999 | 53 | 13.4% |
| $100,000 to $149,999 | 42 | 10.6% |
| $150,000 to $199,999 | 11 | 2.8% |
| $200,000+ | 0 | 0.0% |
Household Income by Householder Age in Edina
The median household income in Edina is $40,714, with the highest median household income of $59,583 found in the 45 to 64 years age bracket for the primary householder. A total of 147 households (37.1%) fall into this category. Meanwhile, the 65+ years age bracket for the primary householder has the lowest median household income of $25,417, with 137 households (34.6%) in this group.
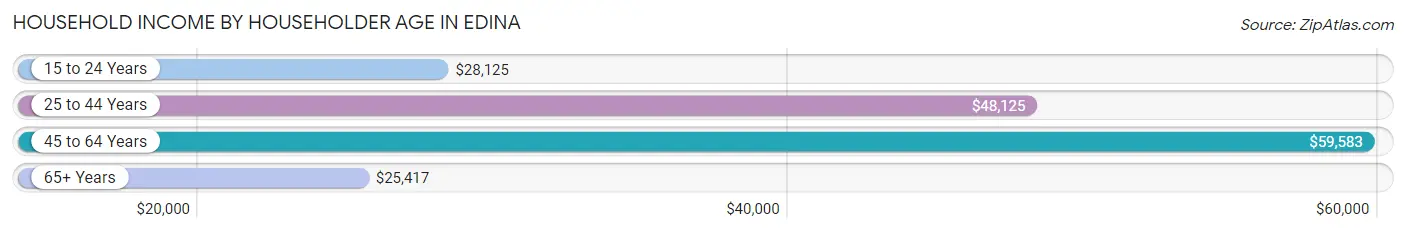
| Income Bracket | # Households | Median Income |
| 15 to 24 Years | 11 (2.8%) | $28,125 |
| 25 to 44 Years | 101 (25.5%) | $48,125 |
| 45 to 64 Years | 147 (37.1%) | $59,583 |
| 65+ Years | 137 (34.6%) | $25,417 |
| Total | 396 (100.0%) | $40,714 |
Poverty in Edina
Income Below Poverty by Sex and Age in Edina
With 21.7% poverty level for males and 22.4% for females among the residents of Edina, 5 year old males and 15 year old females are the most vulnerable to poverty, with 6 males (100.0%) and 6 females (100.0%) in their respective age groups living below the poverty level.
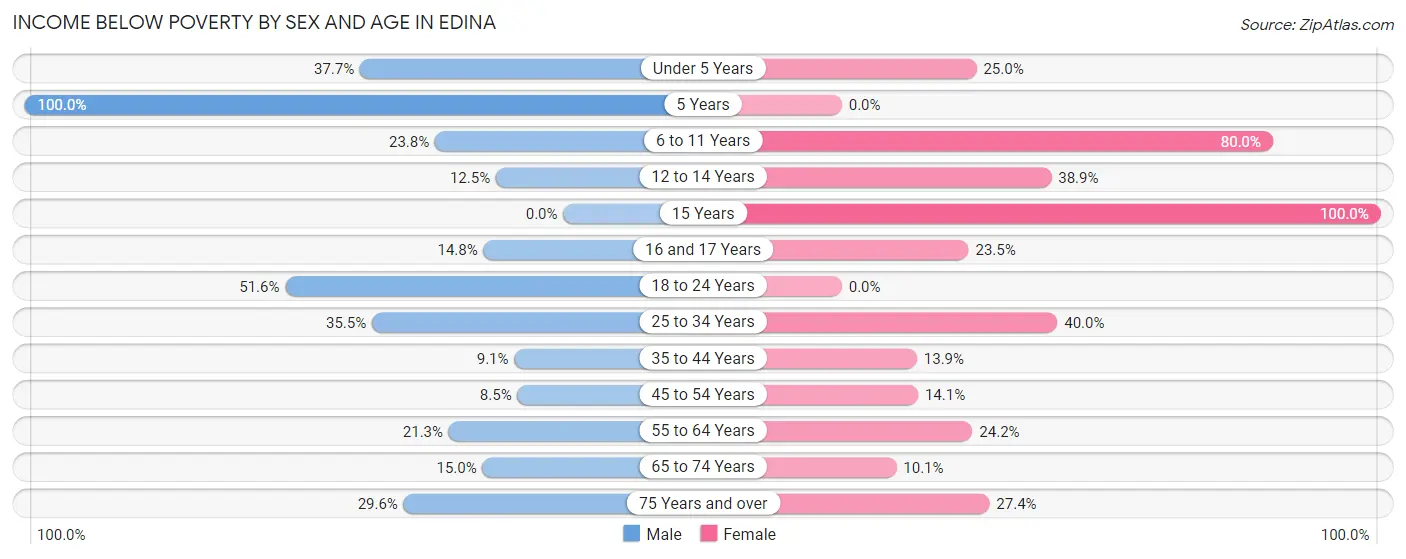
| Age Bracket | Male | Female |
| Under 5 Years | 20 (37.7%) | 18 (25.0%) |
| 5 Years | 6 (100.0%) | 0 (0.0%) |
| 6 to 11 Years | 10 (23.8%) | 16 (80.0%) |
| 12 to 14 Years | 7 (12.5%) | 7 (38.9%) |
| 15 Years | 0 (0.0%) | 6 (100.0%) |
| 16 and 17 Years | 4 (14.8%) | 8 (23.5%) |
| 18 to 24 Years | 16 (51.6%) | 0 (0.0%) |
| 25 to 34 Years | 38 (35.5%) | 14 (40.0%) |
| 35 to 44 Years | 13 (9.1%) | 17 (13.9%) |
| 45 to 54 Years | 8 (8.5%) | 14 (14.1%) |
| 55 to 64 Years | 17 (21.2%) | 24 (24.2%) |
| 65 to 74 Years | 3 (15.0%) | 8 (10.1%) |
| 75 Years and over | 8 (29.6%) | 20 (27.4%) |
| Total | 150 (21.7%) | 152 (22.4%) |
Income Above Poverty by Sex and Age in Edina
According to the poverty statistics in Edina, males aged 15 years and females aged 5 years are the age groups that are most secure financially, with 100.0% of males and 100.0% of females in these age groups living above the poverty line.
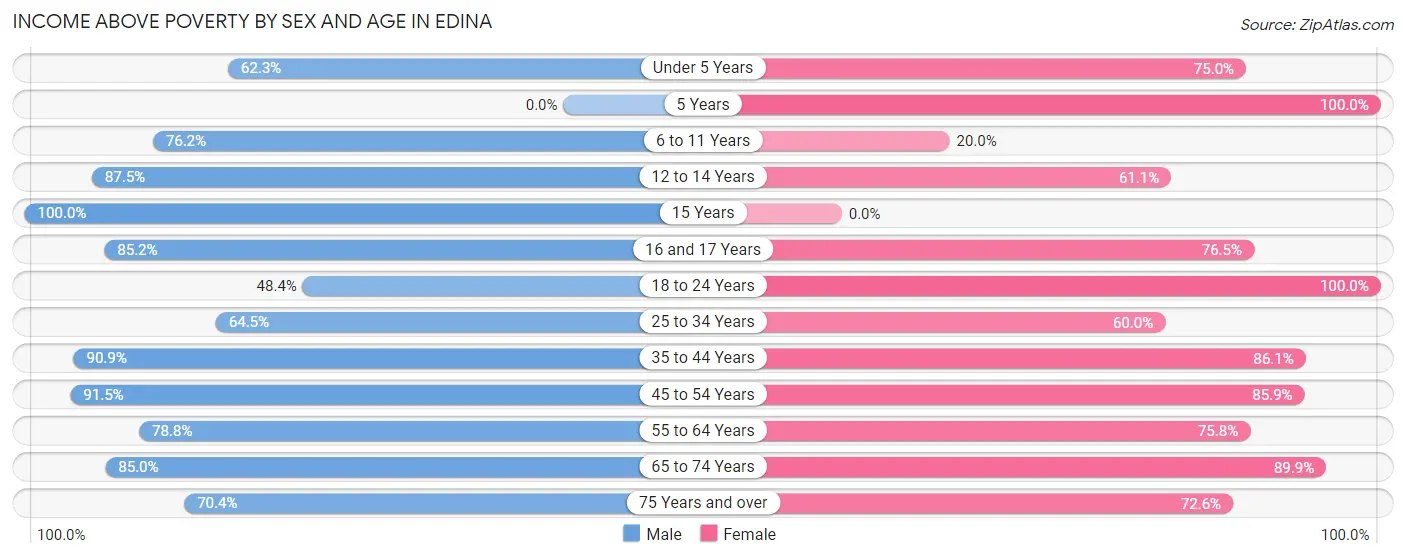
| Age Bracket | Male | Female |
| Under 5 Years | 33 (62.3%) | 54 (75.0%) |
| 5 Years | 0 (0.0%) | 3 (100.0%) |
| 6 to 11 Years | 32 (76.2%) | 4 (20.0%) |
| 12 to 14 Years | 49 (87.5%) | 11 (61.1%) |
| 15 Years | 4 (100.0%) | 0 (0.0%) |
| 16 and 17 Years | 23 (85.2%) | 26 (76.5%) |
| 18 to 24 Years | 15 (48.4%) | 18 (100.0%) |
| 25 to 34 Years | 69 (64.5%) | 21 (60.0%) |
| 35 to 44 Years | 130 (90.9%) | 105 (86.1%) |
| 45 to 54 Years | 86 (91.5%) | 85 (85.9%) |
| 55 to 64 Years | 63 (78.7%) | 75 (75.8%) |
| 65 to 74 Years | 17 (85.0%) | 71 (89.9%) |
| 75 Years and over | 19 (70.4%) | 53 (72.6%) |
| Total | 540 (78.3%) | 526 (77.6%) |
Income Below Poverty Among Married-Couple Families in Edina
The poverty statistics for married-couple families in Edina show that 10.6% or 17 of the total 160 families live below the poverty line. Families with 5 or more children have the highest poverty rate of 100.0%, comprising of 1 families. On the other hand, families with 1 or 2 children have the lowest poverty rate of 2.1%, which includes 1 families.
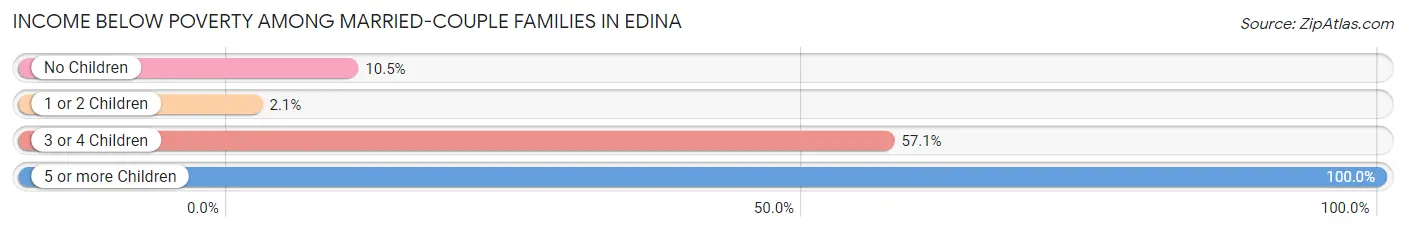
| Children | Above Poverty | Below Poverty |
| No Children | 94 (89.5%) | 11 (10.5%) |
| 1 or 2 Children | 46 (97.9%) | 1 (2.1%) |
| 3 or 4 Children | 3 (42.9%) | 4 (57.1%) |
| 5 or more Children | 0 (0.0%) | 1 (100.0%) |
| Total | 143 (89.4%) | 17 (10.6%) |
Income Below Poverty Among Single-Parent Households in Edina
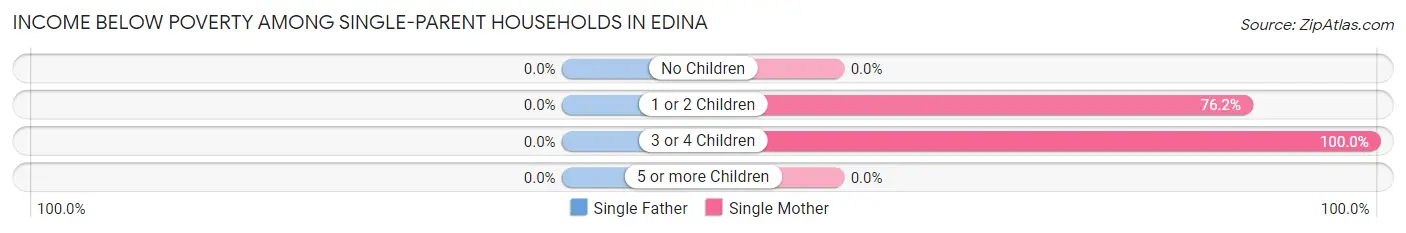
| Children | Single Father | Single Mother |
| No Children | 0 (0.0%) | 0 (0.0%) |
| 1 or 2 Children | 0 (0.0%) | 16 (76.2%) |
| 3 or 4 Children | 0 (0.0%) | 5 (100.0%) |
| 5 or more Children | 0 (0.0%) | 0 (0.0%) |
| Total | 0 (0.0%) | 21 (61.8%) |
Income Below Poverty Among Married-Couple vs Single-Parent Households in Edina
The poverty data for Edina shows that 17 of the married-couple family households (10.6%) and 21 of the single-parent households (48.8%) are living below the poverty level. Within the married-couple family households, those with 5 or more children have the highest poverty rate, with 1 households (100.0%) falling below the poverty line. Among the single-parent households, those with 3 or 4 children have the highest poverty rate, with 5 household (100.0%) living below poverty.
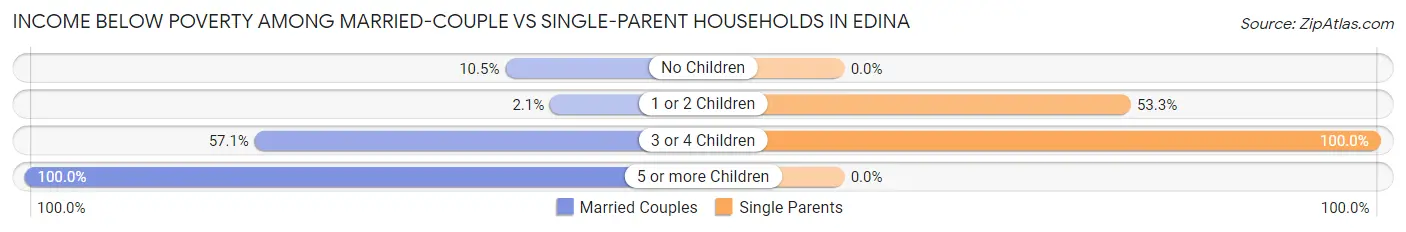
| Children | Married-Couple Families | Single-Parent Households |
| No Children | 11 (10.5%) | 0 (0.0%) |
| 1 or 2 Children | 1 (2.1%) | 16 (53.3%) |
| 3 or 4 Children | 4 (57.1%) | 5 (100.0%) |
| 5 or more Children | 1 (100.0%) | 0 (0.0%) |
| Total | 17 (10.6%) | 21 (48.8%) |
Race in Edina
The most populous races in Edina are White / Caucasian (1,254 | 90.9%), Two or more Races (92 | 6.7%), and Black / African American (29 | 2.1%).
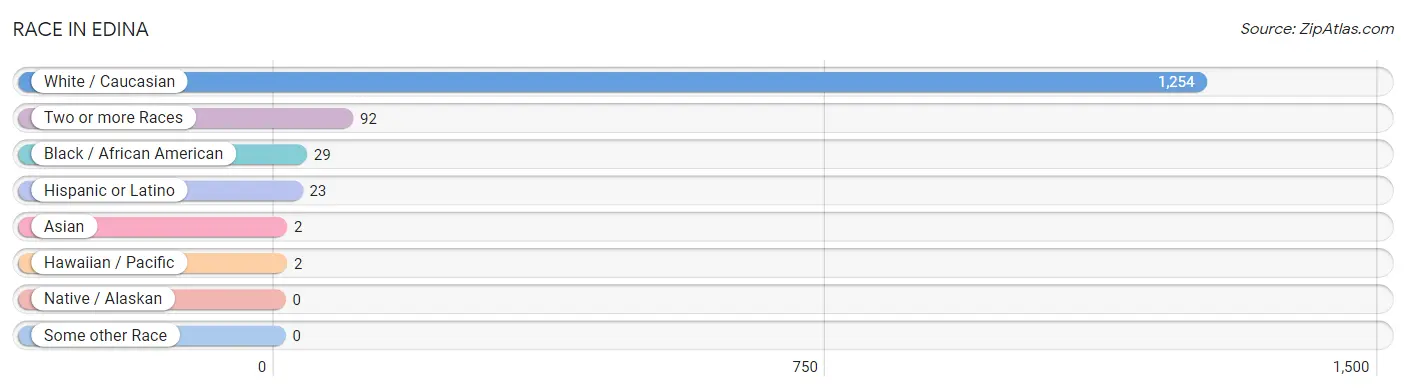
| Race | # Population | % Population |
| Asian | 2 | 0.2% |
| Black / African American | 29 | 2.1% |
| Hawaiian / Pacific | 2 | 0.2% |
| Hispanic or Latino | 23 | 1.7% |
| Native / Alaskan | 0 | 0.0% |
| White / Caucasian | 1,254 | 90.9% |
| Two or more Races | 92 | 6.7% |
| Some other Race | 0 | 0.0% |
| Total | 1,379 | 100.0% |
Ancestry in Edina
The most populous ancestries reported in Edina are German (285 | 20.7%), English (218 | 15.8%), American (111 | 8.1%), European (64 | 4.6%), and Irish (61 | 4.4%), together accounting for 53.6% of all Edina residents.
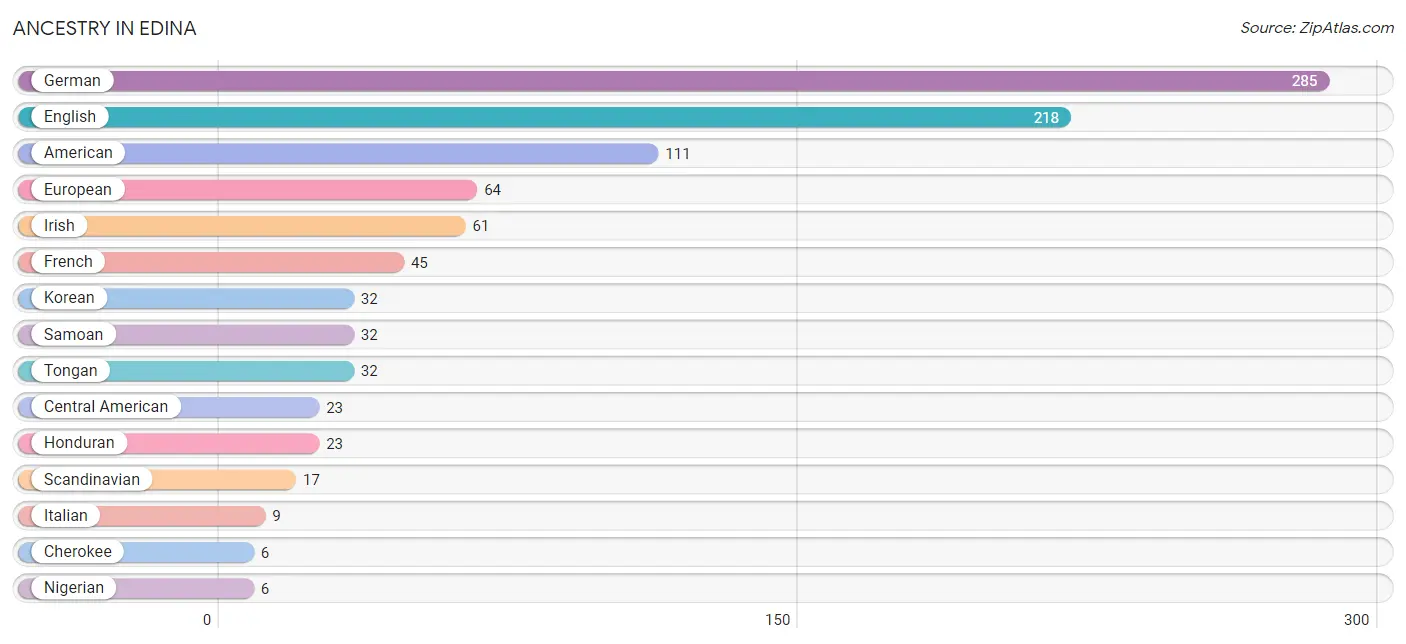
| Ancestry | # Population | % Population |
| American | 111 | 8.1% |
| Central American | 23 | 1.7% |
| Cherokee | 6 | 0.4% |
| English | 218 | 15.8% |
| European | 64 | 4.6% |
| French | 45 | 3.3% |
| German | 285 | 20.7% |
| Honduran | 23 | 1.7% |
| Hungarian | 2 | 0.2% |
| Irish | 61 | 4.4% |
| Italian | 9 | 0.6% |
| Korean | 32 | 2.3% |
| Nigerian | 6 | 0.4% |
| Samoan | 32 | 2.3% |
| Scandinavian | 17 | 1.2% |
| Scotch-Irish | 3 | 0.2% |
| Scottish | 1 | 0.1% |
| Subsaharan African | 6 | 0.4% |
| Tongan | 32 | 2.3% |
| Ukrainian | 1 | 0.1% |
| Welsh | 5 | 0.4% | View All 21 Rows |
Immigrants in Edina
The most numerous immigrant groups reported in Edina came from Africa (6 | 0.4%), Nigeria (6 | 0.4%), Western Africa (6 | 0.4%), England (2 | 0.2%), and Europe (2 | 0.2%), together accounting for 1.6% of all Edina residents.
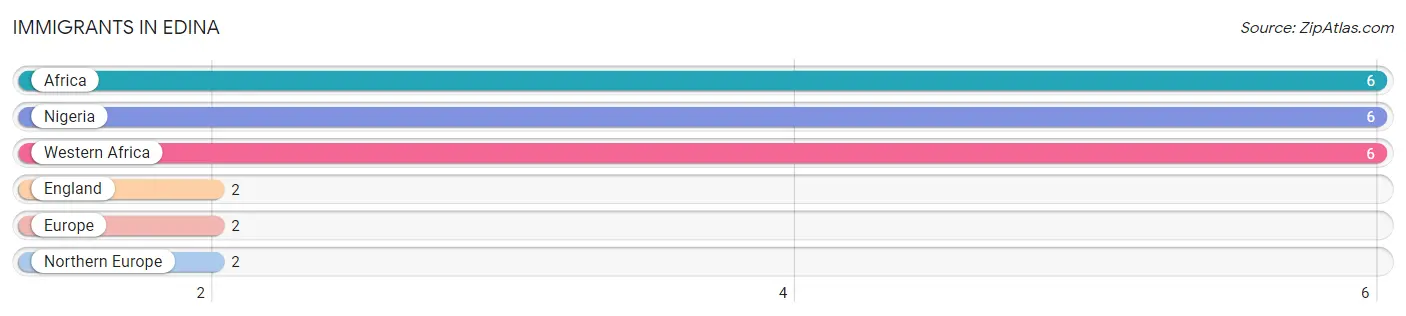
| Immigration Origin | # Population | % Population |
| Africa | 6 | 0.4% |
| England | 2 | 0.2% |
| Europe | 2 | 0.2% |
| Nigeria | 6 | 0.4% |
| Northern Europe | 2 | 0.2% |
| Western Africa | 6 | 0.4% | View All 6 Rows |
Sex and Age in Edina
Sex and Age in Edina
The most populous age groups in Edina are 35 to 39 Years (119 | 17.2%) for men and 35 to 39 Years (82 | 11.9%) for women.
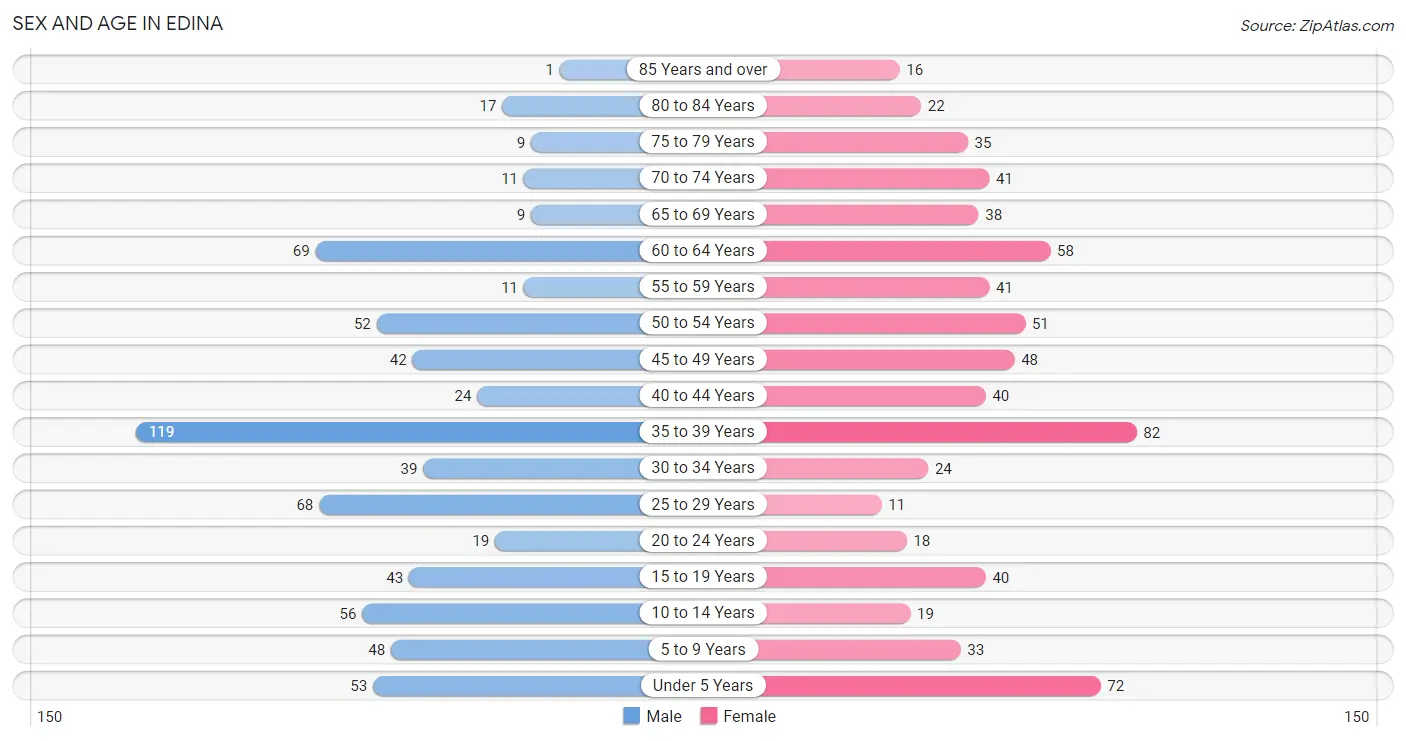
| Age Bracket | Male | Female |
| Under 5 Years | 53 (7.7%) | 72 (10.4%) |
| 5 to 9 Years | 48 (7.0%) | 33 (4.8%) |
| 10 to 14 Years | 56 (8.1%) | 19 (2.8%) |
| 15 to 19 Years | 43 (6.2%) | 40 (5.8%) |
| 20 to 24 Years | 19 (2.8%) | 18 (2.6%) |
| 25 to 29 Years | 68 (9.9%) | 11 (1.6%) |
| 30 to 34 Years | 39 (5.7%) | 24 (3.5%) |
| 35 to 39 Years | 119 (17.2%) | 82 (11.9%) |
| 40 to 44 Years | 24 (3.5%) | 40 (5.8%) |
| 45 to 49 Years | 42 (6.1%) | 48 (7.0%) |
| 50 to 54 Years | 52 (7.5%) | 51 (7.4%) |
| 55 to 59 Years | 11 (1.6%) | 41 (5.9%) |
| 60 to 64 Years | 69 (10.0%) | 58 (8.4%) |
| 65 to 69 Years | 9 (1.3%) | 38 (5.5%) |
| 70 to 74 Years | 11 (1.6%) | 41 (5.9%) |
| 75 to 79 Years | 9 (1.3%) | 35 (5.1%) |
| 80 to 84 Years | 17 (2.5%) | 22 (3.2%) |
| 85 Years and over | 1 (0.1%) | 16 (2.3%) |
| Total | 690 (100.0%) | 689 (100.0%) |
Families and Households in Edina
Median Family Size in Edina
The median family size in Edina is 5.36 persons per family, with married-couple families (160 | 78.8%) accounting for the largest median family size of 5.71 persons per family. On the other hand, single female/mother families (34 | 16.8%) represent the smallest median family size with 3.82 persons per family.
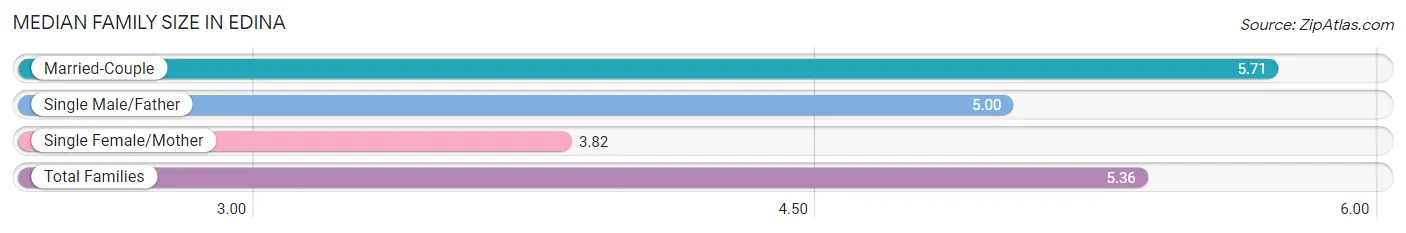
| Family Type | # Families | Family Size |
| Married-Couple | 160 (78.8%) | 5.71 |
| Single Male/Father | 9 (4.4%) | 5.00 |
| Single Female/Mother | 34 (16.8%) | 3.82 |
| Total Families | 203 (100.0%) | 5.36 |
Median Household Size in Edina
The median household size in Edina is 3.34 persons per household, with married-couple households (160 | 40.4%) accounting for the largest median household size of 5.72 persons per household. non-family households (193 | 48.7%) represent the smallest median household size with 1.18 persons per household.
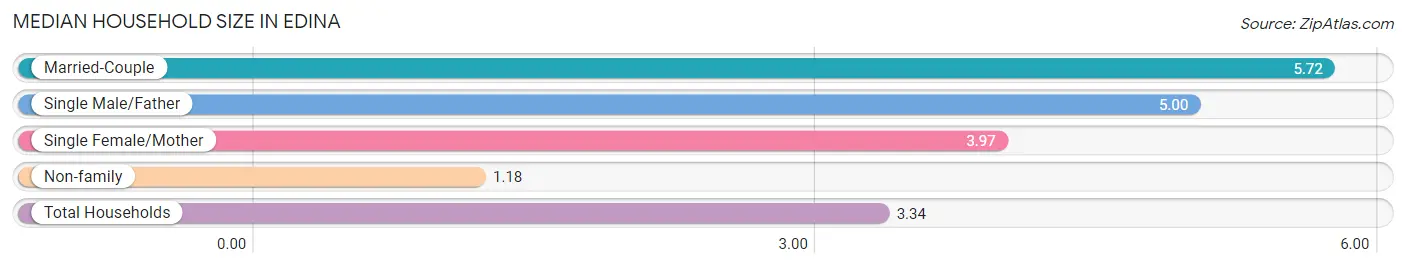
| Household Type | # Households | Household Size |
| Married-Couple | 160 (40.4%) | 5.72 |
| Single Male/Father | 9 (2.3%) | 5.00 |
| Single Female/Mother | 34 (8.6%) | 3.97 |
| Non-family | 193 (48.7%) | 1.18 |
| Total Households | 396 (100.0%) | 3.34 |
Household Size by Marriage Status in Edina
Out of a total of 396 households in Edina, 203 (51.3%) are family households, while 193 (48.7%) are nonfamily households. The most numerous type of family households are 2-person households, comprising 89, and the most common type of nonfamily households are 1-person households, comprising 169.
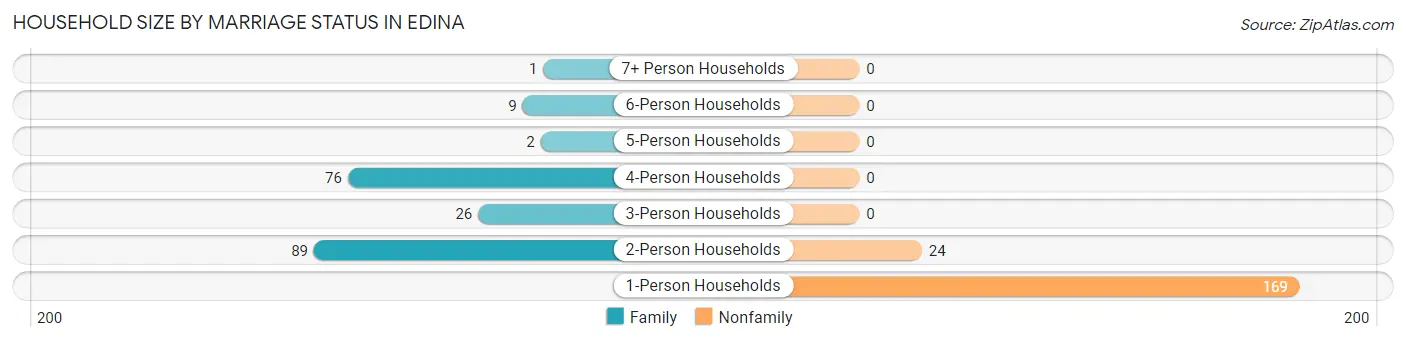
| Household Size | Family Households | Nonfamily Households |
| 1-Person Households | - | 169 (42.7%) |
| 2-Person Households | 89 (22.5%) | 24 (6.1%) |
| 3-Person Households | 26 (6.6%) | 0 (0.0%) |
| 4-Person Households | 76 (19.2%) | 0 (0.0%) |
| 5-Person Households | 2 (0.5%) | 0 (0.0%) |
| 6-Person Households | 9 (2.3%) | 0 (0.0%) |
| 7+ Person Households | 1 (0.3%) | 0 (0.0%) |
| Total | 203 (51.3%) | 193 (48.7%) |
Female Fertility in Edina
Fertility by Age in Edina
Average fertility rate in Edina is 42.0 births per 1,000 women. Women in the age bracket of 20 to 34 years have the highest fertility rate with 208.0 births per 1,000 women. Women in the age bracket of 20 to 34 years acount for 100.0% of all women with births.
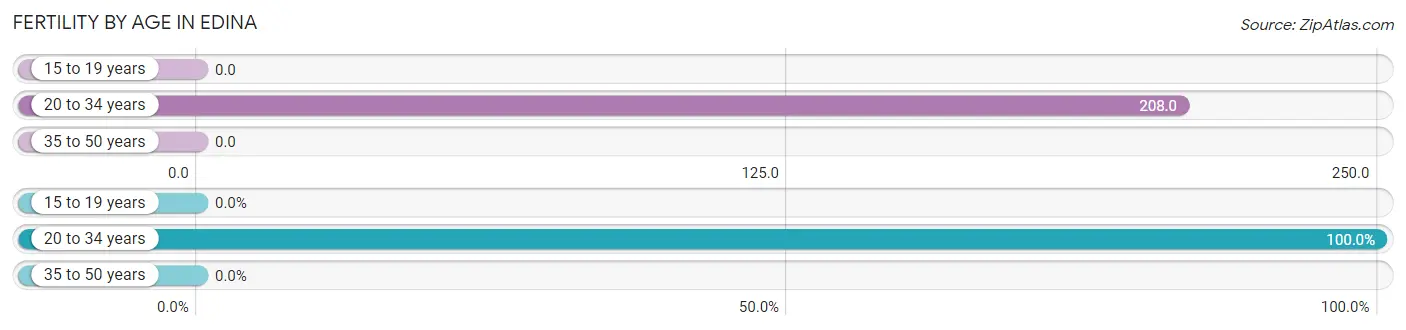
| Age Bracket | Women with Births | Births / 1,000 Women |
| 15 to 19 years | 0 (0.0%) | 0.0 |
| 20 to 34 years | 11 (100.0%) | 208.0 |
| 35 to 50 years | 0 (0.0%) | 0.0 |
| Total | 11 (100.0%) | 42.0 |
Fertility by Age by Marriage Status in Edina
36.4% of women with births (11) in Edina are married. The highest percentage of unmarried women with births falls into 20 to 34 years age bracket with 63.6% of them unmarried at the time of birth, while the lowest percentage of unmarried women with births belong to 20 to 34 years age bracket with 63.6% of them unmarried.
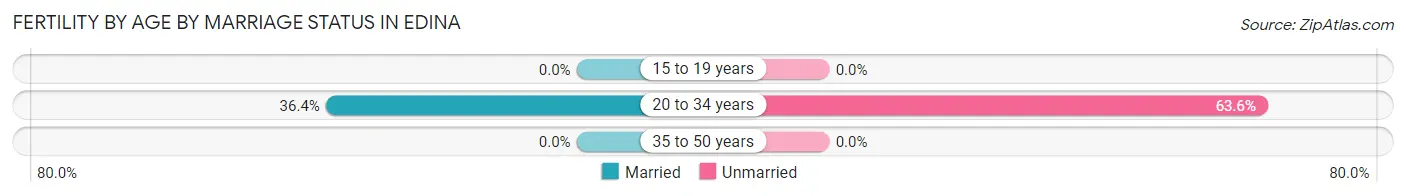
| Age Bracket | Married | Unmarried |
| 15 to 19 years | 0 (0.0%) | 0 (0.0%) |
| 20 to 34 years | 4 (36.4%) | 7 (63.6%) |
| 35 to 50 years | 0 (0.0%) | 0 (0.0%) |
| Total | 4 (36.4%) | 7 (63.6%) |
Fertility by Education in Edina
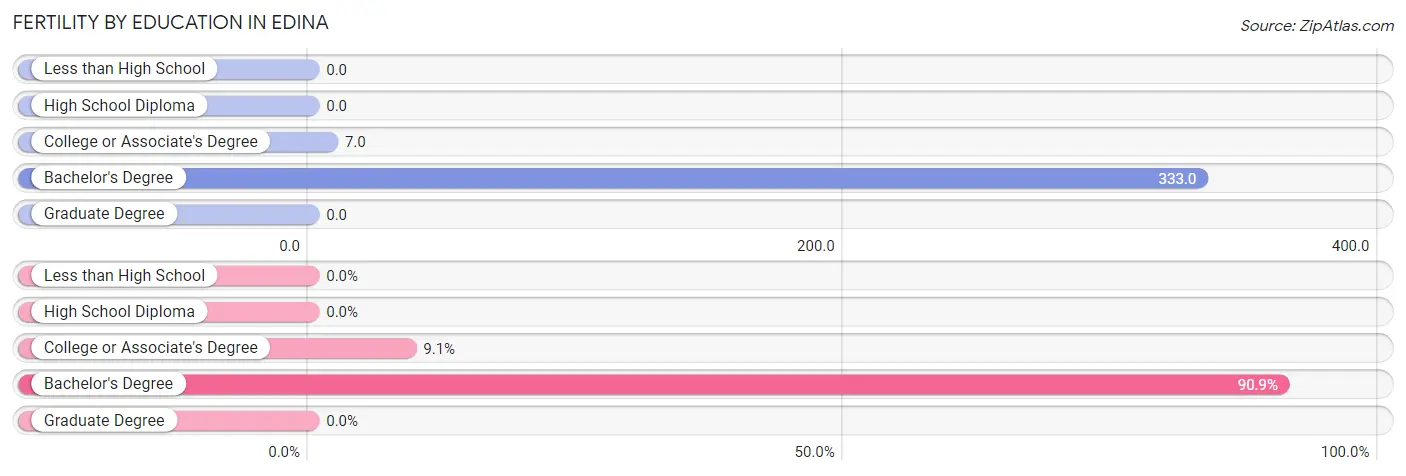
| Educational Attainment | Women with Births | Births / 1,000 Women |
| Less than High School | 0 (0.0%) | 0.0 |
| High School Diploma | 0 (0.0%) | 0.0 |
| College or Associate's Degree | 1 (9.1%) | 7.0 |
| Bachelor's Degree | 10 (90.9%) | 333.0 |
| Graduate Degree | 0 (0.0%) | 0.0 |
| Total | 11 (100.0%) | 42.0 |
Fertility by Education by Marriage Status in Edina
63.6% of women with births in Edina are unmarried. Women with the educational attainment of college or associate's degree are most likely to be married with 100.0% of them married at childbirth, while women with the educational attainment of bachelor's degree are least likely to be married with 70.0% of them unmarried at childbirth.
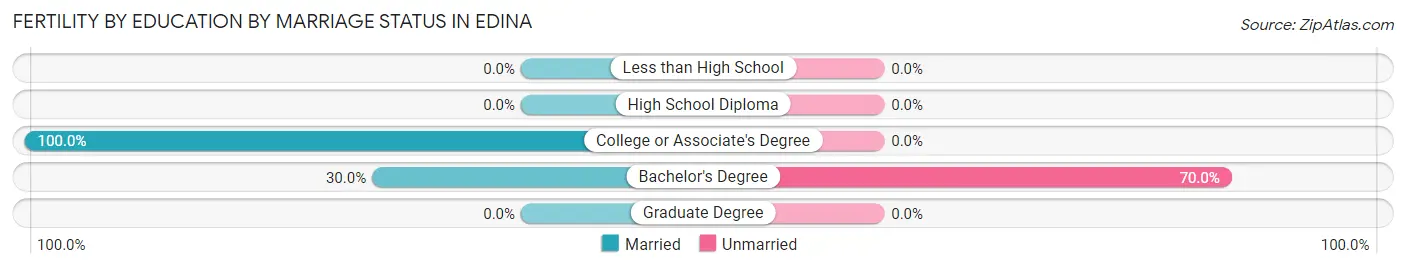
| Educational Attainment | Married | Unmarried |
| Less than High School | 0 (0.0%) | 0 (0.0%) |
| High School Diploma | 0 (0.0%) | 0 (0.0%) |
| College or Associate's Degree | 1 (100.0%) | 0 (0.0%) |
| Bachelor's Degree | 3 (30.0%) | 7 (70.0%) |
| Graduate Degree | 0 (0.0%) | 0 (0.0%) |
| Total | 4 (36.4%) | 7 (63.6%) |
Employment Characteristics in Edina
Employment by Class of Employer in Edina
Among the 617 employed individuals in Edina, private company employees (441 | 71.5%), self-employed (not incorporated) (61 | 9.9%), and not-for-profit organizations (45 | 7.3%) make up the most common classes of employment.
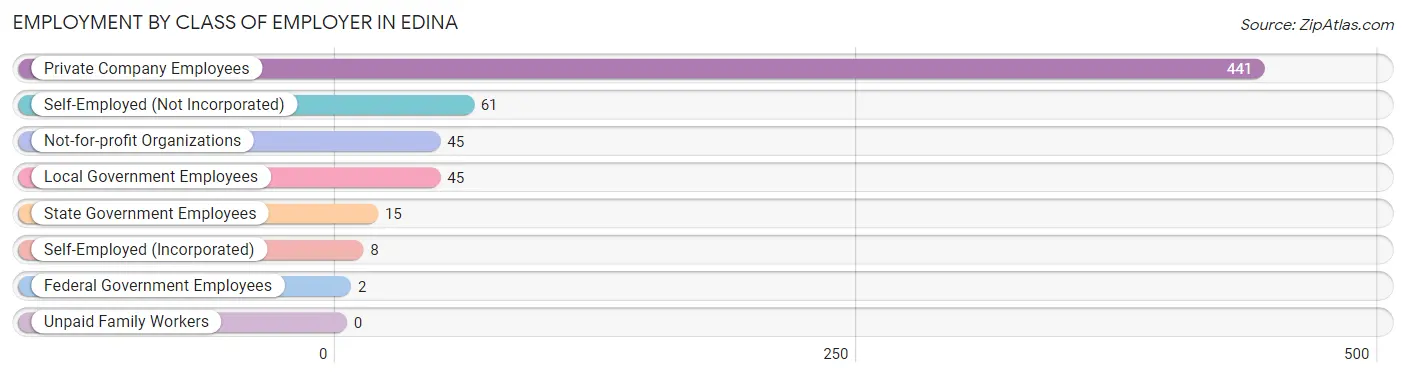
| Employer Class | # Employees | % Employees |
| Private Company Employees | 441 | 71.5% |
| Self-Employed (Incorporated) | 8 | 1.3% |
| Self-Employed (Not Incorporated) | 61 | 9.9% |
| Not-for-profit Organizations | 45 | 7.3% |
| Local Government Employees | 45 | 7.3% |
| State Government Employees | 15 | 2.4% |
| Federal Government Employees | 2 | 0.3% |
| Unpaid Family Workers | 0 | 0.0% |
| Total | 617 | 100.0% |
Employment Status by Age in Edina
According to the labor force statistics for Edina, out of the total population over 16 years of age (1,088), 58.9% or 641 individuals are in the labor force, with 3.4% or 22 of them unemployed. The age group with the highest labor force participation rate is 35 to 44 years, with 94.3% or 250 individuals in the labor force. Within the labor force, the 30 to 34 years age range has the highest percentage of unemployed individuals, with 38.6% or 17 of them being unemployed.
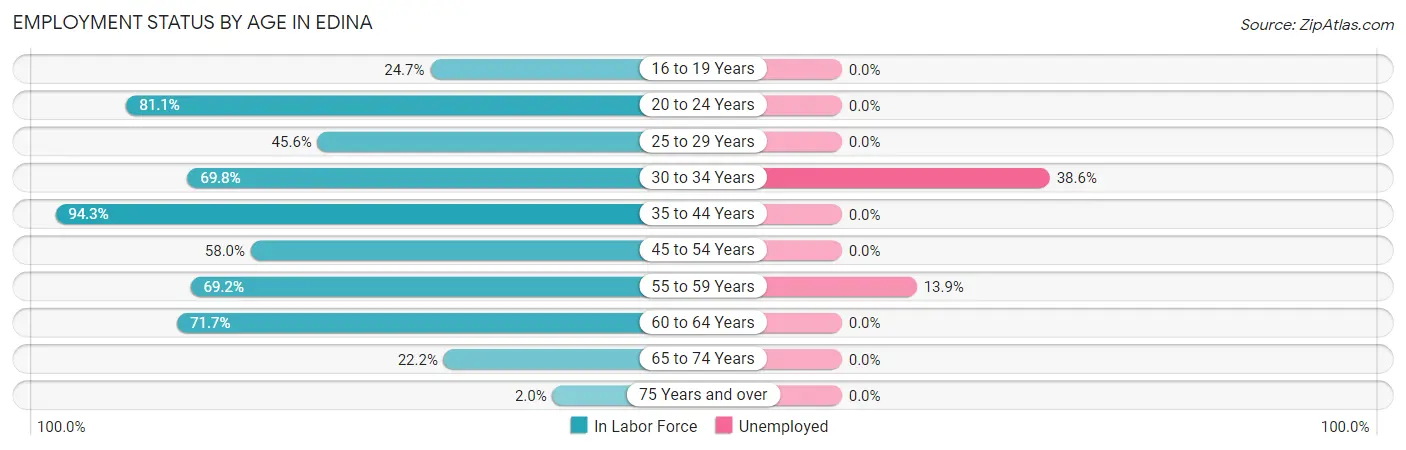
| Age Bracket | In Labor Force | Unemployed |
| 16 to 19 Years | 18 (24.7%) | 0 (0.0%) |
| 20 to 24 Years | 30 (81.1%) | 0 (0.0%) |
| 25 to 29 Years | 36 (45.6%) | 0 (0.0%) |
| 30 to 34 Years | 44 (69.8%) | 17 (38.6%) |
| 35 to 44 Years | 250 (94.3%) | 0 (0.0%) |
| 45 to 54 Years | 112 (58.0%) | 0 (0.0%) |
| 55 to 59 Years | 36 (69.2%) | 5 (13.9%) |
| 60 to 64 Years | 91 (71.7%) | 0 (0.0%) |
| 65 to 74 Years | 22 (22.2%) | 0 (0.0%) |
| 75 Years and over | 2 (2.0%) | 0 (0.0%) |
| Total | 641 (58.9%) | 22 (3.4%) |
Employment Status by Educational Attainment in Edina
According to labor force statistics for Edina, 73.0% of individuals (569) out of the total population between 25 and 64 years of age (779) are in the labor force, with 3.9% or 22 of them being unemployed. The group with the highest labor force participation rate are those with the educational attainment of college / associate degree, with 98.2% or 274 individuals in the labor force. Within the labor force, individuals with college / associate degree education have the highest percentage of unemployment, with 6.2% or 17 of them being unemployed.
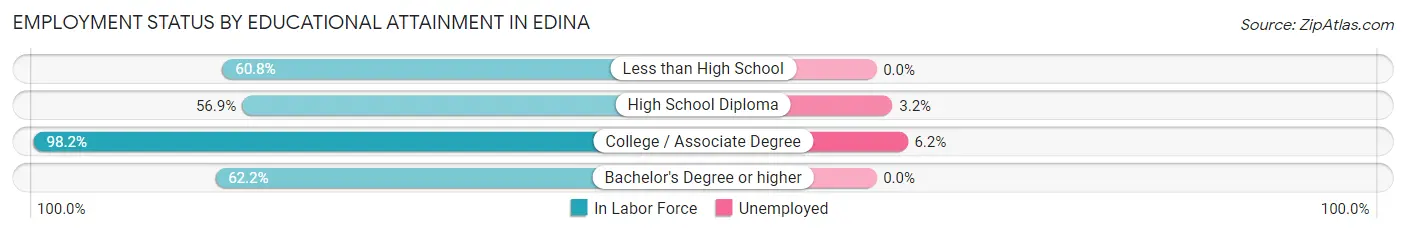
| Educational Attainment | In Labor Force | Unemployed |
| Less than High School | 59 (60.8%) | 0 (0.0%) |
| High School Diploma | 157 (56.9%) | 9 (3.2%) |
| College / Associate Degree | 274 (98.2%) | 17 (6.2%) |
| Bachelor's Degree or higher | 79 (62.2%) | 0 (0.0%) |
| Total | 569 (73.0%) | 30 (3.9%) |
Employment Occupations by Sex in Edina
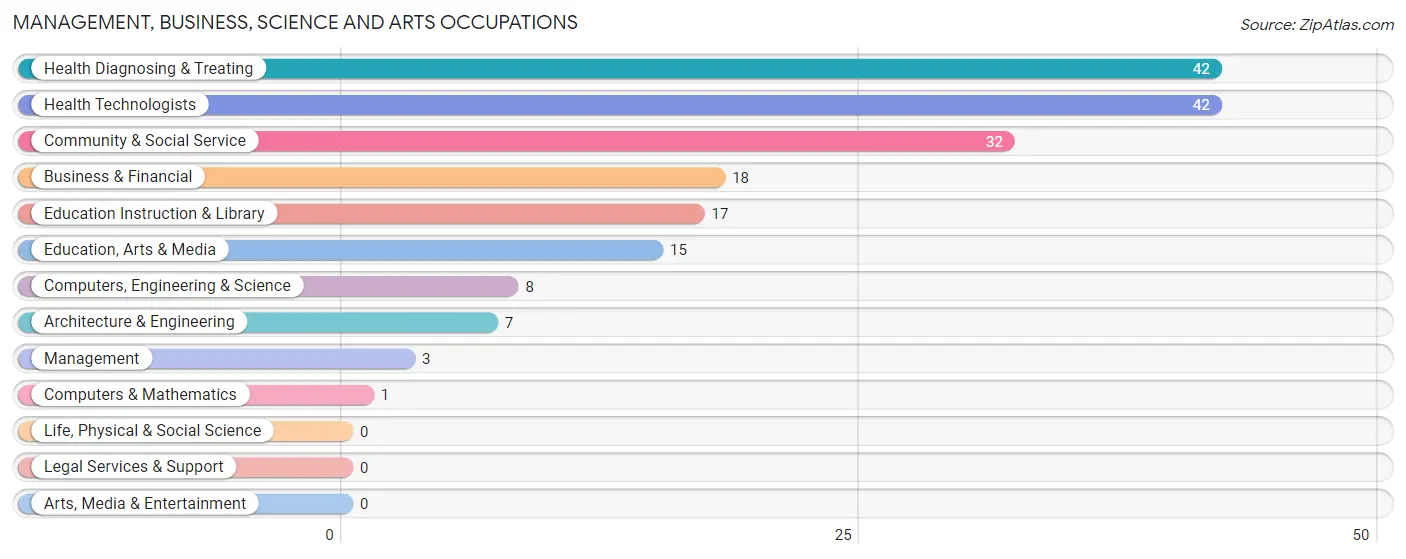
Management, Business, Science and Arts Occupations
The most common Management, Business, Science and Arts occupations in Edina are Health Diagnosing & Treating (42 | 6.8%), Health Technologists (42 | 6.8%), Community & Social Service (32 | 5.2%), Business & Financial (18 | 2.9%), and Education Instruction & Library (17 | 2.8%).
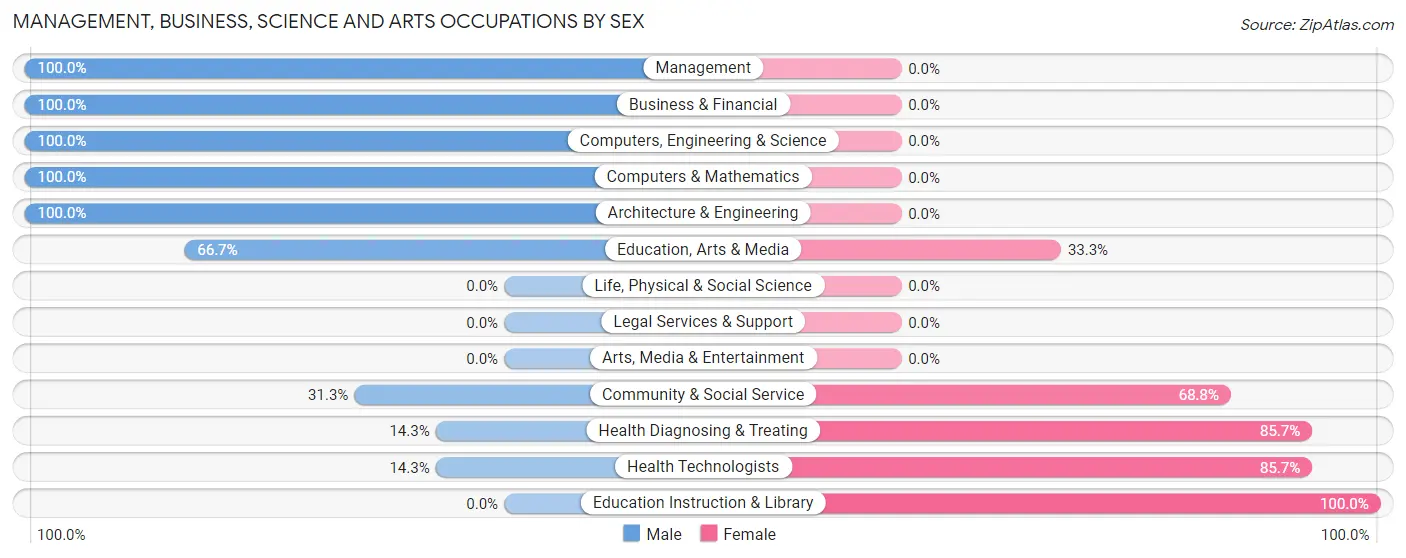
Management, Business, Science and Arts Occupations by Sex
Within the Management, Business, Science and Arts occupations in Edina, the most male-oriented occupations are Management (100.0%), Business & Financial (100.0%), and Computers, Engineering & Science (100.0%), while the most female-oriented occupations are Education Instruction & Library (100.0%), Health Diagnosing & Treating (85.7%), and Health Technologists (85.7%).
| Occupation | Male | Female |
| Management | 3 (100.0%) | 0 (0.0%) |
| Business & Financial | 18 (100.0%) | 0 (0.0%) |
| Computers, Engineering & Science | 8 (100.0%) | 0 (0.0%) |
| Computers & Mathematics | 1 (100.0%) | 0 (0.0%) |
| Architecture & Engineering | 7 (100.0%) | 0 (0.0%) |
| Life, Physical & Social Science | 0 (0.0%) | 0 (0.0%) |
| Community & Social Service | 10 (31.2%) | 22 (68.8%) |
| Education, Arts & Media | 10 (66.7%) | 5 (33.3%) |
| Legal Services & Support | 0 (0.0%) | 0 (0.0%) |
| Education Instruction & Library | 0 (0.0%) | 17 (100.0%) |
| Arts, Media & Entertainment | 0 (0.0%) | 0 (0.0%) |
| Health Diagnosing & Treating | 6 (14.3%) | 36 (85.7%) |
| Health Technologists | 6 (14.3%) | 36 (85.7%) |
| Total (Category) | 45 (43.7%) | 58 (56.3%) |
| Total (Overall) | 327 (52.8%) | 292 (47.2%) |
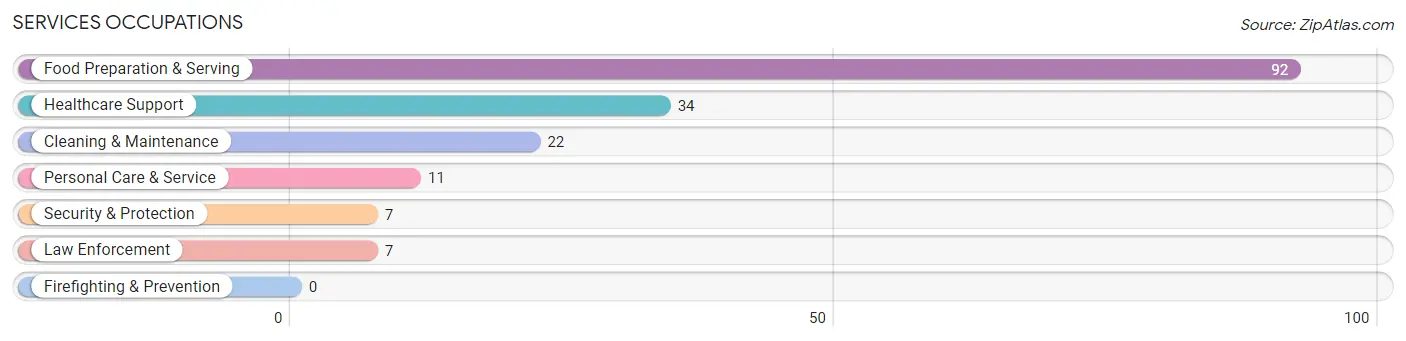
Services Occupations
The most common Services occupations in Edina are Food Preparation & Serving (92 | 14.9%), Healthcare Support (34 | 5.5%), Cleaning & Maintenance (22 | 3.5%), Personal Care & Service (11 | 1.8%), and Security & Protection (7 | 1.1%).
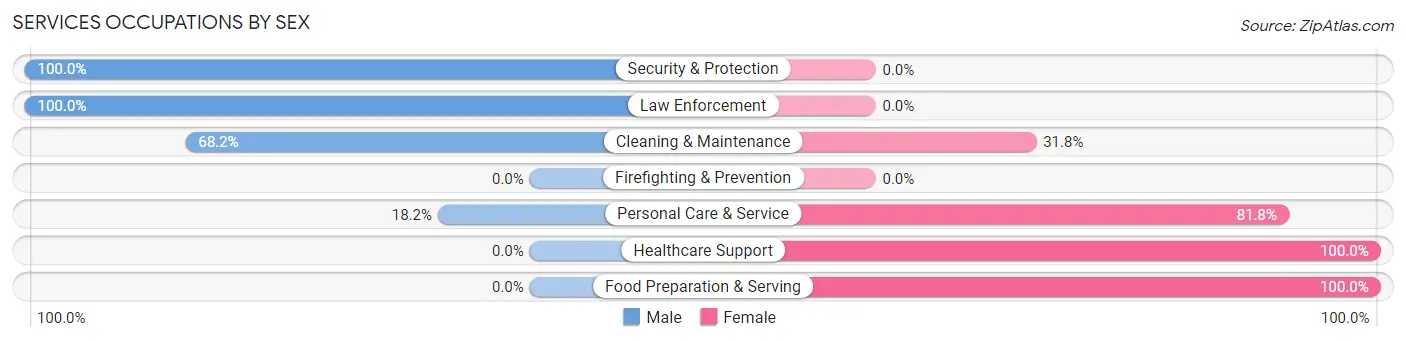
Services Occupations by Sex
Within the Services occupations in Edina, the most male-oriented occupations are Security & Protection (100.0%), Law Enforcement (100.0%), and Cleaning & Maintenance (68.2%), while the most female-oriented occupations are Healthcare Support (100.0%), Food Preparation & Serving (100.0%), and Personal Care & Service (81.8%).
| Occupation | Male | Female |
| Healthcare Support | 0 (0.0%) | 34 (100.0%) |
| Security & Protection | 7 (100.0%) | 0 (0.0%) |
| Firefighting & Prevention | 0 (0.0%) | 0 (0.0%) |
| Law Enforcement | 7 (100.0%) | 0 (0.0%) |
| Food Preparation & Serving | 0 (0.0%) | 92 (100.0%) |
| Cleaning & Maintenance | 15 (68.2%) | 7 (31.8%) |
| Personal Care & Service | 2 (18.2%) | 9 (81.8%) |
| Total (Category) | 24 (14.5%) | 142 (85.5%) |
| Total (Overall) | 327 (52.8%) | 292 (47.2%) |
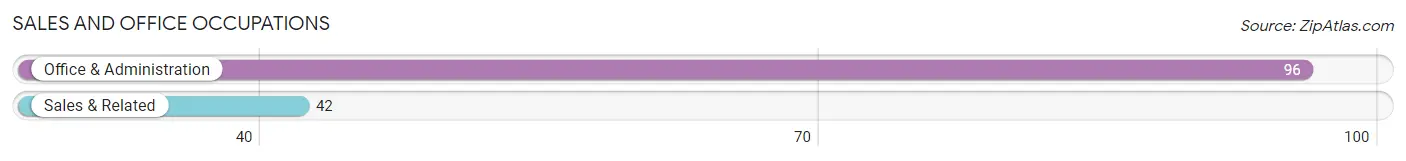
Sales and Office Occupations
The most common Sales and Office occupations in Edina are Office & Administration (96 | 15.5%), and Sales & Related (42 | 6.8%).
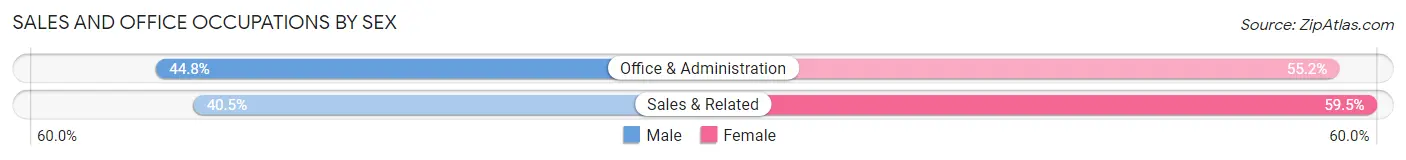
Sales and Office Occupations by Sex
| Occupation | Male | Female |
| Sales & Related | 17 (40.5%) | 25 (59.5%) |
| Office & Administration | 43 (44.8%) | 53 (55.2%) |
| Total (Category) | 60 (43.5%) | 78 (56.5%) |
| Total (Overall) | 327 (52.8%) | 292 (47.2%) |
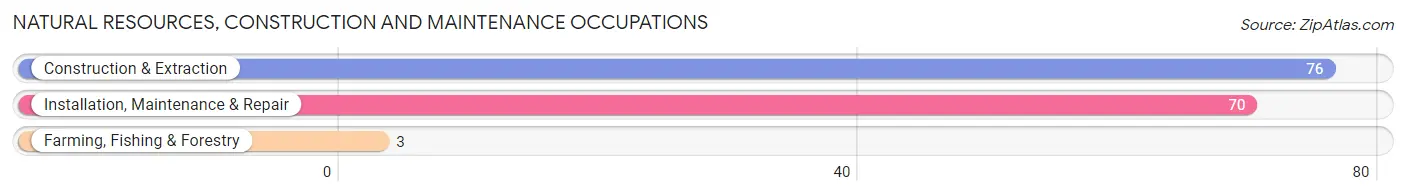
Natural Resources, Construction and Maintenance Occupations
The most common Natural Resources, Construction and Maintenance occupations in Edina are Construction & Extraction (76 | 12.3%), Installation, Maintenance & Repair (70 | 11.3%), and Farming, Fishing & Forestry (3 | 0.5%).
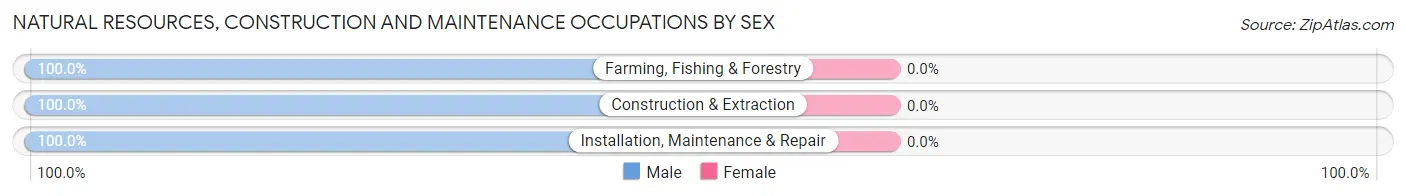
Natural Resources, Construction and Maintenance Occupations by Sex
| Occupation | Male | Female |
| Farming, Fishing & Forestry | 3 (100.0%) | 0 (0.0%) |
| Construction & Extraction | 76 (100.0%) | 0 (0.0%) |
| Installation, Maintenance & Repair | 70 (100.0%) | 0 (0.0%) |
| Total (Category) | 149 (100.0%) | 0 (0.0%) |
| Total (Overall) | 327 (52.8%) | 292 (47.2%) |
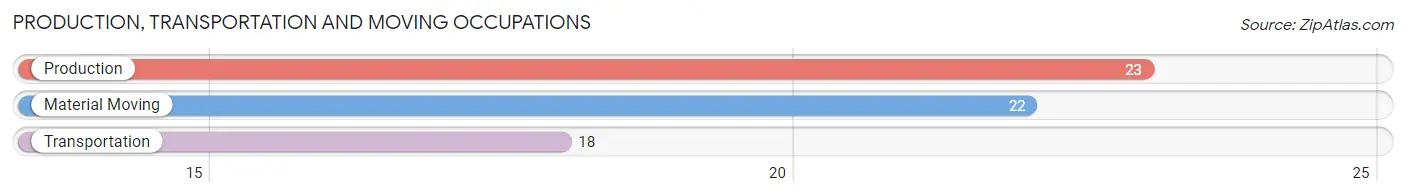
Production, Transportation and Moving Occupations
The most common Production, Transportation and Moving occupations in Edina are Production (23 | 3.7%), Material Moving (22 | 3.5%), and Transportation (18 | 2.9%).
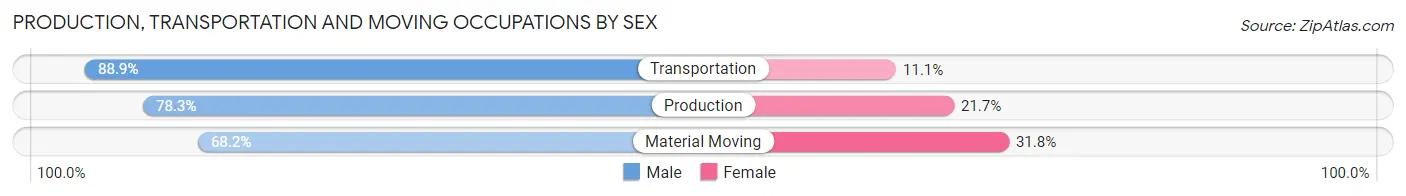
Production, Transportation and Moving Occupations by Sex
| Occupation | Male | Female |
| Production | 18 (78.3%) | 5 (21.7%) |
| Transportation | 16 (88.9%) | 2 (11.1%) |
| Material Moving | 15 (68.2%) | 7 (31.8%) |
| Total (Category) | 49 (77.8%) | 14 (22.2%) |
| Total (Overall) | 327 (52.8%) | 292 (47.2%) |
Employment Industries by Sex in Edina
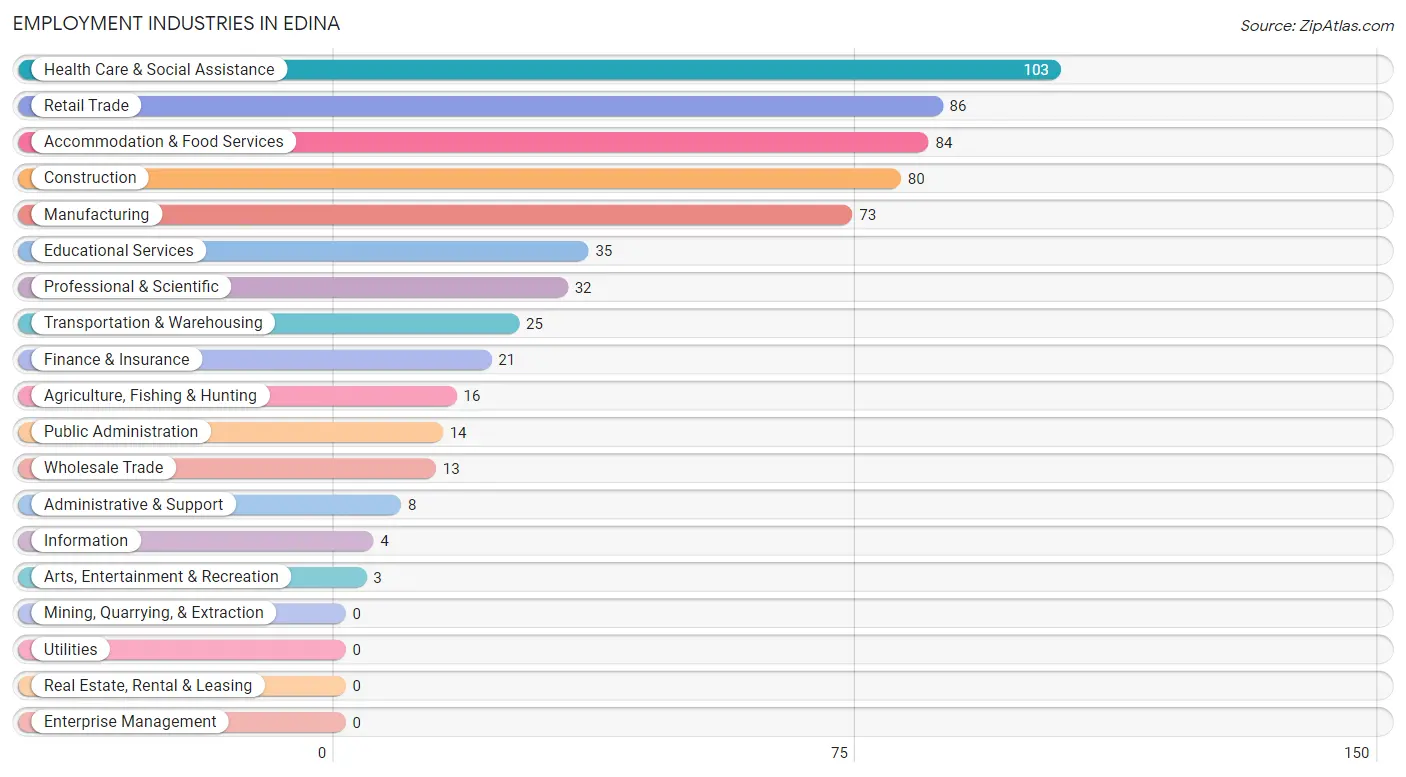
Employment Industries in Edina
The major employment industries in Edina include Health Care & Social Assistance (103 | 16.6%), Retail Trade (86 | 13.9%), Accommodation & Food Services (84 | 13.6%), Construction (80 | 12.9%), and Manufacturing (73 | 11.8%).
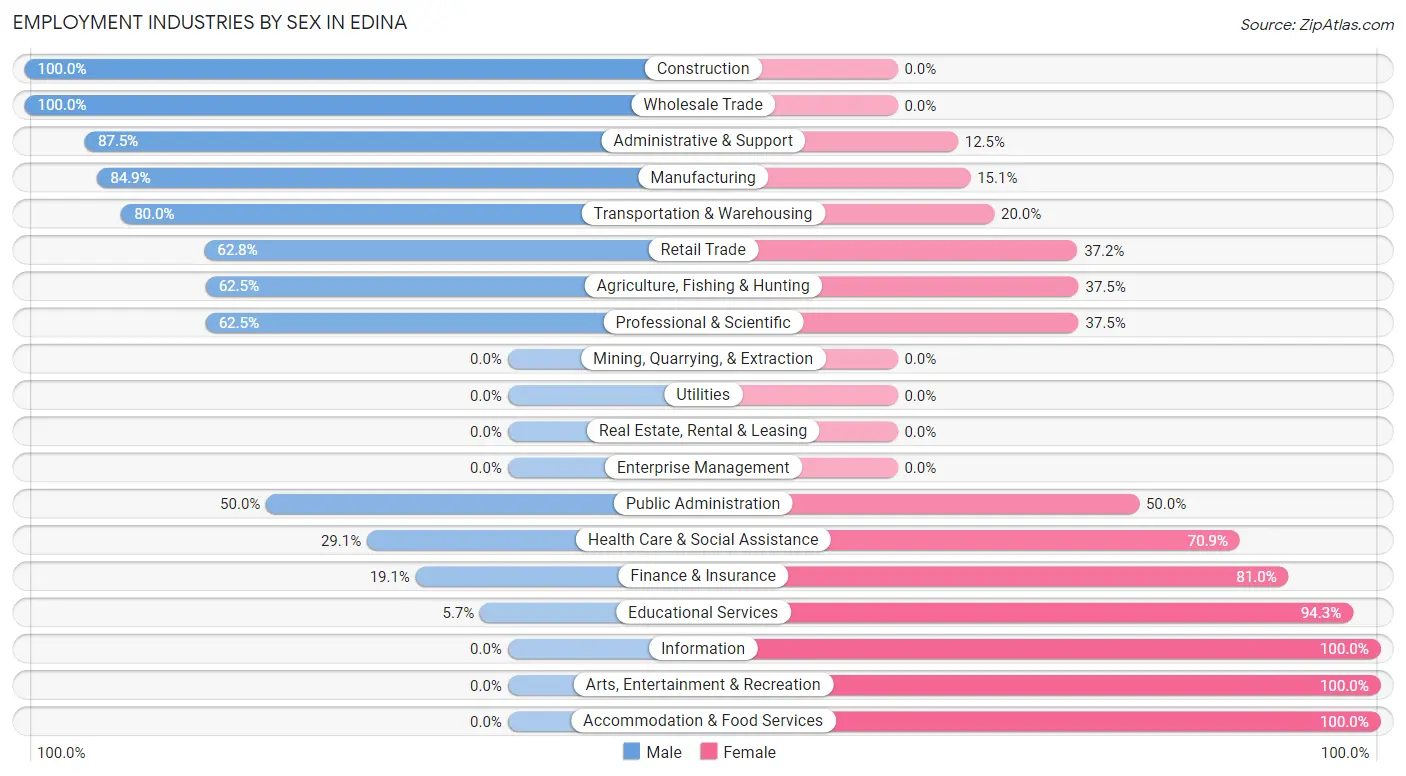
Employment Industries by Sex in Edina
The Edina industries that see more men than women are Construction (100.0%), Wholesale Trade (100.0%), and Administrative & Support (87.5%), whereas the industries that tend to have a higher number of women are Information (100.0%), Arts, Entertainment & Recreation (100.0%), and Accommodation & Food Services (100.0%).
| Industry | Male | Female |
| Agriculture, Fishing & Hunting | 10 (62.5%) | 6 (37.5%) |
| Mining, Quarrying, & Extraction | 0 (0.0%) | 0 (0.0%) |
| Construction | 80 (100.0%) | 0 (0.0%) |
| Manufacturing | 62 (84.9%) | 11 (15.1%) |
| Wholesale Trade | 13 (100.0%) | 0 (0.0%) |
| Retail Trade | 54 (62.8%) | 32 (37.2%) |
| Transportation & Warehousing | 20 (80.0%) | 5 (20.0%) |
| Utilities | 0 (0.0%) | 0 (0.0%) |
| Information | 0 (0.0%) | 4 (100.0%) |
| Finance & Insurance | 4 (19.1%) | 17 (80.9%) |
| Real Estate, Rental & Leasing | 0 (0.0%) | 0 (0.0%) |
| Professional & Scientific | 20 (62.5%) | 12 (37.5%) |
| Enterprise Management | 0 (0.0%) | 0 (0.0%) |
| Administrative & Support | 7 (87.5%) | 1 (12.5%) |
| Educational Services | 2 (5.7%) | 33 (94.3%) |
| Health Care & Social Assistance | 30 (29.1%) | 73 (70.9%) |
| Arts, Entertainment & Recreation | 0 (0.0%) | 3 (100.0%) |
| Accommodation & Food Services | 0 (0.0%) | 84 (100.0%) |
| Public Administration | 7 (50.0%) | 7 (50.0%) |
| Total | 327 (52.8%) | 292 (47.2%) |
Education in Edina
School Enrollment in Edina
The most common levels of schooling among the 266 students in Edina are high school (109 | 41.0%), elementary school (53 | 19.9%), and middle school (48 | 18.0%).
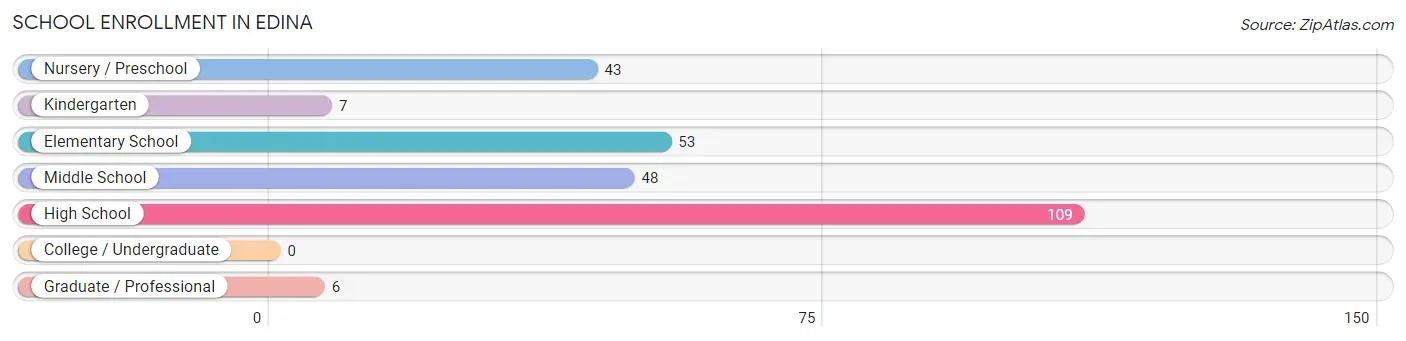
| School Level | # Students | % Students |
| Nursery / Preschool | 43 | 16.2% |
| Kindergarten | 7 | 2.6% |
| Elementary School | 53 | 19.9% |
| Middle School | 48 | 18.0% |
| High School | 109 | 41.0% |
| College / Undergraduate | 0 | 0.0% |
| Graduate / Professional | 6 | 2.3% |
| Total | 266 | 100.0% |
School Enrollment by Age by Funding Source in Edina
Out of a total of 266 students who are enrolled in schools in Edina, 28 (10.5%) attend a private institution, while the remaining 238 (89.5%) are enrolled in public schools. The age group of 35 years and over has the highest likelihood of being enrolled in private schools, with 10 (100.0% in the age bracket) enrolled. Conversely, the age group of 5 to 9 year old has the lowest likelihood of being enrolled in a private school, with 81 (100.0% in the age bracket) attending a public institution.
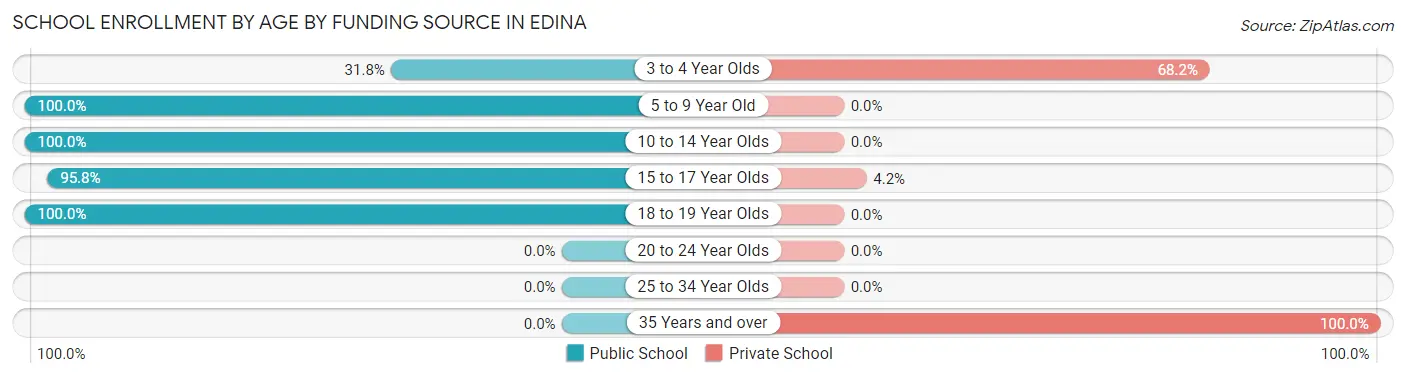
| Age Bracket | Public School | Private School |
| 3 to 4 Year Olds | 7 (31.8%) | 15 (68.2%) |
| 5 to 9 Year Old | 81 (100.0%) | 0 (0.0%) |
| 10 to 14 Year Olds | 75 (100.0%) | 0 (0.0%) |
| 15 to 17 Year Olds | 68 (95.8%) | 3 (4.2%) |
| 18 to 19 Year Olds | 7 (100.0%) | 0 (0.0%) |
| 20 to 24 Year Olds | 0 (0.0%) | 0 (0.0%) |
| 25 to 34 Year Olds | 0 (0.0%) | 0 (0.0%) |
| 35 Years and over | 0 (0.0%) | 10 (100.0%) |
| Total | 238 (89.5%) | 28 (10.5%) |
Educational Attainment by Field of Study in Edina
Education (54 | 31.6%), arts & humanities (18 | 10.5%), computers & mathematics (16 | 9.4%), business (14 | 8.2%), and liberal arts & history (14 | 8.2%) are the most common fields of study among 171 individuals in Edina who have obtained a bachelor's degree or higher.
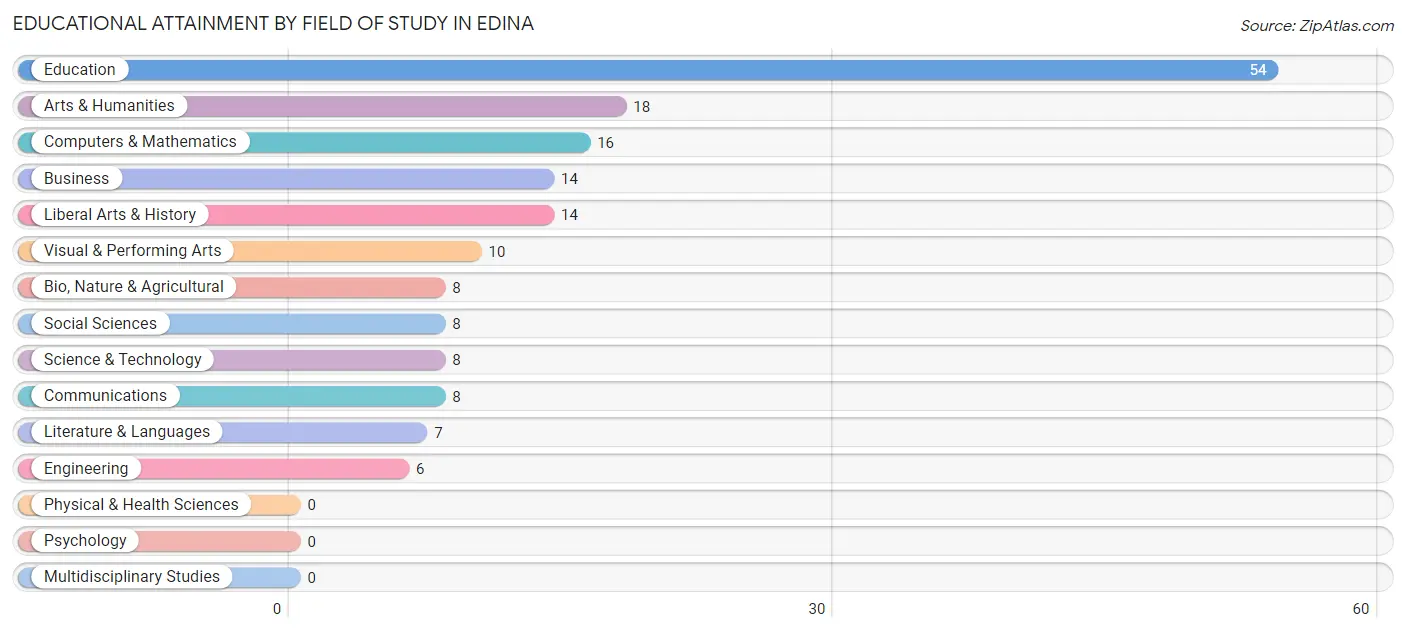
| Field of Study | # Graduates | % Graduates |
| Computers & Mathematics | 16 | 9.4% |
| Bio, Nature & Agricultural | 8 | 4.7% |
| Physical & Health Sciences | 0 | 0.0% |
| Psychology | 0 | 0.0% |
| Social Sciences | 8 | 4.7% |
| Engineering | 6 | 3.5% |
| Multidisciplinary Studies | 0 | 0.0% |
| Science & Technology | 8 | 4.7% |
| Business | 14 | 8.2% |
| Education | 54 | 31.6% |
| Literature & Languages | 7 | 4.1% |
| Liberal Arts & History | 14 | 8.2% |
| Visual & Performing Arts | 10 | 5.9% |
| Communications | 8 | 4.7% |
| Arts & Humanities | 18 | 10.5% |
| Total | 171 | 100.0% |
Transportation & Commute in Edina
Vehicle Availability by Sex in Edina
The most prevalent vehicle ownership categories in Edina are males with 5 or more vehicles (122, accounting for 38.9%) and females with 5 or more vehicles (35, making up 41.8%).
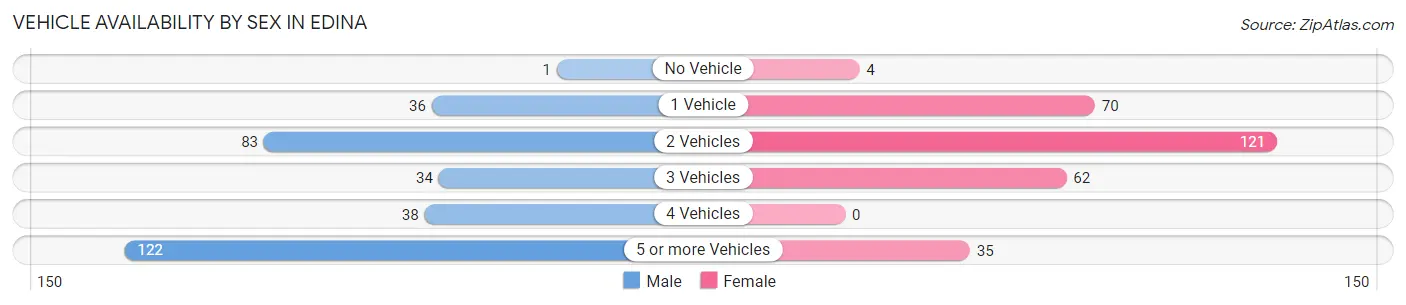
| Vehicles Available | Male | Female |
| No Vehicle | 1 (0.3%) | 4 (1.4%) |
| 1 Vehicle | 36 (11.5%) | 70 (24.0%) |
| 2 Vehicles | 83 (26.4%) | 121 (41.4%) |
| 3 Vehicles | 34 (10.8%) | 62 (21.2%) |
| 4 Vehicles | 38 (12.1%) | 0 (0.0%) |
| 5 or more Vehicles | 122 (38.9%) | 35 (12.0%) |
| Total | 314 (100.0%) | 292 (100.0%) |
Commute Time in Edina
The most frequently occuring commute durations in Edina are 10 to 14 minutes (149 commuters, 28.3%), less than 5 minutes (83 commuters, 15.8%), and 5 to 9 minutes (69 commuters, 13.1%).
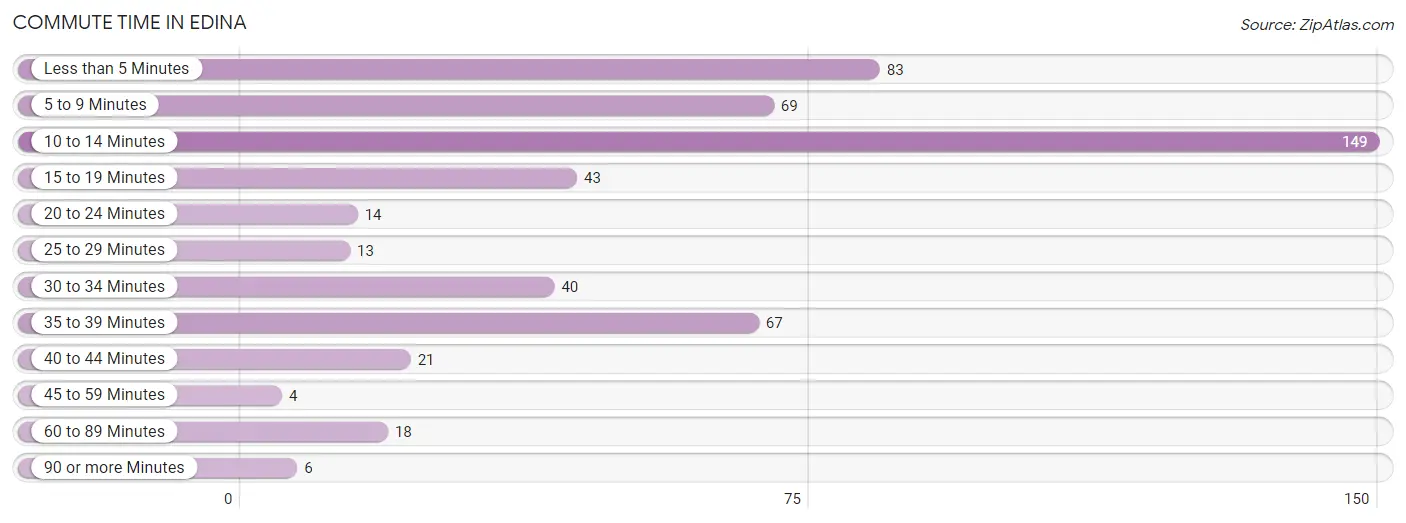
| Commute Time | # Commuters | % Commuters |
| Less than 5 Minutes | 83 | 15.8% |
| 5 to 9 Minutes | 69 | 13.1% |
| 10 to 14 Minutes | 149 | 28.3% |
| 15 to 19 Minutes | 43 | 8.2% |
| 20 to 24 Minutes | 14 | 2.7% |
| 25 to 29 Minutes | 13 | 2.5% |
| 30 to 34 Minutes | 40 | 7.6% |
| 35 to 39 Minutes | 67 | 12.7% |
| 40 to 44 Minutes | 21 | 4.0% |
| 45 to 59 Minutes | 4 | 0.8% |
| 60 to 89 Minutes | 18 | 3.4% |
| 90 or more Minutes | 6 | 1.1% |
Commute Time by Sex in Edina
The most common commute times in Edina are 10 to 14 minutes (72 commuters, 25.9%) for males and 10 to 14 minutes (77 commuters, 30.9%) for females.
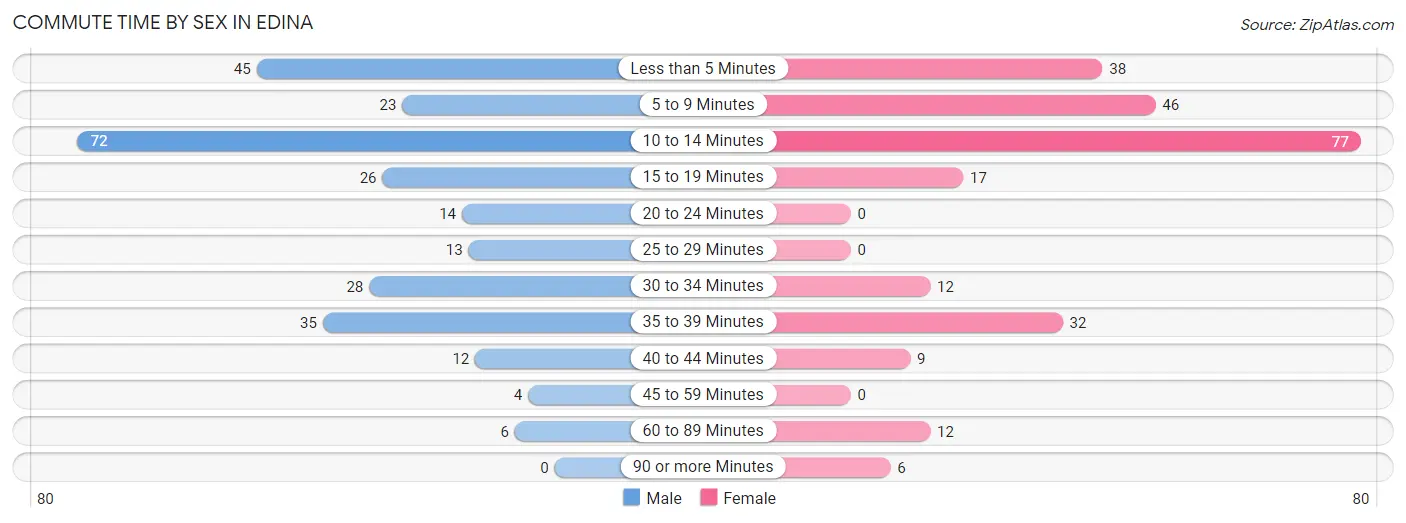
| Commute Time | Male | Female |
| Less than 5 Minutes | 45 (16.2%) | 38 (15.3%) |
| 5 to 9 Minutes | 23 (8.3%) | 46 (18.5%) |
| 10 to 14 Minutes | 72 (25.9%) | 77 (30.9%) |
| 15 to 19 Minutes | 26 (9.3%) | 17 (6.8%) |
| 20 to 24 Minutes | 14 (5.0%) | 0 (0.0%) |
| 25 to 29 Minutes | 13 (4.7%) | 0 (0.0%) |
| 30 to 34 Minutes | 28 (10.1%) | 12 (4.8%) |
| 35 to 39 Minutes | 35 (12.6%) | 32 (12.9%) |
| 40 to 44 Minutes | 12 (4.3%) | 9 (3.6%) |
| 45 to 59 Minutes | 4 (1.4%) | 0 (0.0%) |
| 60 to 89 Minutes | 6 (2.2%) | 12 (4.8%) |
| 90 or more Minutes | 0 (0.0%) | 6 (2.4%) |
Time of Departure to Work by Sex in Edina
The most frequent times of departure to work in Edina are 5:30 AM to 5:59 AM (77, 27.7%) for males and 6:30 AM to 6:59 AM (91, 36.5%) for females.
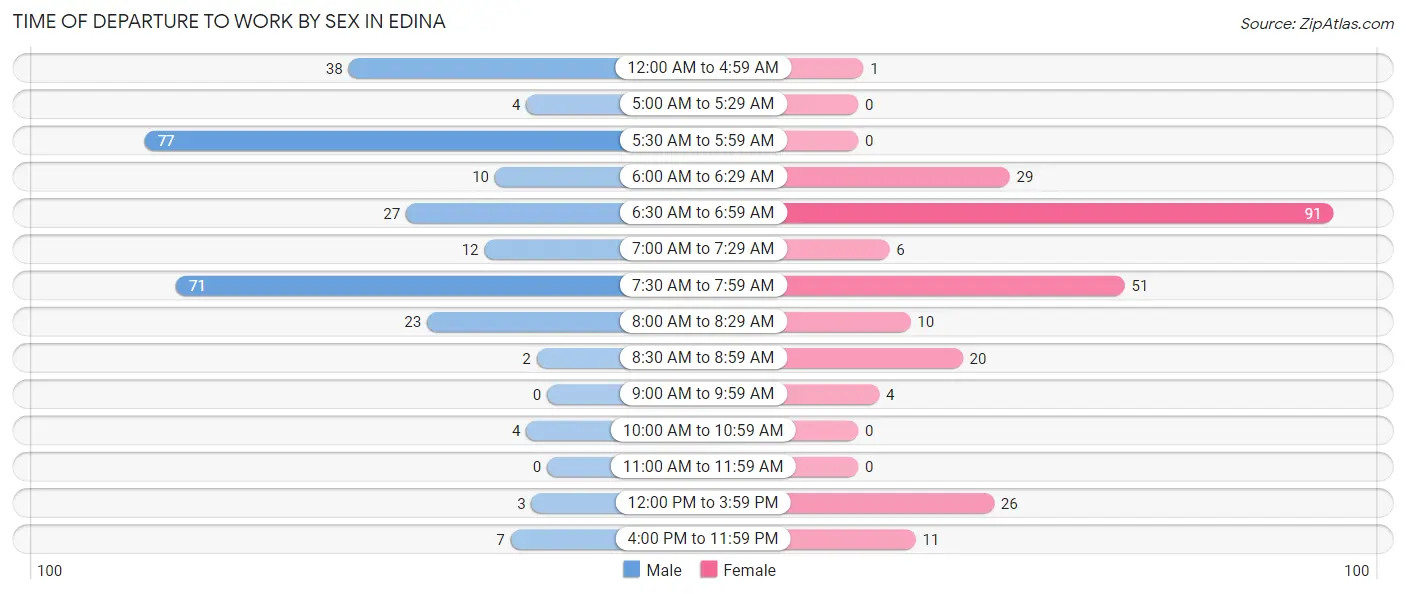
| Time of Departure | Male | Female |
| 12:00 AM to 4:59 AM | 38 (13.7%) | 1 (0.4%) |
| 5:00 AM to 5:29 AM | 4 (1.4%) | 0 (0.0%) |
| 5:30 AM to 5:59 AM | 77 (27.7%) | 0 (0.0%) |
| 6:00 AM to 6:29 AM | 10 (3.6%) | 29 (11.7%) |
| 6:30 AM to 6:59 AM | 27 (9.7%) | 91 (36.5%) |
| 7:00 AM to 7:29 AM | 12 (4.3%) | 6 (2.4%) |
| 7:30 AM to 7:59 AM | 71 (25.5%) | 51 (20.5%) |
| 8:00 AM to 8:29 AM | 23 (8.3%) | 10 (4.0%) |
| 8:30 AM to 8:59 AM | 2 (0.7%) | 20 (8.0%) |
| 9:00 AM to 9:59 AM | 0 (0.0%) | 4 (1.6%) |
| 10:00 AM to 10:59 AM | 4 (1.4%) | 0 (0.0%) |
| 11:00 AM to 11:59 AM | 0 (0.0%) | 0 (0.0%) |
| 12:00 PM to 3:59 PM | 3 (1.1%) | 26 (10.4%) |
| 4:00 PM to 11:59 PM | 7 (2.5%) | 11 (4.4%) |
| Total | 278 (100.0%) | 249 (100.0%) |
Housing Occupancy in Edina
Occupancy by Ownership in Edina
Of the total 396 dwellings in Edina, owner-occupied units account for 312 (78.8%), while renter-occupied units make up 84 (21.2%).
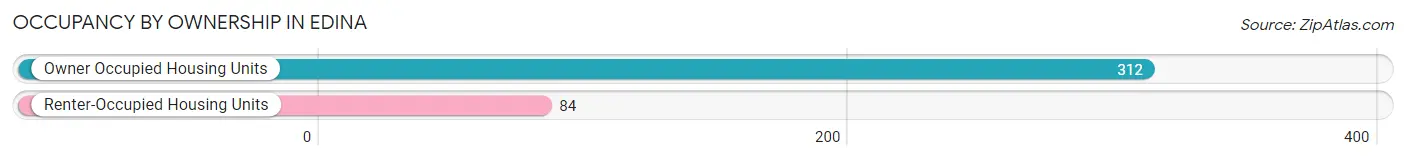
| Occupancy | # Housing Units | % Housing Units |
| Owner Occupied Housing Units | 312 | 78.8% |
| Renter-Occupied Housing Units | 84 | 21.2% |
| Total Occupied Housing Units | 396 | 100.0% |
Occupancy by Household Size in Edina

| Household Size | # Housing Units | % Housing Units |
| 1-Person Household | 169 | 42.7% |
| 2-Person Household | 113 | 28.5% |
| 3-Person Household | 26 | 6.6% |
| 4+ Person Household | 88 | 22.2% |
| Total Housing Units | 396 | 100.0% |
Occupancy by Ownership by Household Size in Edina
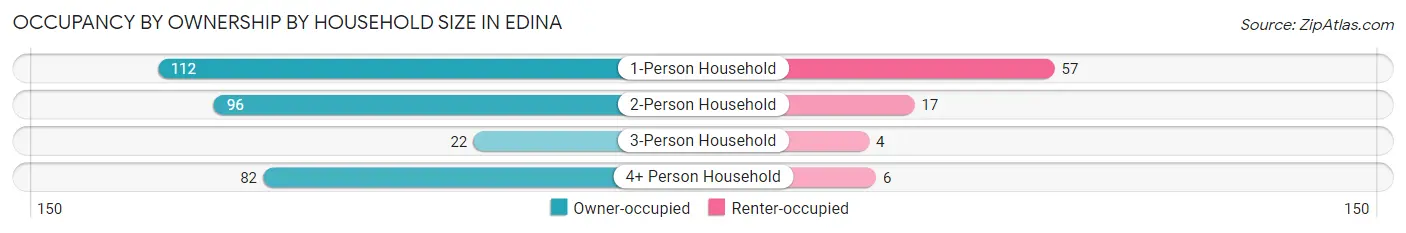
| Household Size | Owner-occupied | Renter-occupied |
| 1-Person Household | 112 (66.3%) | 57 (33.7%) |
| 2-Person Household | 96 (85.0%) | 17 (15.0%) |
| 3-Person Household | 22 (84.6%) | 4 (15.4%) |
| 4+ Person Household | 82 (93.2%) | 6 (6.8%) |
| Total Housing Units | 312 (78.8%) | 84 (21.2%) |
Occupancy by Educational Attainment in Edina
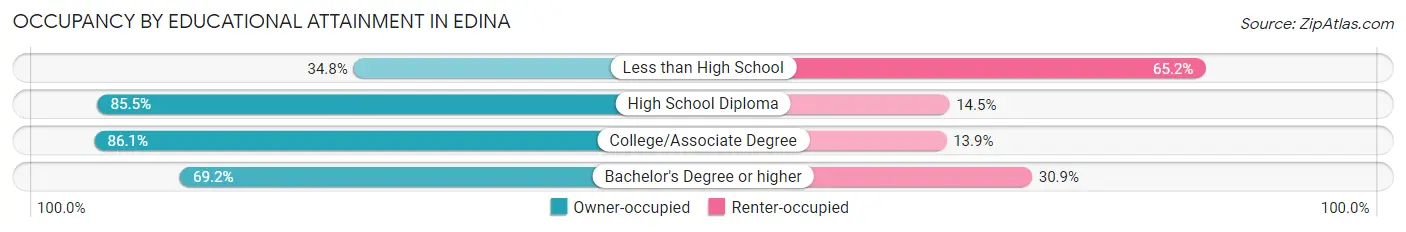
| Household Size | Owner-occupied | Renter-occupied |
| Less than High School | 8 (34.8%) | 15 (65.2%) |
| High School Diploma | 177 (85.5%) | 30 (14.5%) |
| College/Associate Degree | 62 (86.1%) | 10 (13.9%) |
| Bachelor's Degree or higher | 65 (69.2%) | 29 (30.8%) |
Occupancy by Age of Householder in Edina
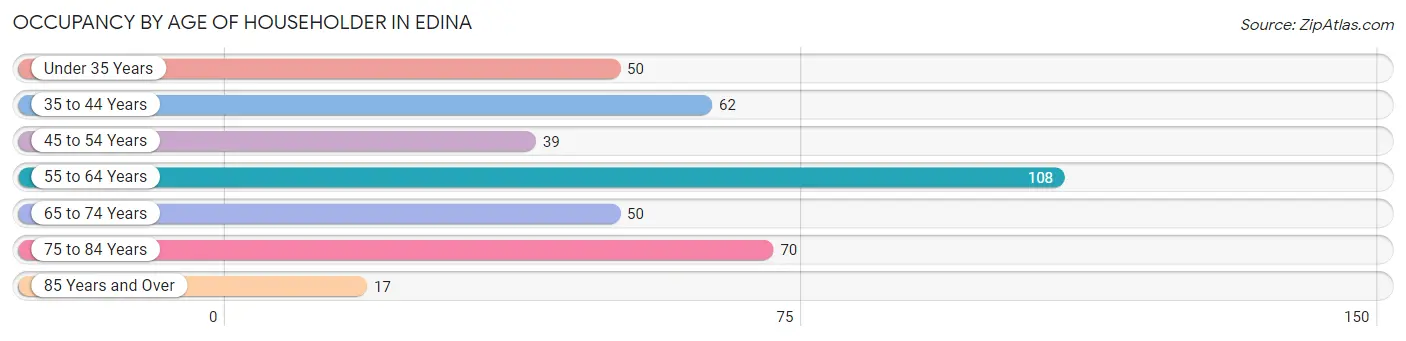
| Age Bracket | # Households | % Households |
| Under 35 Years | 50 | 12.6% |
| 35 to 44 Years | 62 | 15.7% |
| 45 to 54 Years | 39 | 9.9% |
| 55 to 64 Years | 108 | 27.3% |
| 65 to 74 Years | 50 | 12.6% |
| 75 to 84 Years | 70 | 17.7% |
| 85 Years and Over | 17 | 4.3% |
| Total | 396 | 100.0% |
Housing Finances in Edina
Median Income by Occupancy in Edina
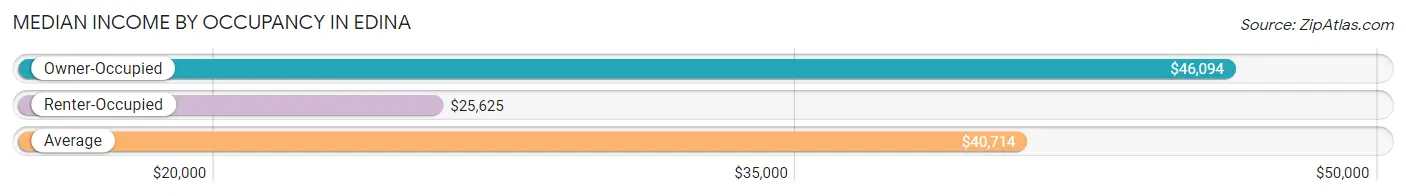
| Occupancy Type | # Households | Median Income |
| Owner-Occupied | 312 (78.8%) | $46,094 |
| Renter-Occupied | 84 (21.2%) | $25,625 |
| Average | 396 (100.0%) | $40,714 |
Occupancy by Householder Income Bracket in Edina
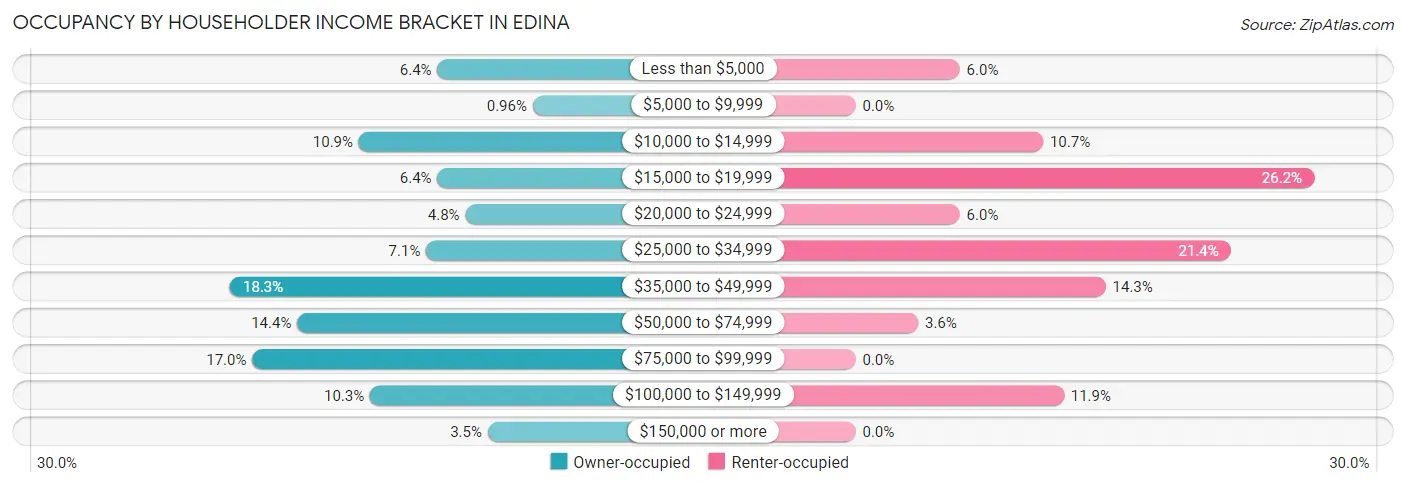
| Income Bracket | Owner-occupied | Renter-occupied |
| Less than $5,000 | 20 (6.4%) | 5 (5.9%) |
| $5,000 to $9,999 | 3 (1.0%) | 0 (0.0%) |
| $10,000 to $14,999 | 34 (10.9%) | 9 (10.7%) |
| $15,000 to $19,999 | 20 (6.4%) | 22 (26.2%) |
| $20,000 to $24,999 | 15 (4.8%) | 5 (5.9%) |
| $25,000 to $34,999 | 22 (7.0%) | 18 (21.4%) |
| $35,000 to $49,999 | 57 (18.3%) | 12 (14.3%) |
| $50,000 to $74,999 | 45 (14.4%) | 3 (3.6%) |
| $75,000 to $99,999 | 53 (17.0%) | 0 (0.0%) |
| $100,000 to $149,999 | 32 (10.3%) | 10 (11.9%) |
| $150,000 or more | 11 (3.5%) | 0 (0.0%) |
| Total | 312 (100.0%) | 84 (100.0%) |
Monthly Housing Cost Tiers in Edina
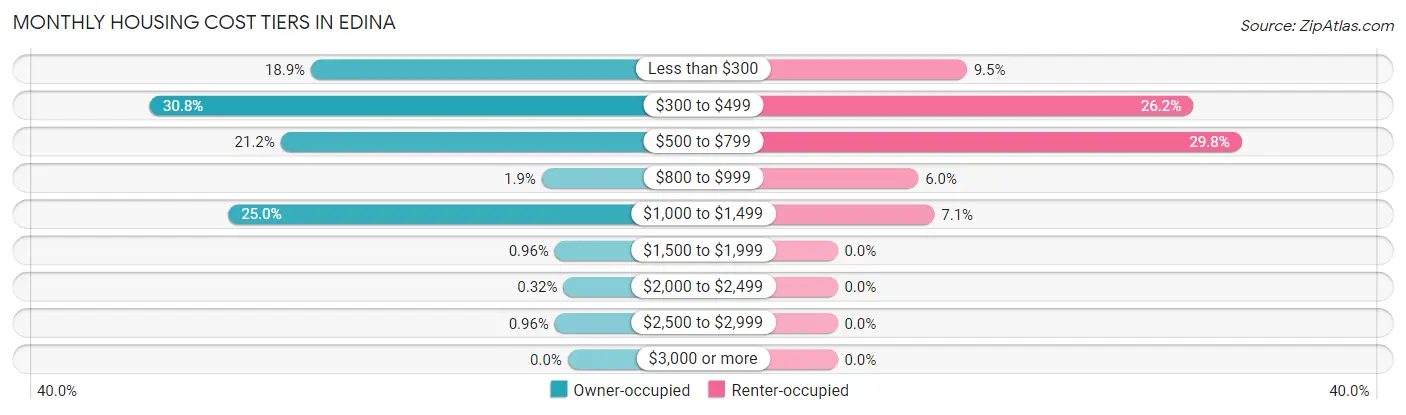
| Monthly Cost | Owner-occupied | Renter-occupied |
| Less than $300 | 59 (18.9%) | 8 (9.5%) |
| $300 to $499 | 96 (30.8%) | 22 (26.2%) |
| $500 to $799 | 66 (21.1%) | 25 (29.8%) |
| $800 to $999 | 6 (1.9%) | 5 (5.9%) |
| $1,000 to $1,499 | 78 (25.0%) | 6 (7.1%) |
| $1,500 to $1,999 | 3 (1.0%) | 0 (0.0%) |
| $2,000 to $2,499 | 1 (0.3%) | 0 (0.0%) |
| $2,500 to $2,999 | 3 (1.0%) | 0 (0.0%) |
| $3,000 or more | 0 (0.0%) | 0 (0.0%) |
| Total | 312 (100.0%) | 84 (100.0%) |
Physical Housing Characteristics in Edina
Housing Structures in Edina
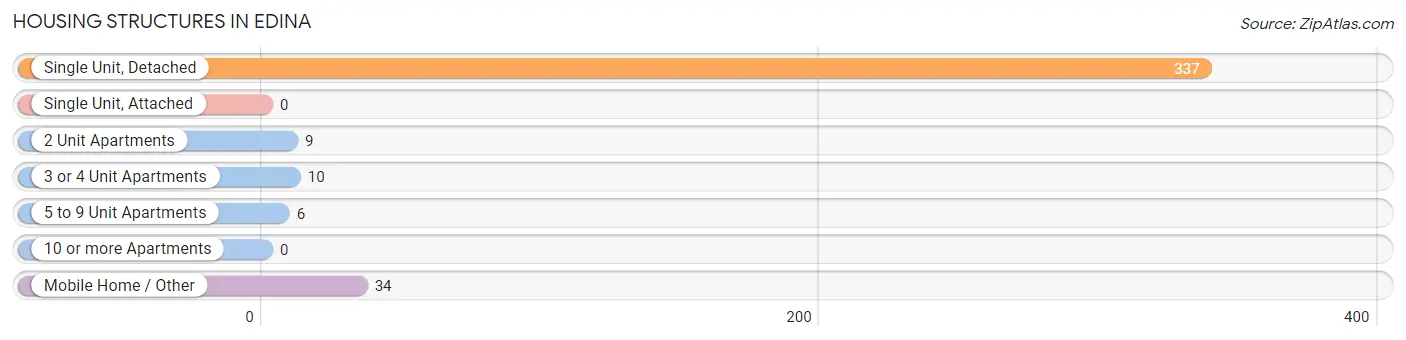
| Structure Type | # Housing Units | % Housing Units |
| Single Unit, Detached | 337 | 85.1% |
| Single Unit, Attached | 0 | 0.0% |
| 2 Unit Apartments | 9 | 2.3% |
| 3 or 4 Unit Apartments | 10 | 2.5% |
| 5 to 9 Unit Apartments | 6 | 1.5% |
| 10 or more Apartments | 0 | 0.0% |
| Mobile Home / Other | 34 | 8.6% |
| Total | 396 | 100.0% |
Housing Structures by Occupancy in Edina
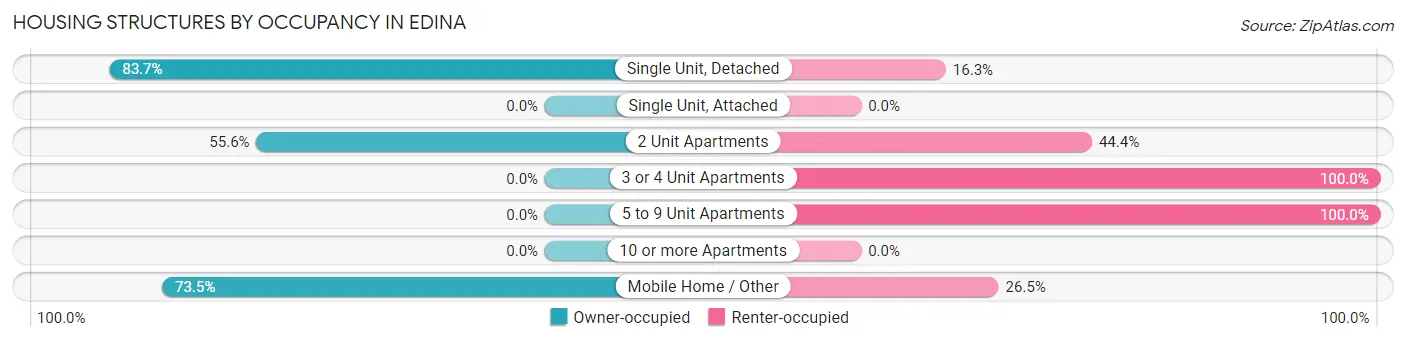
| Structure Type | Owner-occupied | Renter-occupied |
| Single Unit, Detached | 282 (83.7%) | 55 (16.3%) |
| Single Unit, Attached | 0 (0.0%) | 0 (0.0%) |
| 2 Unit Apartments | 5 (55.6%) | 4 (44.4%) |
| 3 or 4 Unit Apartments | 0 (0.0%) | 10 (100.0%) |
| 5 to 9 Unit Apartments | 0 (0.0%) | 6 (100.0%) |
| 10 or more Apartments | 0 (0.0%) | 0 (0.0%) |
| Mobile Home / Other | 25 (73.5%) | 9 (26.5%) |
| Total | 312 (78.8%) | 84 (21.2%) |
Housing Structures by Number of Rooms in Edina
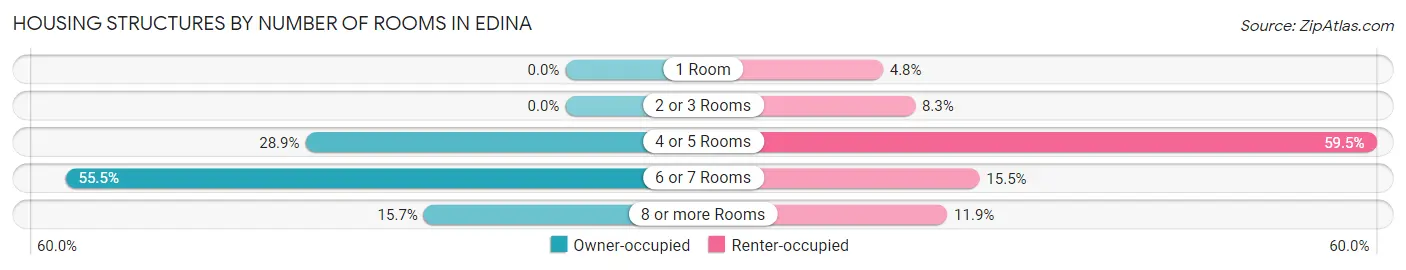
| Number of Rooms | Owner-occupied | Renter-occupied |
| 1 Room | 0 (0.0%) | 4 (4.8%) |
| 2 or 3 Rooms | 0 (0.0%) | 7 (8.3%) |
| 4 or 5 Rooms | 90 (28.8%) | 50 (59.5%) |
| 6 or 7 Rooms | 173 (55.4%) | 13 (15.5%) |
| 8 or more Rooms | 49 (15.7%) | 10 (11.9%) |
| Total | 312 (100.0%) | 84 (100.0%) |
Housing Structure by Heating Type in Edina
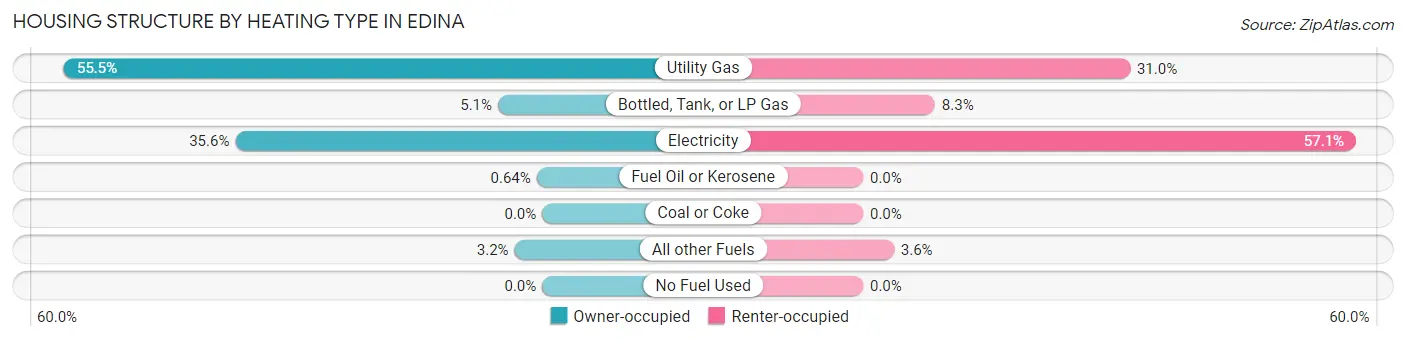
| Heating Type | Owner-occupied | Renter-occupied |
| Utility Gas | 173 (55.4%) | 26 (30.9%) |
| Bottled, Tank, or LP Gas | 16 (5.1%) | 7 (8.3%) |
| Electricity | 111 (35.6%) | 48 (57.1%) |
| Fuel Oil or Kerosene | 2 (0.6%) | 0 (0.0%) |
| Coal or Coke | 0 (0.0%) | 0 (0.0%) |
| All other Fuels | 10 (3.2%) | 3 (3.6%) |
| No Fuel Used | 0 (0.0%) | 0 (0.0%) |
| Total | 312 (100.0%) | 84 (100.0%) |
Household Vehicle Usage in Edina
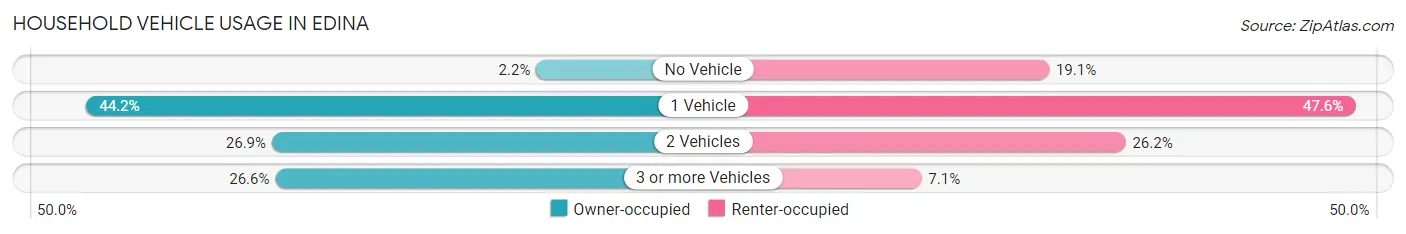
| Vehicles per Household | Owner-occupied | Renter-occupied |
| No Vehicle | 7 (2.2%) | 16 (19.1%) |
| 1 Vehicle | 138 (44.2%) | 40 (47.6%) |
| 2 Vehicles | 84 (26.9%) | 22 (26.2%) |
| 3 or more Vehicles | 83 (26.6%) | 6 (7.1%) |
| Total | 312 (100.0%) | 84 (100.0%) |
Real Estate & Mortgages in Edina
Real Estate and Mortgage Overview in Edina
| Characteristic | Without Mortgage | With Mortgage |
| Housing Units | 171 | 141 |
| Median Property Value | $66,900 | $87,200 |
| Median Household Income | $39,911 | $5 |
| Monthly Housing Costs | $344 | $0 |
| Real Estate Taxes | $612 | $5 |
Property Value by Mortgage Status in Edina
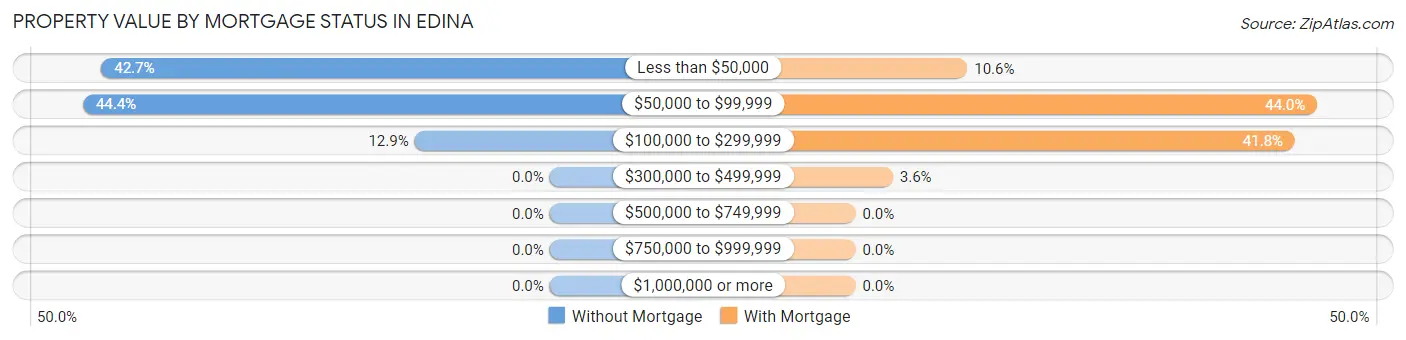
| Property Value | Without Mortgage | With Mortgage |
| Less than $50,000 | 73 (42.7%) | 15 (10.6%) |
| $50,000 to $99,999 | 76 (44.4%) | 62 (44.0%) |
| $100,000 to $299,999 | 22 (12.9%) | 59 (41.8%) |
| $300,000 to $499,999 | 0 (0.0%) | 5 (3.5%) |
| $500,000 to $749,999 | 0 (0.0%) | 0 (0.0%) |
| $750,000 to $999,999 | 0 (0.0%) | 0 (0.0%) |
| $1,000,000 or more | 0 (0.0%) | 0 (0.0%) |
| Total | 171 (100.0%) | 141 (100.0%) |
Household Income by Mortgage Status in Edina
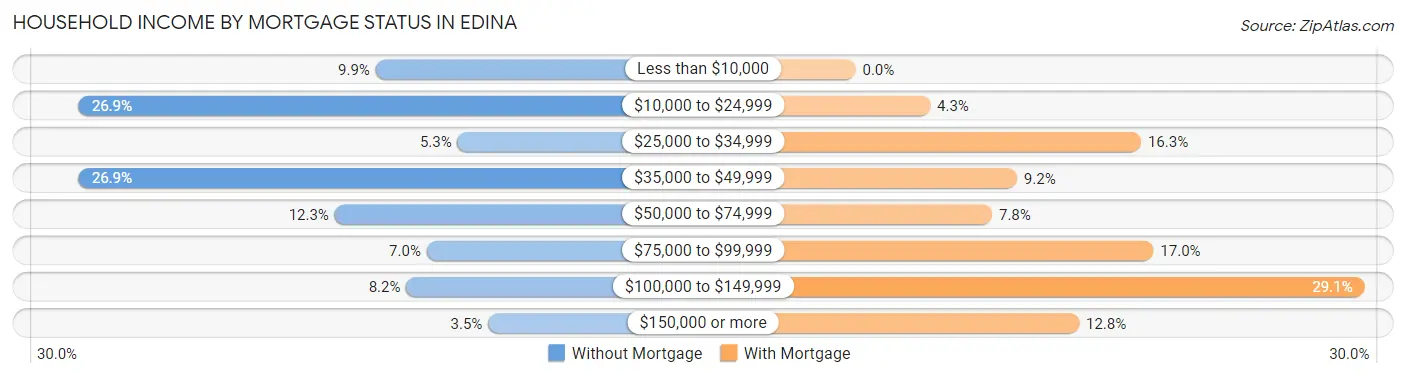
| Household Income | Without Mortgage | With Mortgage |
| Less than $10,000 | 17 (9.9%) | 0 (0.0%) |
| $10,000 to $24,999 | 46 (26.9%) | 6 (4.3%) |
| $25,000 to $34,999 | 9 (5.3%) | 23 (16.3%) |
| $35,000 to $49,999 | 46 (26.9%) | 13 (9.2%) |
| $50,000 to $74,999 | 21 (12.3%) | 11 (7.8%) |
| $75,000 to $99,999 | 12 (7.0%) | 24 (17.0%) |
| $100,000 to $149,999 | 14 (8.2%) | 41 (29.1%) |
| $150,000 or more | 6 (3.5%) | 18 (12.8%) |
| Total | 171 (100.0%) | 141 (100.0%) |
Property Value to Household Income Ratio in Edina
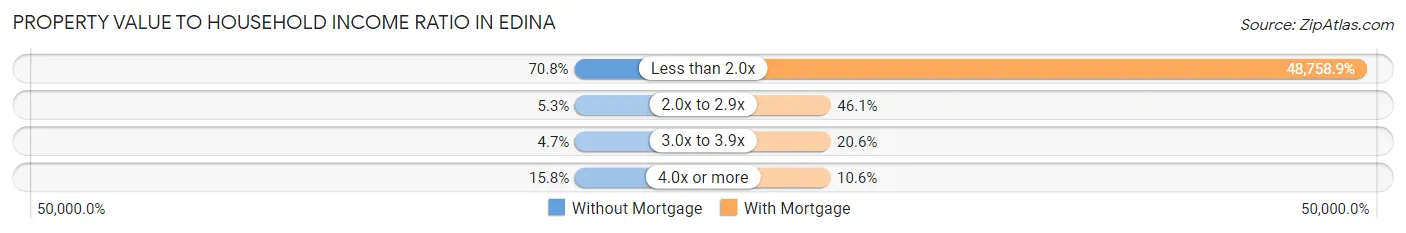
| Value-to-Income Ratio | Without Mortgage | With Mortgage |
| Less than 2.0x | 121 (70.8%) | 68,750 (48,758.9%) |
| 2.0x to 2.9x | 9 (5.3%) | 65 (46.1%) |
| 3.0x to 3.9x | 8 (4.7%) | 29 (20.6%) |
| 4.0x or more | 27 (15.8%) | 15 (10.6%) |
| Total | 171 (100.0%) | 141 (100.0%) |
Real Estate Taxes by Mortgage Status in Edina
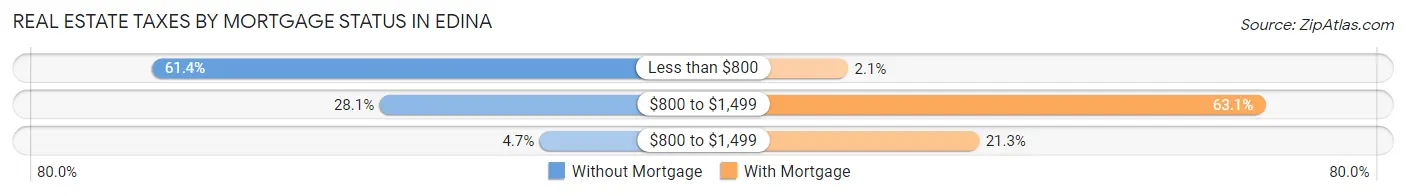
| Property Taxes | Without Mortgage | With Mortgage |
| Less than $800 | 105 (61.4%) | 3 (2.1%) |
| $800 to $1,499 | 48 (28.1%) | 89 (63.1%) |
| $800 to $1,499 | 8 (4.7%) | 30 (21.3%) |
| Total | 171 (100.0%) | 141 (100.0%) |
Health & Disability in Edina
Health Insurance Coverage by Age in Edina
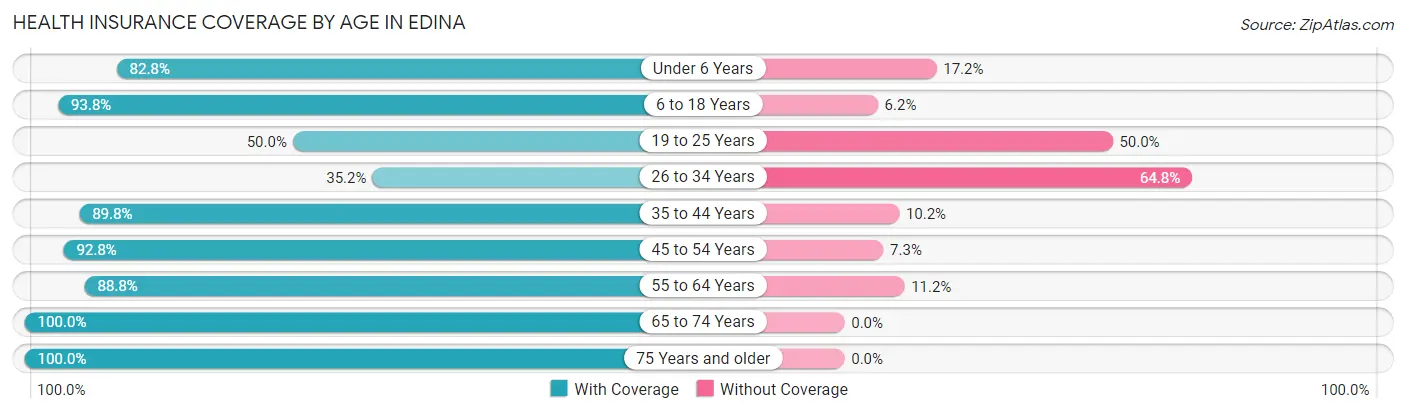
| Age Bracket | With Coverage | Without Coverage |
| Under 6 Years | 111 (82.8%) | 23 (17.2%) |
| 6 to 18 Years | 211 (93.8%) | 14 (6.2%) |
| 19 to 25 Years | 28 (50.0%) | 28 (50.0%) |
| 26 to 34 Years | 45 (35.2%) | 83 (64.8%) |
| 35 to 44 Years | 238 (89.8%) | 27 (10.2%) |
| 45 to 54 Years | 179 (92.7%) | 14 (7.2%) |
| 55 to 64 Years | 159 (88.8%) | 20 (11.2%) |
| 65 to 74 Years | 99 (100.0%) | 0 (0.0%) |
| 75 Years and older | 100 (100.0%) | 0 (0.0%) |
| Total | 1,170 (84.8%) | 209 (15.2%) |
Health Insurance Coverage by Citizenship Status in Edina
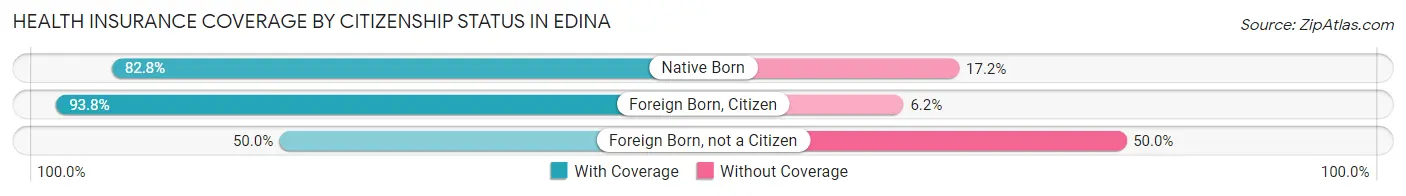
| Citizenship Status | With Coverage | Without Coverage |
| Native Born | 111 (82.8%) | 23 (17.2%) |
| Foreign Born, Citizen | 211 (93.8%) | 14 (6.2%) |
| Foreign Born, not a Citizen | 28 (50.0%) | 28 (50.0%) |
Health Insurance Coverage by Household Income in Edina
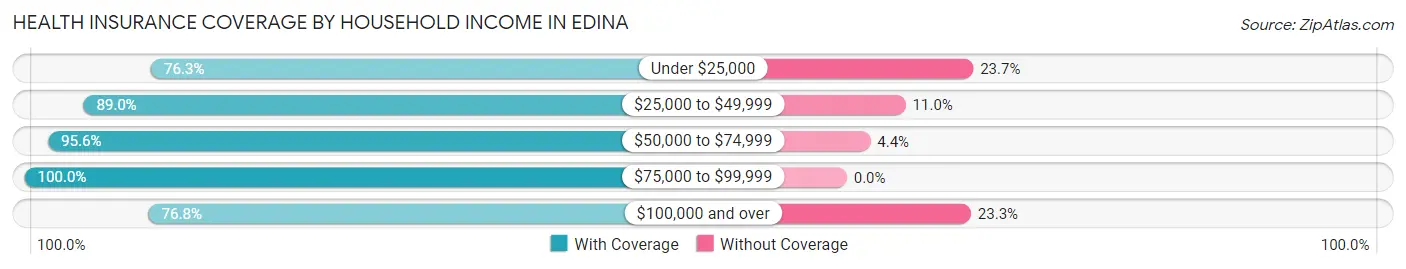
| Household Income | With Coverage | Without Coverage |
| Under $25,000 | 190 (76.3%) | 59 (23.7%) |
| $25,000 to $49,999 | 250 (89.0%) | 31 (11.0%) |
| $50,000 to $74,999 | 108 (95.6%) | 5 (4.4%) |
| $75,000 to $99,999 | 236 (100.0%) | 0 (0.0%) |
| $100,000 and over | 340 (76.7%) | 103 (23.3%) |
Public vs Private Health Insurance Coverage by Age in Edina
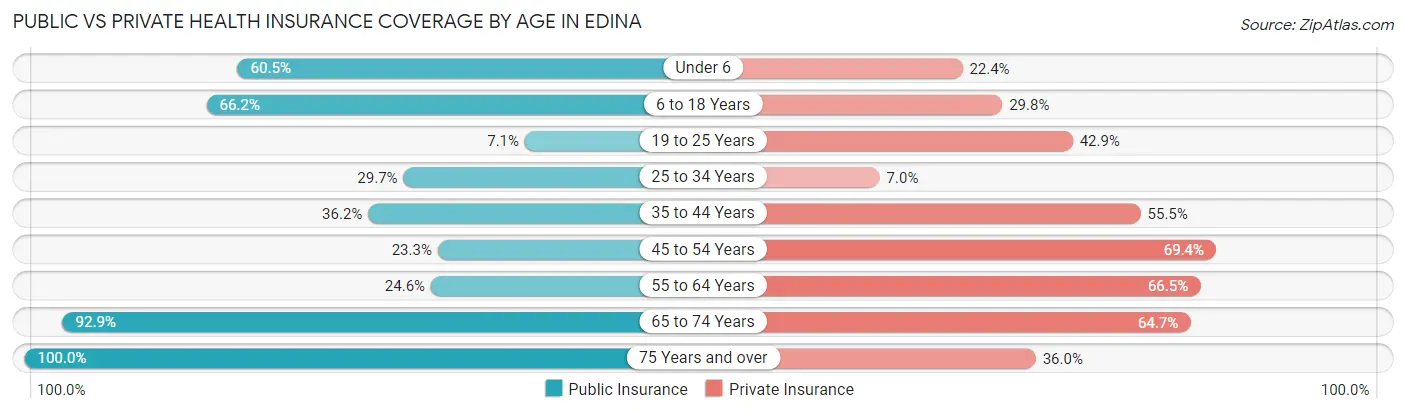
| Age Bracket | Public Insurance | Private Insurance |
| Under 6 | 81 (60.5%) | 30 (22.4%) |
| 6 to 18 Years | 149 (66.2%) | 67 (29.8%) |
| 19 to 25 Years | 4 (7.1%) | 24 (42.9%) |
| 25 to 34 Years | 38 (29.7%) | 9 (7.0%) |
| 35 to 44 Years | 96 (36.2%) | 147 (55.5%) |
| 45 to 54 Years | 45 (23.3%) | 134 (69.4%) |
| 55 to 64 Years | 44 (24.6%) | 119 (66.5%) |
| 65 to 74 Years | 92 (92.9%) | 64 (64.6%) |
| 75 Years and over | 100 (100.0%) | 36 (36.0%) |
| Total | 649 (47.1%) | 630 (45.7%) |
Disability Status by Sex by Age in Edina
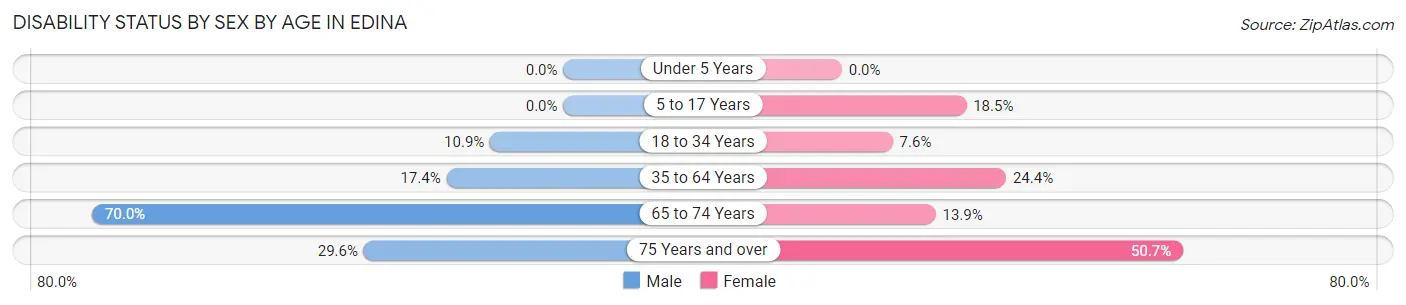
| Age Bracket | Male | Female |
| Under 5 Years | 0 (0.0%) | 0 (0.0%) |
| 5 to 17 Years | 0 (0.0%) | 17 (18.5%) |
| 18 to 34 Years | 15 (10.9%) | 4 (7.5%) |
| 35 to 64 Years | 55 (17.3%) | 78 (24.4%) |
| 65 to 74 Years | 14 (70.0%) | 11 (13.9%) |
| 75 Years and over | 8 (29.6%) | 37 (50.7%) |
Disability Class by Sex by Age in Edina
Disability Class: Hearing Difficulty
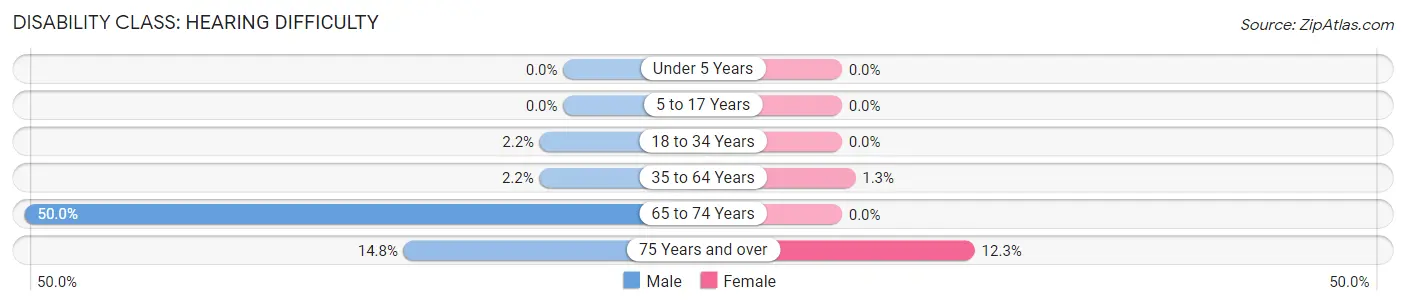
| Age Bracket | Male | Female |
| Under 5 Years | 0 (0.0%) | 0 (0.0%) |
| 5 to 17 Years | 0 (0.0%) | 0 (0.0%) |
| 18 to 34 Years | 3 (2.2%) | 0 (0.0%) |
| 35 to 64 Years | 7 (2.2%) | 4 (1.3%) |
| 65 to 74 Years | 10 (50.0%) | 0 (0.0%) |
| 75 Years and over | 4 (14.8%) | 9 (12.3%) |
Disability Class: Vision Difficulty
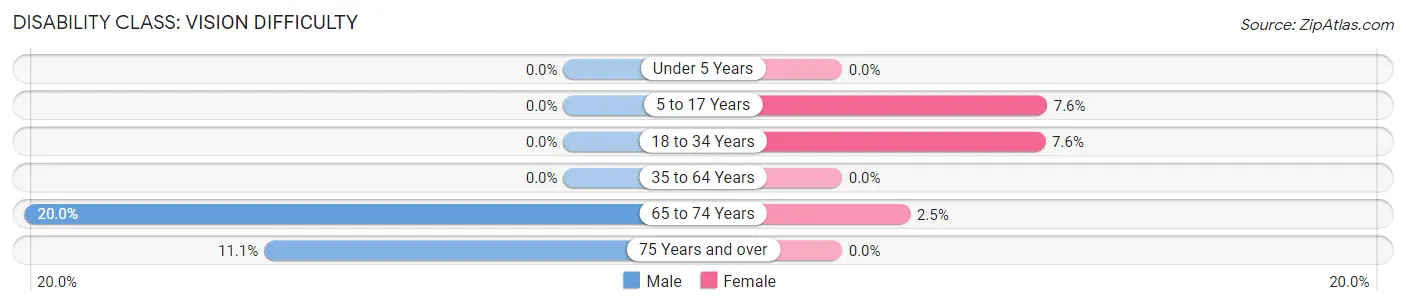
| Age Bracket | Male | Female |
| Under 5 Years | 0 (0.0%) | 0 (0.0%) |
| 5 to 17 Years | 0 (0.0%) | 7 (7.6%) |
| 18 to 34 Years | 0 (0.0%) | 4 (7.5%) |
| 35 to 64 Years | 0 (0.0%) | 0 (0.0%) |
| 65 to 74 Years | 4 (20.0%) | 2 (2.5%) |
| 75 Years and over | 3 (11.1%) | 0 (0.0%) |
Disability Class: Cognitive Difficulty
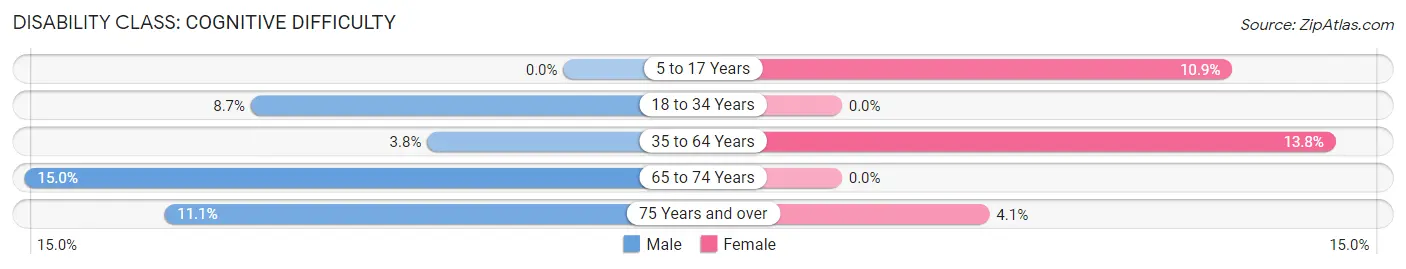
| Age Bracket | Male | Female |
| 5 to 17 Years | 0 (0.0%) | 10 (10.9%) |
| 18 to 34 Years | 12 (8.7%) | 0 (0.0%) |
| 35 to 64 Years | 12 (3.8%) | 44 (13.8%) |
| 65 to 74 Years | 3 (15.0%) | 0 (0.0%) |
| 75 Years and over | 3 (11.1%) | 3 (4.1%) |
Disability Class: Ambulatory Difficulty
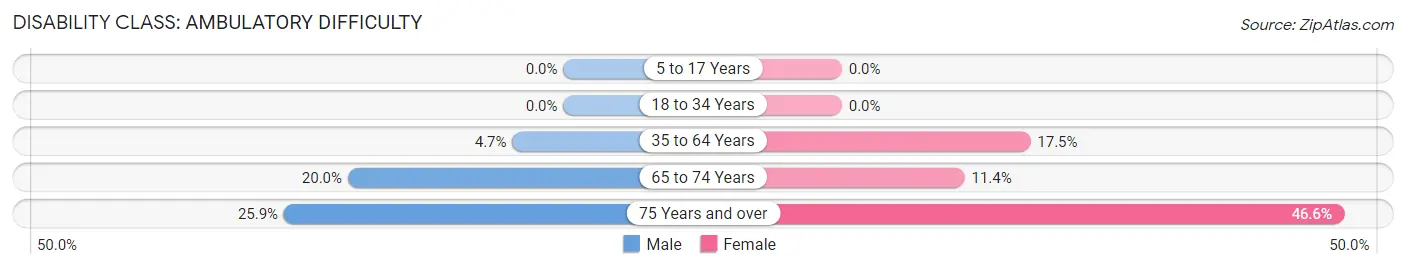
| Age Bracket | Male | Female |
| 5 to 17 Years | 0 (0.0%) | 0 (0.0%) |
| 18 to 34 Years | 0 (0.0%) | 0 (0.0%) |
| 35 to 64 Years | 15 (4.7%) | 56 (17.5%) |
| 65 to 74 Years | 4 (20.0%) | 9 (11.4%) |
| 75 Years and over | 7 (25.9%) | 34 (46.6%) |
Disability Class: Self-Care Difficulty
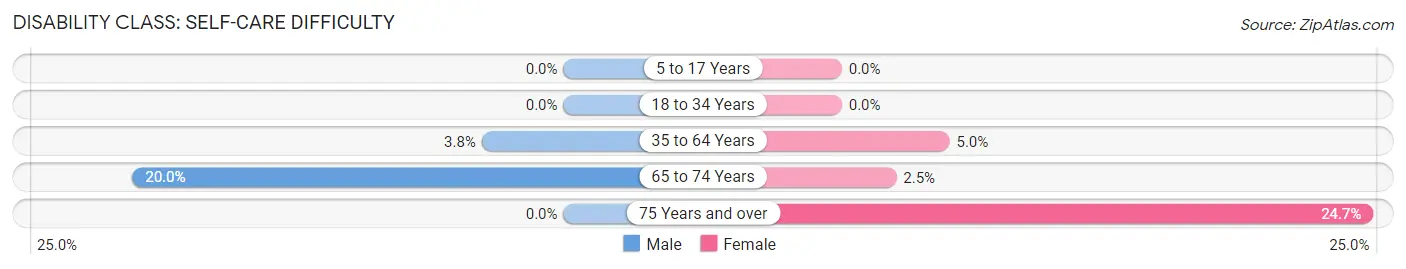
| Age Bracket | Male | Female |
| 5 to 17 Years | 0 (0.0%) | 0 (0.0%) |
| 18 to 34 Years | 0 (0.0%) | 0 (0.0%) |
| 35 to 64 Years | 12 (3.8%) | 16 (5.0%) |
| 65 to 74 Years | 4 (20.0%) | 2 (2.5%) |
| 75 Years and over | 0 (0.0%) | 18 (24.7%) |
Technology Access in Edina
Computing Device Access in Edina
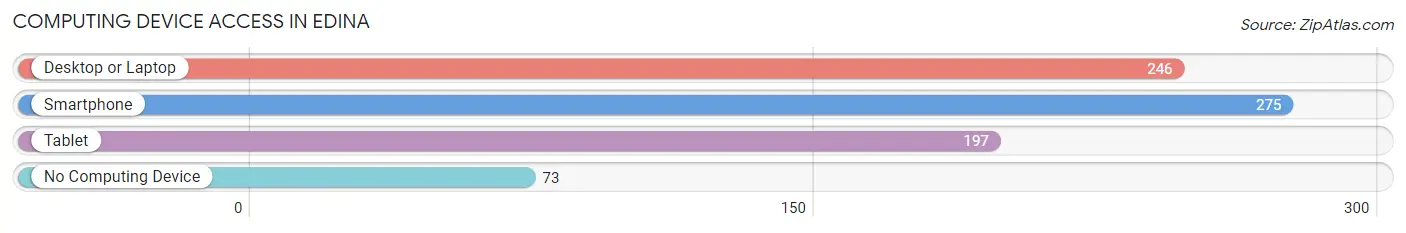
| Device Type | # Households | % Households |
| Desktop or Laptop | 246 | 62.1% |
| Smartphone | 275 | 69.4% |
| Tablet | 197 | 49.7% |
| No Computing Device | 73 | 18.4% |
| Total | 396 | 100.0% |
Internet Access in Edina
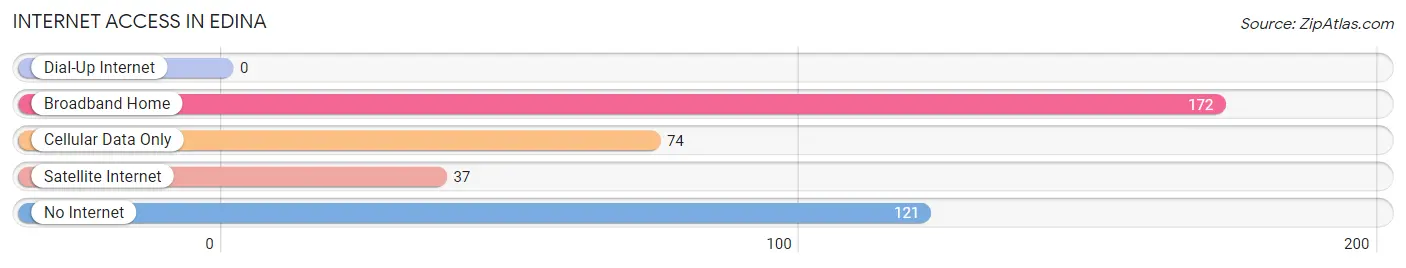
| Internet Type | # Households | % Households |
| Dial-Up Internet | 0 | 0.0% |
| Broadband Home | 172 | 43.4% |
| Cellular Data Only | 74 | 18.7% |
| Satellite Internet | 37 | 9.3% |
| No Internet | 121 | 30.6% |
| Total | 396 | 100.0% |
Edina Summary
Edina, Missouri is a small town located in Knox County, in the northeast corner of the state. It is situated on the banks of the Fabius River, and is surrounded by rolling hills and farmland. The town was founded in 1836, and has a population of approximately 1,000 people.
History
Edina was founded in 1836 by a group of settlers from Kentucky. The town was named after the daughter of one of the settlers, Edina Smith. The town was originally a farming community, and the main crops were corn, wheat, and oats. In the late 1800s, the town began to grow and prosper, and a number of businesses were established. These included a general store, a blacksmith shop, a hotel, and a sawmill.
In the early 1900s, the town began to decline, as many of the businesses closed and the population decreased. However, in the 1950s, the town began to experience a resurgence, as new businesses opened and the population began to grow again. Today, Edina is a small but vibrant community, with a variety of businesses and services.
Geography
Edina is located in Knox County, in the northeast corner of Missouri. It is situated on the banks of the Fabius River, and is surrounded by rolling hills and farmland. The town is located approximately 30 miles from the state capital of Jefferson City, and is about an hour and a half drive from St. Louis.
The climate in Edina is generally mild, with hot summers and cold winters. The average temperature in the summer is around 80 degrees Fahrenheit, and in the winter it is around 40 degrees Fahrenheit. The town receives an average of 40 inches of rain per year, and the area is known for its beautiful fall foliage.
Economy
Edina’s economy is largely based on agriculture. The town is home to several farms, which produce a variety of crops, including corn, wheat, soybeans, and hay. In addition, there are several businesses in town, including a grocery store, a hardware store, a restaurant, and a gas station.
The town also has a number of small manufacturing businesses, which produce a variety of products, including furniture, clothing, and automotive parts. In addition, there are several service-based businesses, such as a barber shop, a beauty salon, and a car repair shop.
Demographics
As of the 2010 census, the population of Edina was 1,000 people. The town is predominantly white, with a small African American population. The median household income is $37,000, and the median age is 42 years old.
Edina is a small but vibrant community, with a variety of businesses and services. The town is a great place to live, work, and raise a family. It is a great example of a small town that has managed to maintain its rural charm, while still providing its residents with the amenities and services they need.
Common Questions
What is Per Capita Income in Edina?
Per Capita income in Edina is $18,453.
What is the Median Family Income in Edina?
Median Family Income in Edina is $67,750.
What is the Median Household income in Edina?
Median Household Income in Edina is $40,714.
What is Family Income Deficit in Edina?
Family Income Deficit in Edina is $13,584.
Families that are below poverty line in Edina earn $13,584 less on average than the poverty threshold level.
What is Inequality or Gini Index in Edina?
Inequality or Gini Index in Edina is 0.43.
What is the Total Population of Edina?
Total Population of Edina is 1,379.
What is the Total Male Population of Edina?
Total Male Population of Edina is 690.
What is the Total Female Population of Edina?
Total Female Population of Edina is 689.
What is the Ratio of Males per 100 Females in Edina?
There are 100.15 Males per 100 Females in Edina.
What is the Ratio of Females per 100 Males in Edina?
There are 99.86 Females per 100 Males in Edina.
What is the Median Population Age in Edina?
Median Population Age in Edina is 39.0 Years.
What is the Average Family Size in Edina
Average Family Size in Edina is 5.4 People.
What is the Average Household Size in Edina
Average Household Size in Edina is 3.3 People.
How Large is the Labor Force in Edina?
There are 641 People in the Labor Forcein in Edina.
What is the Percentage of People in the Labor Force in Edina?
58.9% of People are in the Labor Force in Edina.
What is the Unemployment Rate in Edina?
Unemployment Rate in Edina is 3.4%.