Doe Run, MO Map & Demographics
Doe Run Map
Doe Run Overview
$32,655
PER CAPITA INCOME
$46,738
AVG FAMILY INCOME
$73,344
AVG HOUSEHOLD INCOME
63.7%
WAGE / INCOME GAP [ % ]
36.3¢/ $1
WAGE / INCOME GAP [ $ ]
0.29
INEQUALITY / GINI INDEX
790
TOTAL POPULATION
518
MALE POPULATION
272
FEMALE POPULATION
190.44
MALES / 100 FEMALES
52.51
FEMALES / 100 MALES
64.2
MEDIAN AGE
2.4
AVG FAMILY SIZE
2.3
AVG HOUSEHOLD SIZE
375
LABOR FORCE [ PEOPLE ]
53.3%
PERCENT IN LABOR FORCE
Doe Run Zip Codes
Doe Run Area Codes
Income in Doe Run
Income Overview in Doe Run
Per Capita Income in Doe Run is $32,655, while median incomes of families and households are $46,738 and $73,344 respectively.
| Characteristic | Number | Measure |
| Per Capita Income | 790 | $32,655 |
| Median Family Income | 151 | $46,738 |
| Mean Family Income | 151 | $58,438 |
| Median Household Income | 331 | $73,344 |
| Mean Household Income | 331 | $69,463 |
| Income Deficit | 151 | $0 |
| Wage / Income Gap (%) | 790 | 63.66% |
| Wage / Income Gap ($) | 790 | 36.34¢ per $1 |
| Gini / Inequality Index | 790 | 0.29 |
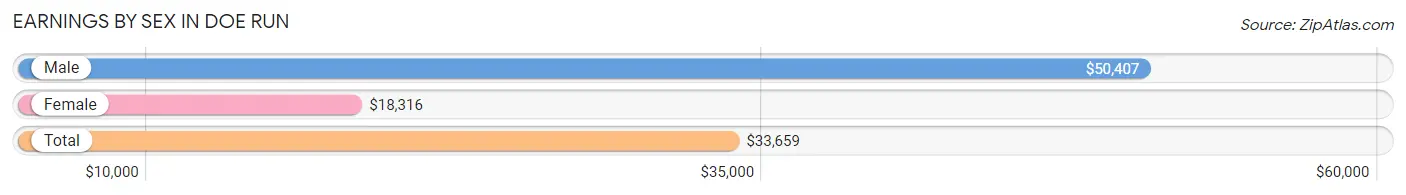
Earnings by Sex in Doe Run
Average Earnings in Doe Run are $33,659, $50,407 for men and $18,316 for women, a difference of 63.7%.
| Sex | Number | Average Earnings |
| Male | 239 (57.3%) | $50,407 |
| Female | 178 (42.7%) | $18,316 |
| Total | 417 (100.0%) | $33,659 |
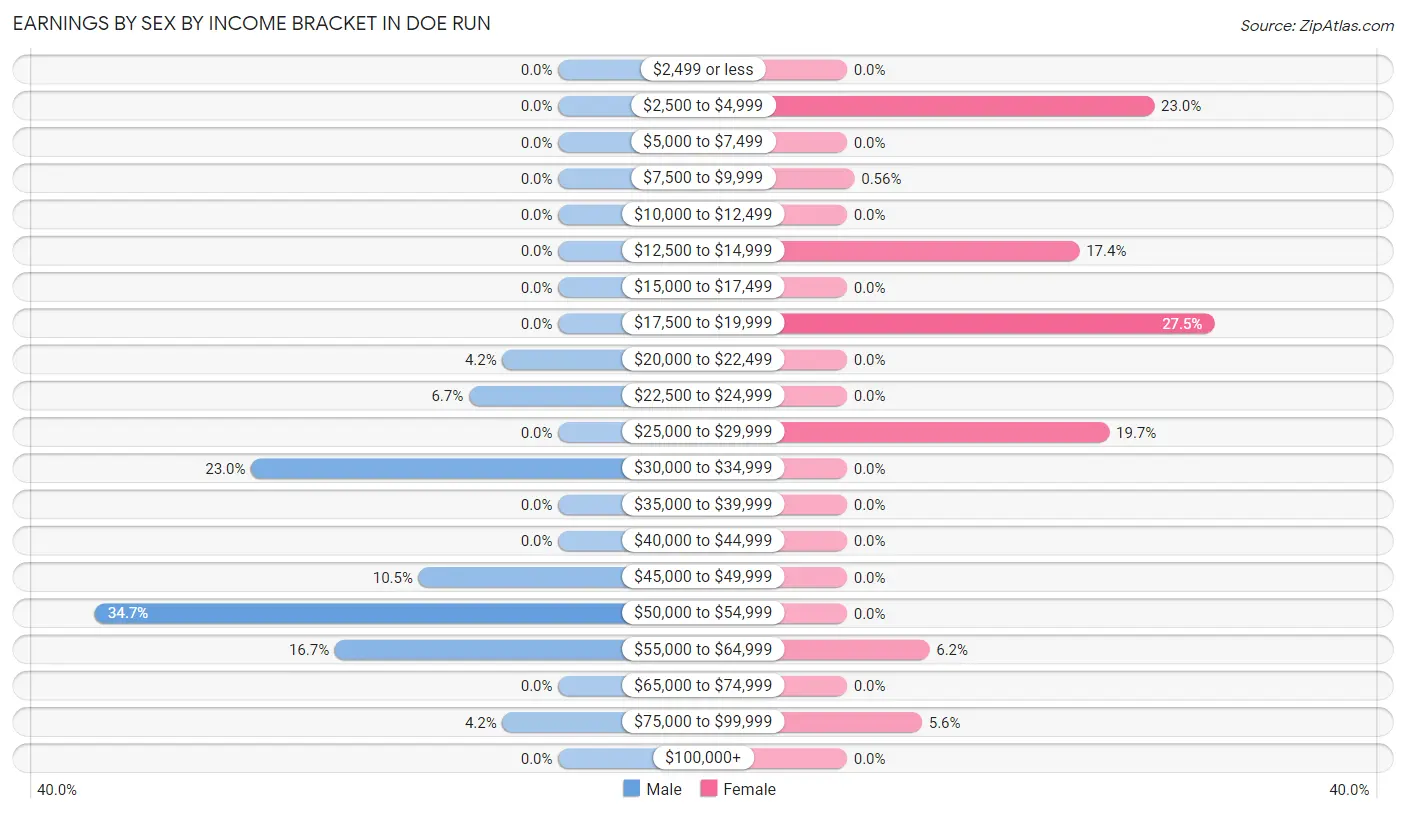
Earnings by Sex by Income Bracket in Doe Run
The most common earnings brackets in Doe Run are $50,000 to $54,999 for men (83 | 34.7%) and $17,500 to $19,999 for women (49 | 27.5%).
| Income | Male | Female |
| $2,499 or less | 0 (0.0%) | 0 (0.0%) |
| $2,500 to $4,999 | 0 (0.0%) | 41 (23.0%) |
| $5,000 to $7,499 | 0 (0.0%) | 0 (0.0%) |
| $7,500 to $9,999 | 0 (0.0%) | 1 (0.6%) |
| $10,000 to $12,499 | 0 (0.0%) | 0 (0.0%) |
| $12,500 to $14,999 | 0 (0.0%) | 31 (17.4%) |
| $15,000 to $17,499 | 0 (0.0%) | 0 (0.0%) |
| $17,500 to $19,999 | 0 (0.0%) | 49 (27.5%) |
| $20,000 to $22,499 | 10 (4.2%) | 0 (0.0%) |
| $22,500 to $24,999 | 16 (6.7%) | 0 (0.0%) |
| $25,000 to $29,999 | 0 (0.0%) | 35 (19.7%) |
| $30,000 to $34,999 | 55 (23.0%) | 0 (0.0%) |
| $35,000 to $39,999 | 0 (0.0%) | 0 (0.0%) |
| $40,000 to $44,999 | 0 (0.0%) | 0 (0.0%) |
| $45,000 to $49,999 | 25 (10.5%) | 0 (0.0%) |
| $50,000 to $54,999 | 83 (34.7%) | 0 (0.0%) |
| $55,000 to $64,999 | 40 (16.7%) | 11 (6.2%) |
| $65,000 to $74,999 | 0 (0.0%) | 0 (0.0%) |
| $75,000 to $99,999 | 10 (4.2%) | 10 (5.6%) |
| $100,000+ | 0 (0.0%) | 0 (0.0%) |
| Total | 239 (100.0%) | 178 (100.0%) |
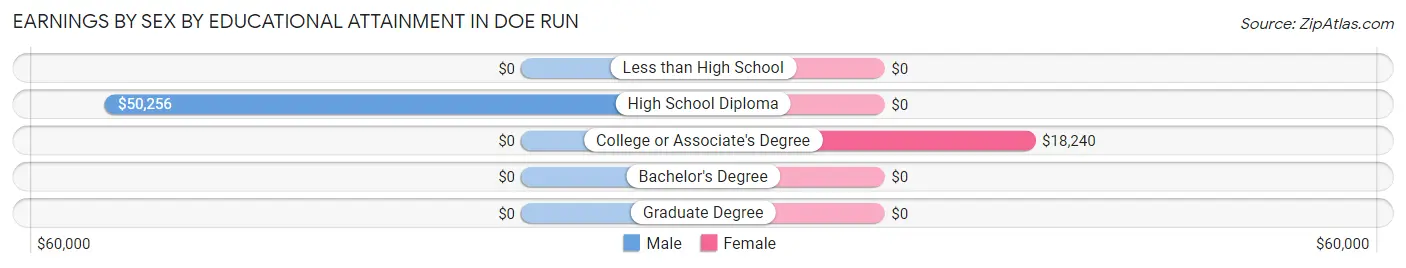
Earnings by Sex by Educational Attainment in Doe Run
Average earnings in Doe Run are $50,407 for men and $18,316 for women, a difference of 63.7%. Men with an educational attainment of high school diploma enjoy the highest average annual earnings of $50,256, while those with high school diploma education earn the least with $50,256. Women with an educational attainment of college or associate's degree earn the most with the average annual earnings of $18,240, while those with college or associate's degree education have the smallest earnings of $18,240.
| Educational Attainment | Male Income | Female Income |
| Less than High School | - | - |
| High School Diploma | $50,256 | $0 |
| College or Associate's Degree | - | - |
| Bachelor's Degree | - | - |
| Graduate Degree | - | - |
| Total | $50,407 | $18,316 |
Family Income in Doe Run
Family Income Brackets in Doe Run
According to the Doe Run family income data, there are 64 families falling into the $35,000 to $49,999 income range, which is the most common income bracket and makes up 42.4% of all families.
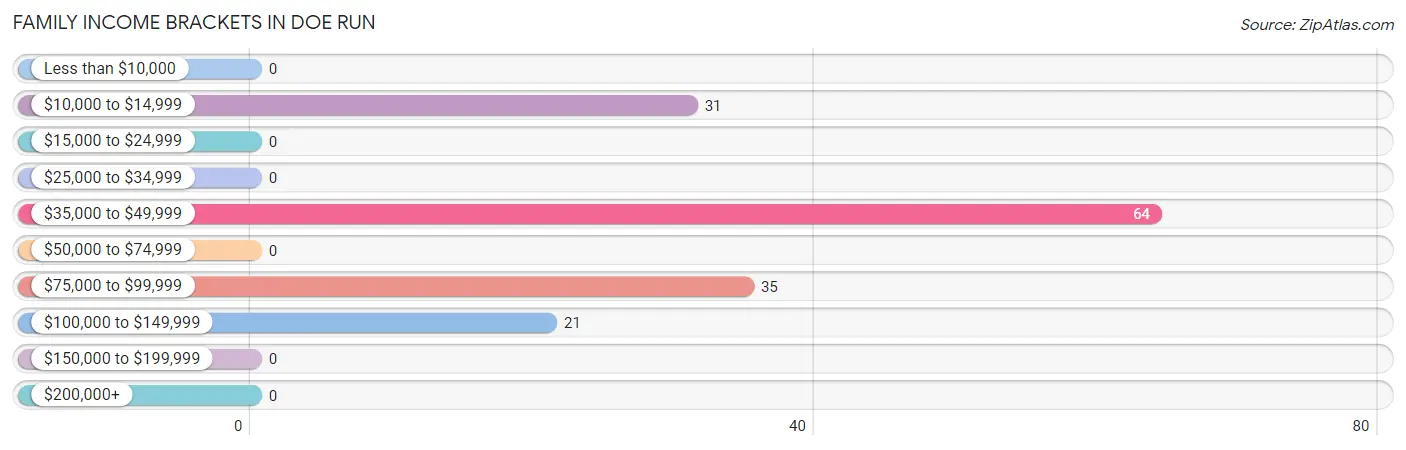
| Income Bracket | # Families | % Families |
| Less than $10,000 | 0 | 0.0% |
| $10,000 to $14,999 | 31 | 20.5% |
| $15,000 to $24,999 | 0 | 0.0% |
| $25,000 to $34,999 | 0 | 0.0% |
| $35,000 to $49,999 | 64 | 42.4% |
| $50,000 to $74,999 | 0 | 0.0% |
| $75,000 to $99,999 | 35 | 23.2% |
| $100,000 to $149,999 | 21 | 13.9% |
| $150,000 to $199,999 | 0 | 0.0% |
| $200,000+ | 0 | 0.0% |
Family Income by Famaliy Size in Doe Run
2-person families (85 | 56.3%) account for the highest median family income in Doe Run with $46,660 per family, while 2-person families (85 | 56.3%) have the highest median income of $23,330 per family member.
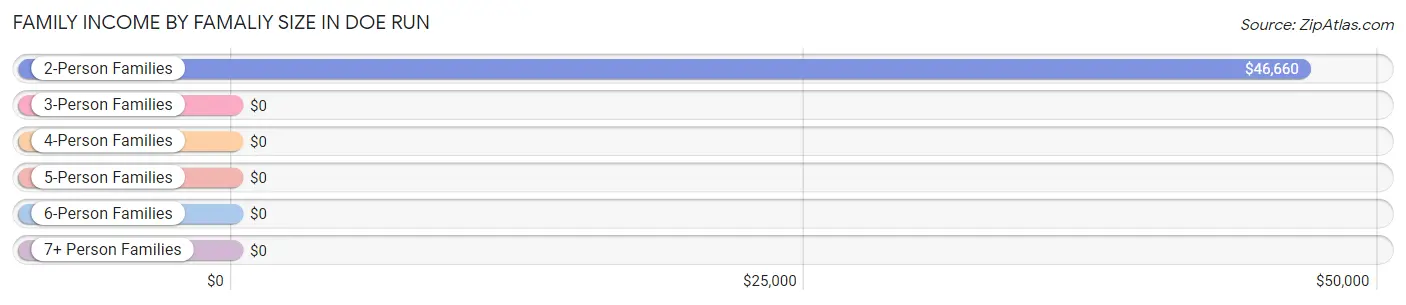
| Income Bracket | # Families | Median Income |
| 2-Person Families | 85 (56.3%) | $46,660 |
| 3-Person Families | 66 (43.7%) | $0 |
| 4-Person Families | 0 (0.0%) | $0 |
| 5-Person Families | 0 (0.0%) | $0 |
| 6-Person Families | 0 (0.0%) | $0 |
| 7+ Person Families | 0 (0.0%) | $0 |
| Total | 151 (100.0%) | $46,738 |
Family Income by Number of Earners in Doe Run
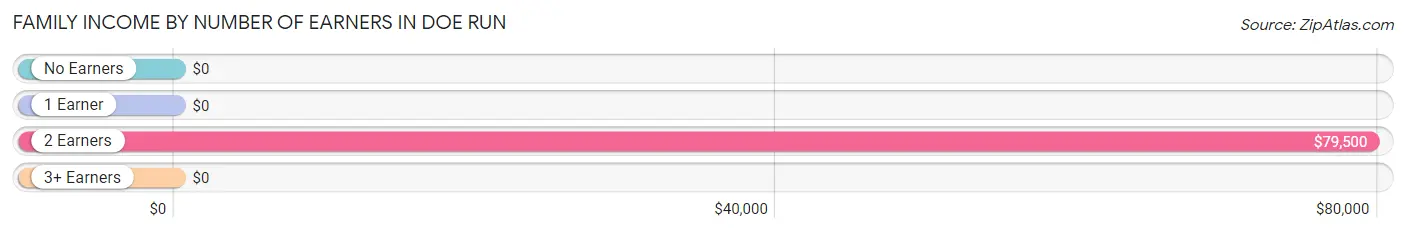
| Number of Earners | # Families | Median Income |
| No Earners | 21 (13.9%) | $0 |
| 1 Earner | 74 (49.0%) | $0 |
| 2 Earners | 56 (37.1%) | $79,500 |
| 3+ Earners | 0 (0.0%) | $0 |
| Total | 151 (100.0%) | $46,738 |
Household Income in Doe Run
Household Income Brackets in Doe Run
With 104 households falling in the category, the $100,000 to $149,999 income range is the most frequent in Doe Run, accounting for 31.4% of all households.
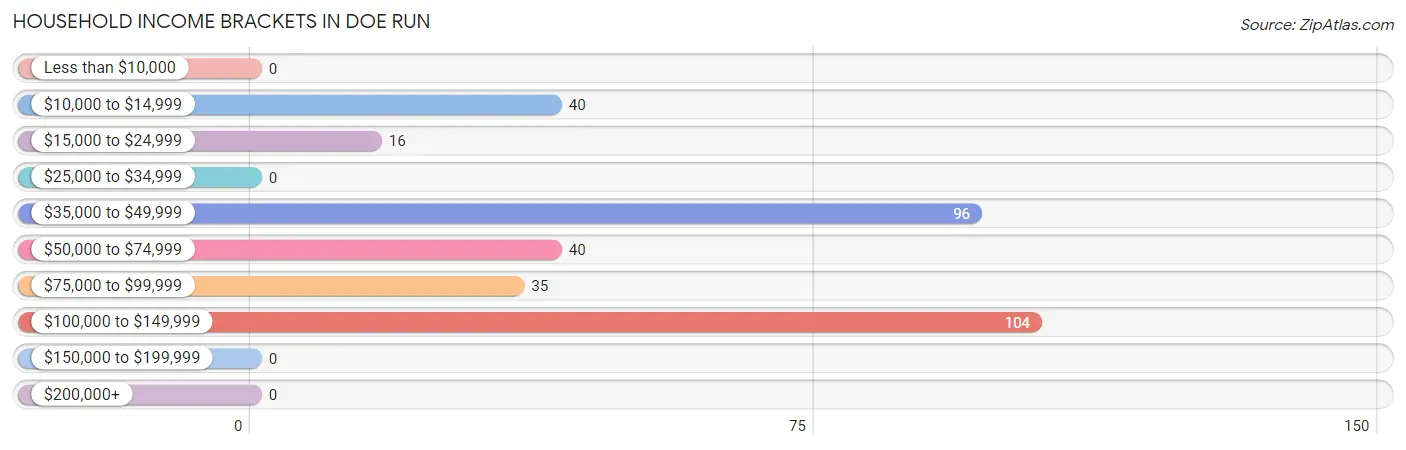
| Income Bracket | # Households | % Households |
| Less than $10,000 | 0 | 0.0% |
| $10,000 to $14,999 | 40 | 12.1% |
| $15,000 to $24,999 | 16 | 4.8% |
| $25,000 to $34,999 | 0 | 0.0% |
| $35,000 to $49,999 | 96 | 29.0% |
| $50,000 to $74,999 | 40 | 12.1% |
| $75,000 to $99,999 | 35 | 10.6% |
| $100,000 to $149,999 | 104 | 31.4% |
| $150,000 to $199,999 | 0 | 0.0% |
| $200,000+ | 0 | 0.0% |
Household Income by Householder Age in Doe Run
The median household income in Doe Run is $73,344, with the highest median household income of $74,125 found in the 45 to 64 years age bracket for the primary householder. A total of 70 households (21.1%) fall into this category.
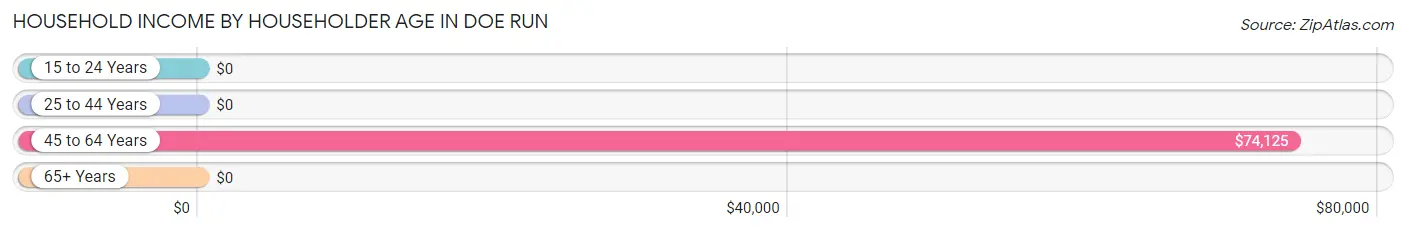
| Income Bracket | # Households | Median Income |
| 15 to 24 Years | 0 (0.0%) | $0 |
| 25 to 44 Years | 82 (24.8%) | $0 |
| 45 to 64 Years | 70 (21.1%) | $74,125 |
| 65+ Years | 179 (54.1%) | $0 |
| Total | 331 (100.0%) | $73,344 |
Poverty in Doe Run
Income Below Poverty by Sex and Age in Doe Run
With 13.3% poverty level for males and 24.2% for females among the residents of Doe Run, 6 to 11 year old males and 65 to 74 year old females are the most vulnerable to poverty, with 60 males (100.0%) and 31 females (96.9%) in their respective age groups living below the poverty level.
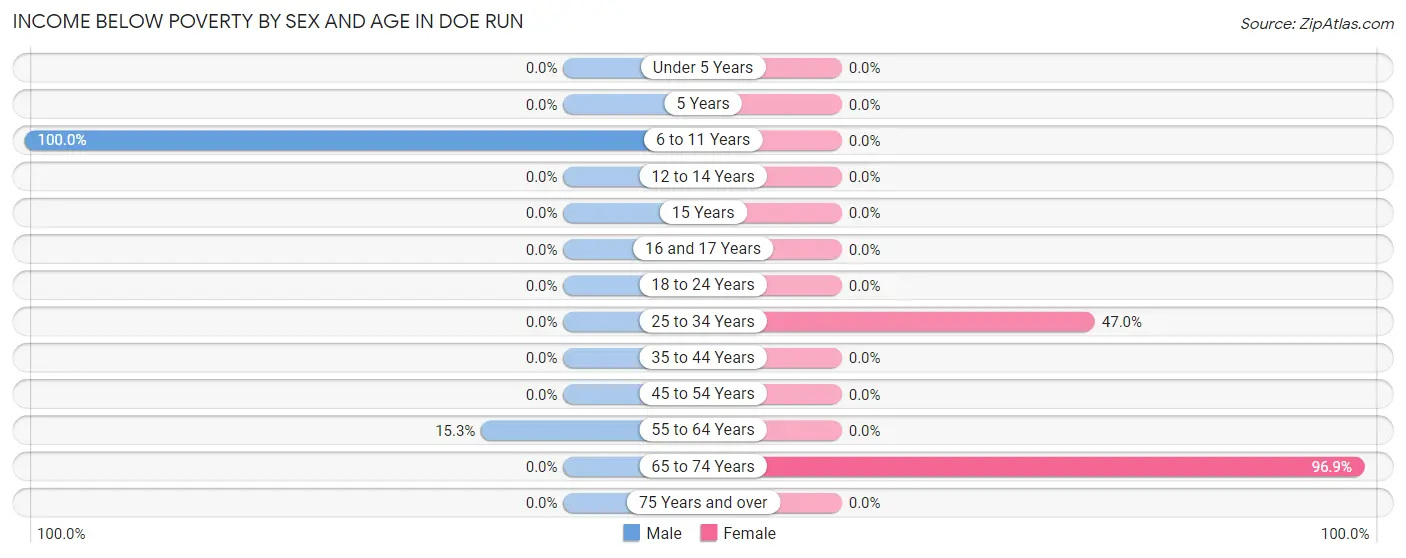
| Age Bracket | Male | Female |
| Under 5 Years | 0 (0.0%) | 0 (0.0%) |
| 5 Years | 0 (0.0%) | 0 (0.0%) |
| 6 to 11 Years | 60 (100.0%) | 0 (0.0%) |
| 12 to 14 Years | 0 (0.0%) | 0 (0.0%) |
| 15 Years | 0 (0.0%) | 0 (0.0%) |
| 16 and 17 Years | 0 (0.0%) | 0 (0.0%) |
| 18 to 24 Years | 0 (0.0%) | 0 (0.0%) |
| 25 to 34 Years | 0 (0.0%) | 31 (47.0%) |
| 35 to 44 Years | 0 (0.0%) | 0 (0.0%) |
| 45 to 54 Years | 0 (0.0%) | 0 (0.0%) |
| 55 to 64 Years | 9 (15.2%) | 0 (0.0%) |
| 65 to 74 Years | 0 (0.0%) | 31 (96.9%) |
| 75 Years and over | 0 (0.0%) | 0 (0.0%) |
| Total | 69 (13.3%) | 62 (24.2%) |
Income Above Poverty by Sex and Age in Doe Run
According to the poverty statistics in Doe Run, males aged 25 to 34 years and females aged under 5 years are the age groups that are most secure financially, with 100.0% of males and 100.0% of females in these age groups living above the poverty line.
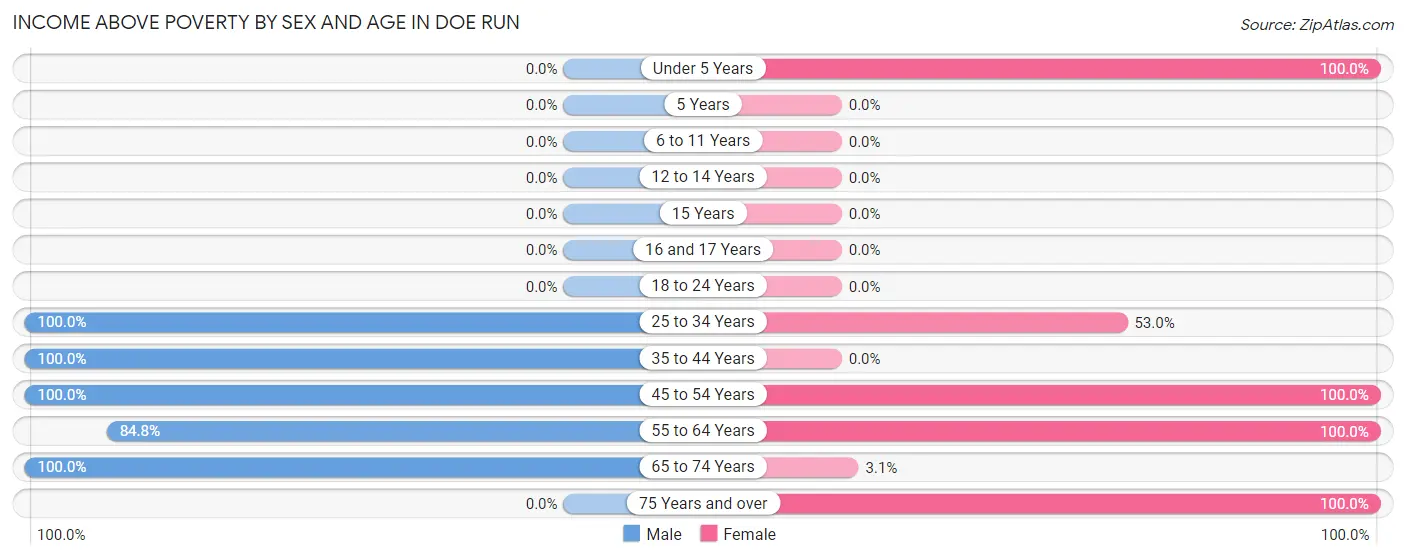
| Age Bracket | Male | Female |
| Under 5 Years | 0 (0.0%) | 26 (100.0%) |
| 5 Years | 0 (0.0%) | 0 (0.0%) |
| 6 to 11 Years | 0 (0.0%) | 0 (0.0%) |
| 12 to 14 Years | 0 (0.0%) | 0 (0.0%) |
| 15 Years | 0 (0.0%) | 0 (0.0%) |
| 16 and 17 Years | 0 (0.0%) | 0 (0.0%) |
| 18 to 24 Years | 0 (0.0%) | 0 (0.0%) |
| 25 to 34 Years | 80 (100.0%) | 35 (53.0%) |
| 35 to 44 Years | 16 (100.0%) | 0 (0.0%) |
| 45 to 54 Years | 10 (100.0%) | 59 (100.0%) |
| 55 to 64 Years | 50 (84.8%) | 52 (100.0%) |
| 65 to 74 Years | 293 (100.0%) | 1 (3.1%) |
| 75 Years and over | 0 (0.0%) | 21 (100.0%) |
| Total | 449 (86.7%) | 194 (75.8%) |
Income Below Poverty Among Married-Couple Families in Doe Run
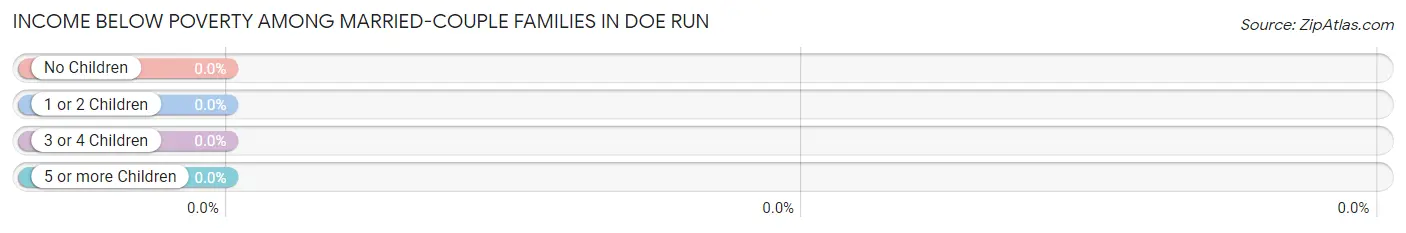
| Children | Above Poverty | Below Poverty |
| No Children | 64 (100.0%) | 0 (0.0%) |
| 1 or 2 Children | 35 (100.0%) | 0 (0.0%) |
| 3 or 4 Children | 0 (0.0%) | 0 (0.0%) |
| 5 or more Children | 0 (0.0%) | 0 (0.0%) |
| Total | 99 (100.0%) | 0 (0.0%) |
Income Below Poverty Among Single-Parent Households in Doe Run
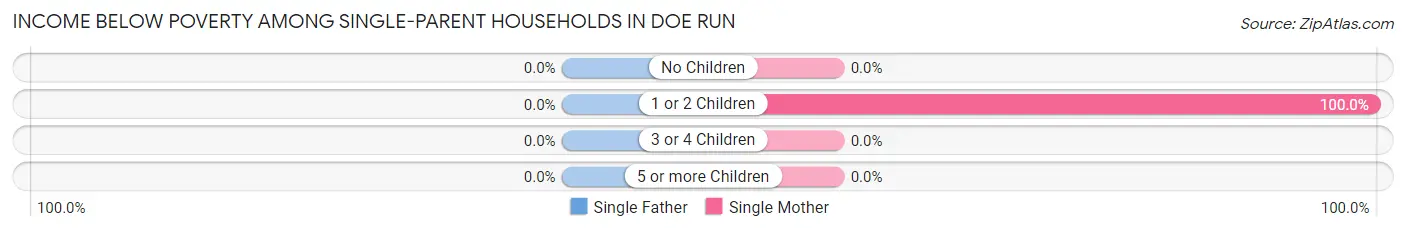
| Children | Single Father | Single Mother |
| No Children | 0 (0.0%) | 0 (0.0%) |
| 1 or 2 Children | 0 (0.0%) | 31 (100.0%) |
| 3 or 4 Children | 0 (0.0%) | 0 (0.0%) |
| 5 or more Children | 0 (0.0%) | 0 (0.0%) |
| Total | 0 (0.0%) | 31 (59.6%) |
Income Below Poverty Among Married-Couple vs Single-Parent Households in Doe Run
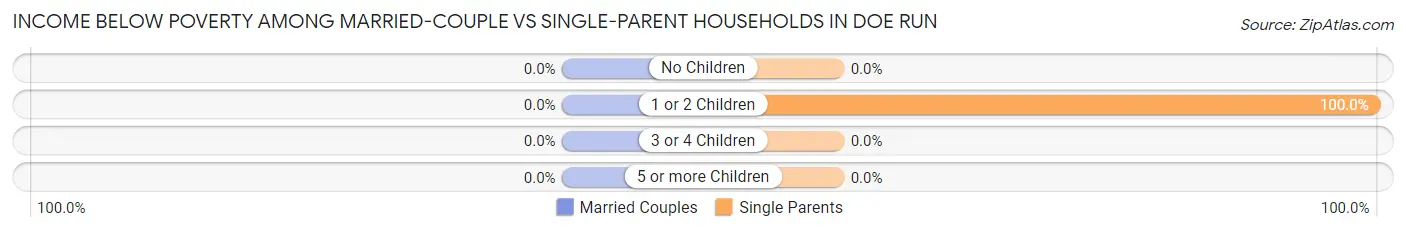
| Children | Married-Couple Families | Single-Parent Households |
| No Children | 0 (0.0%) | 0 (0.0%) |
| 1 or 2 Children | 0 (0.0%) | 31 (100.0%) |
| 3 or 4 Children | 0 (0.0%) | 0 (0.0%) |
| 5 or more Children | 0 (0.0%) | 0 (0.0%) |
| Total | 0 (0.0%) | 31 (59.6%) |
Race in Doe Run
The most populous races in Doe Run are White / Caucasian (789 | 99.9%), Hispanic or Latino (96 | 12.1%), and Two or more Races (1 | 0.1%).
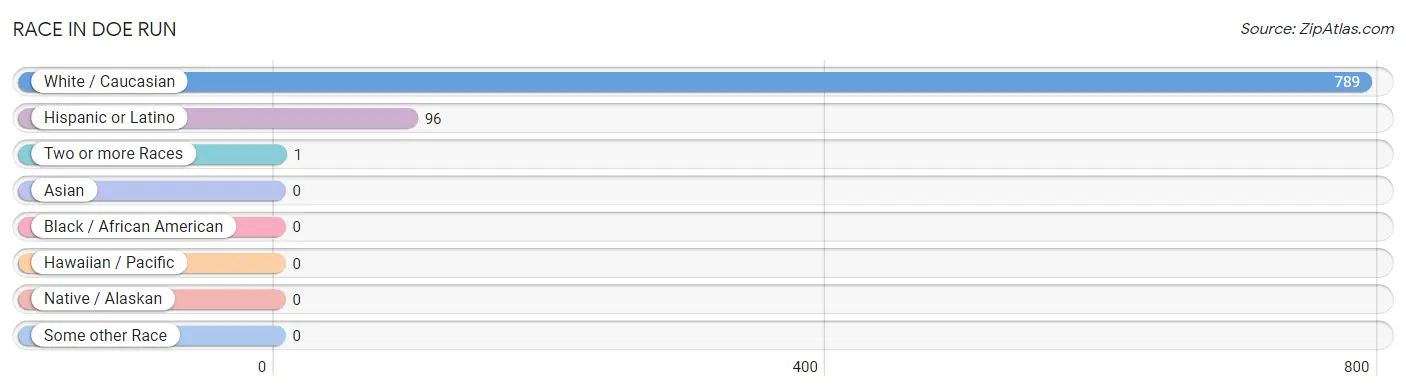
| Race | # Population | % Population |
| Asian | 0 | 0.0% |
| Black / African American | 0 | 0.0% |
| Hawaiian / Pacific | 0 | 0.0% |
| Hispanic or Latino | 96 | 12.1% |
| Native / Alaskan | 0 | 0.0% |
| White / Caucasian | 789 | 99.9% |
| Two or more Races | 1 | 0.1% |
| Some other Race | 0 | 0.0% |
| Total | 790 | 100.0% |
Ancestry in Doe Run
The most populous ancestries reported in Doe Run are American (209 | 26.5%), German (110 | 13.9%), English (59 | 7.5%), Puerto Rican (55 | 7.0%), and Italian (49 | 6.2%), together accounting for 61.0% of all Doe Run residents.
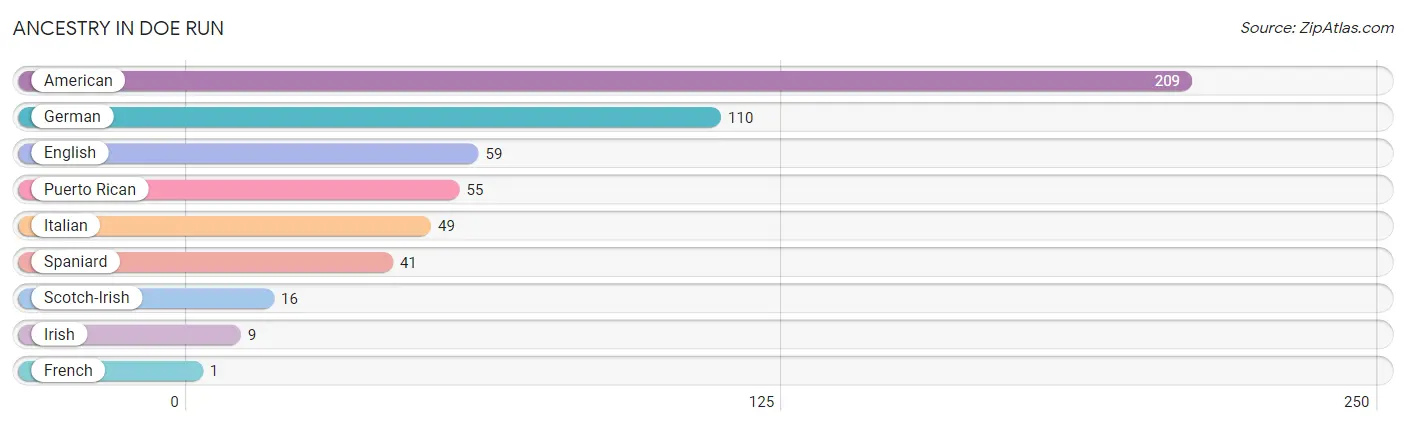
| Ancestry | # Population | % Population |
| American | 209 | 26.5% |
| English | 59 | 7.5% |
| French | 1 | 0.1% |
| German | 110 | 13.9% |
| Irish | 9 | 1.1% |
| Italian | 49 | 6.2% |
| Puerto Rican | 55 | 7.0% |
| Scotch-Irish | 16 | 2.0% |
| Spaniard | 41 | 5.2% | View All 9 Rows |
Immigrants in Doe Run

| Immigration Origin | # Population | % Population | View All 0 Rows |
Sex and Age in Doe Run
Sex and Age in Doe Run
The most populous age groups in Doe Run are 65 to 69 Years (293 | 56.6%) for men and 60 to 64 Years (52 | 19.1%) for women.
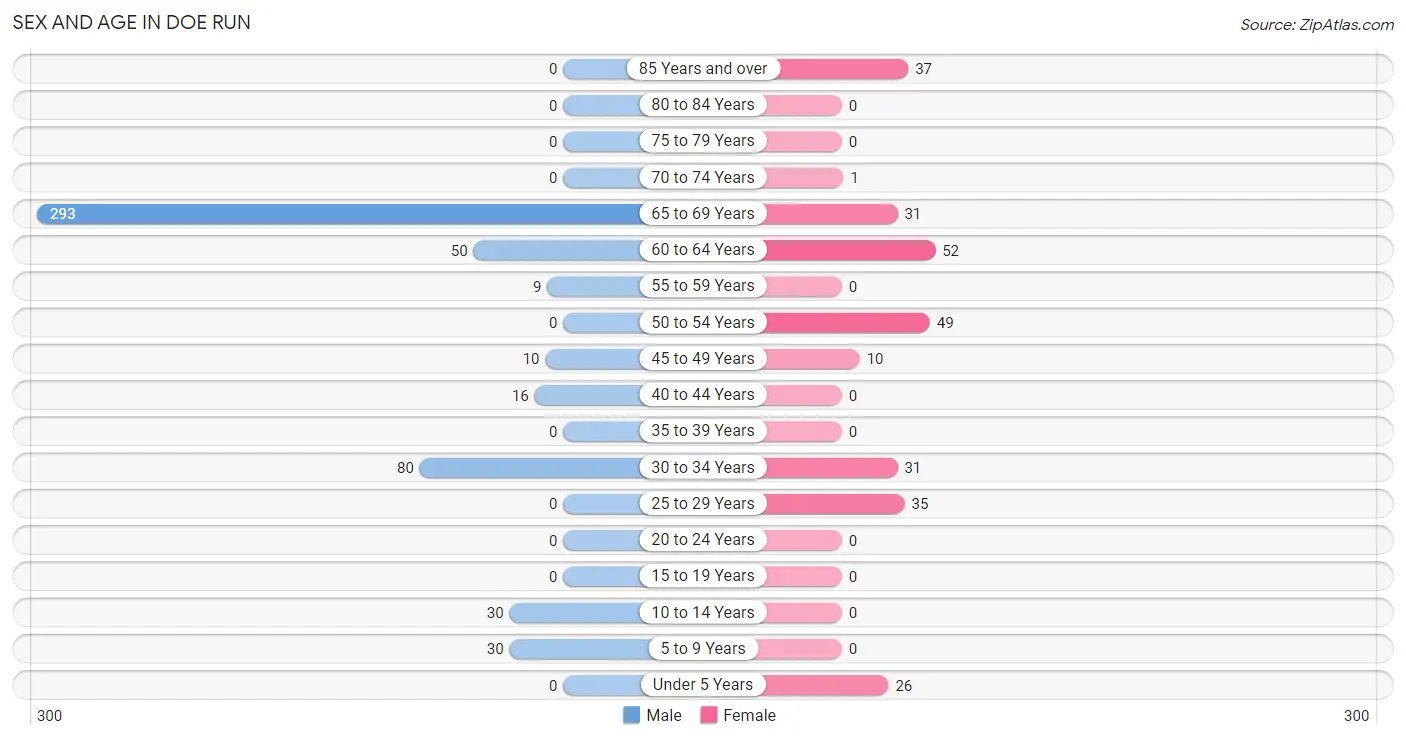
| Age Bracket | Male | Female |
| Under 5 Years | 0 (0.0%) | 26 (9.6%) |
| 5 to 9 Years | 30 (5.8%) | 0 (0.0%) |
| 10 to 14 Years | 30 (5.8%) | 0 (0.0%) |
| 15 to 19 Years | 0 (0.0%) | 0 (0.0%) |
| 20 to 24 Years | 0 (0.0%) | 0 (0.0%) |
| 25 to 29 Years | 0 (0.0%) | 35 (12.9%) |
| 30 to 34 Years | 80 (15.4%) | 31 (11.4%) |
| 35 to 39 Years | 0 (0.0%) | 0 (0.0%) |
| 40 to 44 Years | 16 (3.1%) | 0 (0.0%) |
| 45 to 49 Years | 10 (1.9%) | 10 (3.7%) |
| 50 to 54 Years | 0 (0.0%) | 49 (18.0%) |
| 55 to 59 Years | 9 (1.7%) | 0 (0.0%) |
| 60 to 64 Years | 50 (9.7%) | 52 (19.1%) |
| 65 to 69 Years | 293 (56.6%) | 31 (11.4%) |
| 70 to 74 Years | 0 (0.0%) | 1 (0.4%) |
| 75 to 79 Years | 0 (0.0%) | 0 (0.0%) |
| 80 to 84 Years | 0 (0.0%) | 0 (0.0%) |
| 85 Years and over | 0 (0.0%) | 37 (13.6%) |
| Total | 518 (100.0%) | 272 (100.0%) |
Families and Households in Doe Run
Median Family Size in Doe Run
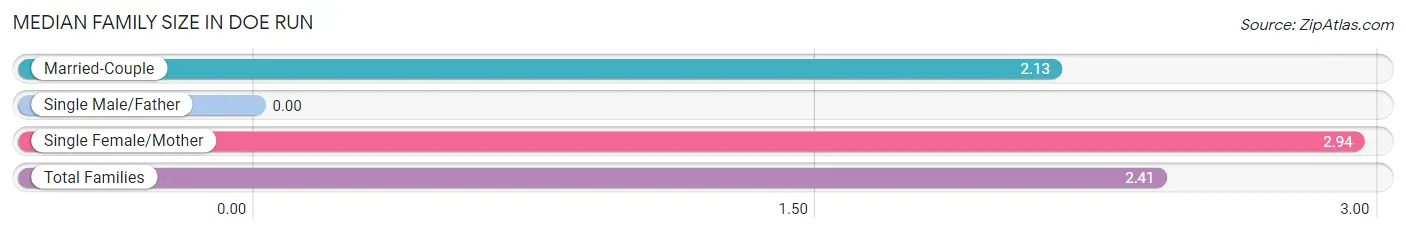
| Family Type | # Families | Family Size |
| Married-Couple | 99 (65.6%) | 2.13 |
| Single Male/Father | 0 (0.0%) | - |
| Single Female/Mother | 52 (34.4%) | 2.94 |
| Total Families | 151 (100.0%) | 2.41 |
Median Household Size in Doe Run
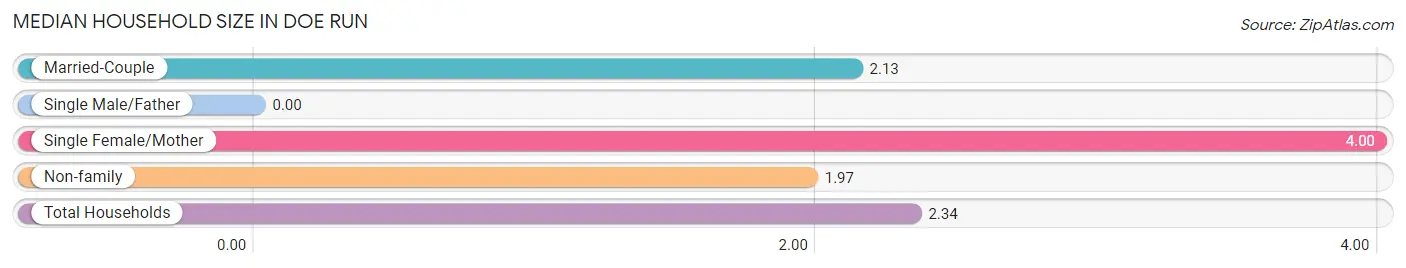
| Household Type | # Households | Household Size |
| Married-Couple | 99 (29.9%) | 2.13 |
| Single Male/Father | 0 (0.0%) | - |
| Single Female/Mother | 52 (15.7%) | 4.00 |
| Non-family | 180 (54.4%) | 1.97 |
| Total Households | 331 (100.0%) | 2.34 |
Household Size by Marriage Status in Doe Run
Out of a total of 331 households in Doe Run, 151 (45.6%) are family households, while 180 (54.4%) are nonfamily households. The most numerous type of family households are 2-person households, comprising 85, and the most common type of nonfamily households are 2-person households, comprising 123.
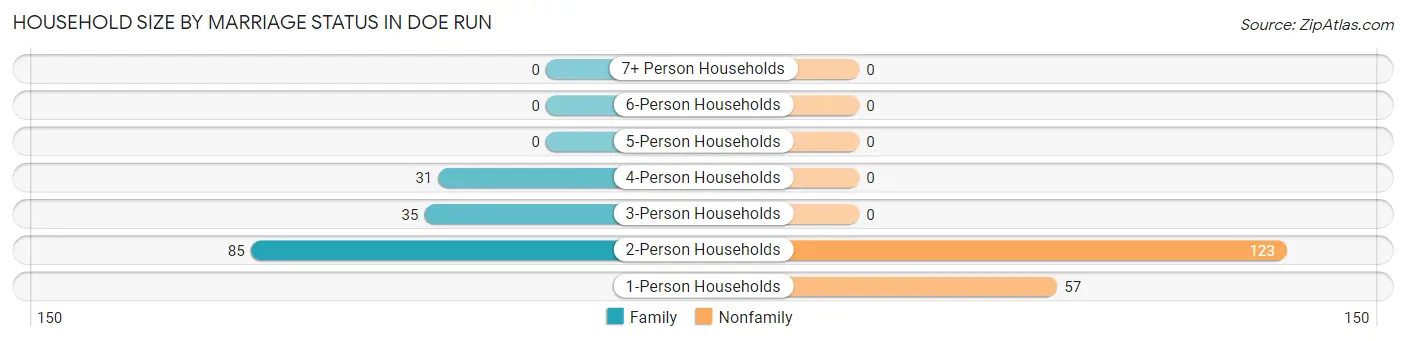
| Household Size | Family Households | Nonfamily Households |
| 1-Person Households | - | 57 (17.2%) |
| 2-Person Households | 85 (25.7%) | 123 (37.2%) |
| 3-Person Households | 35 (10.6%) | 0 (0.0%) |
| 4-Person Households | 31 (9.4%) | 0 (0.0%) |
| 5-Person Households | 0 (0.0%) | 0 (0.0%) |
| 6-Person Households | 0 (0.0%) | 0 (0.0%) |
| 7+ Person Households | 0 (0.0%) | 0 (0.0%) |
| Total | 151 (45.6%) | 180 (54.4%) |
Female Fertility in Doe Run
Fertility by Age in Doe Run
| Age Bracket | Women with Births | Births / 1,000 Women |
| 15 to 19 years | 0 (0.0%) | 0.0 |
| 20 to 34 years | 0 (0.0%) | 0.0 |
| 35 to 50 years | 0 (0.0%) | 0.0 |
| Total | 0 (0.0%) | 0.0 |
Fertility by Age by Marriage Status in Doe Run
| Age Bracket | Married | Unmarried |
| 15 to 19 years | 0 (0.0%) | 0 (0.0%) |
| 20 to 34 years | 0 (0.0%) | 0 (0.0%) |
| 35 to 50 years | 0 (0.0%) | 0 (0.0%) |
| Total | 0 (0.0%) | 0 (0.0%) |
Fertility by Education in Doe Run
| Educational Attainment | Women with Births | Births / 1,000 Women |
| Less than High School | 0 (0.0%) | 0.0 |
| High School Diploma | 0 (0.0%) | 0.0 |
| College or Associate's Degree | 0 (0.0%) | 0.0 |
| Bachelor's Degree | 0 (0.0%) | 0.0 |
| Graduate Degree | 0 (0.0%) | 0.0 |
| Total | 0 (0.0%) | 0.0 |
Fertility by Education by Marriage Status in Doe Run
| Educational Attainment | Married | Unmarried |
| Less than High School | 0 (0.0%) | 0 (0.0%) |
| High School Diploma | 0 (0.0%) | 0 (0.0%) |
| College or Associate's Degree | 0 (0.0%) | 0 (0.0%) |
| Bachelor's Degree | 0 (0.0%) | 0 (0.0%) |
| Graduate Degree | 0 (0.0%) | 0 (0.0%) |
| Total | 0 (0.0%) | 0 (0.0%) |
Employment Characteristics in Doe Run
Employment by Class of Employer in Doe Run
Among the 375 employed individuals in Doe Run, private company employees (280 | 74.7%), not-for-profit organizations (49 | 13.1%), and local government employees (35 | 9.3%) make up the most common classes of employment.
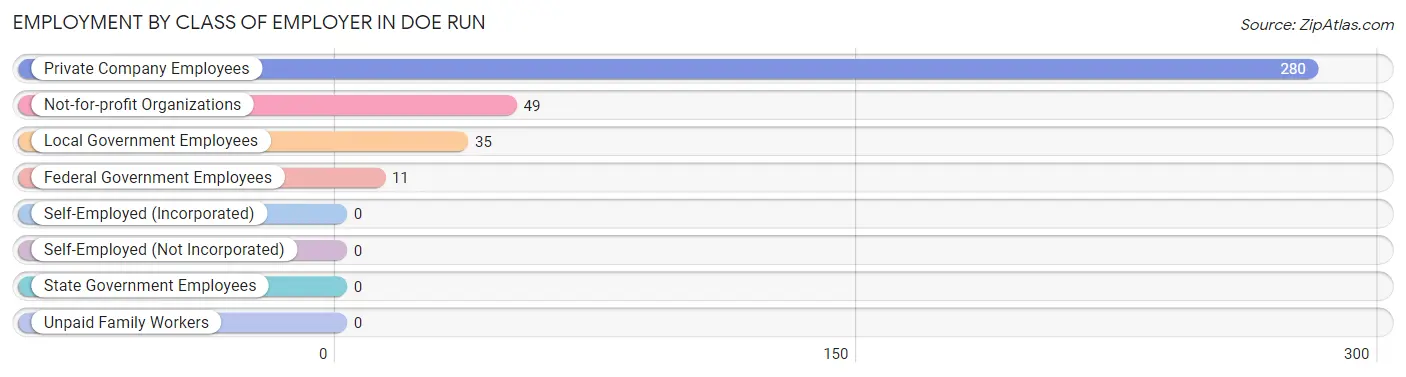
| Employer Class | # Employees | % Employees |
| Private Company Employees | 280 | 74.7% |
| Self-Employed (Incorporated) | 0 | 0.0% |
| Self-Employed (Not Incorporated) | 0 | 0.0% |
| Not-for-profit Organizations | 49 | 13.1% |
| Local Government Employees | 35 | 9.3% |
| State Government Employees | 0 | 0.0% |
| Federal Government Employees | 11 | 2.9% |
| Unpaid Family Workers | 0 | 0.0% |
| Total | 375 | 100.0% |
Employment Status by Age in Doe Run
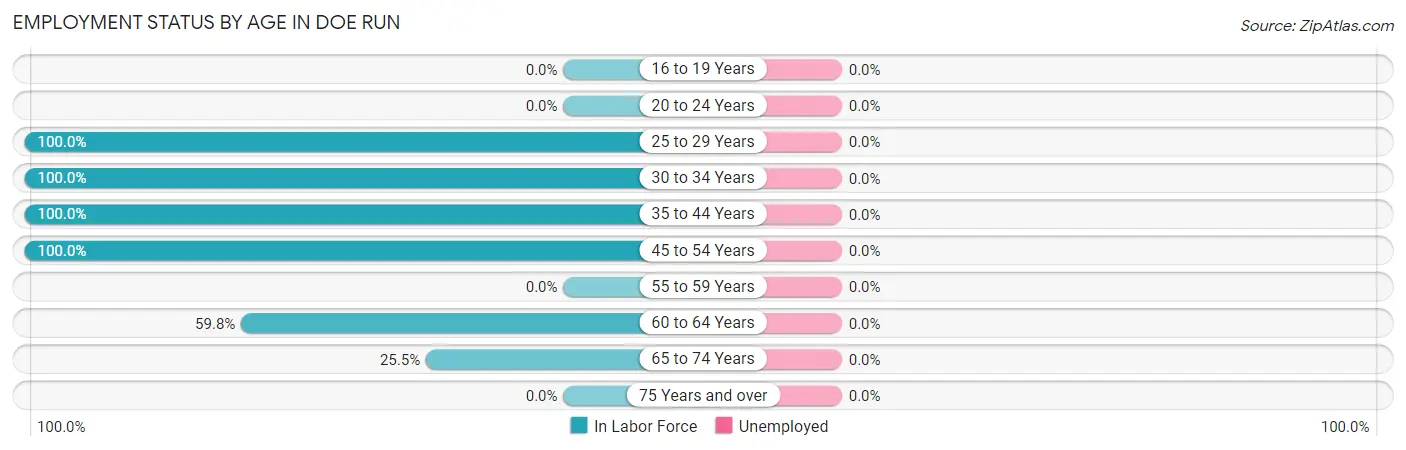
| Age Bracket | In Labor Force | Unemployed |
| 16 to 19 Years | 0 (0.0%) | 0 (0.0%) |
| 20 to 24 Years | 0 (0.0%) | 0 (0.0%) |
| 25 to 29 Years | 35 (100.0%) | 0 (0.0%) |
| 30 to 34 Years | 111 (100.0%) | 0 (0.0%) |
| 35 to 44 Years | 16 (100.0%) | 0 (0.0%) |
| 45 to 54 Years | 69 (100.0%) | 0 (0.0%) |
| 55 to 59 Years | 0 (0.0%) | 0 (0.0%) |
| 60 to 64 Years | 61 (59.8%) | 0 (0.0%) |
| 65 to 74 Years | 83 (25.5%) | 0 (0.0%) |
| 75 Years and over | 0 (0.0%) | 0 (0.0%) |
| Total | 375 (53.3%) | 0 (0.0%) |
Employment Status by Educational Attainment in Doe Run
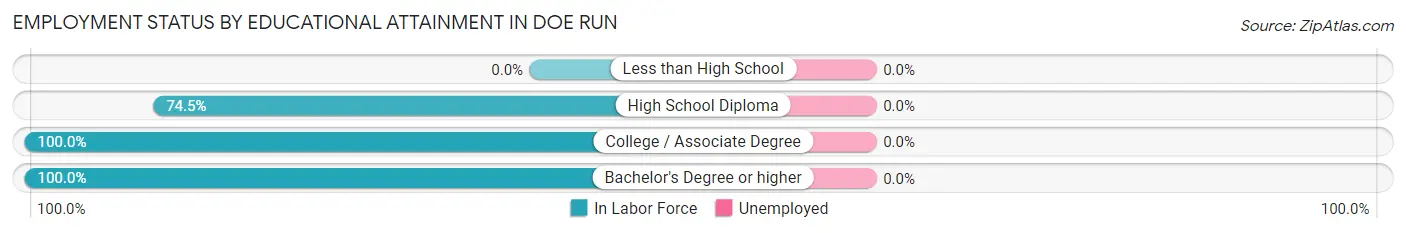
| Educational Attainment | In Labor Force | Unemployed |
| Less than High School | 0 (0.0%) | 0 (0.0%) |
| High School Diploma | 146 (74.5%) | 0 (0.0%) |
| College / Associate Degree | 101 (100.0%) | 0 (0.0%) |
| Bachelor's Degree or higher | 45 (100.0%) | 0 (0.0%) |
| Total | 292 (85.4%) | 0 (0.0%) |
Employment Occupations by Sex in Doe Run
Management, Business, Science and Arts Occupations
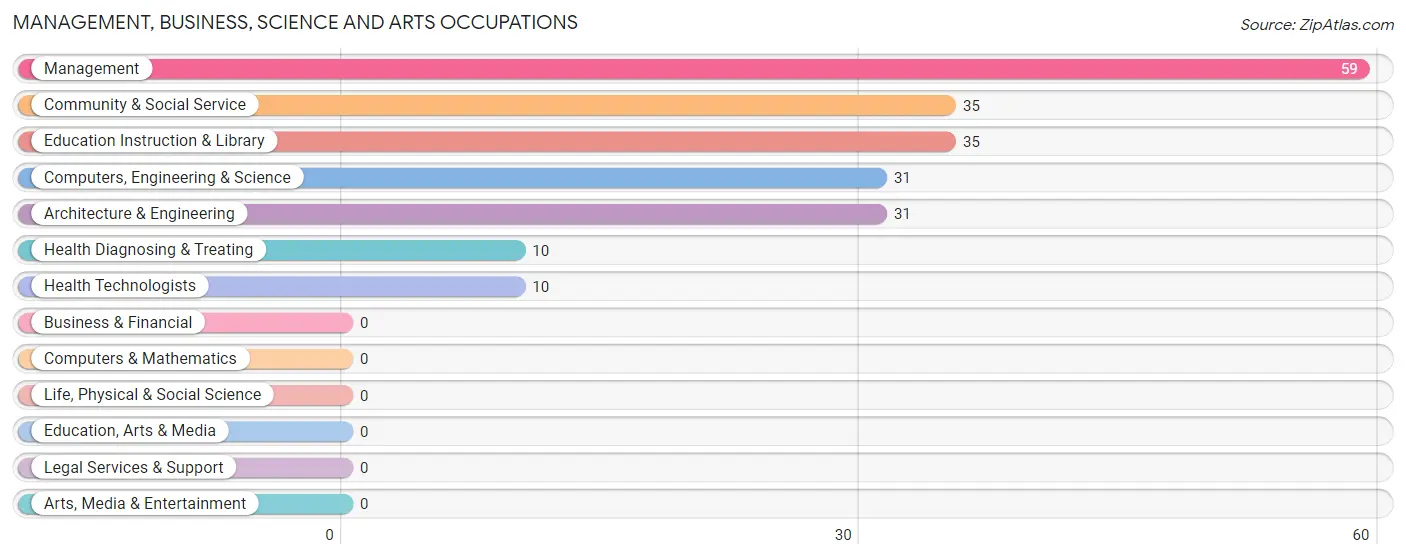
The most common Management, Business, Science and Arts occupations in Doe Run are Management (59 | 15.7%), Community & Social Service (35 | 9.3%), Education Instruction & Library (35 | 9.3%), Computers, Engineering & Science (31 | 8.3%), and Architecture & Engineering (31 | 8.3%).
Management, Business, Science and Arts Occupations by Sex
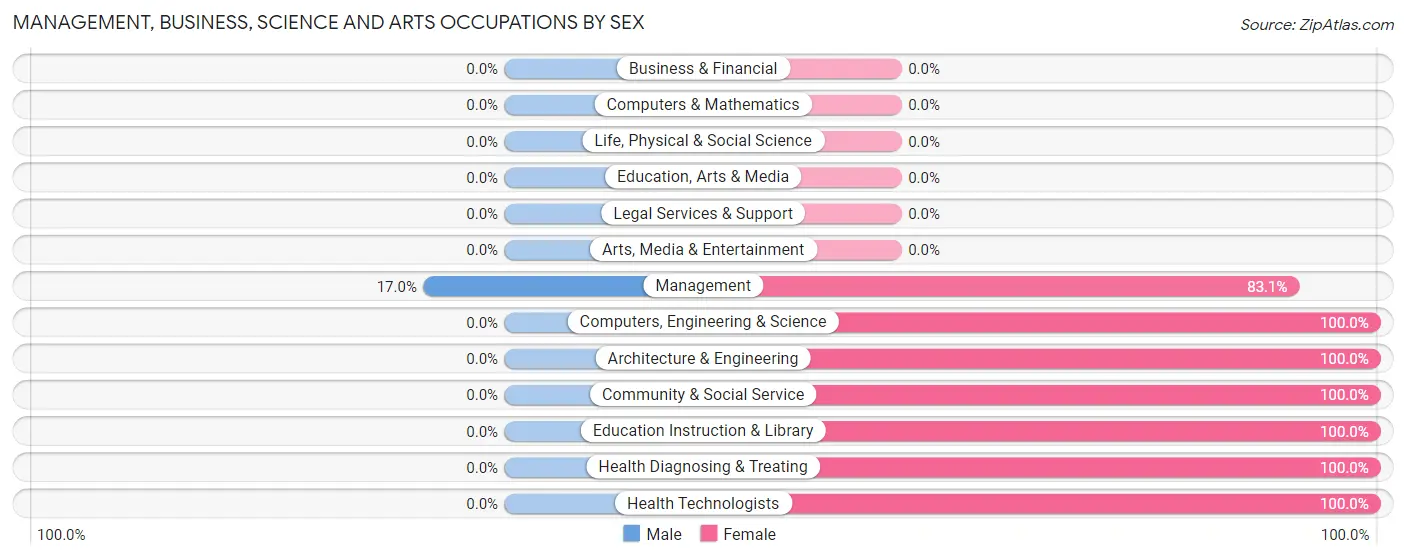
| Occupation | Male | Female |
| Management | 10 (17.0%) | 49 (83.1%) |
| Business & Financial | 0 (0.0%) | 0 (0.0%) |
| Computers, Engineering & Science | 0 (0.0%) | 31 (100.0%) |
| Computers & Mathematics | 0 (0.0%) | 0 (0.0%) |
| Architecture & Engineering | 0 (0.0%) | 31 (100.0%) |
| Life, Physical & Social Science | 0 (0.0%) | 0 (0.0%) |
| Community & Social Service | 0 (0.0%) | 35 (100.0%) |
| Education, Arts & Media | 0 (0.0%) | 0 (0.0%) |
| Legal Services & Support | 0 (0.0%) | 0 (0.0%) |
| Education Instruction & Library | 0 (0.0%) | 35 (100.0%) |
| Arts, Media & Entertainment | 0 (0.0%) | 0 (0.0%) |
| Health Diagnosing & Treating | 0 (0.0%) | 10 (100.0%) |
| Health Technologists | 0 (0.0%) | 10 (100.0%) |
| Total (Category) | 10 (7.4%) | 125 (92.6%) |
| Total (Overall) | 239 (63.7%) | 136 (36.3%) |
Services Occupations
The most common Services occupations in Doe Run are , and Cleaning & Maintenance (83 | 22.1%).
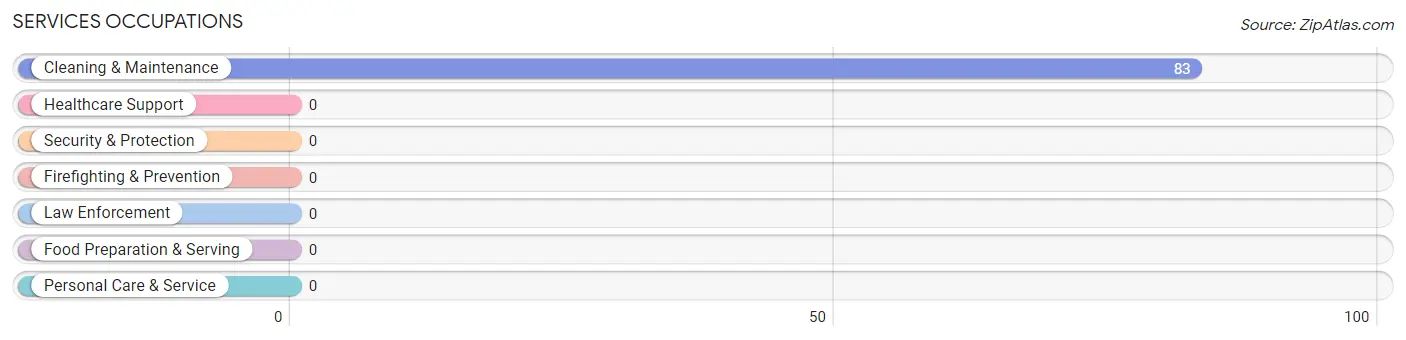
Services Occupations by Sex
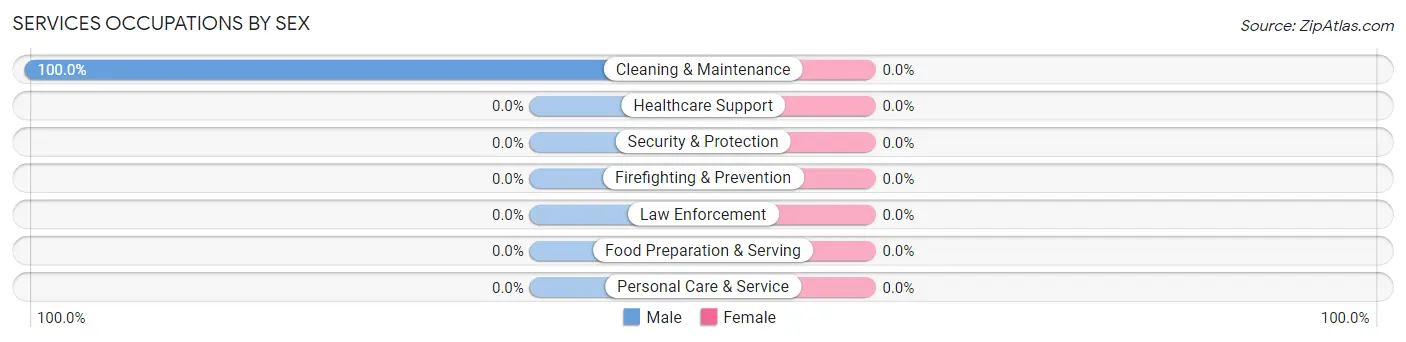
| Occupation | Male | Female |
| Healthcare Support | 0 (0.0%) | 0 (0.0%) |
| Security & Protection | 0 (0.0%) | 0 (0.0%) |
| Firefighting & Prevention | 0 (0.0%) | 0 (0.0%) |
| Law Enforcement | 0 (0.0%) | 0 (0.0%) |
| Food Preparation & Serving | 0 (0.0%) | 0 (0.0%) |
| Cleaning & Maintenance | 83 (100.0%) | 0 (0.0%) |
| Personal Care & Service | 0 (0.0%) | 0 (0.0%) |
| Total (Category) | 83 (100.0%) | 0 (0.0%) |
| Total (Overall) | 239 (63.7%) | 136 (36.3%) |
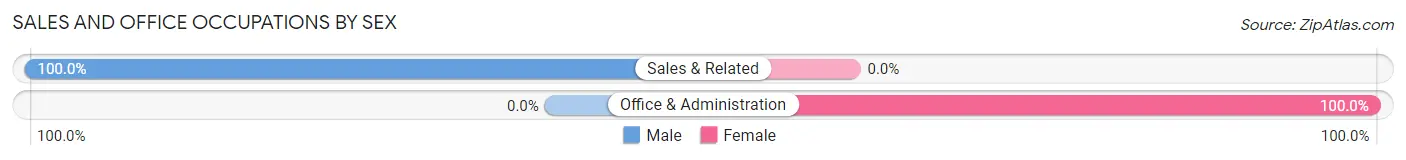
Sales and Office Occupations
The most common Sales and Office occupations in Doe Run are Sales & Related (40 | 10.7%), and Office & Administration (11 | 2.9%).
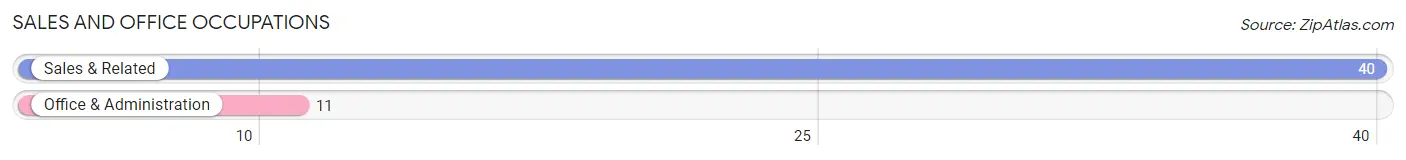
Sales and Office Occupations by Sex
| Occupation | Male | Female |
| Sales & Related | 40 (100.0%) | 0 (0.0%) |
| Office & Administration | 0 (0.0%) | 11 (100.0%) |
| Total (Category) | 40 (78.4%) | 11 (21.6%) |
| Total (Overall) | 239 (63.7%) | 136 (36.3%) |
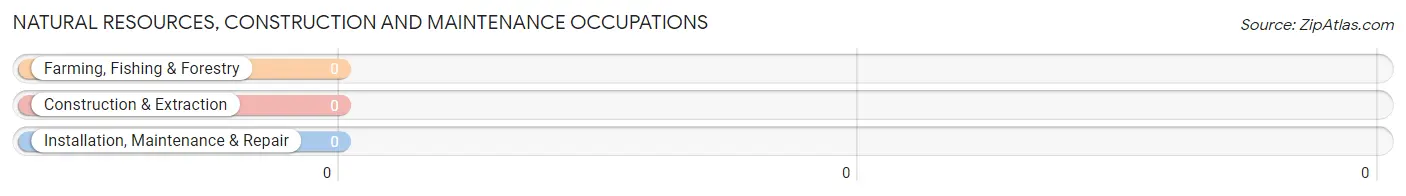
Natural Resources, Construction and Maintenance Occupations
Natural Resources, Construction and Maintenance Occupations by Sex
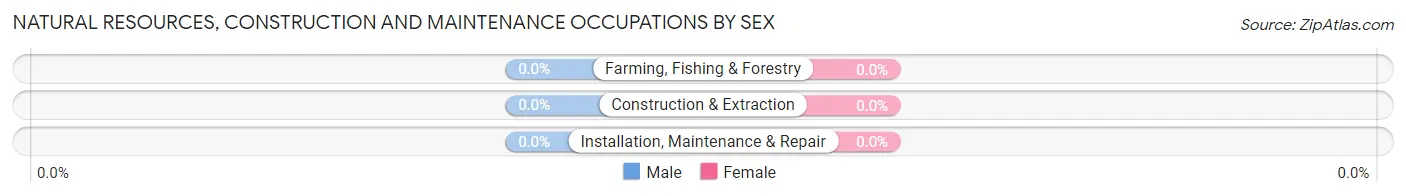
| Occupation | Male | Female |
| Farming, Fishing & Forestry | 0 (0.0%) | 0 (0.0%) |
| Construction & Extraction | 0 (0.0%) | 0 (0.0%) |
| Installation, Maintenance & Repair | 0 (0.0%) | 0 (0.0%) |
| Total (Category) | 0 (0.0%) | 0 (0.0%) |
| Total (Overall) | 239 (63.7%) | 136 (36.3%) |
Production, Transportation and Moving Occupations
The most common Production, Transportation and Moving occupations in Doe Run are Production (90 | 24.0%), and Transportation (16 | 4.3%).
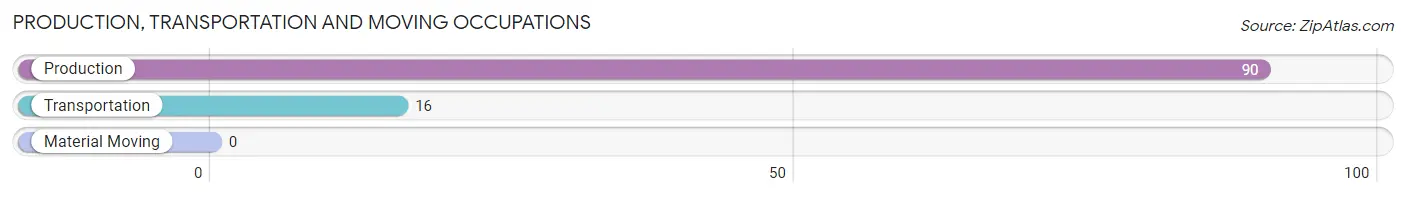
Production, Transportation and Moving Occupations by Sex
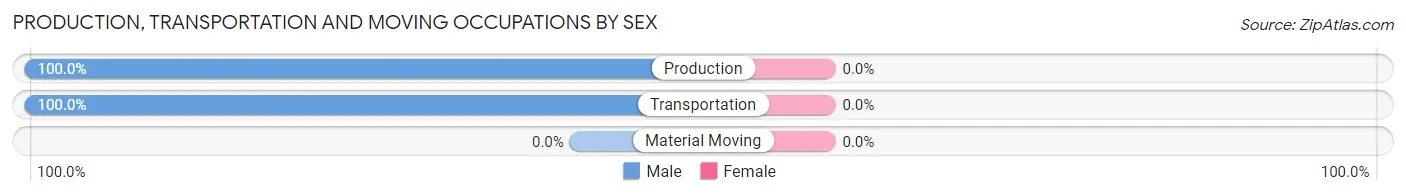
| Occupation | Male | Female |
| Production | 90 (100.0%) | 0 (0.0%) |
| Transportation | 16 (100.0%) | 0 (0.0%) |
| Material Moving | 0 (0.0%) | 0 (0.0%) |
| Total (Category) | 106 (100.0%) | 0 (0.0%) |
| Total (Overall) | 239 (63.7%) | 136 (36.3%) |
Employment Industries by Sex in Doe Run
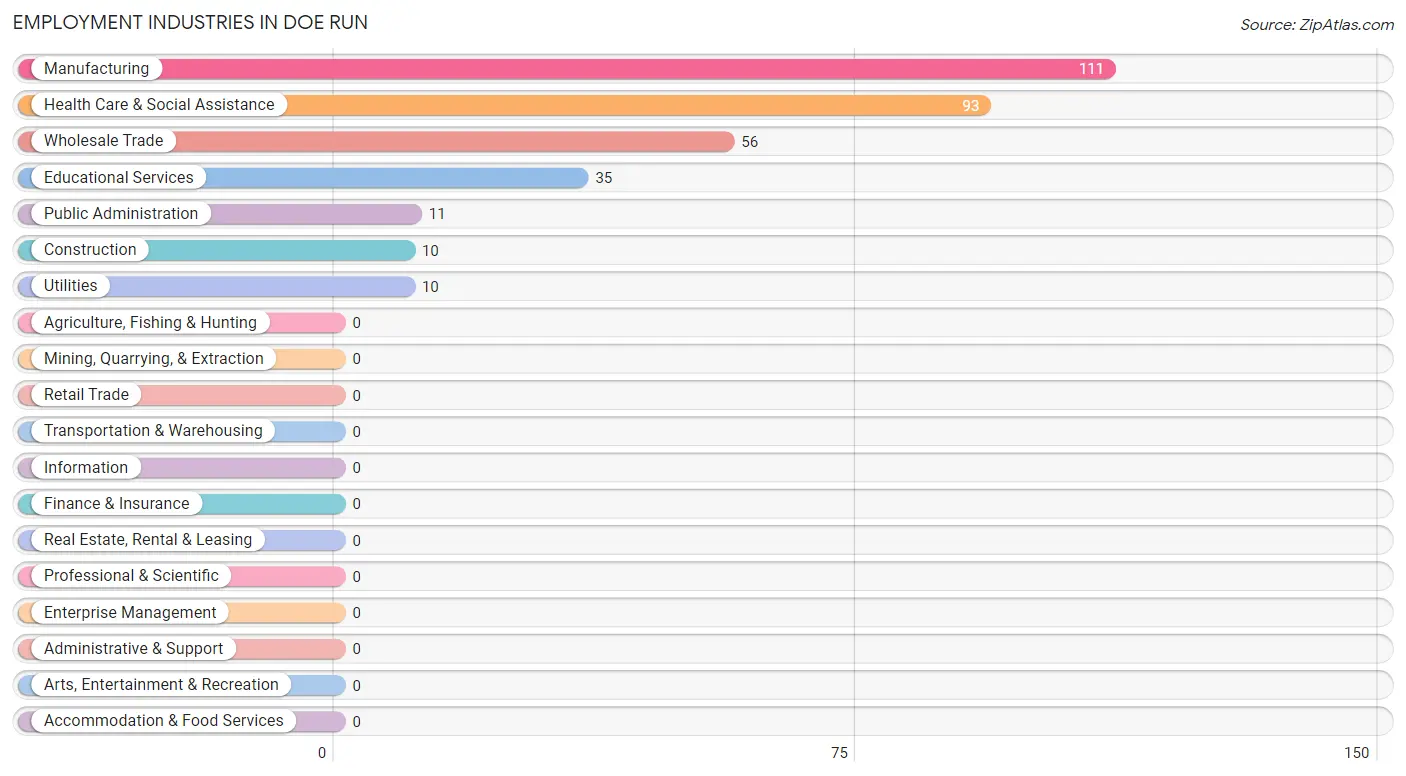
Employment Industries in Doe Run
The major employment industries in Doe Run include Manufacturing (111 | 29.6%), Health Care & Social Assistance (93 | 24.8%), Wholesale Trade (56 | 14.9%), Educational Services (35 | 9.3%), and Public Administration (11 | 2.9%).
Employment Industries by Sex in Doe Run
The Doe Run industries that see more men than women are Construction (100.0%), Wholesale Trade (100.0%), and Utilities (100.0%), whereas the industries that tend to have a higher number of women are Educational Services (100.0%), Public Administration (100.0%), and Manufacturing (27.9%).
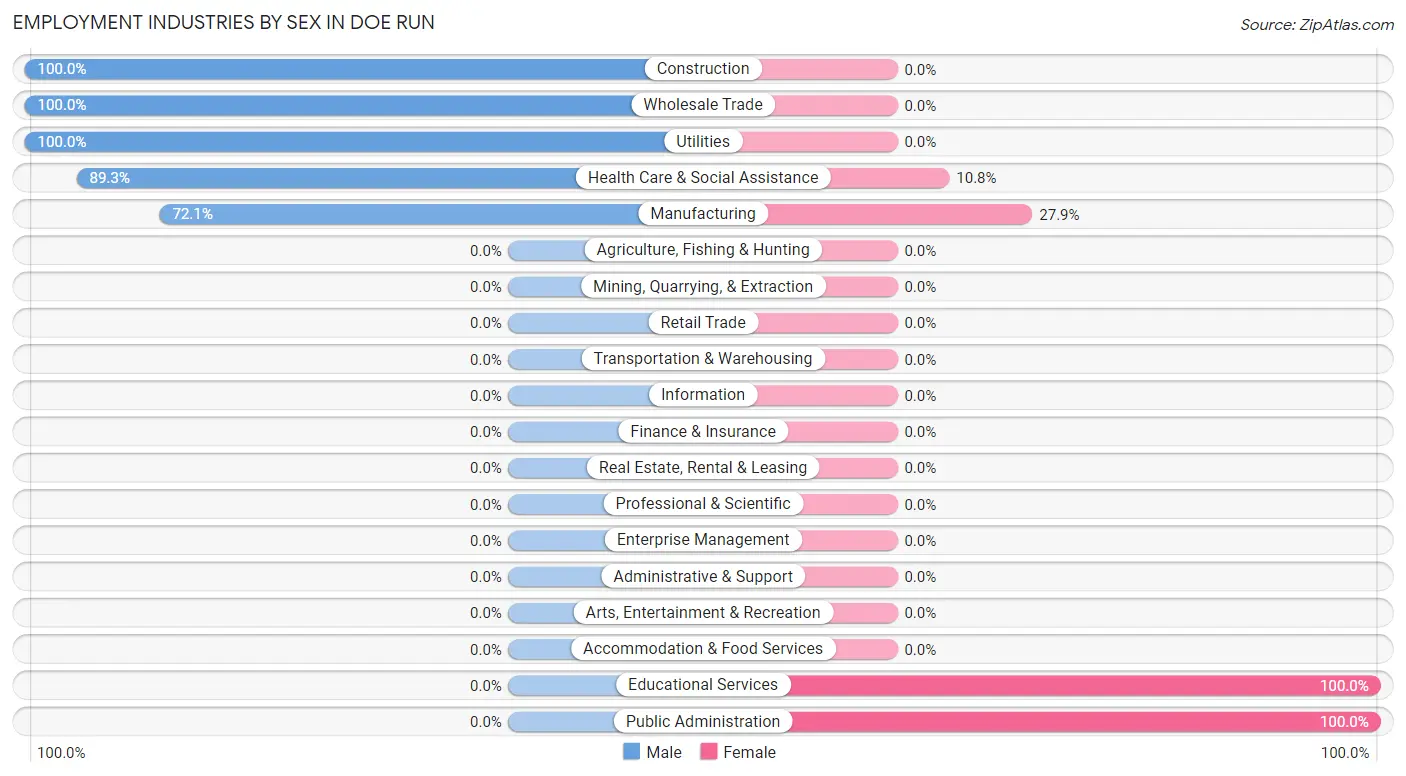
| Industry | Male | Female |
| Agriculture, Fishing & Hunting | 0 (0.0%) | 0 (0.0%) |
| Mining, Quarrying, & Extraction | 0 (0.0%) | 0 (0.0%) |
| Construction | 10 (100.0%) | 0 (0.0%) |
| Manufacturing | 80 (72.1%) | 31 (27.9%) |
| Wholesale Trade | 56 (100.0%) | 0 (0.0%) |
| Retail Trade | 0 (0.0%) | 0 (0.0%) |
| Transportation & Warehousing | 0 (0.0%) | 0 (0.0%) |
| Utilities | 10 (100.0%) | 0 (0.0%) |
| Information | 0 (0.0%) | 0 (0.0%) |
| Finance & Insurance | 0 (0.0%) | 0 (0.0%) |
| Real Estate, Rental & Leasing | 0 (0.0%) | 0 (0.0%) |
| Professional & Scientific | 0 (0.0%) | 0 (0.0%) |
| Enterprise Management | 0 (0.0%) | 0 (0.0%) |
| Administrative & Support | 0 (0.0%) | 0 (0.0%) |
| Educational Services | 0 (0.0%) | 35 (100.0%) |
| Health Care & Social Assistance | 83 (89.2%) | 10 (10.7%) |
| Arts, Entertainment & Recreation | 0 (0.0%) | 0 (0.0%) |
| Accommodation & Food Services | 0 (0.0%) | 0 (0.0%) |
| Public Administration | 0 (0.0%) | 11 (100.0%) |
| Total | 239 (63.7%) | 136 (36.3%) |
Education in Doe Run
School Enrollment in Doe Run
The most common levels of schooling among the 86 students in Doe Run are elementary school (60 | 69.8%), and nursery / preschool (26 | 30.2%).
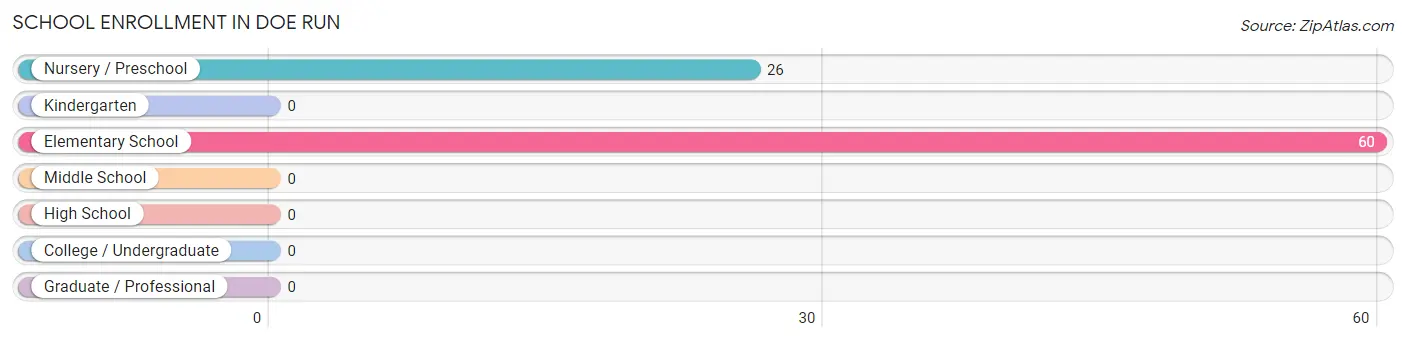
| School Level | # Students | % Students |
| Nursery / Preschool | 26 | 30.2% |
| Kindergarten | 0 | 0.0% |
| Elementary School | 60 | 69.8% |
| Middle School | 0 | 0.0% |
| High School | 0 | 0.0% |
| College / Undergraduate | 0 | 0.0% |
| Graduate / Professional | 0 | 0.0% |
| Total | 86 | 100.0% |
School Enrollment by Age by Funding Source in Doe Run
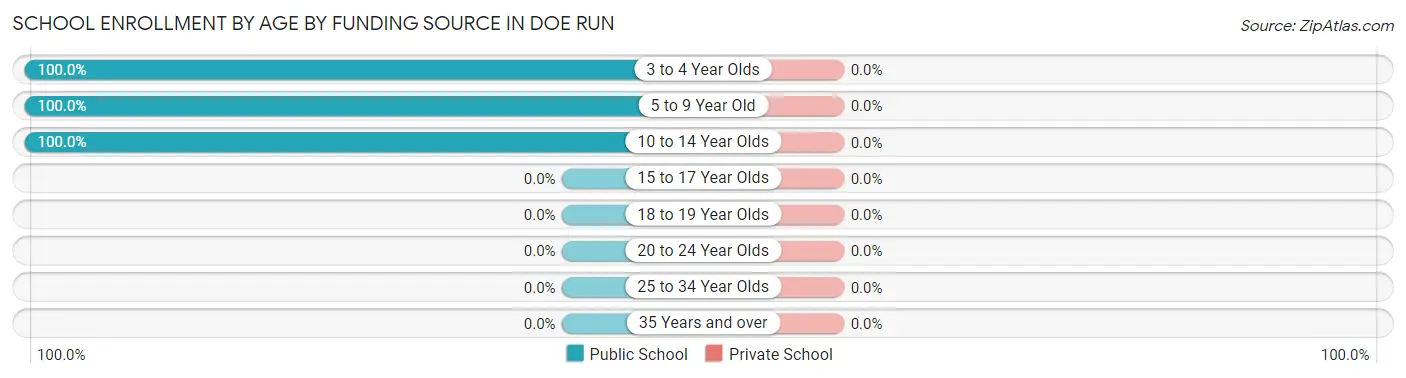
| Age Bracket | Public School | Private School |
| 3 to 4 Year Olds | 26 (100.0%) | 0 (0.0%) |
| 5 to 9 Year Old | 30 (100.0%) | 0 (0.0%) |
| 10 to 14 Year Olds | 30 (100.0%) | 0 (0.0%) |
| 15 to 17 Year Olds | 0 (0.0%) | 0 (0.0%) |
| 18 to 19 Year Olds | 0 (0.0%) | 0 (0.0%) |
| 20 to 24 Year Olds | 0 (0.0%) | 0 (0.0%) |
| 25 to 34 Year Olds | 0 (0.0%) | 0 (0.0%) |
| 35 Years and over | 0 (0.0%) | 0 (0.0%) |
| Total | 86 (100.0%) | 0 (0.0%) |
Educational Attainment by Field of Study in Doe Run
Visual & performing arts (35 | 76.1%), science & technology (10 | 21.7%), and arts & humanities (1 | 2.2%) are the most common fields of study among 46 individuals in Doe Run who have obtained a bachelor's degree or higher.
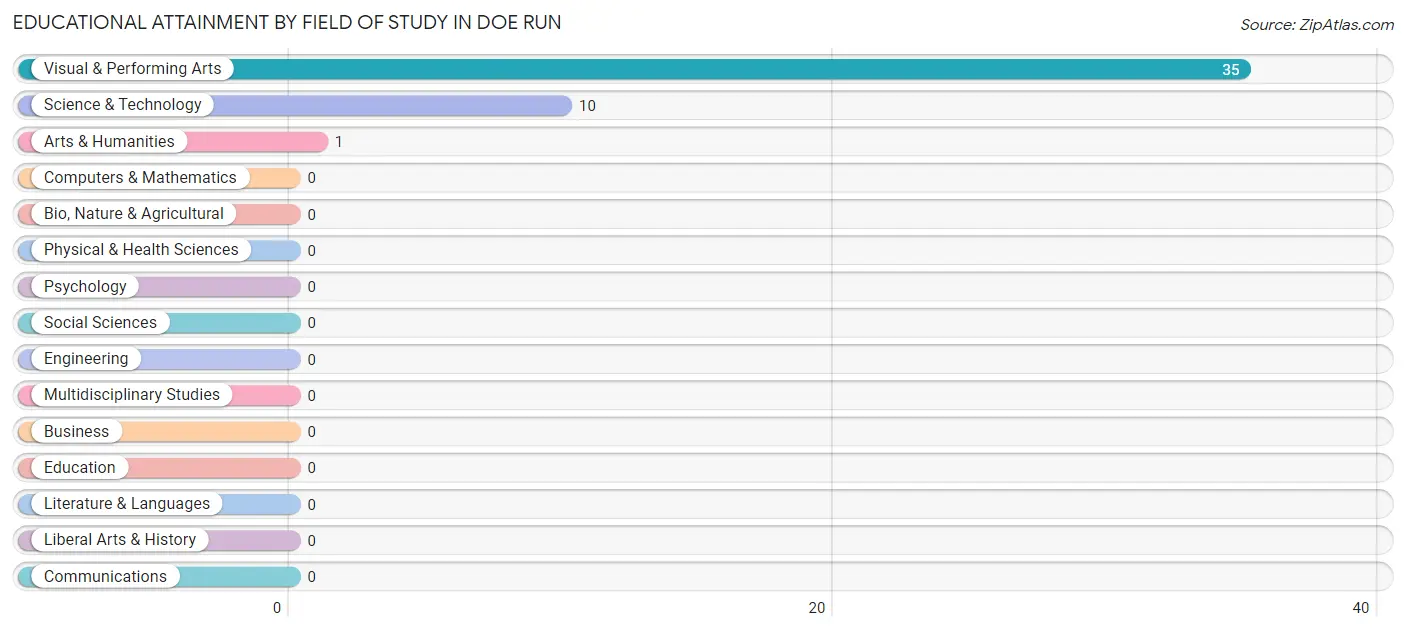
| Field of Study | # Graduates | % Graduates |
| Computers & Mathematics | 0 | 0.0% |
| Bio, Nature & Agricultural | 0 | 0.0% |
| Physical & Health Sciences | 0 | 0.0% |
| Psychology | 0 | 0.0% |
| Social Sciences | 0 | 0.0% |
| Engineering | 0 | 0.0% |
| Multidisciplinary Studies | 0 | 0.0% |
| Science & Technology | 10 | 21.7% |
| Business | 0 | 0.0% |
| Education | 0 | 0.0% |
| Literature & Languages | 0 | 0.0% |
| Liberal Arts & History | 0 | 0.0% |
| Visual & Performing Arts | 35 | 76.1% |
| Communications | 0 | 0.0% |
| Arts & Humanities | 1 | 2.2% |
| Total | 46 | 100.0% |
Transportation & Commute in Doe Run
Vehicle Availability by Sex in Doe Run
The most prevalent vehicle ownership categories in Doe Run are males with 1 vehicle (99, accounting for 41.4%) and females with 1 vehicle (0, making up 72.8%).
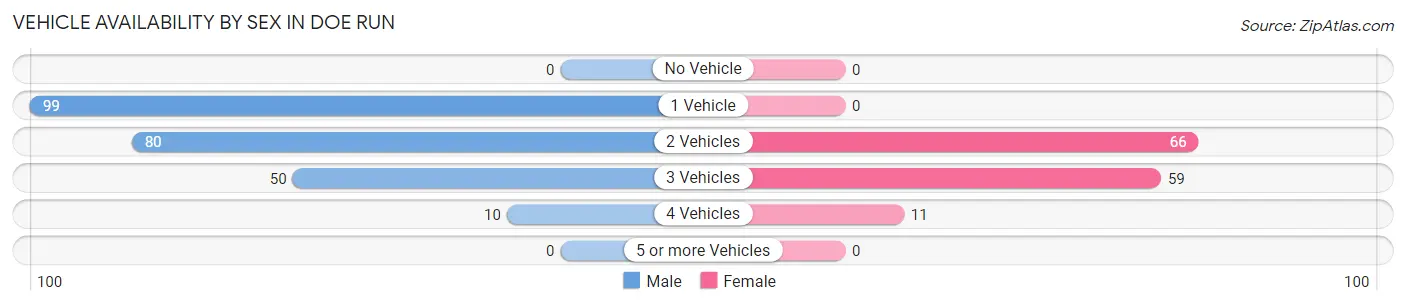
| Vehicles Available | Male | Female |
| No Vehicle | 0 (0.0%) | 0 (0.0%) |
| 1 Vehicle | 99 (41.4%) | 0 (0.0%) |
| 2 Vehicles | 80 (33.5%) | 66 (48.5%) |
| 3 Vehicles | 50 (20.9%) | 59 (43.4%) |
| 4 Vehicles | 10 (4.2%) | 11 (8.1%) |
| 5 or more Vehicles | 0 (0.0%) | 0 (0.0%) |
| Total | 239 (100.0%) | 136 (100.0%) |
Commute Time in Doe Run
The most frequently occuring commute durations in Doe Run are 10 to 14 minutes (154 commuters, 41.1%), 15 to 19 minutes (101 commuters, 26.9%), and 5 to 9 minutes (59 commuters, 15.7%).
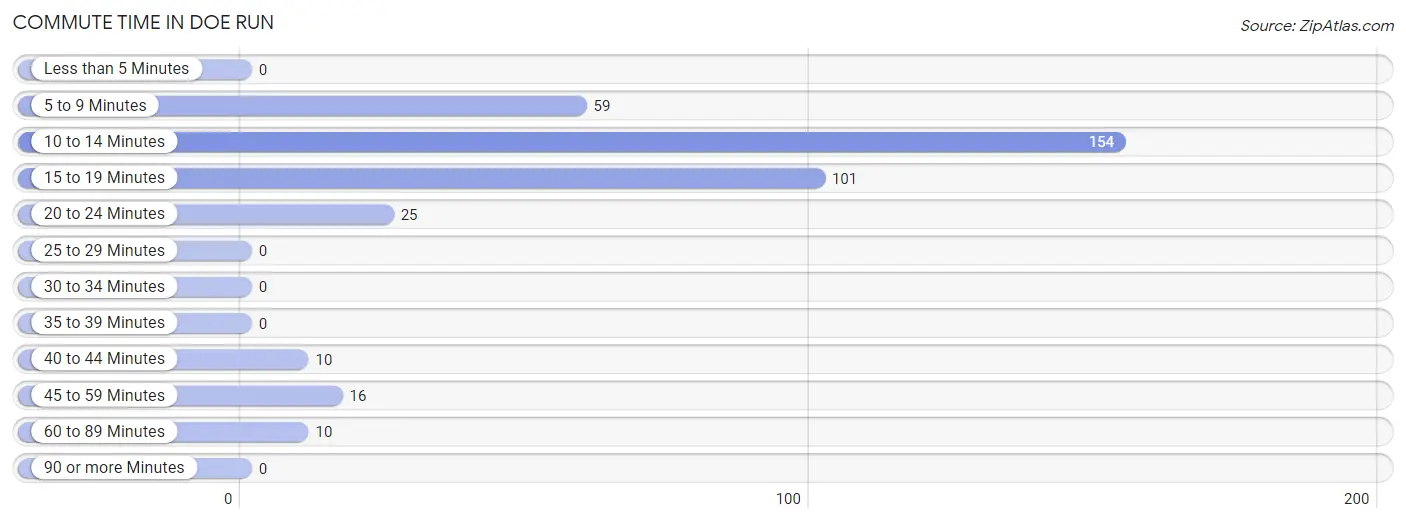
| Commute Time | # Commuters | % Commuters |
| Less than 5 Minutes | 0 | 0.0% |
| 5 to 9 Minutes | 59 | 15.7% |
| 10 to 14 Minutes | 154 | 41.1% |
| 15 to 19 Minutes | 101 | 26.9% |
| 20 to 24 Minutes | 25 | 6.7% |
| 25 to 29 Minutes | 0 | 0.0% |
| 30 to 34 Minutes | 0 | 0.0% |
| 35 to 39 Minutes | 0 | 0.0% |
| 40 to 44 Minutes | 10 | 2.7% |
| 45 to 59 Minutes | 16 | 4.3% |
| 60 to 89 Minutes | 10 | 2.7% |
| 90 or more Minutes | 0 | 0.0% |
Commute Time by Sex in Doe Run
The most common commute times in Doe Run are 10 to 14 minutes (123 commuters, 51.5%) for males and 5 to 9 minutes (49 commuters, 36.0%) for females.
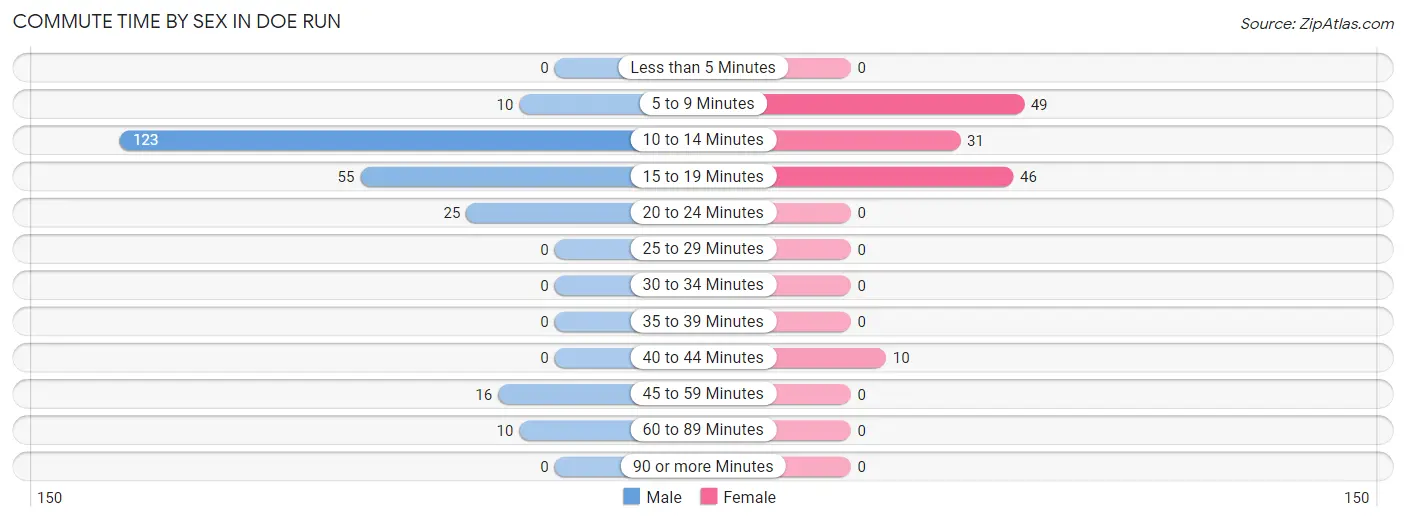
| Commute Time | Male | Female |
| Less than 5 Minutes | 0 (0.0%) | 0 (0.0%) |
| 5 to 9 Minutes | 10 (4.2%) | 49 (36.0%) |
| 10 to 14 Minutes | 123 (51.5%) | 31 (22.8%) |
| 15 to 19 Minutes | 55 (23.0%) | 46 (33.8%) |
| 20 to 24 Minutes | 25 (10.5%) | 0 (0.0%) |
| 25 to 29 Minutes | 0 (0.0%) | 0 (0.0%) |
| 30 to 34 Minutes | 0 (0.0%) | 0 (0.0%) |
| 35 to 39 Minutes | 0 (0.0%) | 0 (0.0%) |
| 40 to 44 Minutes | 0 (0.0%) | 10 (7.3%) |
| 45 to 59 Minutes | 16 (6.7%) | 0 (0.0%) |
| 60 to 89 Minutes | 10 (4.2%) | 0 (0.0%) |
| 90 or more Minutes | 0 (0.0%) | 0 (0.0%) |
Time of Departure to Work by Sex in Doe Run
The most frequent times of departure to work in Doe Run are 4:00 PM to 11:59 PM (108, 45.2%) for males and 8:00 AM to 8:29 AM (49, 36.0%) for females.
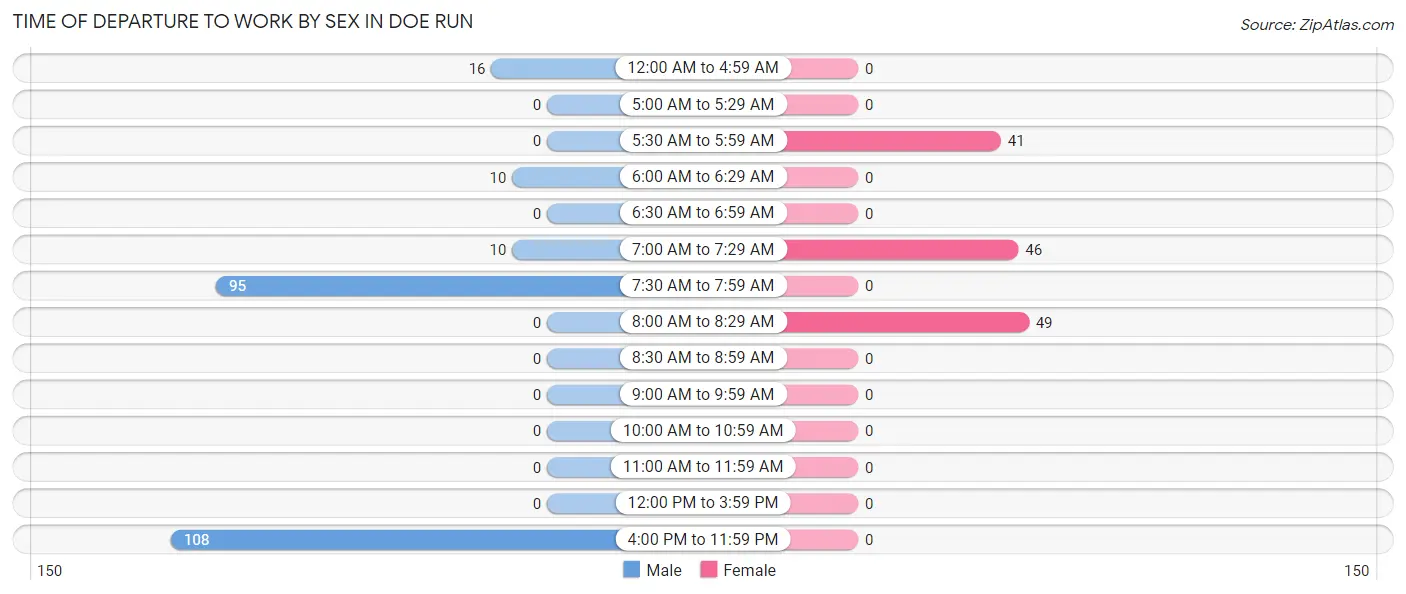
| Time of Departure | Male | Female |
| 12:00 AM to 4:59 AM | 16 (6.7%) | 0 (0.0%) |
| 5:00 AM to 5:29 AM | 0 (0.0%) | 0 (0.0%) |
| 5:30 AM to 5:59 AM | 0 (0.0%) | 41 (30.1%) |
| 6:00 AM to 6:29 AM | 10 (4.2%) | 0 (0.0%) |
| 6:30 AM to 6:59 AM | 0 (0.0%) | 0 (0.0%) |
| 7:00 AM to 7:29 AM | 10 (4.2%) | 46 (33.8%) |
| 7:30 AM to 7:59 AM | 95 (39.8%) | 0 (0.0%) |
| 8:00 AM to 8:29 AM | 0 (0.0%) | 49 (36.0%) |
| 8:30 AM to 8:59 AM | 0 (0.0%) | 0 (0.0%) |
| 9:00 AM to 9:59 AM | 0 (0.0%) | 0 (0.0%) |
| 10:00 AM to 10:59 AM | 0 (0.0%) | 0 (0.0%) |
| 11:00 AM to 11:59 AM | 0 (0.0%) | 0 (0.0%) |
| 12:00 PM to 3:59 PM | 0 (0.0%) | 0 (0.0%) |
| 4:00 PM to 11:59 PM | 108 (45.2%) | 0 (0.0%) |
| Total | 239 (100.0%) | 136 (100.0%) |
Housing Occupancy in Doe Run
Occupancy by Ownership in Doe Run
Of the total 331 dwellings in Doe Run, owner-occupied units account for 275 (83.1%), while renter-occupied units make up 56 (16.9%).
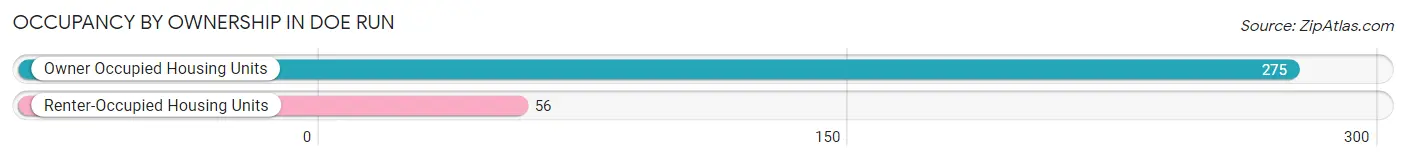
| Occupancy | # Housing Units | % Housing Units |
| Owner Occupied Housing Units | 275 | 83.1% |
| Renter-Occupied Housing Units | 56 | 16.9% |
| Total Occupied Housing Units | 331 | 100.0% |
Occupancy by Household Size in Doe Run
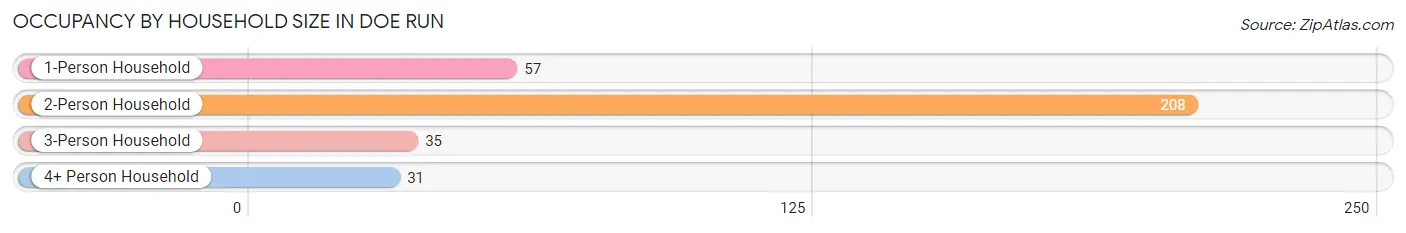
| Household Size | # Housing Units | % Housing Units |
| 1-Person Household | 57 | 17.2% |
| 2-Person Household | 208 | 62.8% |
| 3-Person Household | 35 | 10.6% |
| 4+ Person Household | 31 | 9.4% |
| Total Housing Units | 331 | 100.0% |
Occupancy by Ownership by Household Size in Doe Run
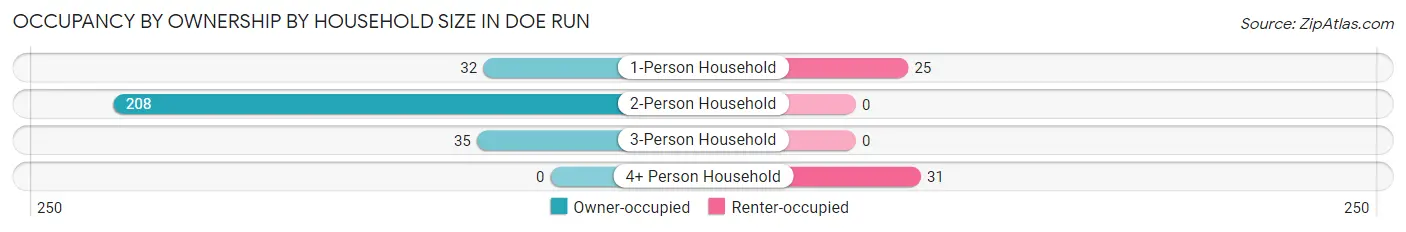
| Household Size | Owner-occupied | Renter-occupied |
| 1-Person Household | 32 (56.1%) | 25 (43.9%) |
| 2-Person Household | 208 (100.0%) | 0 (0.0%) |
| 3-Person Household | 35 (100.0%) | 0 (0.0%) |
| 4+ Person Household | 0 (0.0%) | 31 (100.0%) |
| Total Housing Units | 275 (83.1%) | 56 (16.9%) |
Occupancy by Educational Attainment in Doe Run
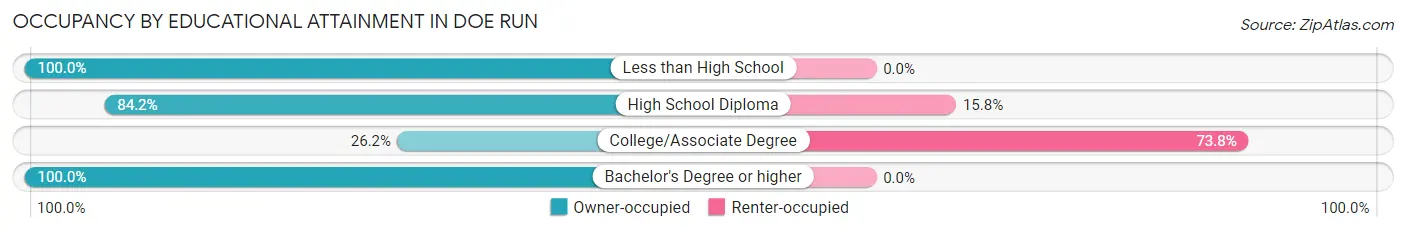
| Household Size | Owner-occupied | Renter-occupied |
| Less than High School | 95 (100.0%) | 0 (0.0%) |
| High School Diploma | 133 (84.2%) | 25 (15.8%) |
| College/Associate Degree | 11 (26.2%) | 31 (73.8%) |
| Bachelor's Degree or higher | 36 (100.0%) | 0 (0.0%) |
Occupancy by Age of Householder in Doe Run
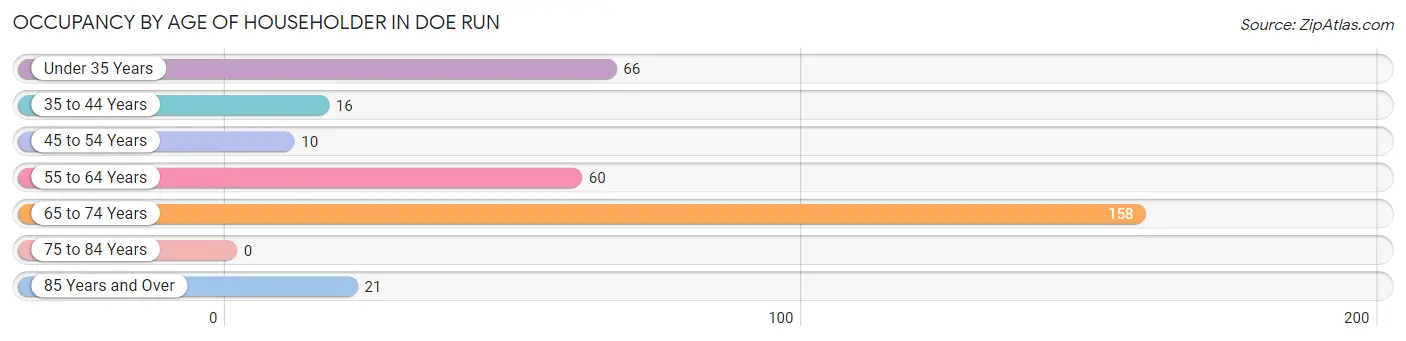
| Age Bracket | # Households | % Households |
| Under 35 Years | 66 | 19.9% |
| 35 to 44 Years | 16 | 4.8% |
| 45 to 54 Years | 10 | 3.0% |
| 55 to 64 Years | 60 | 18.1% |
| 65 to 74 Years | 158 | 47.7% |
| 75 to 84 Years | 0 | 0.0% |
| 85 Years and Over | 21 | 6.3% |
| Total | 331 | 100.0% |
Housing Finances in Doe Run
Median Income by Occupancy in Doe Run
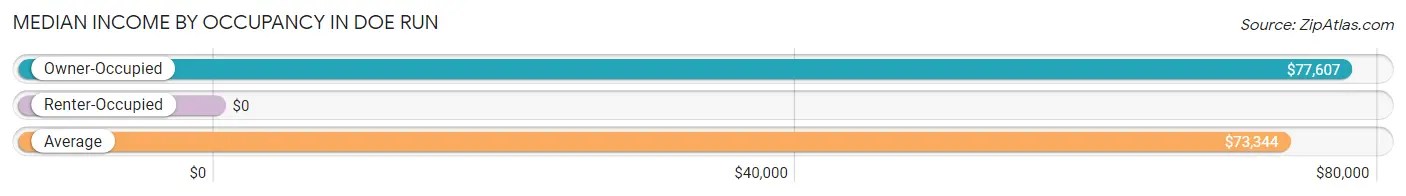
| Occupancy Type | # Households | Median Income |
| Owner-Occupied | 275 (83.1%) | $77,607 |
| Renter-Occupied | 56 (16.9%) | $0 |
| Average | 331 (100.0%) | $73,344 |
Occupancy by Householder Income Bracket in Doe Run
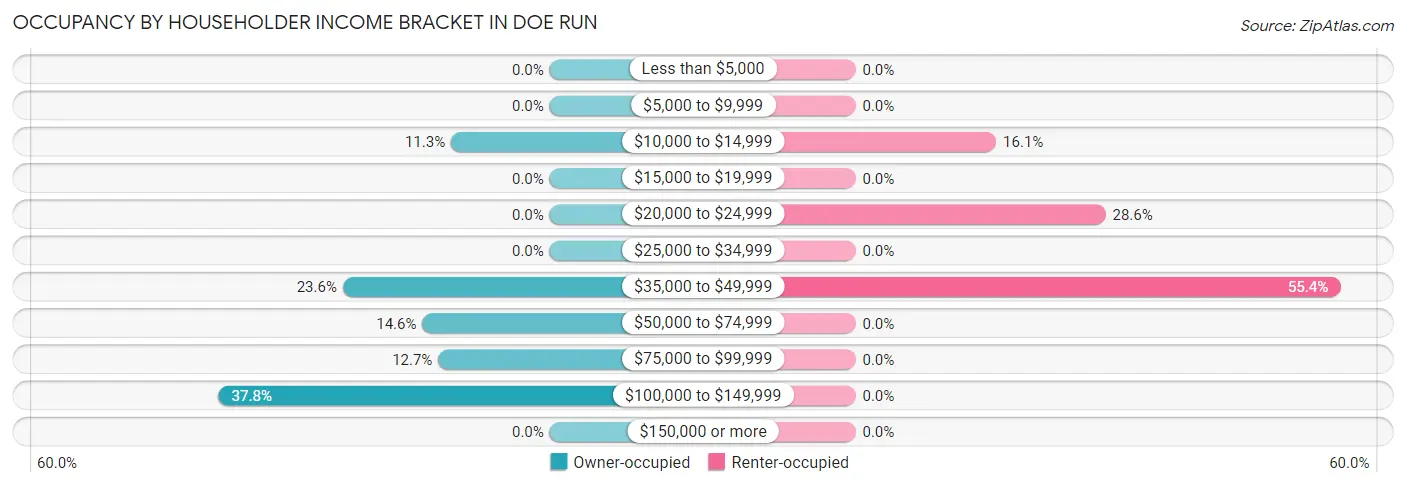
| Income Bracket | Owner-occupied | Renter-occupied |
| Less than $5,000 | 0 (0.0%) | 0 (0.0%) |
| $5,000 to $9,999 | 0 (0.0%) | 0 (0.0%) |
| $10,000 to $14,999 | 31 (11.3%) | 9 (16.1%) |
| $15,000 to $19,999 | 0 (0.0%) | 0 (0.0%) |
| $20,000 to $24,999 | 0 (0.0%) | 16 (28.6%) |
| $25,000 to $34,999 | 0 (0.0%) | 0 (0.0%) |
| $35,000 to $49,999 | 65 (23.6%) | 31 (55.4%) |
| $50,000 to $74,999 | 40 (14.5%) | 0 (0.0%) |
| $75,000 to $99,999 | 35 (12.7%) | 0 (0.0%) |
| $100,000 to $149,999 | 104 (37.8%) | 0 (0.0%) |
| $150,000 or more | 0 (0.0%) | 0 (0.0%) |
| Total | 275 (100.0%) | 56 (100.0%) |
Monthly Housing Cost Tiers in Doe Run
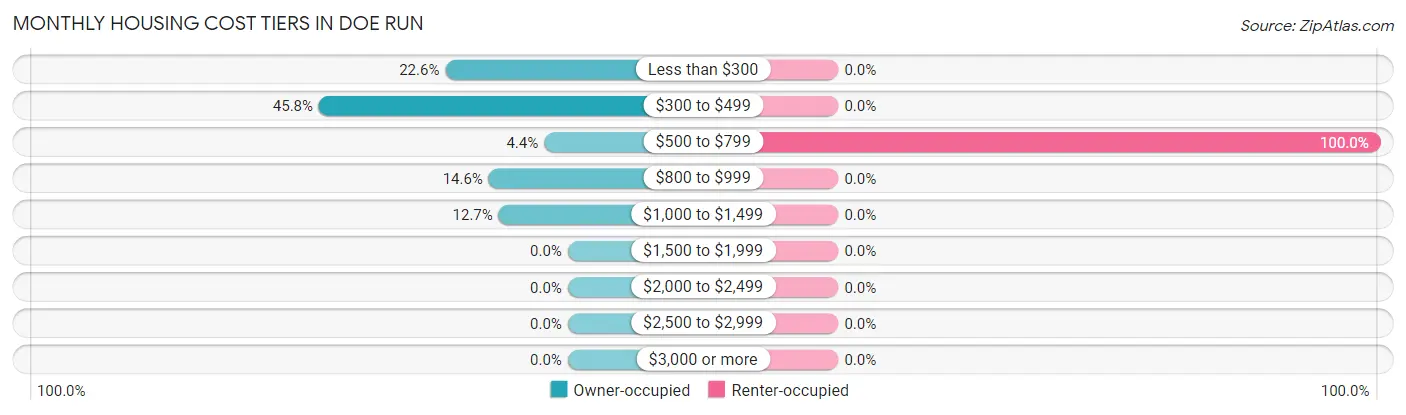
| Monthly Cost | Owner-occupied | Renter-occupied |
| Less than $300 | 62 (22.6%) | 0 (0.0%) |
| $300 to $499 | 126 (45.8%) | 0 (0.0%) |
| $500 to $799 | 12 (4.4%) | 56 (100.0%) |
| $800 to $999 | 40 (14.5%) | 0 (0.0%) |
| $1,000 to $1,499 | 35 (12.7%) | 0 (0.0%) |
| $1,500 to $1,999 | 0 (0.0%) | 0 (0.0%) |
| $2,000 to $2,499 | 0 (0.0%) | 0 (0.0%) |
| $2,500 to $2,999 | 0 (0.0%) | 0 (0.0%) |
| $3,000 or more | 0 (0.0%) | 0 (0.0%) |
| Total | 275 (100.0%) | 56 (100.0%) |
Physical Housing Characteristics in Doe Run
Housing Structures in Doe Run
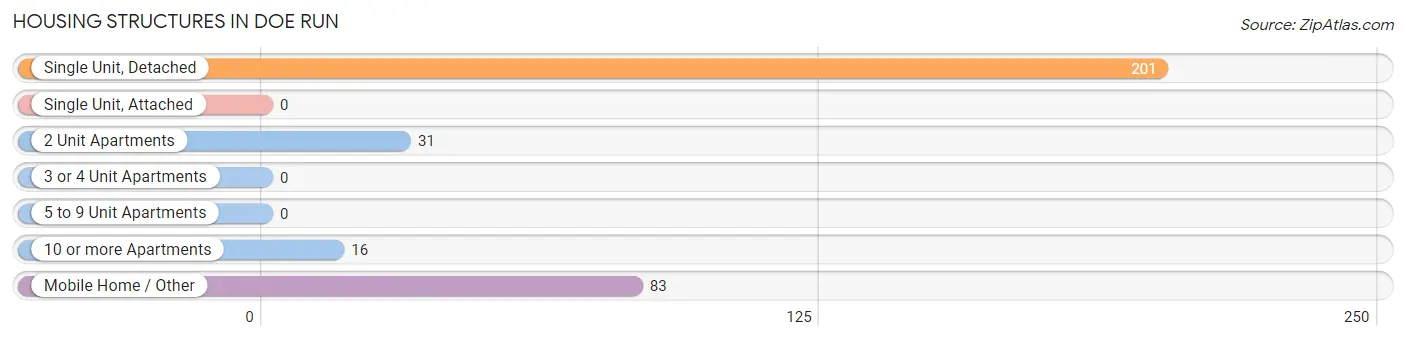
| Structure Type | # Housing Units | % Housing Units |
| Single Unit, Detached | 201 | 60.7% |
| Single Unit, Attached | 0 | 0.0% |
| 2 Unit Apartments | 31 | 9.4% |
| 3 or 4 Unit Apartments | 0 | 0.0% |
| 5 to 9 Unit Apartments | 0 | 0.0% |
| 10 or more Apartments | 16 | 4.8% |
| Mobile Home / Other | 83 | 25.1% |
| Total | 331 | 100.0% |
Housing Structures by Occupancy in Doe Run
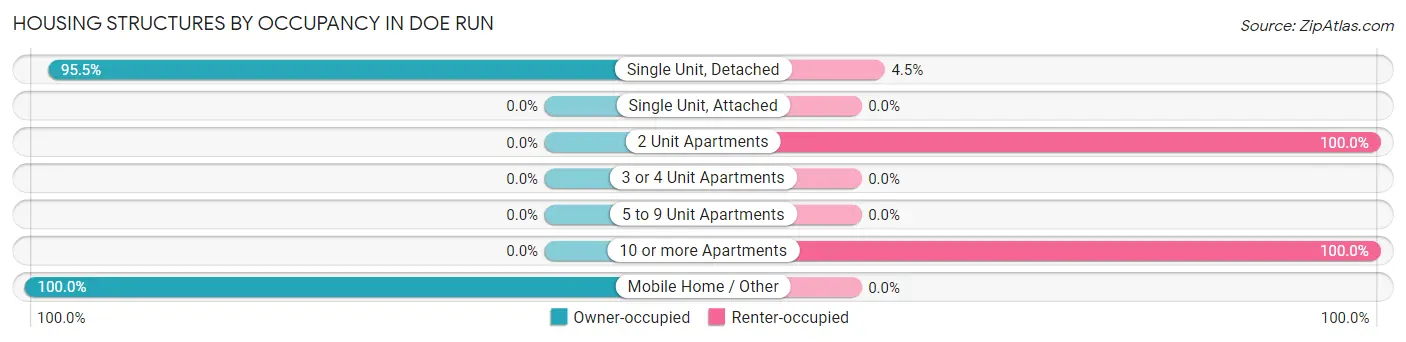
| Structure Type | Owner-occupied | Renter-occupied |
| Single Unit, Detached | 192 (95.5%) | 9 (4.5%) |
| Single Unit, Attached | 0 (0.0%) | 0 (0.0%) |
| 2 Unit Apartments | 0 (0.0%) | 31 (100.0%) |
| 3 or 4 Unit Apartments | 0 (0.0%) | 0 (0.0%) |
| 5 to 9 Unit Apartments | 0 (0.0%) | 0 (0.0%) |
| 10 or more Apartments | 0 (0.0%) | 16 (100.0%) |
| Mobile Home / Other | 83 (100.0%) | 0 (0.0%) |
| Total | 275 (83.1%) | 56 (16.9%) |
Housing Structures by Number of Rooms in Doe Run
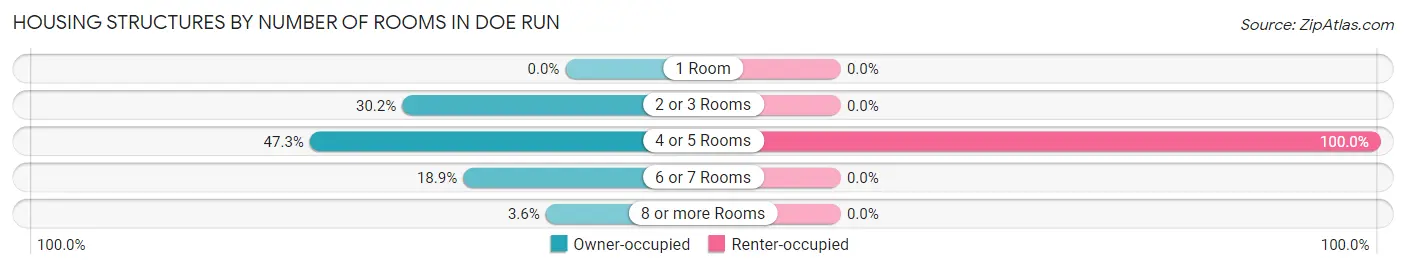
| Number of Rooms | Owner-occupied | Renter-occupied |
| 1 Room | 0 (0.0%) | 0 (0.0%) |
| 2 or 3 Rooms | 83 (30.2%) | 0 (0.0%) |
| 4 or 5 Rooms | 130 (47.3%) | 56 (100.0%) |
| 6 or 7 Rooms | 52 (18.9%) | 0 (0.0%) |
| 8 or more Rooms | 10 (3.6%) | 0 (0.0%) |
| Total | 275 (100.0%) | 56 (100.0%) |
Housing Structure by Heating Type in Doe Run
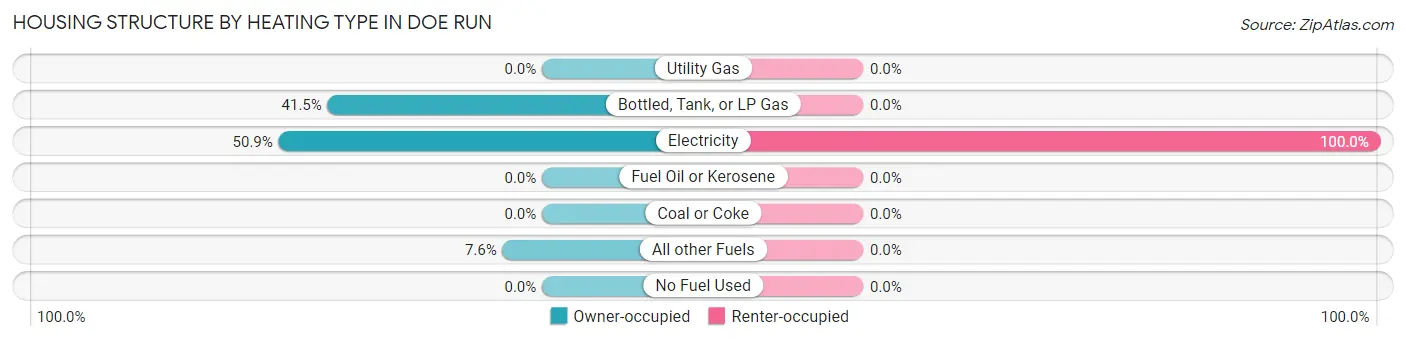
| Heating Type | Owner-occupied | Renter-occupied |
| Utility Gas | 0 (0.0%) | 0 (0.0%) |
| Bottled, Tank, or LP Gas | 114 (41.4%) | 0 (0.0%) |
| Electricity | 140 (50.9%) | 56 (100.0%) |
| Fuel Oil or Kerosene | 0 (0.0%) | 0 (0.0%) |
| Coal or Coke | 0 (0.0%) | 0 (0.0%) |
| All other Fuels | 21 (7.6%) | 0 (0.0%) |
| No Fuel Used | 0 (0.0%) | 0 (0.0%) |
| Total | 275 (100.0%) | 56 (100.0%) |
Household Vehicle Usage in Doe Run
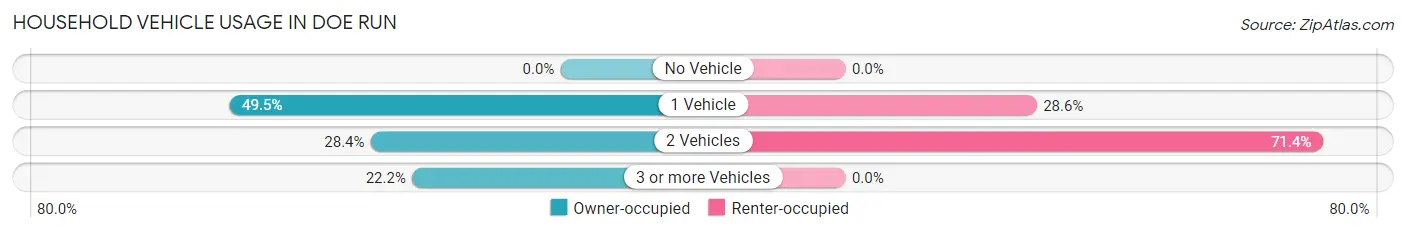
| Vehicles per Household | Owner-occupied | Renter-occupied |
| No Vehicle | 0 (0.0%) | 0 (0.0%) |
| 1 Vehicle | 136 (49.4%) | 16 (28.6%) |
| 2 Vehicles | 78 (28.4%) | 40 (71.4%) |
| 3 or more Vehicles | 61 (22.2%) | 0 (0.0%) |
| Total | 275 (100.0%) | 56 (100.0%) |
Real Estate & Mortgages in Doe Run
Real Estate and Mortgage Overview in Doe Run
| Characteristic | Without Mortgage | With Mortgage |
| Housing Units | 116 | 159 |
| Median Property Value | $135,500 | $0 |
| Median Household Income | $46,055 | $0 |
| Monthly Housing Costs | $280 | $0 |
| Real Estate Taxes | $920 | $0 |
Property Value by Mortgage Status in Doe Run
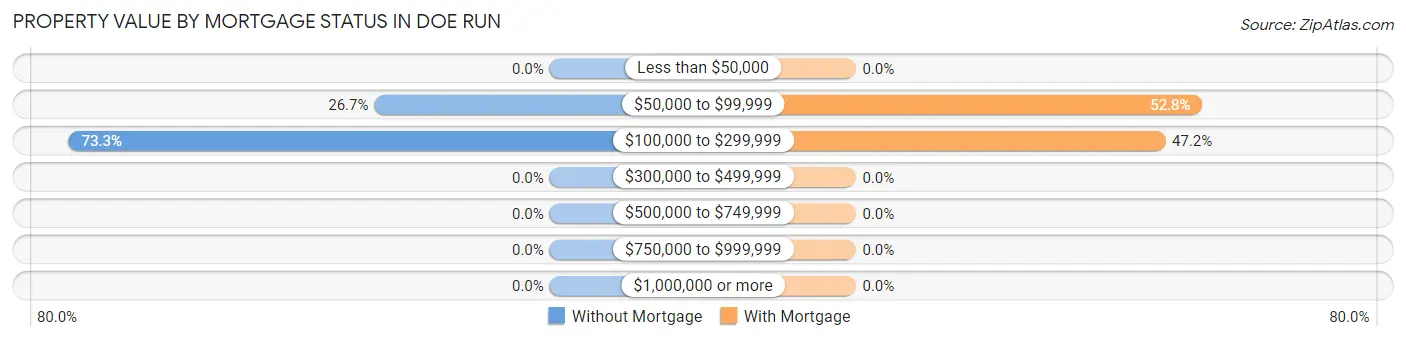
| Property Value | Without Mortgage | With Mortgage |
| Less than $50,000 | 0 (0.0%) | 0 (0.0%) |
| $50,000 to $99,999 | 31 (26.7%) | 84 (52.8%) |
| $100,000 to $299,999 | 85 (73.3%) | 75 (47.2%) |
| $300,000 to $499,999 | 0 (0.0%) | 0 (0.0%) |
| $500,000 to $749,999 | 0 (0.0%) | 0 (0.0%) |
| $750,000 to $999,999 | 0 (0.0%) | 0 (0.0%) |
| $1,000,000 or more | 0 (0.0%) | 0 (0.0%) |
| Total | 116 (100.0%) | 159 (100.0%) |
Household Income by Mortgage Status in Doe Run
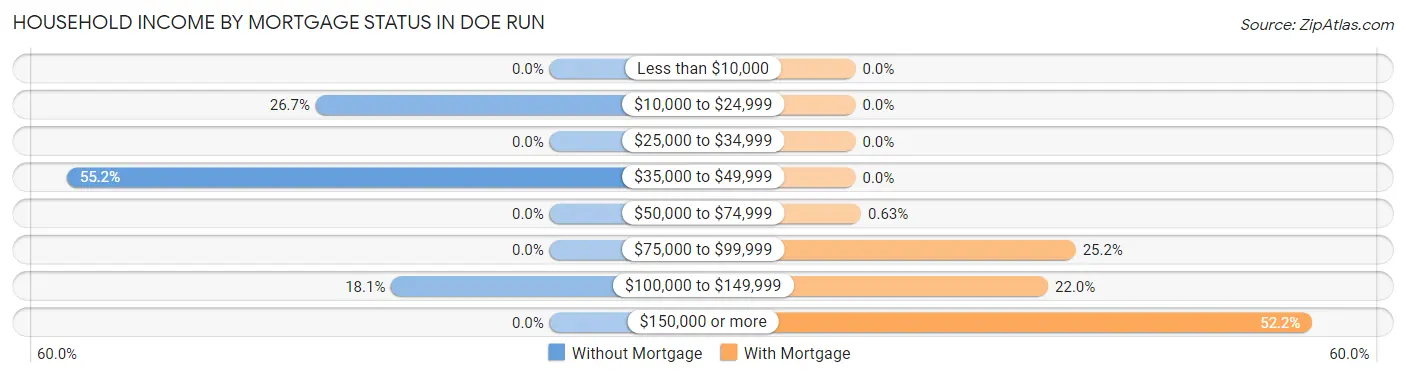
| Household Income | Without Mortgage | With Mortgage |
| Less than $10,000 | 0 (0.0%) | 0 (0.0%) |
| $10,000 to $24,999 | 31 (26.7%) | 0 (0.0%) |
| $25,000 to $34,999 | 0 (0.0%) | 0 (0.0%) |
| $35,000 to $49,999 | 64 (55.2%) | 0 (0.0%) |
| $50,000 to $74,999 | 0 (0.0%) | 1 (0.6%) |
| $75,000 to $99,999 | 0 (0.0%) | 40 (25.2%) |
| $100,000 to $149,999 | 21 (18.1%) | 35 (22.0%) |
| $150,000 or more | 0 (0.0%) | 83 (52.2%) |
| Total | 116 (100.0%) | 159 (100.0%) |
Property Value to Household Income Ratio in Doe Run
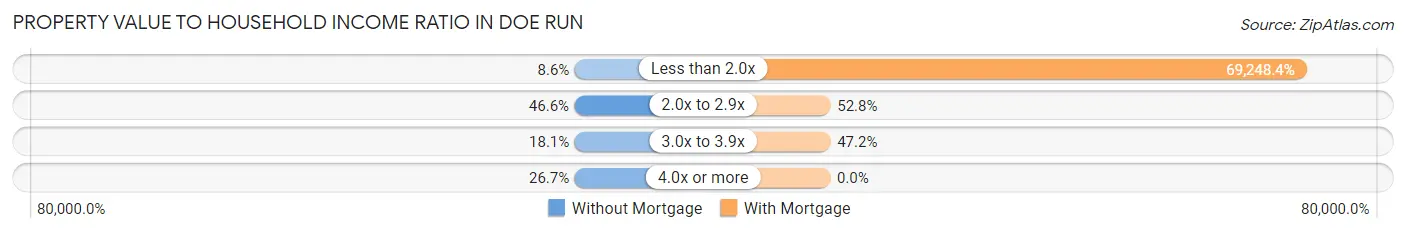
| Value-to-Income Ratio | Without Mortgage | With Mortgage |
| Less than 2.0x | 10 (8.6%) | 110,105 (69,248.4%) |
| 2.0x to 2.9x | 54 (46.6%) | 84 (52.8%) |
| 3.0x to 3.9x | 21 (18.1%) | 75 (47.2%) |
| 4.0x or more | 31 (26.7%) | 0 (0.0%) |
| Total | 116 (100.0%) | 159 (100.0%) |
Real Estate Taxes by Mortgage Status in Doe Run
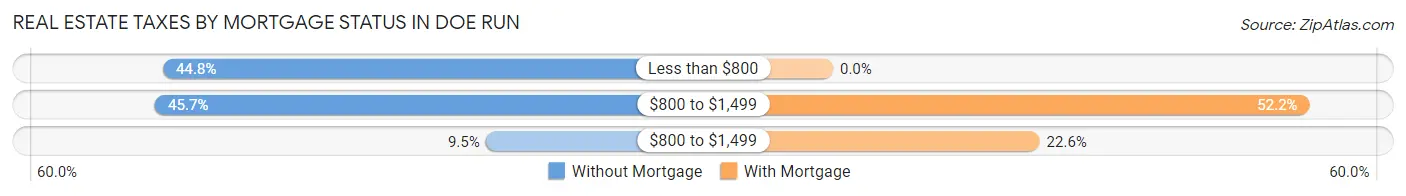
| Property Taxes | Without Mortgage | With Mortgage |
| Less than $800 | 52 (44.8%) | 0 (0.0%) |
| $800 to $1,499 | 53 (45.7%) | 83 (52.2%) |
| $800 to $1,499 | 11 (9.5%) | 36 (22.6%) |
| Total | 116 (100.0%) | 159 (100.0%) |
Health & Disability in Doe Run
Health Insurance Coverage by Age in Doe Run
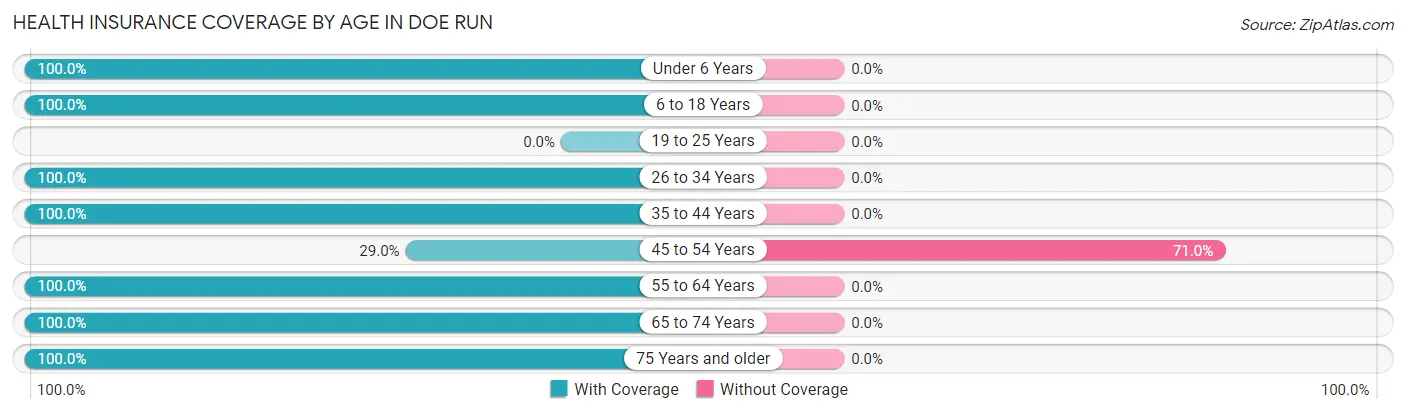
| Age Bracket | With Coverage | Without Coverage |
| Under 6 Years | 26 (100.0%) | 0 (0.0%) |
| 6 to 18 Years | 60 (100.0%) | 0 (0.0%) |
| 19 to 25 Years | 0 (0.0%) | 0 (0.0%) |
| 26 to 34 Years | 146 (100.0%) | 0 (0.0%) |
| 35 to 44 Years | 16 (100.0%) | 0 (0.0%) |
| 45 to 54 Years | 20 (29.0%) | 49 (71.0%) |
| 55 to 64 Years | 111 (100.0%) | 0 (0.0%) |
| 65 to 74 Years | 325 (100.0%) | 0 (0.0%) |
| 75 Years and older | 21 (100.0%) | 0 (0.0%) |
| Total | 725 (93.7%) | 49 (6.3%) |
Health Insurance Coverage by Citizenship Status in Doe Run
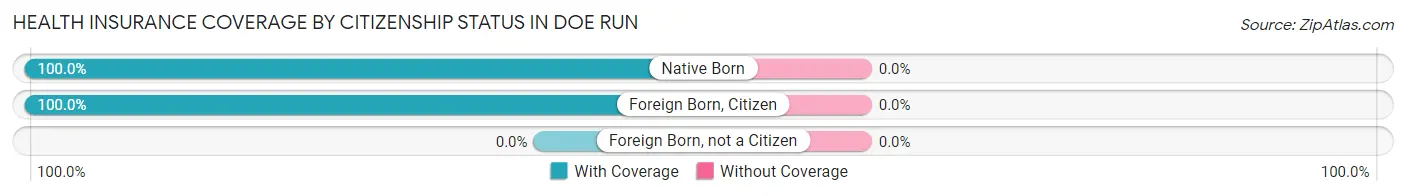
| Citizenship Status | With Coverage | Without Coverage |
| Native Born | 26 (100.0%) | 0 (0.0%) |
| Foreign Born, Citizen | 60 (100.0%) | 0 (0.0%) |
| Foreign Born, not a Citizen | 0 (0.0%) | 0 (0.0%) |
Health Insurance Coverage by Household Income in Doe Run
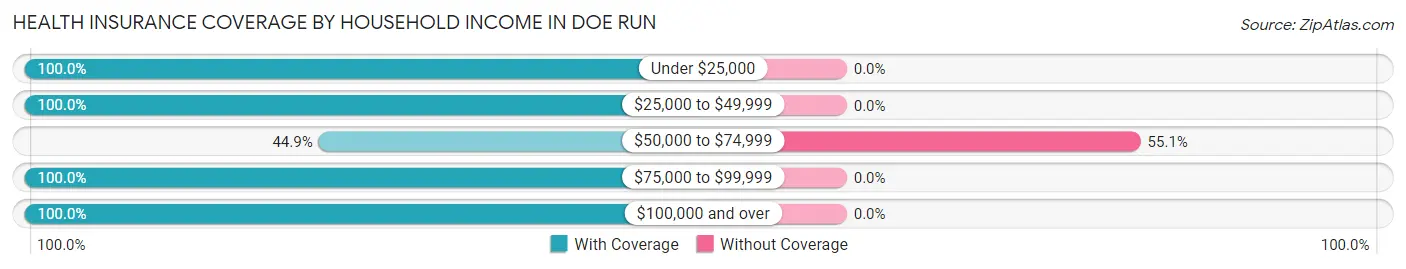
| Household Income | With Coverage | Without Coverage |
| Under $25,000 | 56 (100.0%) | 0 (0.0%) |
| $25,000 to $49,999 | 293 (100.0%) | 0 (0.0%) |
| $50,000 to $74,999 | 40 (44.9%) | 49 (55.1%) |
| $75,000 to $99,999 | 86 (100.0%) | 0 (0.0%) |
| $100,000 and over | 250 (100.0%) | 0 (0.0%) |
Public vs Private Health Insurance Coverage by Age in Doe Run
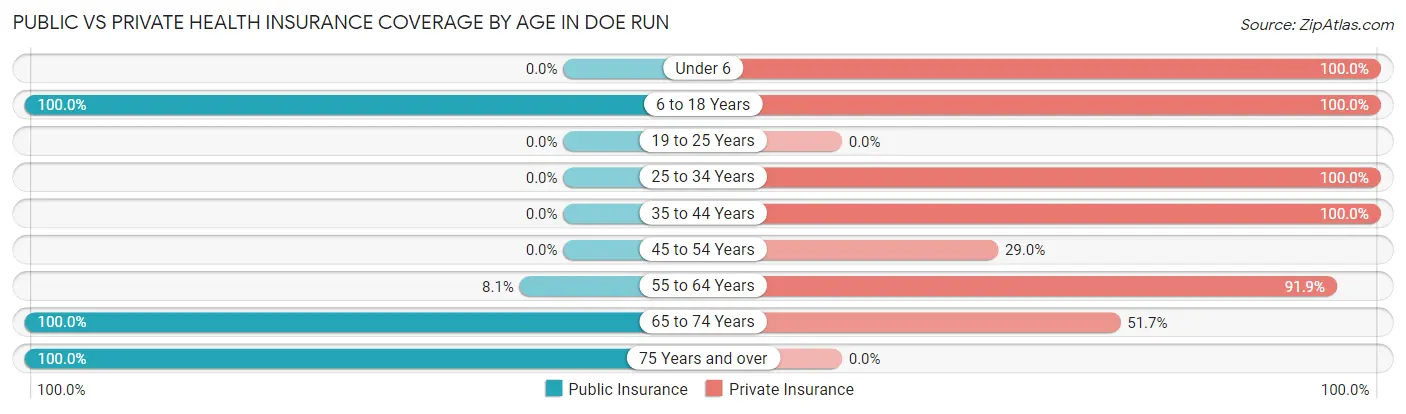
| Age Bracket | Public Insurance | Private Insurance |
| Under 6 | 0 (0.0%) | 26 (100.0%) |
| 6 to 18 Years | 60 (100.0%) | 60 (100.0%) |
| 19 to 25 Years | 0 (0.0%) | 0 (0.0%) |
| 25 to 34 Years | 0 (0.0%) | 146 (100.0%) |
| 35 to 44 Years | 0 (0.0%) | 16 (100.0%) |
| 45 to 54 Years | 0 (0.0%) | 20 (29.0%) |
| 55 to 64 Years | 9 (8.1%) | 102 (91.9%) |
| 65 to 74 Years | 325 (100.0%) | 168 (51.7%) |
| 75 Years and over | 21 (100.0%) | 0 (0.0%) |
| Total | 415 (53.6%) | 538 (69.5%) |
Disability Status by Sex by Age in Doe Run
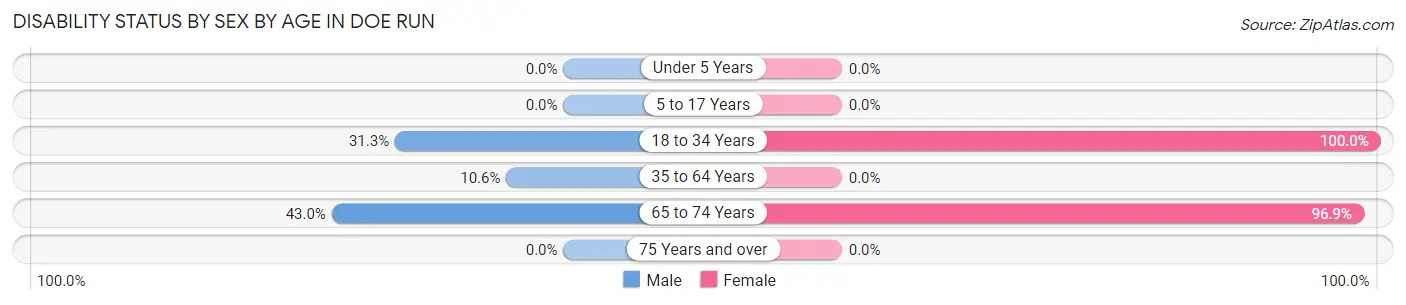
| Age Bracket | Male | Female |
| Under 5 Years | 0 (0.0%) | 0 (0.0%) |
| 5 to 17 Years | 0 (0.0%) | 0 (0.0%) |
| 18 to 34 Years | 25 (31.2%) | 66 (100.0%) |
| 35 to 64 Years | 9 (10.6%) | 0 (0.0%) |
| 65 to 74 Years | 126 (43.0%) | 31 (96.9%) |
| 75 Years and over | 0 (0.0%) | 0 (0.0%) |
Disability Class by Sex by Age in Doe Run
Disability Class: Hearing Difficulty
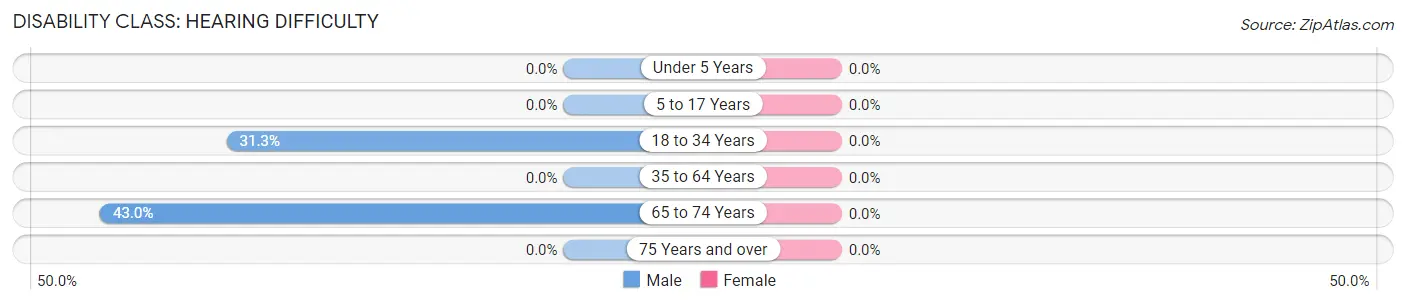
| Age Bracket | Male | Female |
| Under 5 Years | 0 (0.0%) | 0 (0.0%) |
| 5 to 17 Years | 0 (0.0%) | 0 (0.0%) |
| 18 to 34 Years | 25 (31.2%) | 0 (0.0%) |
| 35 to 64 Years | 0 (0.0%) | 0 (0.0%) |
| 65 to 74 Years | 126 (43.0%) | 0 (0.0%) |
| 75 Years and over | 0 (0.0%) | 0 (0.0%) |
Disability Class: Vision Difficulty
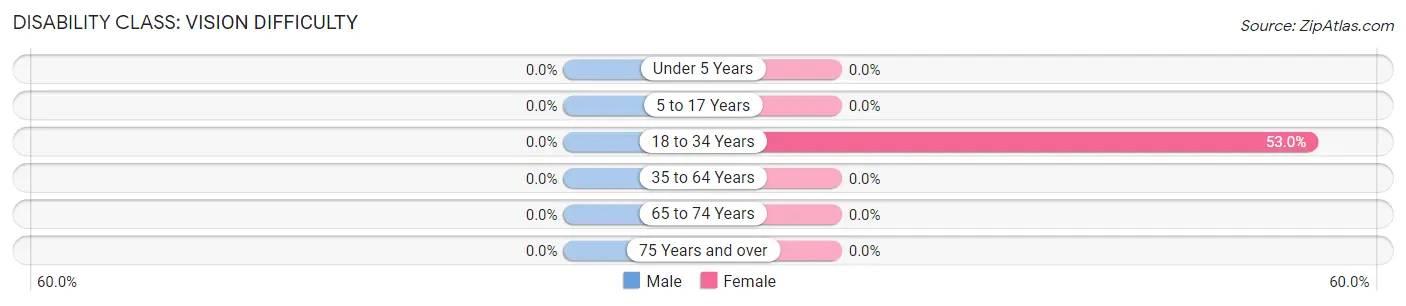
| Age Bracket | Male | Female |
| Under 5 Years | 0 (0.0%) | 0 (0.0%) |
| 5 to 17 Years | 0 (0.0%) | 0 (0.0%) |
| 18 to 34 Years | 0 (0.0%) | 35 (53.0%) |
| 35 to 64 Years | 0 (0.0%) | 0 (0.0%) |
| 65 to 74 Years | 0 (0.0%) | 0 (0.0%) |
| 75 Years and over | 0 (0.0%) | 0 (0.0%) |
Disability Class: Cognitive Difficulty
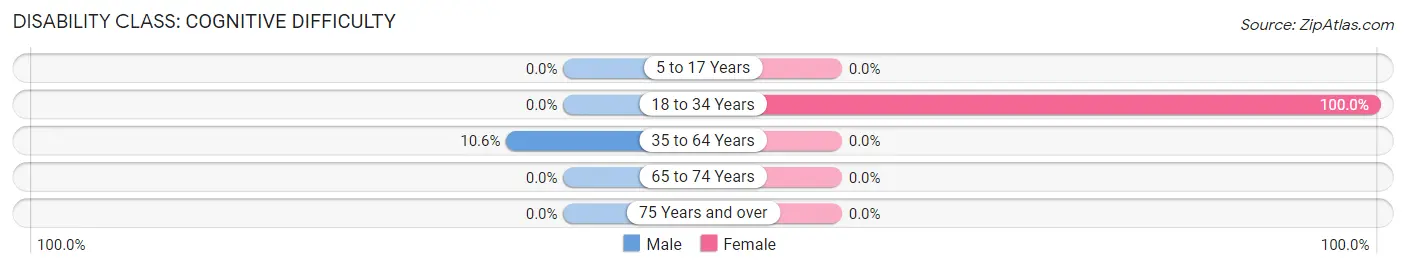
| Age Bracket | Male | Female |
| 5 to 17 Years | 0 (0.0%) | 0 (0.0%) |
| 18 to 34 Years | 0 (0.0%) | 66 (100.0%) |
| 35 to 64 Years | 9 (10.6%) | 0 (0.0%) |
| 65 to 74 Years | 0 (0.0%) | 0 (0.0%) |
| 75 Years and over | 0 (0.0%) | 0 (0.0%) |
Disability Class: Ambulatory Difficulty
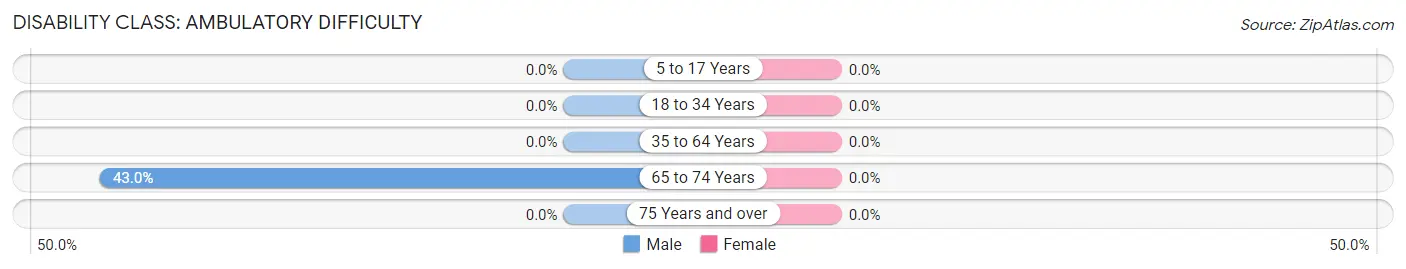
| Age Bracket | Male | Female |
| 5 to 17 Years | 0 (0.0%) | 0 (0.0%) |
| 18 to 34 Years | 0 (0.0%) | 0 (0.0%) |
| 35 to 64 Years | 0 (0.0%) | 0 (0.0%) |
| 65 to 74 Years | 126 (43.0%) | 0 (0.0%) |
| 75 Years and over | 0 (0.0%) | 0 (0.0%) |
Disability Class: Self-Care Difficulty
| Age Bracket | Male | Female |
| 5 to 17 Years | 0 (0.0%) | 0 (0.0%) |
| 18 to 34 Years | 0 (0.0%) | 0 (0.0%) |
| 35 to 64 Years | 0 (0.0%) | 0 (0.0%) |
| 65 to 74 Years | 0 (0.0%) | 0 (0.0%) |
| 75 Years and over | 0 (0.0%) | 0 (0.0%) |
Technology Access in Doe Run
Computing Device Access in Doe Run
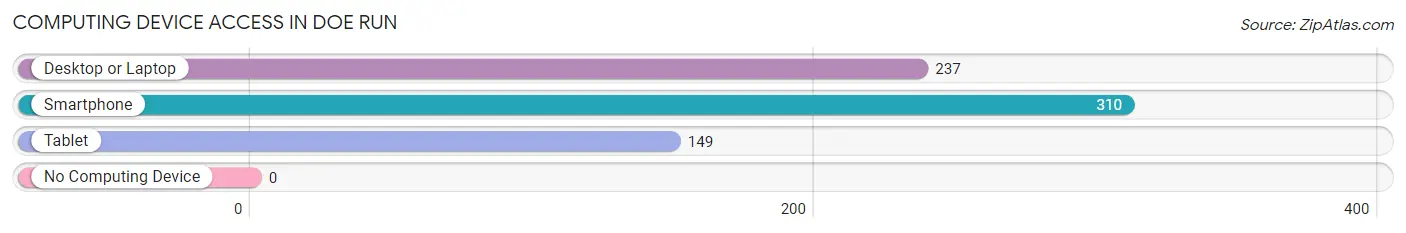
| Device Type | # Households | % Households |
| Desktop or Laptop | 237 | 71.6% |
| Smartphone | 310 | 93.7% |
| Tablet | 149 | 45.0% |
| No Computing Device | 0 | 0.0% |
| Total | 331 | 100.0% |
Internet Access in Doe Run
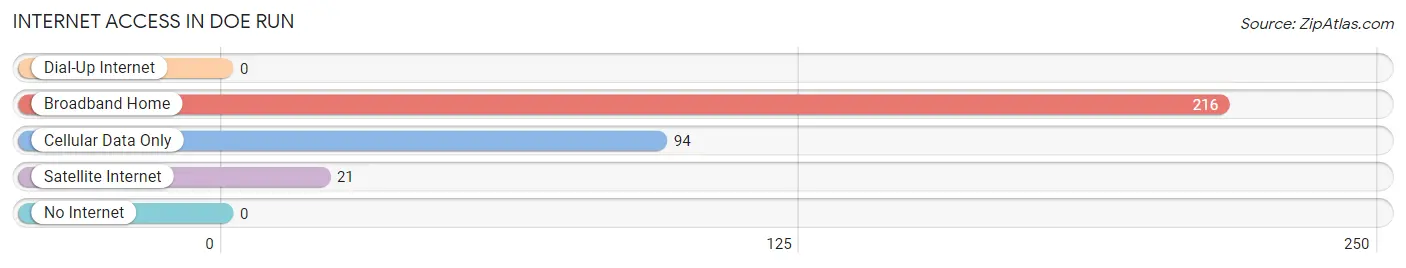
| Internet Type | # Households | % Households |
| Dial-Up Internet | 0 | 0.0% |
| Broadband Home | 216 | 65.3% |
| Cellular Data Only | 94 | 28.4% |
| Satellite Internet | 21 | 6.3% |
| No Internet | 0 | 0.0% |
| Total | 331 | 100.0% |
Doe Run Summary
Doe Run, Missouri is a small town located in St. Francois County in the southeastern part of the state. It is situated on the banks of the Big River, and is home to a population of just over 1,000 people. The town was founded in 1876 and has a rich history of mining, agriculture, and industry.
Geography
Doe Run is located in the Ozark Mountains region of Missouri, and is situated on the banks of the Big River. The town is surrounded by rolling hills and forests, and is home to a variety of wildlife. Doe Run is located approximately 30 miles south of St. Louis, and is accessible by both Interstate 55 and Highway 67.
Economy
Doe Run has a long history of mining and industry. The town was founded in 1876 as a mining town, and the Doe Run Company still operates a lead smelter in the area. The town is also home to a variety of small businesses, including a grocery store, a hardware store, and a few restaurants. Agriculture is also an important part of the local economy, with many of the residents working in the farming and ranching industries.
Demographics
As of the 2010 census, Doe Run had a population of 1,037 people. The racial makeup of the town was 97.3% White, 0.7% African American, 0.3% Native American, 0.2% Asian, 0.1% Pacific Islander, and 1.4% from other races. The median household income was $37,917, and the median family income was $45,625. The per capita income was $18,945.
Education
Doe Run is served by the St. Francois County R-IV School District. The district operates two elementary schools, one middle school, and one high school. The town is also home to a branch of Mineral Area College, which offers a variety of associate degree and certificate programs.
Conclusion
Doe Run, Missouri is a small town with a rich history of mining, agriculture, and industry. The town is located in the Ozark Mountains region of Missouri, and is home to a population of just over 1,000 people. The town is served by the St. Francois County R-IV School District, and is home to a branch of Mineral Area College. Doe Run is an important part of the local economy, and is a great place to live and work.
Common Questions
What is Per Capita Income in Doe Run?
Per Capita income in Doe Run is $32,655.
What is the Median Family Income in Doe Run?
Median Family Income in Doe Run is $46,738.
What is the Median Household income in Doe Run?
Median Household Income in Doe Run is $73,344.
What is Income or Wage Gap in Doe Run?
Income or Wage Gap in Doe Run is 63.7%.
Women in Doe Run earn 36.3 cents for every dollar earned by a man.
What is Inequality or Gini Index in Doe Run?
Inequality or Gini Index in Doe Run is 0.29.
What is the Total Population of Doe Run?
Total Population of Doe Run is 790.
What is the Total Male Population of Doe Run?
Total Male Population of Doe Run is 518.
What is the Total Female Population of Doe Run?
Total Female Population of Doe Run is 272.
What is the Ratio of Males per 100 Females in Doe Run?
There are 190.44 Males per 100 Females in Doe Run.
What is the Ratio of Females per 100 Males in Doe Run?
There are 52.51 Females per 100 Males in Doe Run.
What is the Median Population Age in Doe Run?
Median Population Age in Doe Run is 64.2 Years.
What is the Average Family Size in Doe Run
Average Family Size in Doe Run is 2.4 People.
What is the Average Household Size in Doe Run
Average Household Size in Doe Run is 2.3 People.
How Large is the Labor Force in Doe Run?
There are 375 People in the Labor Forcein in Doe Run.
What is the Percentage of People in the Labor Force in Doe Run?
53.3% of People are in the Labor Force in Doe Run.