Diehlstadt, MO Map & Demographics
Diehlstadt Map
Diehlstadt Overview
$16,952
PER CAPITA INCOME
$49,063
AVG FAMILY INCOME
$40,000
AVG HOUSEHOLD INCOME
43.8%
WAGE / INCOME GAP [ % ]
56.2¢/ $1
WAGE / INCOME GAP [ $ ]
0.38
INEQUALITY / GINI INDEX
117
TOTAL POPULATION
62
MALE POPULATION
55
FEMALE POPULATION
112.73
MALES / 100 FEMALES
88.71
FEMALES / 100 MALES
53.3
MEDIAN AGE
3.4
AVG FAMILY SIZE
2.9
AVG HOUSEHOLD SIZE
48
LABOR FORCE [ PEOPLE ]
49.0%
PERCENT IN LABOR FORCE
4.2%
UNEMPLOYMENT RATE
Income in Diehlstadt
Income Overview in Diehlstadt
Per Capita Income in Diehlstadt is $16,952, while median incomes of families and households are $49,063 and $40,000 respectively.
| Characteristic | Number | Measure |
| Per Capita Income | 117 | $16,952 |
| Median Family Income | 31 | $49,063 |
| Mean Family Income | 31 | $52,345 |
| Median Household Income | 40 | $40,000 |
| Mean Household Income | 40 | $44,650 |
| Income Deficit | 31 | $0 |
| Wage / Income Gap (%) | 117 | 43.75% |
| Wage / Income Gap ($) | 117 | 56.25¢ per $1 |
| Gini / Inequality Index | 117 | 0.38 |
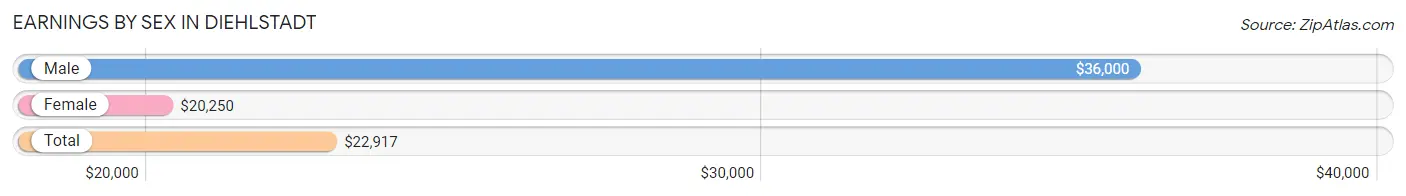
Earnings by Sex in Diehlstadt
Average Earnings in Diehlstadt are $22,917, $36,000 for men and $20,250 for women, a difference of 43.8%.
| Sex | Number | Average Earnings |
| Male | 26 (53.1%) | $36,000 |
| Female | 23 (46.9%) | $20,250 |
| Total | 49 (100.0%) | $22,917 |
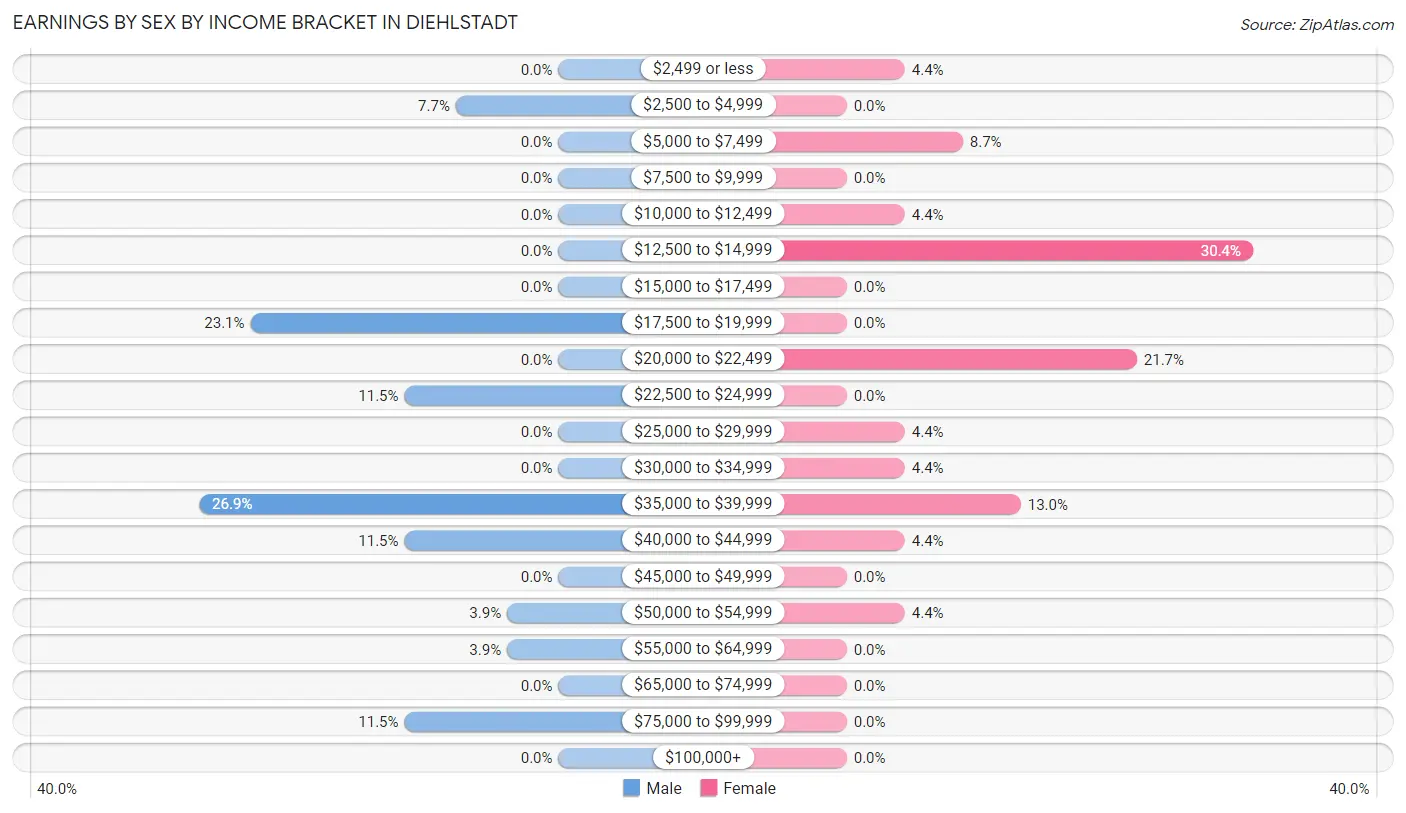
Earnings by Sex by Income Bracket in Diehlstadt
The most common earnings brackets in Diehlstadt are $35,000 to $39,999 for men (7 | 26.9%) and $12,500 to $14,999 for women (7 | 30.4%).
| Income | Male | Female |
| $2,499 or less | 0 (0.0%) | 1 (4.3%) |
| $2,500 to $4,999 | 2 (7.7%) | 0 (0.0%) |
| $5,000 to $7,499 | 0 (0.0%) | 2 (8.7%) |
| $7,500 to $9,999 | 0 (0.0%) | 0 (0.0%) |
| $10,000 to $12,499 | 0 (0.0%) | 1 (4.3%) |
| $12,500 to $14,999 | 0 (0.0%) | 7 (30.4%) |
| $15,000 to $17,499 | 0 (0.0%) | 0 (0.0%) |
| $17,500 to $19,999 | 6 (23.1%) | 0 (0.0%) |
| $20,000 to $22,499 | 0 (0.0%) | 5 (21.7%) |
| $22,500 to $24,999 | 3 (11.5%) | 0 (0.0%) |
| $25,000 to $29,999 | 0 (0.0%) | 1 (4.3%) |
| $30,000 to $34,999 | 0 (0.0%) | 1 (4.3%) |
| $35,000 to $39,999 | 7 (26.9%) | 3 (13.0%) |
| $40,000 to $44,999 | 3 (11.5%) | 1 (4.3%) |
| $45,000 to $49,999 | 0 (0.0%) | 0 (0.0%) |
| $50,000 to $54,999 | 1 (3.8%) | 1 (4.3%) |
| $55,000 to $64,999 | 1 (3.8%) | 0 (0.0%) |
| $65,000 to $74,999 | 0 (0.0%) | 0 (0.0%) |
| $75,000 to $99,999 | 3 (11.5%) | 0 (0.0%) |
| $100,000+ | 0 (0.0%) | 0 (0.0%) |
| Total | 26 (100.0%) | 23 (100.0%) |
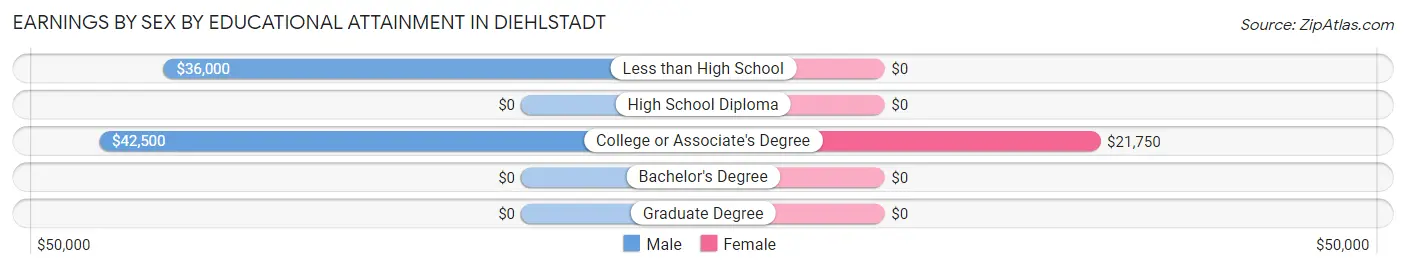
Earnings by Sex by Educational Attainment in Diehlstadt
Average earnings in Diehlstadt are $36,000 for men and $20,250 for women, a difference of 43.8%. Men with an educational attainment of college or associate's degree enjoy the highest average annual earnings of $42,500, while those with less than high school education earn the least with $36,000. Women with an educational attainment of college or associate's degree earn the most with the average annual earnings of $21,750, while those with college or associate's degree education have the smallest earnings of $21,750.
| Educational Attainment | Male Income | Female Income |
| Less than High School | $36,000 | $0 |
| High School Diploma | - | - |
| College or Associate's Degree | $42,500 | $21,750 |
| Bachelor's Degree | - | - |
| Graduate Degree | - | - |
| Total | $36,000 | $20,250 |
Family Income in Diehlstadt
Family Income Brackets in Diehlstadt
According to the Diehlstadt family income data, there are 9 families falling into the $15,000 to $24,999 income range, which is the most common income bracket and makes up 29.0% of all families.
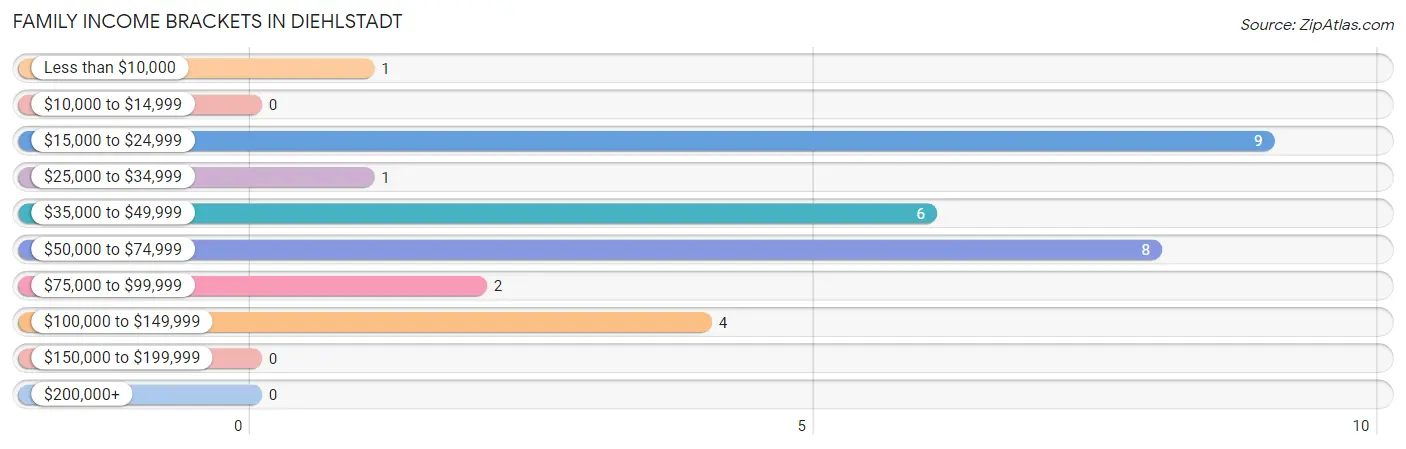
| Income Bracket | # Families | % Families |
| Less than $10,000 | 1 | 3.2% |
| $10,000 to $14,999 | 0 | 0.0% |
| $15,000 to $24,999 | 9 | 29.0% |
| $25,000 to $34,999 | 1 | 3.2% |
| $35,000 to $49,999 | 6 | 19.4% |
| $50,000 to $74,999 | 8 | 25.8% |
| $75,000 to $99,999 | 2 | 6.5% |
| $100,000 to $149,999 | 4 | 12.9% |
| $150,000 to $199,999 | 0 | 0.0% |
| $200,000+ | 0 | 0.0% |
Family Income by Famaliy Size in Diehlstadt
3-person families (12 | 38.7%) account for the highest median family income in Diehlstadt with $48,750 per family, while 3-person families (12 | 38.7%) have the highest median income of $16,250 per family member.
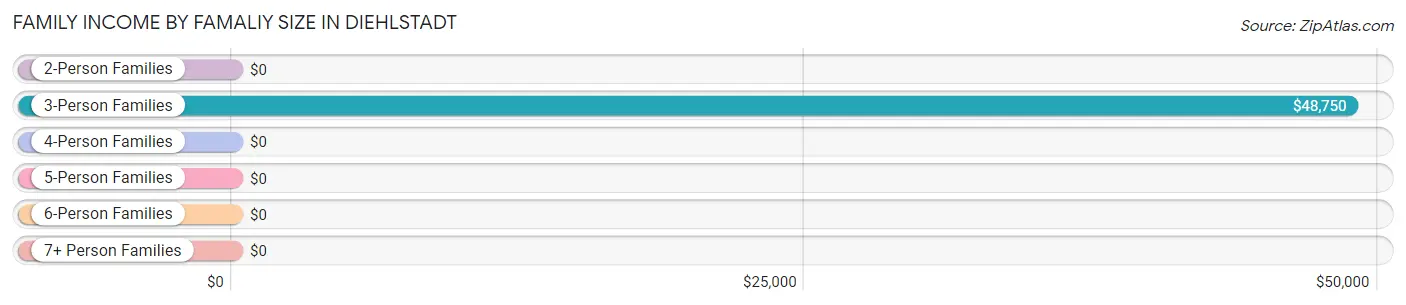
| Income Bracket | # Families | Median Income |
| 2-Person Families | 11 (35.5%) | $0 |
| 3-Person Families | 12 (38.7%) | $48,750 |
| 4-Person Families | 8 (25.8%) | $0 |
| 5-Person Families | 0 (0.0%) | $0 |
| 6-Person Families | 0 (0.0%) | $0 |
| 7+ Person Families | 0 (0.0%) | $0 |
| Total | 31 (100.0%) | $49,063 |
Family Income by Number of Earners in Diehlstadt
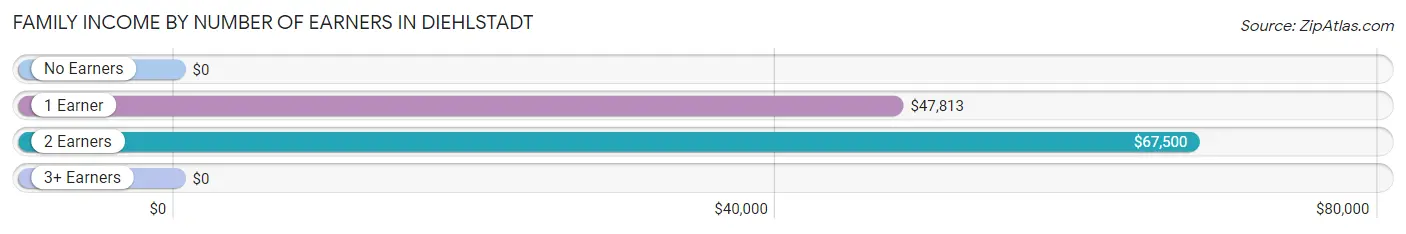
| Number of Earners | # Families | Median Income |
| No Earners | 6 (19.4%) | $0 |
| 1 Earner | 13 (41.9%) | $47,813 |
| 2 Earners | 12 (38.7%) | $67,500 |
| 3+ Earners | 0 (0.0%) | $0 |
| Total | 31 (100.0%) | $49,063 |
Household Income in Diehlstadt
Household Income Brackets in Diehlstadt
With 10 households falling in the category, the $15,000 to $24,999 income range is the most frequent in Diehlstadt, accounting for 25.0% of all households.
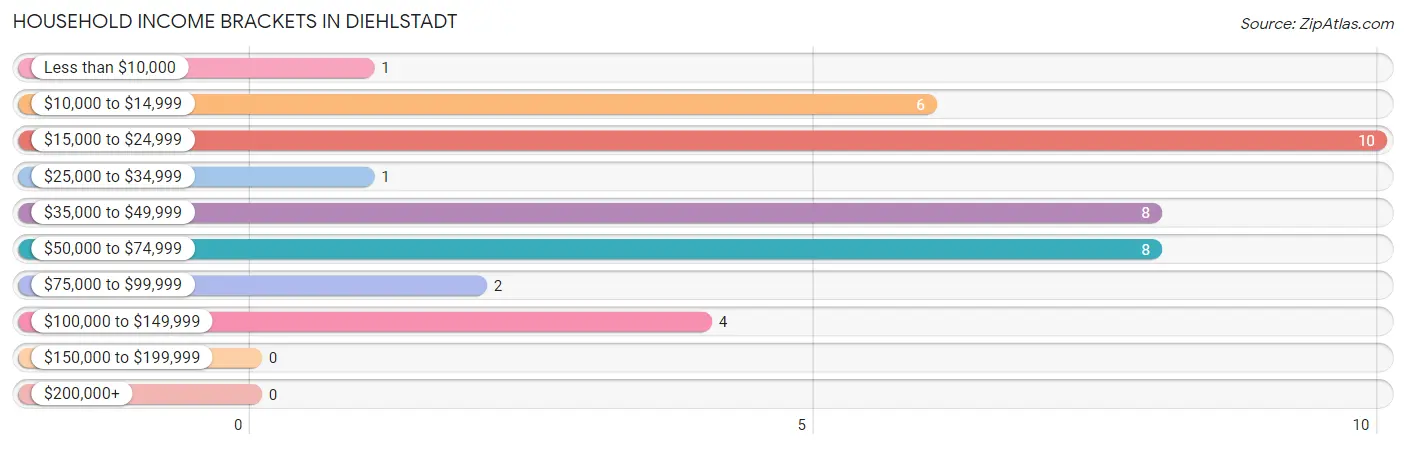
| Income Bracket | # Households | % Households |
| Less than $10,000 | 1 | 2.5% |
| $10,000 to $14,999 | 6 | 15.0% |
| $15,000 to $24,999 | 10 | 25.0% |
| $25,000 to $34,999 | 1 | 2.5% |
| $35,000 to $49,999 | 8 | 20.0% |
| $50,000 to $74,999 | 8 | 20.0% |
| $75,000 to $99,999 | 2 | 5.0% |
| $100,000 to $149,999 | 4 | 10.0% |
| $150,000 to $199,999 | 0 | 0.0% |
| $200,000+ | 0 | 0.0% |
Household Income by Householder Age in Diehlstadt
The median household income in Diehlstadt is $40,000, with the highest median household income of $53,750 found in the 45 to 64 years age bracket for the primary householder. A total of 12 households (30.0%) fall into this category.
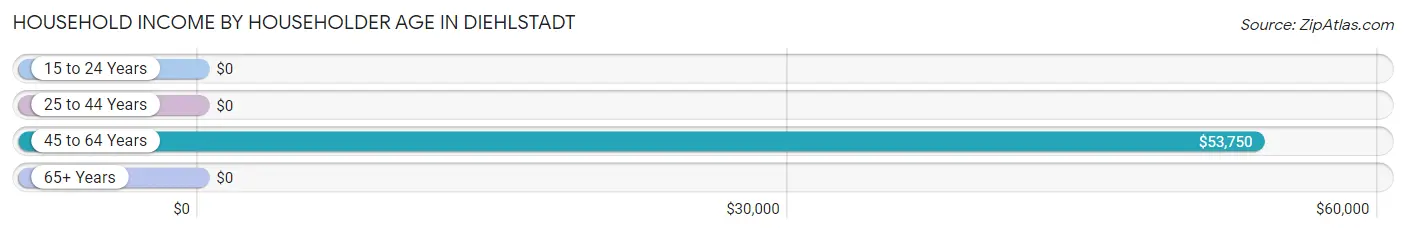
| Income Bracket | # Households | Median Income |
| 15 to 24 Years | 0 (0.0%) | $0 |
| 25 to 44 Years | 10 (25.0%) | $0 |
| 45 to 64 Years | 12 (30.0%) | $53,750 |
| 65+ Years | 18 (45.0%) | $0 |
| Total | 40 (100.0%) | $40,000 |
Poverty in Diehlstadt
Income Below Poverty by Sex and Age in Diehlstadt
With 22.6% poverty level for males and 5.4% for females among the residents of Diehlstadt, 15 year old males and 35 to 44 year old females are the most vulnerable to poverty, with 2 males (100.0%) and 1 females (33.3%) in their respective age groups living below the poverty level.
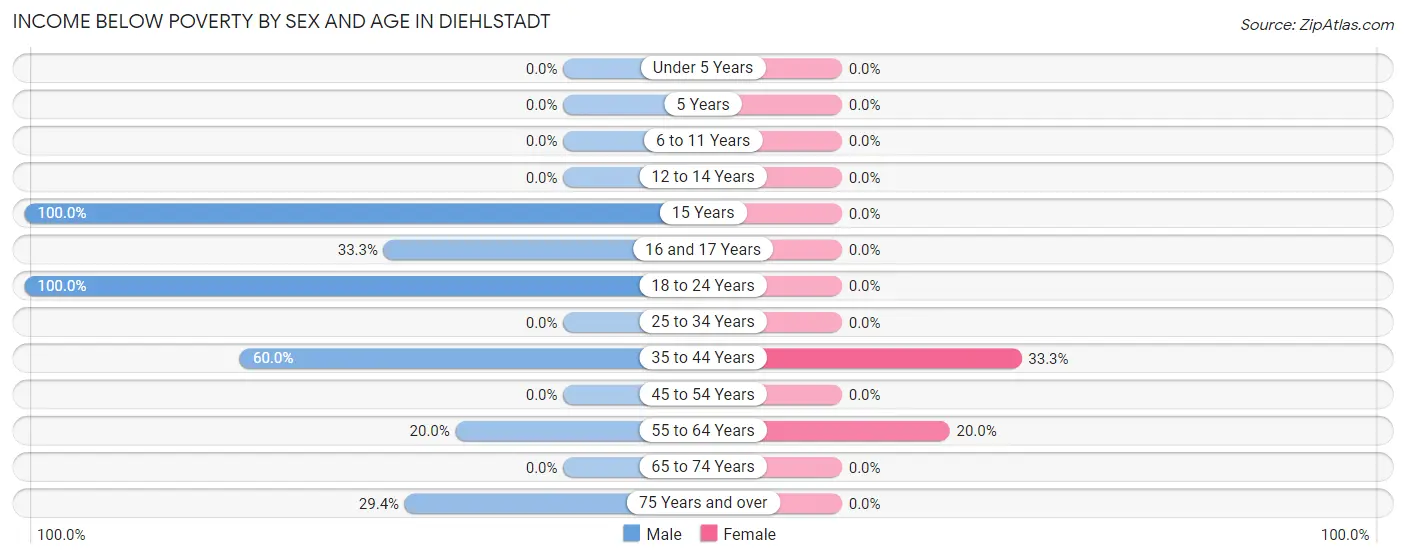
| Age Bracket | Male | Female |
| Under 5 Years | 0 (0.0%) | 0 (0.0%) |
| 5 Years | 0 (0.0%) | 0 (0.0%) |
| 6 to 11 Years | 0 (0.0%) | 0 (0.0%) |
| 12 to 14 Years | 0 (0.0%) | 0 (0.0%) |
| 15 Years | 2 (100.0%) | 0 (0.0%) |
| 16 and 17 Years | 1 (33.3%) | 0 (0.0%) |
| 18 to 24 Years | 1 (100.0%) | 0 (0.0%) |
| 25 to 34 Years | 0 (0.0%) | 0 (0.0%) |
| 35 to 44 Years | 3 (60.0%) | 1 (33.3%) |
| 45 to 54 Years | 0 (0.0%) | 0 (0.0%) |
| 55 to 64 Years | 2 (20.0%) | 2 (20.0%) |
| 65 to 74 Years | 0 (0.0%) | 0 (0.0%) |
| 75 Years and over | 5 (29.4%) | 0 (0.0%) |
| Total | 14 (22.6%) | 3 (5.4%) |
Income Above Poverty by Sex and Age in Diehlstadt
According to the poverty statistics in Diehlstadt, males aged under 5 years and females aged under 5 years are the age groups that are most secure financially, with 100.0% of males and 100.0% of females in these age groups living above the poverty line.
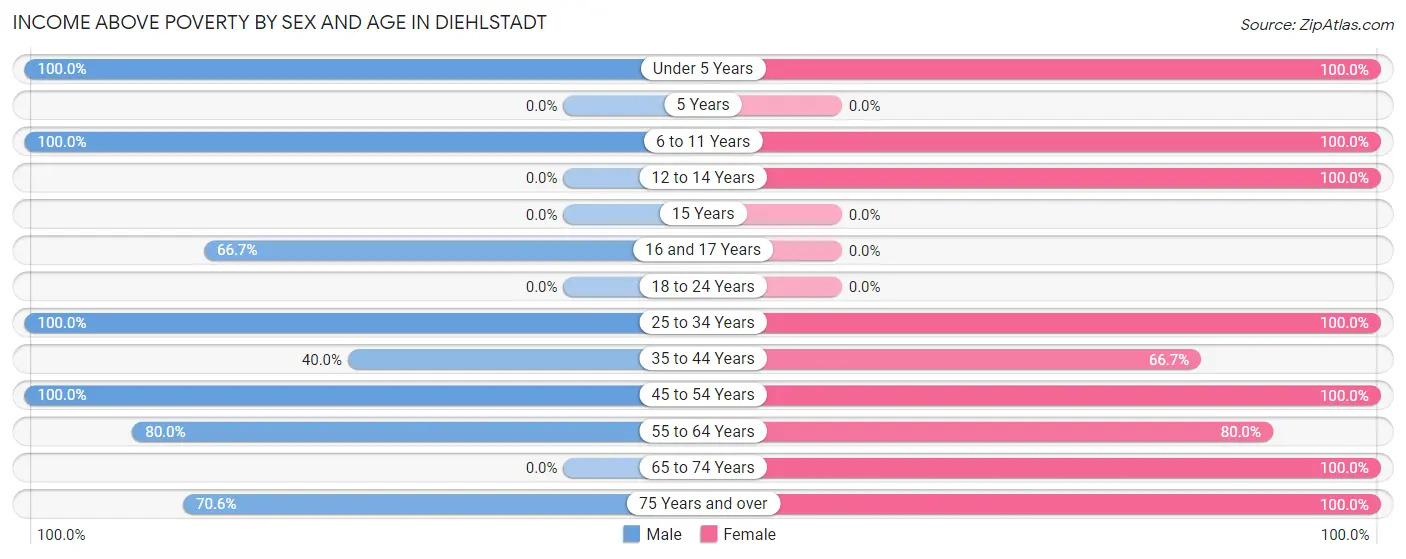
| Age Bracket | Male | Female |
| Under 5 Years | 5 (100.0%) | 2 (100.0%) |
| 5 Years | 0 (0.0%) | 0 (0.0%) |
| 6 to 11 Years | 3 (100.0%) | 1 (100.0%) |
| 12 to 14 Years | 0 (0.0%) | 6 (100.0%) |
| 15 Years | 0 (0.0%) | 0 (0.0%) |
| 16 and 17 Years | 2 (66.7%) | 0 (0.0%) |
| 18 to 24 Years | 0 (0.0%) | 0 (0.0%) |
| 25 to 34 Years | 11 (100.0%) | 13 (100.0%) |
| 35 to 44 Years | 2 (40.0%) | 2 (66.7%) |
| 45 to 54 Years | 5 (100.0%) | 7 (100.0%) |
| 55 to 64 Years | 8 (80.0%) | 8 (80.0%) |
| 65 to 74 Years | 0 (0.0%) | 11 (100.0%) |
| 75 Years and over | 12 (70.6%) | 2 (100.0%) |
| Total | 48 (77.4%) | 52 (94.6%) |
Income Below Poverty Among Married-Couple Families in Diehlstadt
The poverty statistics for married-couple families in Diehlstadt show that 6.9% or 2 of the total 29 families live below the poverty line. Families with 1 or 2 children have the highest poverty rate of 16.7%, comprising of 2 families. On the other hand, families with no children have the lowest poverty rate of 0.0%, which includes 0 families.
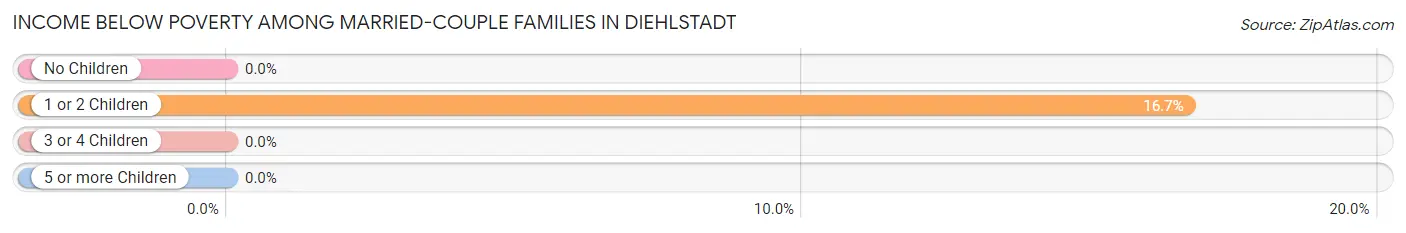
| Children | Above Poverty | Below Poverty |
| No Children | 17 (100.0%) | 0 (0.0%) |
| 1 or 2 Children | 10 (83.3%) | 2 (16.7%) |
| 3 or 4 Children | 0 (0.0%) | 0 (0.0%) |
| 5 or more Children | 0 (0.0%) | 0 (0.0%) |
| Total | 27 (93.1%) | 2 (6.9%) |
Income Below Poverty Among Single-Parent Households in Diehlstadt
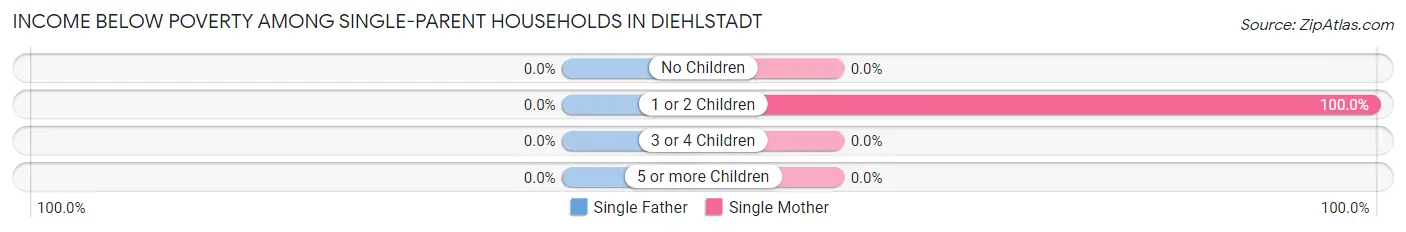
| Children | Single Father | Single Mother |
| No Children | 0 (0.0%) | 0 (0.0%) |
| 1 or 2 Children | 0 (0.0%) | 1 (100.0%) |
| 3 or 4 Children | 0 (0.0%) | 0 (0.0%) |
| 5 or more Children | 0 (0.0%) | 0 (0.0%) |
| Total | 0 (0.0%) | 1 (50.0%) |
Income Below Poverty Among Married-Couple vs Single-Parent Households in Diehlstadt
The poverty data for Diehlstadt shows that 2 of the married-couple family households (6.9%) and 1 of the single-parent households (50.0%) are living below the poverty level. Within the married-couple family households, those with 1 or 2 children have the highest poverty rate, with 2 households (16.7%) falling below the poverty line. Among the single-parent households, those with 1 or 2 children have the highest poverty rate, with 1 household (100.0%) living below poverty.
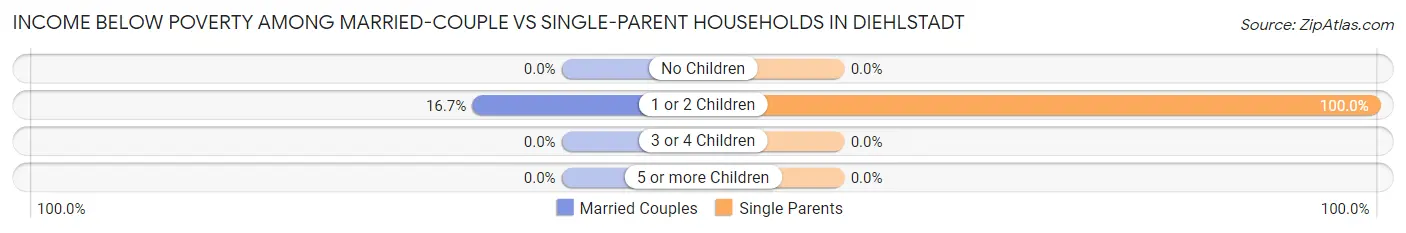
| Children | Married-Couple Families | Single-Parent Households |
| No Children | 0 (0.0%) | 0 (0.0%) |
| 1 or 2 Children | 2 (16.7%) | 1 (100.0%) |
| 3 or 4 Children | 0 (0.0%) | 0 (0.0%) |
| 5 or more Children | 0 (0.0%) | 0 (0.0%) |
| Total | 2 (6.9%) | 1 (50.0%) |
Race in Diehlstadt
The most populous races in Diehlstadt are White / Caucasian (112 | 95.7%), and Two or more Races (5 | 4.3%).
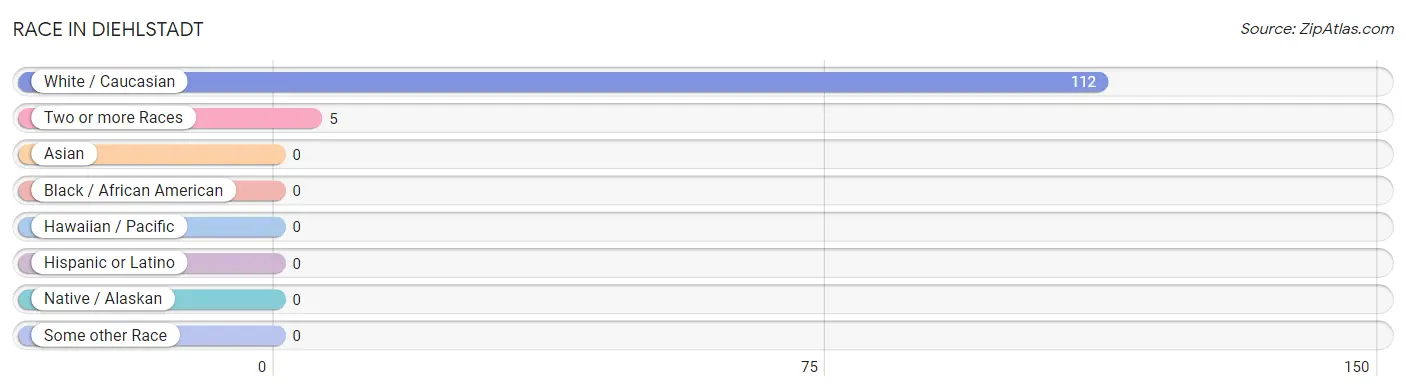
| Race | # Population | % Population |
| Asian | 0 | 0.0% |
| Black / African American | 0 | 0.0% |
| Hawaiian / Pacific | 0 | 0.0% |
| Hispanic or Latino | 0 | 0.0% |
| Native / Alaskan | 0 | 0.0% |
| White / Caucasian | 112 | 95.7% |
| Two or more Races | 5 | 4.3% |
| Some other Race | 0 | 0.0% |
| Total | 117 | 100.0% |
Ancestry in Diehlstadt
The most populous ancestries reported in Diehlstadt are Irish (32 | 27.4%), English (27 | 23.1%), German (10 | 8.6%), Cherokee (5 | 4.3%), and Italian (3 | 2.6%), together accounting for 65.8% of all Diehlstadt residents.
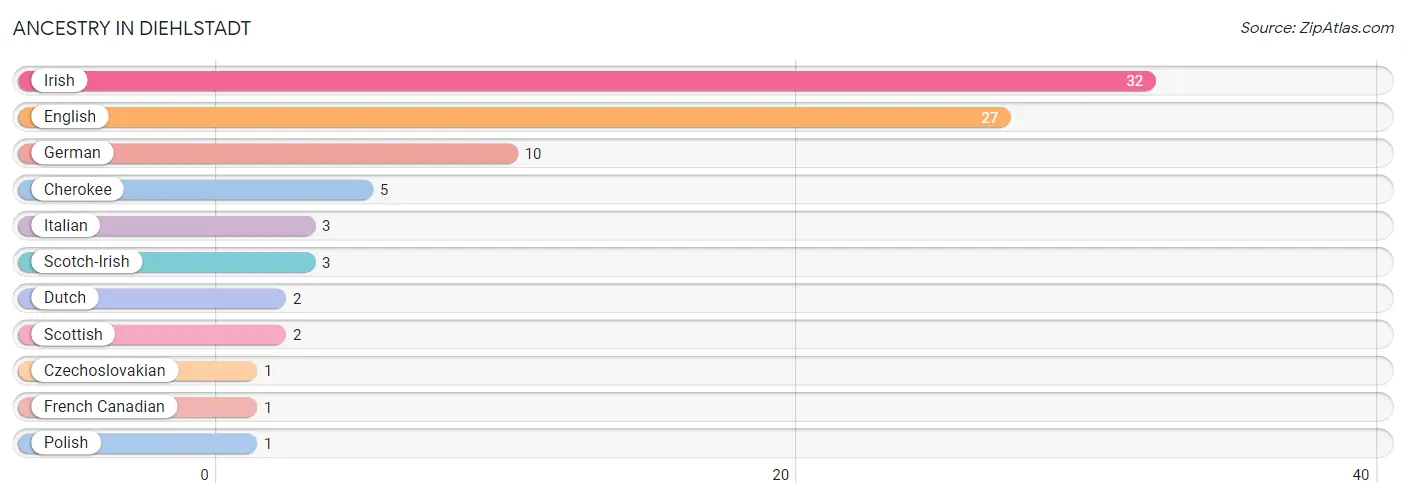
| Ancestry | # Population | % Population |
| Cherokee | 5 | 4.3% |
| Czechoslovakian | 1 | 0.9% |
| Dutch | 2 | 1.7% |
| English | 27 | 23.1% |
| French Canadian | 1 | 0.9% |
| German | 10 | 8.6% |
| Irish | 32 | 27.4% |
| Italian | 3 | 2.6% |
| Polish | 1 | 0.9% |
| Scotch-Irish | 3 | 2.6% |
| Scottish | 2 | 1.7% | View All 11 Rows |
Immigrants in Diehlstadt

| Immigration Origin | # Population | % Population | View All 0 Rows |
Sex and Age in Diehlstadt
Sex and Age in Diehlstadt
The most populous age groups in Diehlstadt are 75 to 79 Years (11 | 17.7%) for men and 70 to 74 Years (11 | 20.0%) for women.
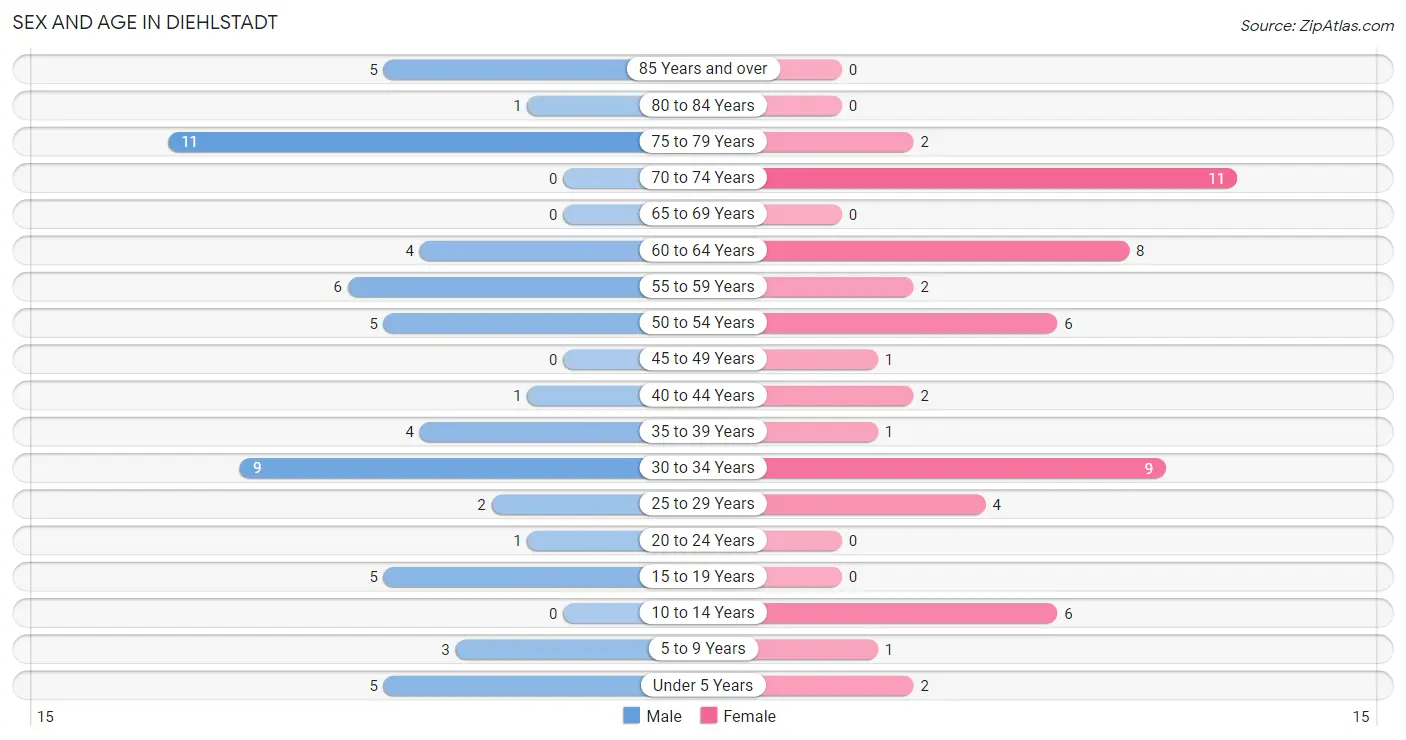
| Age Bracket | Male | Female |
| Under 5 Years | 5 (8.1%) | 2 (3.6%) |
| 5 to 9 Years | 3 (4.8%) | 1 (1.8%) |
| 10 to 14 Years | 0 (0.0%) | 6 (10.9%) |
| 15 to 19 Years | 5 (8.1%) | 0 (0.0%) |
| 20 to 24 Years | 1 (1.6%) | 0 (0.0%) |
| 25 to 29 Years | 2 (3.2%) | 4 (7.3%) |
| 30 to 34 Years | 9 (14.5%) | 9 (16.4%) |
| 35 to 39 Years | 4 (6.5%) | 1 (1.8%) |
| 40 to 44 Years | 1 (1.6%) | 2 (3.6%) |
| 45 to 49 Years | 0 (0.0%) | 1 (1.8%) |
| 50 to 54 Years | 5 (8.1%) | 6 (10.9%) |
| 55 to 59 Years | 6 (9.7%) | 2 (3.6%) |
| 60 to 64 Years | 4 (6.5%) | 8 (14.5%) |
| 65 to 69 Years | 0 (0.0%) | 0 (0.0%) |
| 70 to 74 Years | 0 (0.0%) | 11 (20.0%) |
| 75 to 79 Years | 11 (17.7%) | 2 (3.6%) |
| 80 to 84 Years | 1 (1.6%) | 0 (0.0%) |
| 85 Years and over | 5 (8.1%) | 0 (0.0%) |
| Total | 62 (100.0%) | 55 (100.0%) |
Families and Households in Diehlstadt
Median Family Size in Diehlstadt
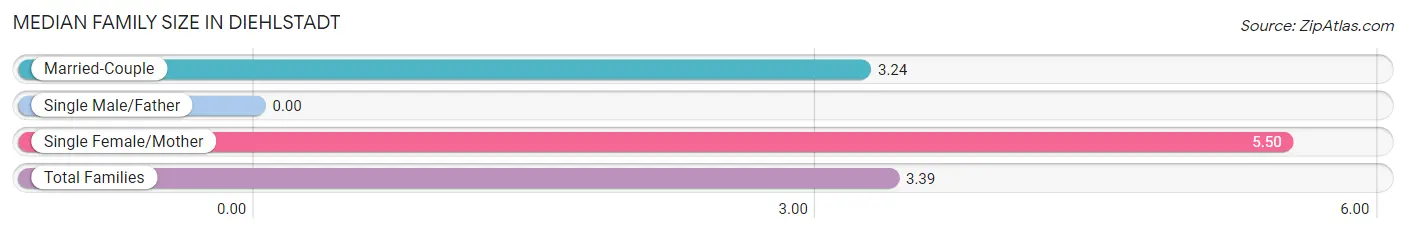
| Family Type | # Families | Family Size |
| Married-Couple | 29 (93.5%) | 3.24 |
| Single Male/Father | 0 (0.0%) | - |
| Single Female/Mother | 2 (6.5%) | 5.50 |
| Total Families | 31 (100.0%) | 3.39 |
Median Household Size in Diehlstadt
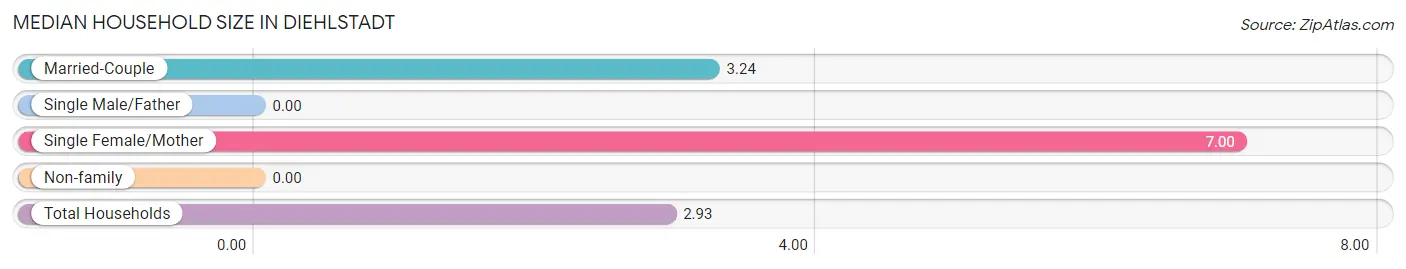
| Household Type | # Households | Household Size |
| Married-Couple | 29 (72.5%) | 3.24 |
| Single Male/Father | 0 (0.0%) | - |
| Single Female/Mother | 2 (5.0%) | 7.00 |
| Non-family | 9 (22.5%) | - |
| Total Households | 40 (100.0%) | 2.93 |
Household Size by Marriage Status in Diehlstadt
Out of a total of 40 households in Diehlstadt, 31 (77.5%) are family households, while 9 (22.5%) are nonfamily households. The most numerous type of family households are 2-person households, comprising 11, and the most common type of nonfamily households are 1-person households, comprising 9.
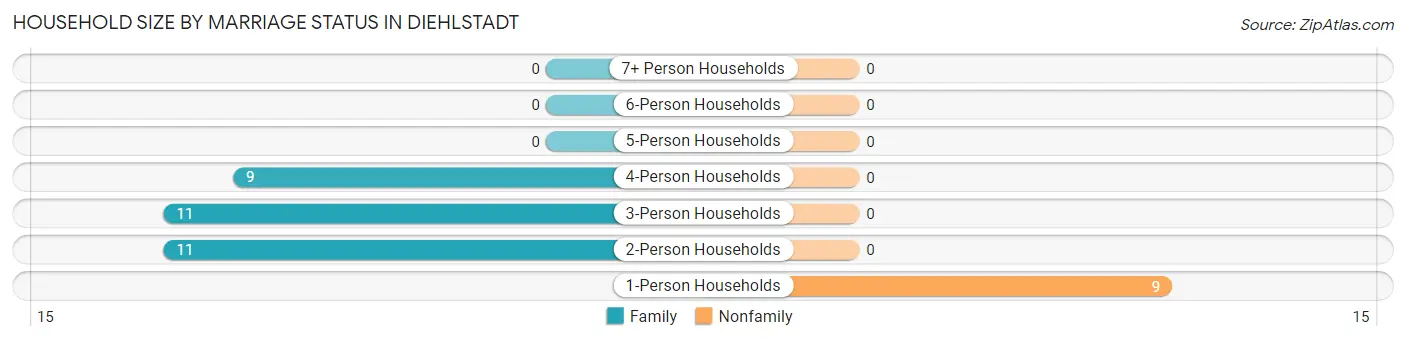
| Household Size | Family Households | Nonfamily Households |
| 1-Person Households | - | 9 (22.5%) |
| 2-Person Households | 11 (27.5%) | 0 (0.0%) |
| 3-Person Households | 11 (27.5%) | 0 (0.0%) |
| 4-Person Households | 9 (22.5%) | 0 (0.0%) |
| 5-Person Households | 0 (0.0%) | 0 (0.0%) |
| 6-Person Households | 0 (0.0%) | 0 (0.0%) |
| 7+ Person Households | 0 (0.0%) | 0 (0.0%) |
| Total | 31 (77.5%) | 9 (22.5%) |
Female Fertility in Diehlstadt
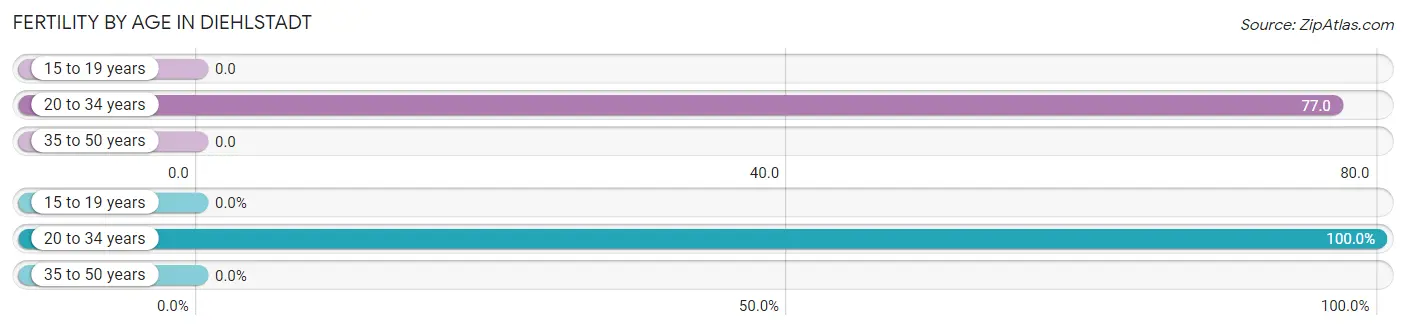
Fertility by Age in Diehlstadt
Average fertility rate in Diehlstadt is 59.0 births per 1,000 women. Women in the age bracket of 20 to 34 years have the highest fertility rate with 77.0 births per 1,000 women. Women in the age bracket of 20 to 34 years acount for 100.0% of all women with births.
| Age Bracket | Women with Births | Births / 1,000 Women |
| 15 to 19 years | 0 (0.0%) | 0.0 |
| 20 to 34 years | 1 (100.0%) | 77.0 |
| 35 to 50 years | 0 (0.0%) | 0.0 |
| Total | 1 (100.0%) | 59.0 |
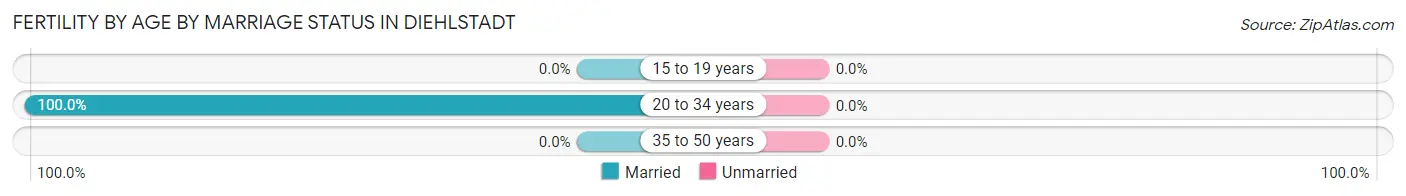
Fertility by Age by Marriage Status in Diehlstadt
| Age Bracket | Married | Unmarried |
| 15 to 19 years | 0 (0.0%) | 0 (0.0%) |
| 20 to 34 years | 1 (100.0%) | 0 (0.0%) |
| 35 to 50 years | 0 (0.0%) | 0 (0.0%) |
| Total | 1 (100.0%) | 0 (0.0%) |
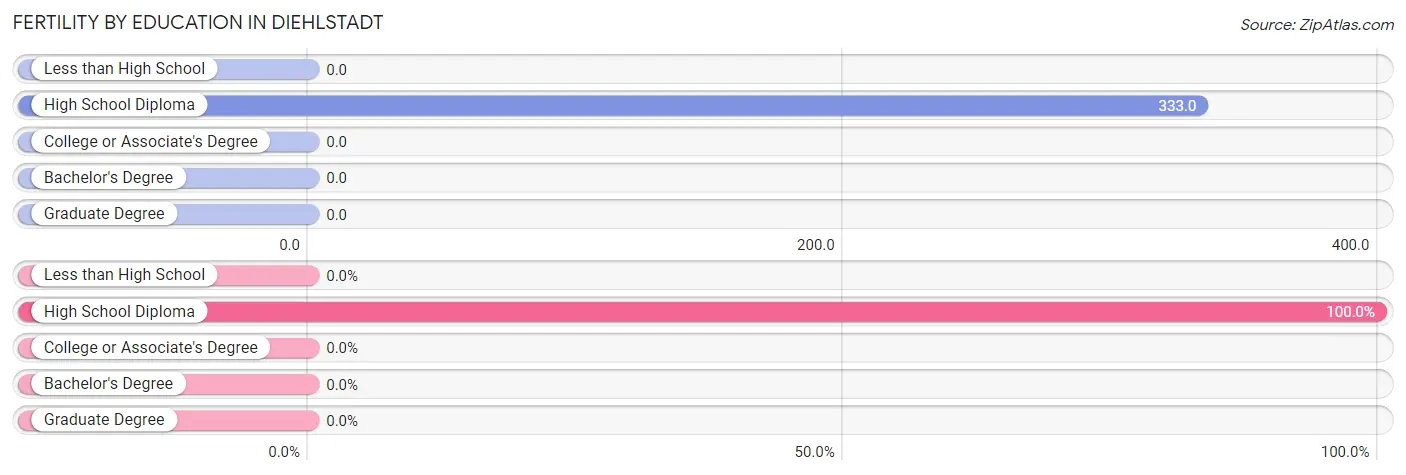
Fertility by Education in Diehlstadt
| Educational Attainment | Women with Births | Births / 1,000 Women |
| Less than High School | 0 (0.0%) | 0.0 |
| High School Diploma | 1 (100.0%) | 333.0 |
| College or Associate's Degree | 0 (0.0%) | 0.0 |
| Bachelor's Degree | 0 (0.0%) | 0.0 |
| Graduate Degree | 0 (0.0%) | 0.0 |
| Total | 1 (100.0%) | 59.0 |
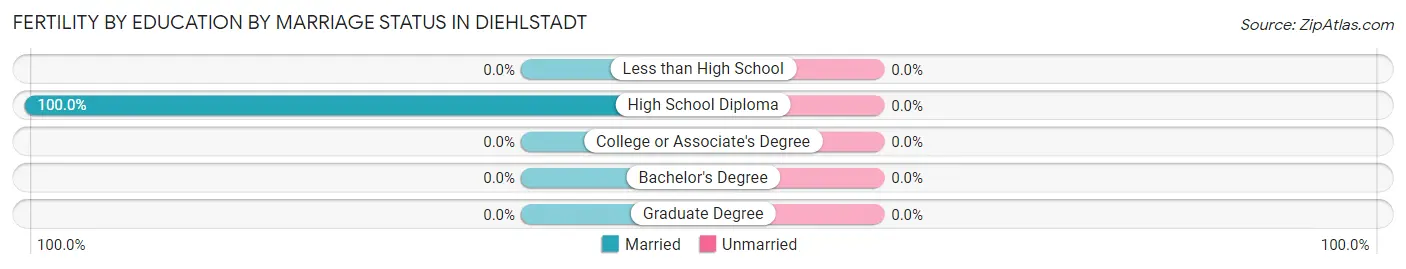
Fertility by Education by Marriage Status in Diehlstadt
| Educational Attainment | Married | Unmarried |
| Less than High School | 0 (0.0%) | 0 (0.0%) |
| High School Diploma | 1 (100.0%) | 0 (0.0%) |
| College or Associate's Degree | 0 (0.0%) | 0 (0.0%) |
| Bachelor's Degree | 0 (0.0%) | 0 (0.0%) |
| Graduate Degree | 0 (0.0%) | 0 (0.0%) |
| Total | 1 (100.0%) | 0 (0.0%) |
Employment Characteristics in Diehlstadt
Employment by Class of Employer in Diehlstadt
Among the 39 employed individuals in Diehlstadt, private company employees (19 | 48.7%), local government employees (11 | 28.2%), and state government employees (6 | 15.4%) make up the most common classes of employment.
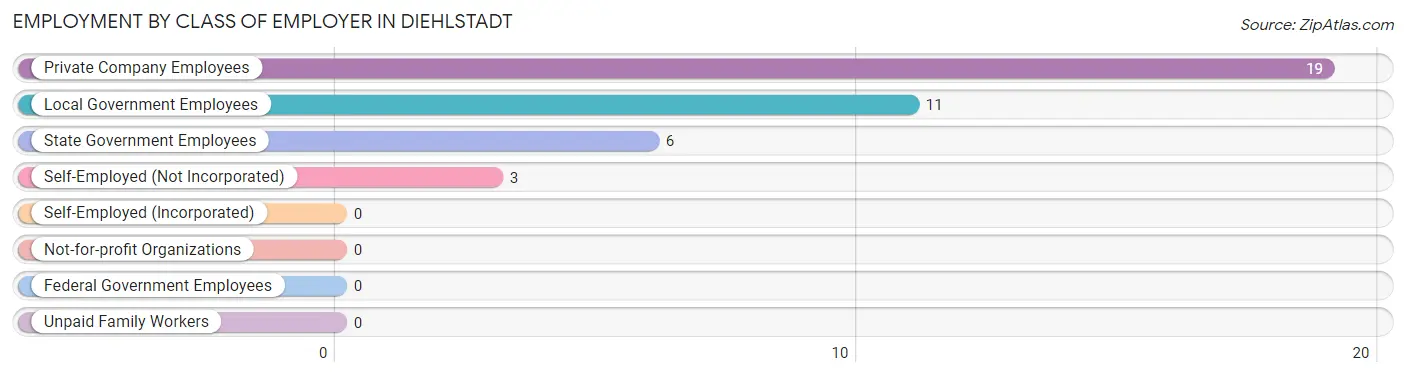
| Employer Class | # Employees | % Employees |
| Private Company Employees | 19 | 48.7% |
| Self-Employed (Incorporated) | 0 | 0.0% |
| Self-Employed (Not Incorporated) | 3 | 7.7% |
| Not-for-profit Organizations | 0 | 0.0% |
| Local Government Employees | 11 | 28.2% |
| State Government Employees | 6 | 15.4% |
| Federal Government Employees | 0 | 0.0% |
| Unpaid Family Workers | 0 | 0.0% |
| Total | 39 | 100.0% |
Employment Status by Age in Diehlstadt
According to the labor force statistics for Diehlstadt, out of the total population over 16 years of age (98), 49.0% or 48 individuals are in the labor force, with 4.2% or 2 of them unemployed. The age group with the highest labor force participation rate is 20 to 24 years, with 100.0% or 1 individuals in the labor force. Within the labor force, the 20 to 24 years age range has the highest percentage of unemployed individuals, with 100.0% or 1 of them being unemployed.
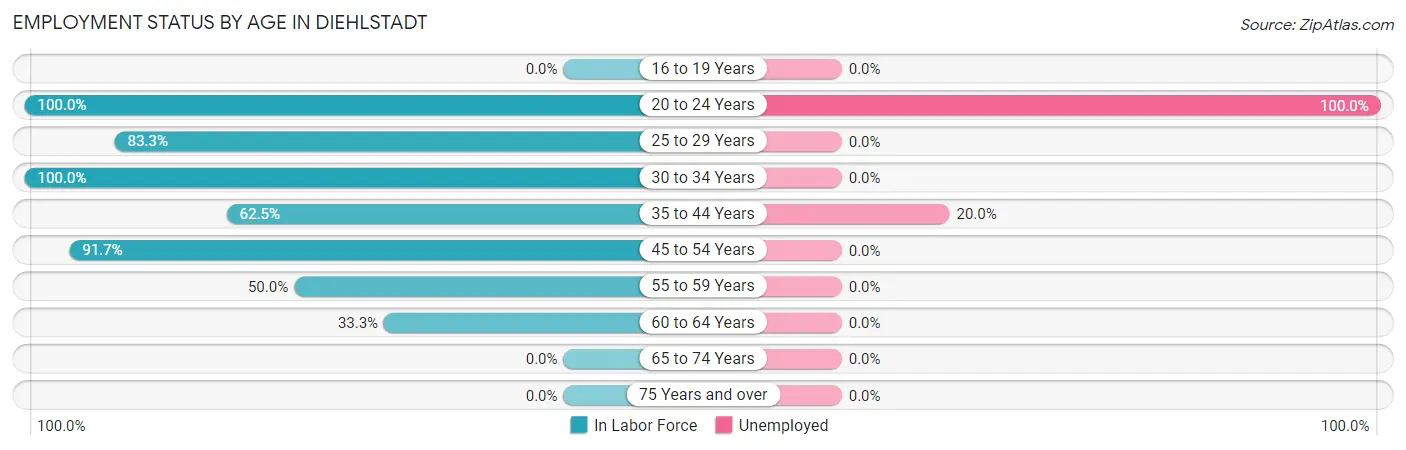
| Age Bracket | In Labor Force | Unemployed |
| 16 to 19 Years | 0 (0.0%) | 0 (0.0%) |
| 20 to 24 Years | 1 (100.0%) | 1 (100.0%) |
| 25 to 29 Years | 5 (83.3%) | 0 (0.0%) |
| 30 to 34 Years | 18 (100.0%) | 0 (0.0%) |
| 35 to 44 Years | 5 (62.5%) | 1 (20.0%) |
| 45 to 54 Years | 11 (91.7%) | 0 (0.0%) |
| 55 to 59 Years | 4 (50.0%) | 0 (0.0%) |
| 60 to 64 Years | 4 (33.3%) | 0 (0.0%) |
| 65 to 74 Years | 0 (0.0%) | 0 (0.0%) |
| 75 Years and over | 0 (0.0%) | 0 (0.0%) |
| Total | 48 (49.0%) | 2 (4.2%) |
Employment Status by Educational Attainment in Diehlstadt
According to labor force statistics for Diehlstadt, 73.4% of individuals (47) out of the total population between 25 and 64 years of age (64) are in the labor force, with 2.1% or 1 of them being unemployed. The group with the highest labor force participation rate are those with the educational attainment of bachelor's degree or higher, with 100.0% or 11 individuals in the labor force. Within the labor force, individuals with high school diploma education have the highest percentage of unemployment, with 5.9% or 1 of them being unemployed.
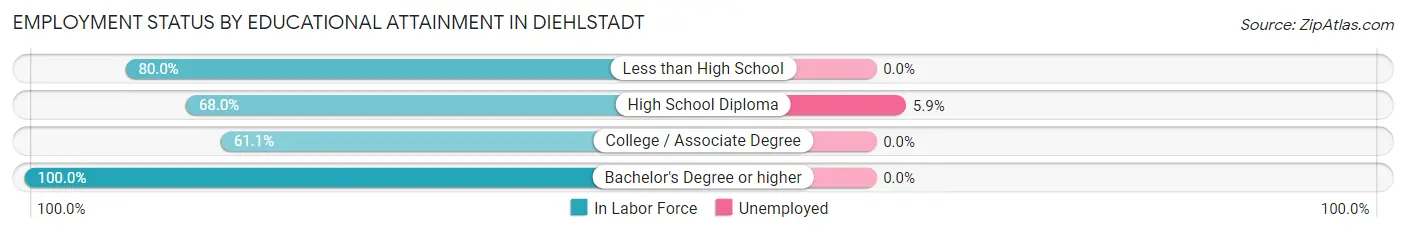
| Educational Attainment | In Labor Force | Unemployed |
| Less than High School | 8 (80.0%) | 0 (0.0%) |
| High School Diploma | 17 (68.0%) | 1 (5.9%) |
| College / Associate Degree | 11 (61.1%) | 0 (0.0%) |
| Bachelor's Degree or higher | 11 (100.0%) | 0 (0.0%) |
| Total | 47 (73.4%) | 1 (2.1%) |
Employment Occupations by Sex in Diehlstadt
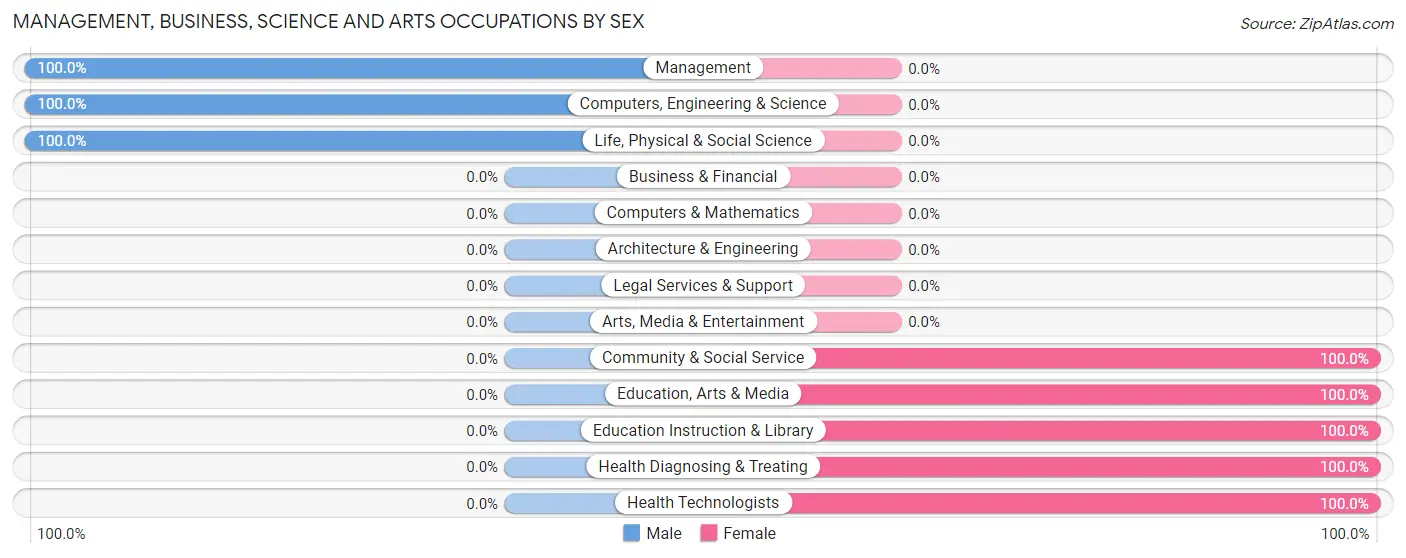
Management, Business, Science and Arts Occupations
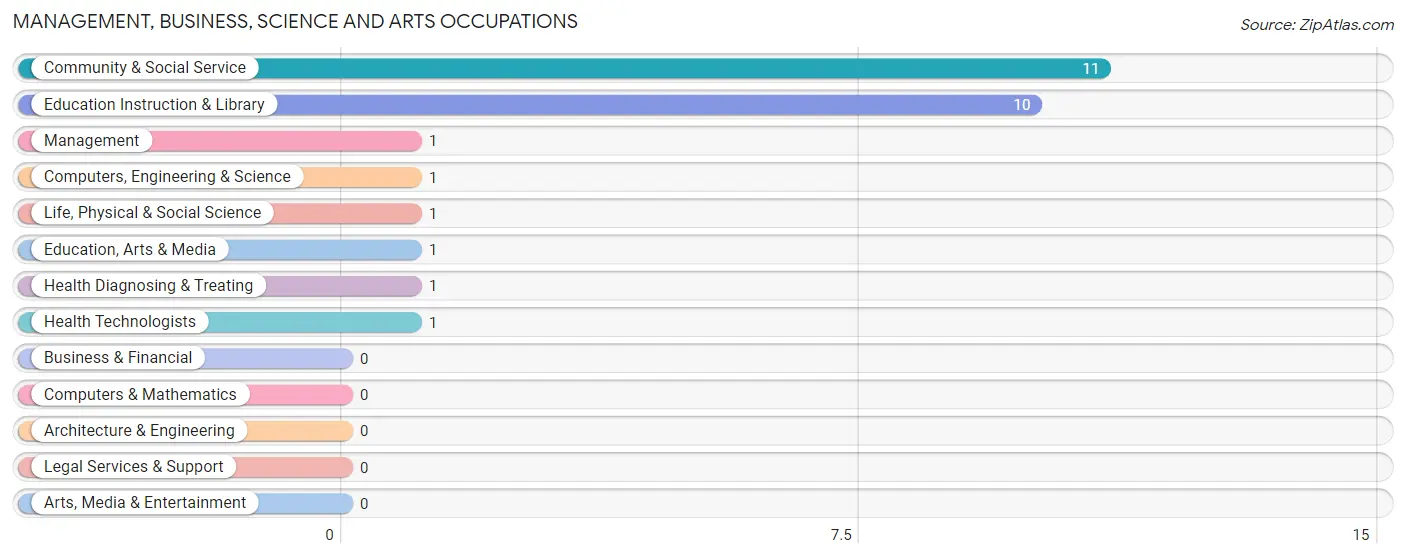
The most common Management, Business, Science and Arts occupations in Diehlstadt are Community & Social Service (11 | 23.9%), Education Instruction & Library (10 | 21.7%), Management (1 | 2.2%), Computers, Engineering & Science (1 | 2.2%), and Life, Physical & Social Science (1 | 2.2%).
Management, Business, Science and Arts Occupations by Sex
Within the Management, Business, Science and Arts occupations in Diehlstadt, the most male-oriented occupations are Management (100.0%), Computers, Engineering & Science (100.0%), and Life, Physical & Social Science (100.0%), while the most female-oriented occupations are Community & Social Service (100.0%), Education, Arts & Media (100.0%), and Education Instruction & Library (100.0%).
| Occupation | Male | Female |
| Management | 1 (100.0%) | 0 (0.0%) |
| Business & Financial | 0 (0.0%) | 0 (0.0%) |
| Computers, Engineering & Science | 1 (100.0%) | 0 (0.0%) |
| Computers & Mathematics | 0 (0.0%) | 0 (0.0%) |
| Architecture & Engineering | 0 (0.0%) | 0 (0.0%) |
| Life, Physical & Social Science | 1 (100.0%) | 0 (0.0%) |
| Community & Social Service | 0 (0.0%) | 11 (100.0%) |
| Education, Arts & Media | 0 (0.0%) | 1 (100.0%) |
| Legal Services & Support | 0 (0.0%) | 0 (0.0%) |
| Education Instruction & Library | 0 (0.0%) | 10 (100.0%) |
| Arts, Media & Entertainment | 0 (0.0%) | 0 (0.0%) |
| Health Diagnosing & Treating | 0 (0.0%) | 1 (100.0%) |
| Health Technologists | 0 (0.0%) | 1 (100.0%) |
| Total (Category) | 2 (14.3%) | 12 (85.7%) |
| Total (Overall) | 24 (52.2%) | 22 (47.8%) |
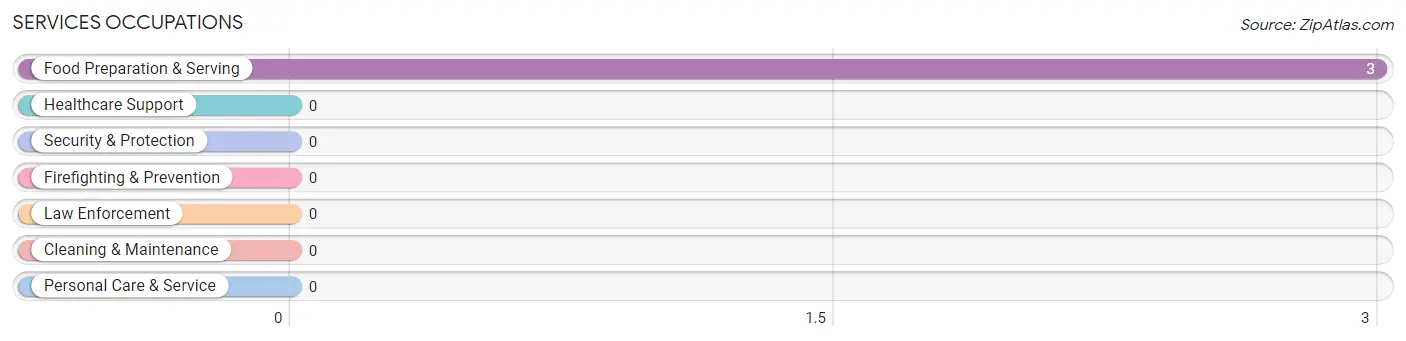
Services Occupations
The most common Services occupations in Diehlstadt are , and Food Preparation & Serving (3 | 6.5%).
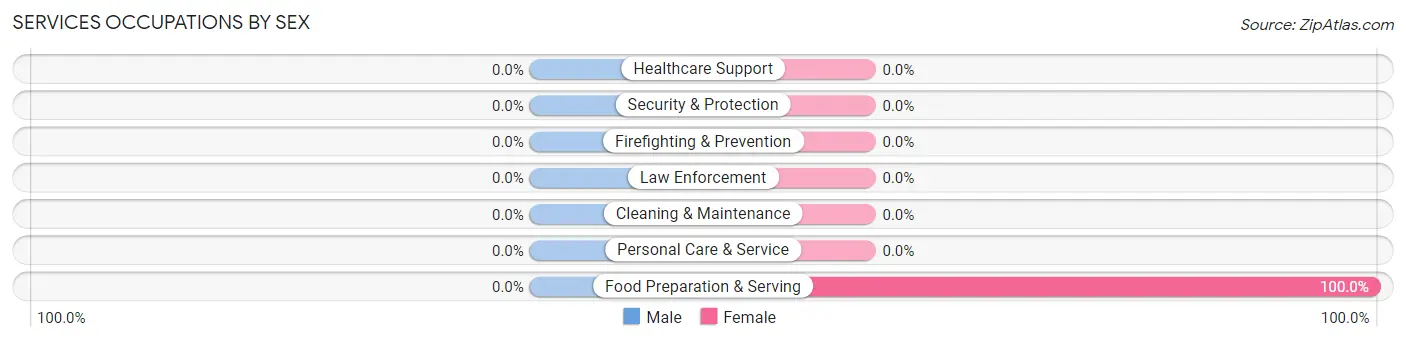
Services Occupations by Sex
| Occupation | Male | Female |
| Healthcare Support | 0 (0.0%) | 0 (0.0%) |
| Security & Protection | 0 (0.0%) | 0 (0.0%) |
| Firefighting & Prevention | 0 (0.0%) | 0 (0.0%) |
| Law Enforcement | 0 (0.0%) | 0 (0.0%) |
| Food Preparation & Serving | 0 (0.0%) | 3 (100.0%) |
| Cleaning & Maintenance | 0 (0.0%) | 0 (0.0%) |
| Personal Care & Service | 0 (0.0%) | 0 (0.0%) |
| Total (Category) | 0 (0.0%) | 3 (100.0%) |
| Total (Overall) | 24 (52.2%) | 22 (47.8%) |
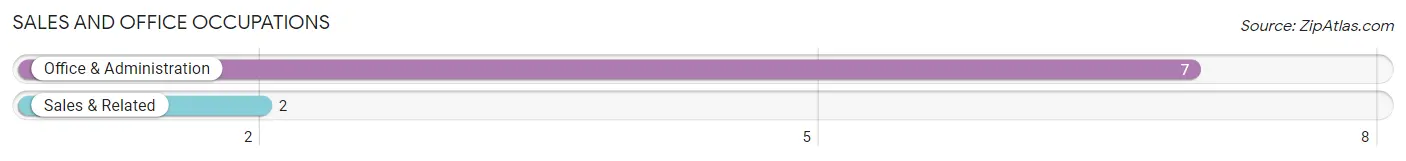
Sales and Office Occupations
The most common Sales and Office occupations in Diehlstadt are Office & Administration (7 | 15.2%), and Sales & Related (2 | 4.3%).
Sales and Office Occupations by Sex

| Occupation | Male | Female |
| Sales & Related | 1 (50.0%) | 1 (50.0%) |
| Office & Administration | 6 (85.7%) | 1 (14.3%) |
| Total (Category) | 7 (77.8%) | 2 (22.2%) |
| Total (Overall) | 24 (52.2%) | 22 (47.8%) |
Natural Resources, Construction and Maintenance Occupations
The most common Natural Resources, Construction and Maintenance occupations in Diehlstadt are Construction & Extraction (8 | 17.4%), and Installation, Maintenance & Repair (3 | 6.5%).
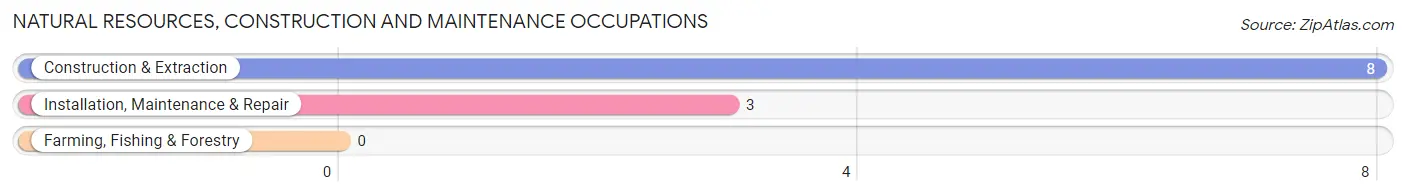
Natural Resources, Construction and Maintenance Occupations by Sex
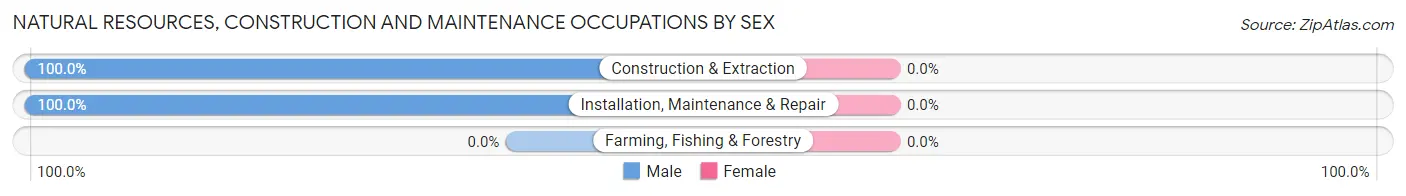
| Occupation | Male | Female |
| Farming, Fishing & Forestry | 0 (0.0%) | 0 (0.0%) |
| Construction & Extraction | 8 (100.0%) | 0 (0.0%) |
| Installation, Maintenance & Repair | 3 (100.0%) | 0 (0.0%) |
| Total (Category) | 11 (100.0%) | 0 (0.0%) |
| Total (Overall) | 24 (52.2%) | 22 (47.8%) |
Production, Transportation and Moving Occupations
The most common Production, Transportation and Moving occupations in Diehlstadt are Transportation (7 | 15.2%), and Production (2 | 4.3%).
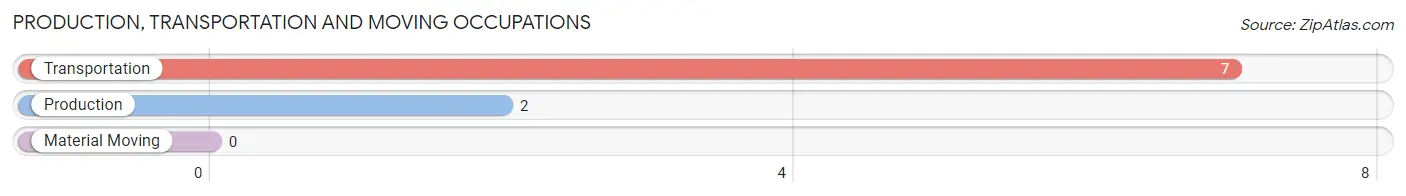
Production, Transportation and Moving Occupations by Sex
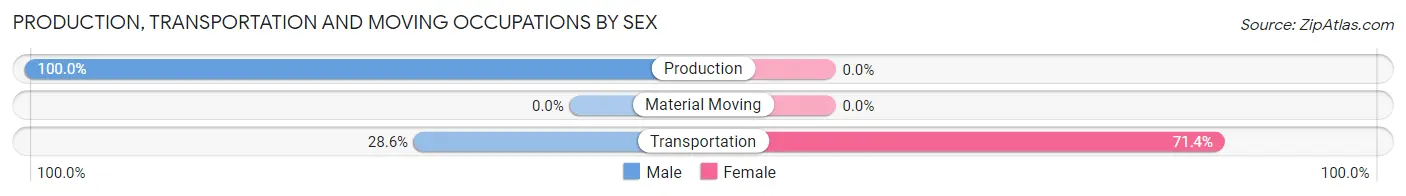
| Occupation | Male | Female |
| Production | 2 (100.0%) | 0 (0.0%) |
| Transportation | 2 (28.6%) | 5 (71.4%) |
| Material Moving | 0 (0.0%) | 0 (0.0%) |
| Total (Category) | 4 (44.4%) | 5 (55.6%) |
| Total (Overall) | 24 (52.2%) | 22 (47.8%) |
Employment Industries by Sex in Diehlstadt
Employment Industries in Diehlstadt
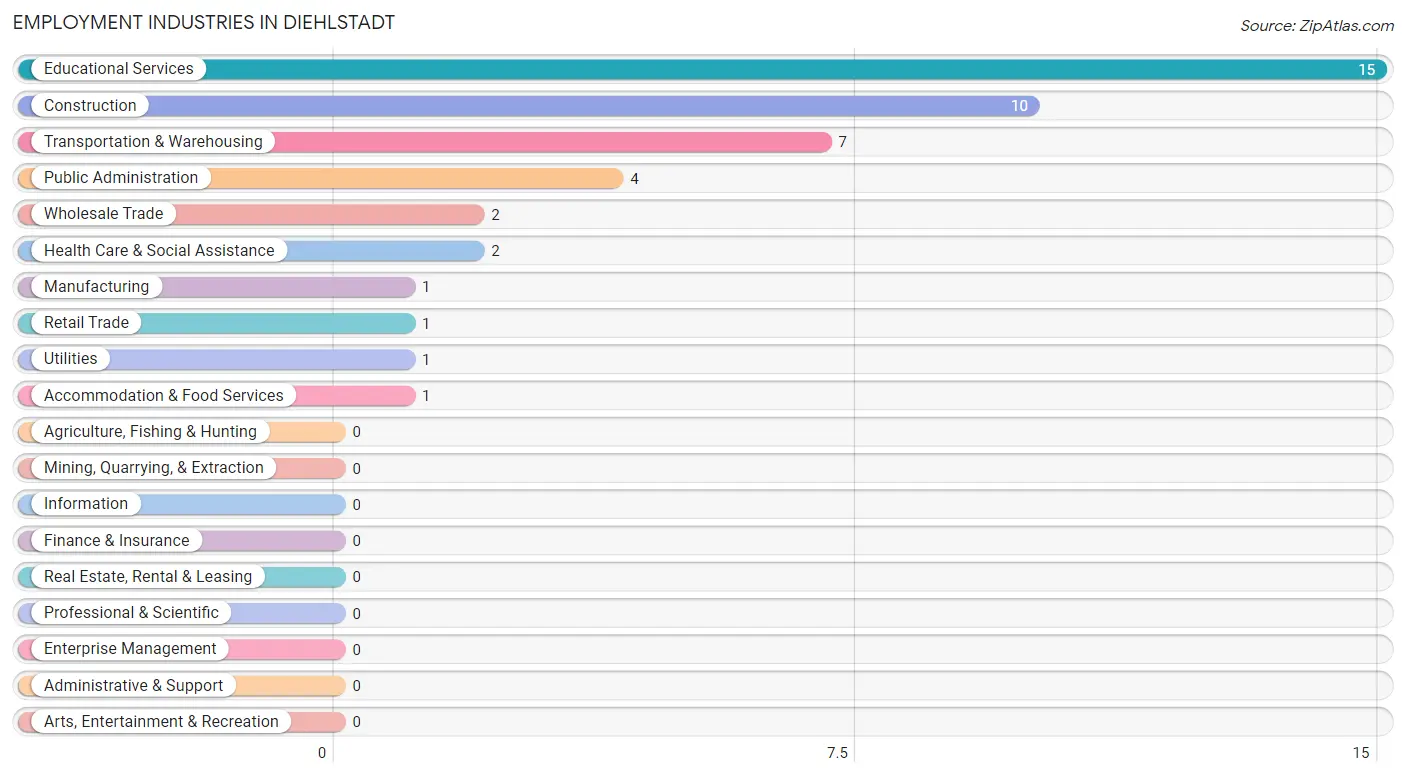
The major employment industries in Diehlstadt include Educational Services (15 | 32.6%), Construction (10 | 21.7%), Transportation & Warehousing (7 | 15.2%), Public Administration (4 | 8.7%), and Wholesale Trade (2 | 4.3%).
Employment Industries by Sex in Diehlstadt
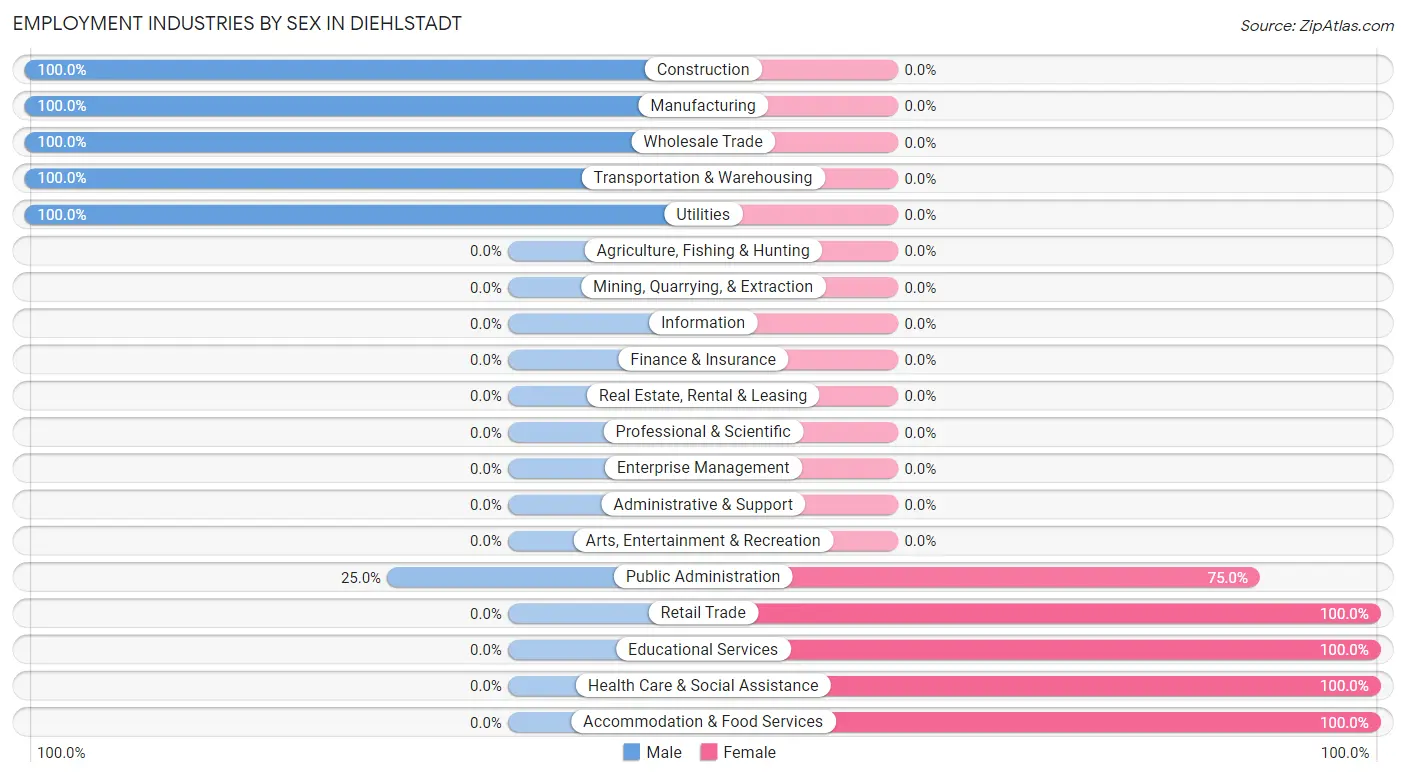
The Diehlstadt industries that see more men than women are Construction (100.0%), Manufacturing (100.0%), and Wholesale Trade (100.0%), whereas the industries that tend to have a higher number of women are Retail Trade (100.0%), Educational Services (100.0%), and Health Care & Social Assistance (100.0%).
| Industry | Male | Female |
| Agriculture, Fishing & Hunting | 0 (0.0%) | 0 (0.0%) |
| Mining, Quarrying, & Extraction | 0 (0.0%) | 0 (0.0%) |
| Construction | 10 (100.0%) | 0 (0.0%) |
| Manufacturing | 1 (100.0%) | 0 (0.0%) |
| Wholesale Trade | 2 (100.0%) | 0 (0.0%) |
| Retail Trade | 0 (0.0%) | 1 (100.0%) |
| Transportation & Warehousing | 7 (100.0%) | 0 (0.0%) |
| Utilities | 1 (100.0%) | 0 (0.0%) |
| Information | 0 (0.0%) | 0 (0.0%) |
| Finance & Insurance | 0 (0.0%) | 0 (0.0%) |
| Real Estate, Rental & Leasing | 0 (0.0%) | 0 (0.0%) |
| Professional & Scientific | 0 (0.0%) | 0 (0.0%) |
| Enterprise Management | 0 (0.0%) | 0 (0.0%) |
| Administrative & Support | 0 (0.0%) | 0 (0.0%) |
| Educational Services | 0 (0.0%) | 15 (100.0%) |
| Health Care & Social Assistance | 0 (0.0%) | 2 (100.0%) |
| Arts, Entertainment & Recreation | 0 (0.0%) | 0 (0.0%) |
| Accommodation & Food Services | 0 (0.0%) | 1 (100.0%) |
| Public Administration | 1 (25.0%) | 3 (75.0%) |
| Total | 24 (52.2%) | 22 (47.8%) |
Education in Diehlstadt
School Enrollment in Diehlstadt
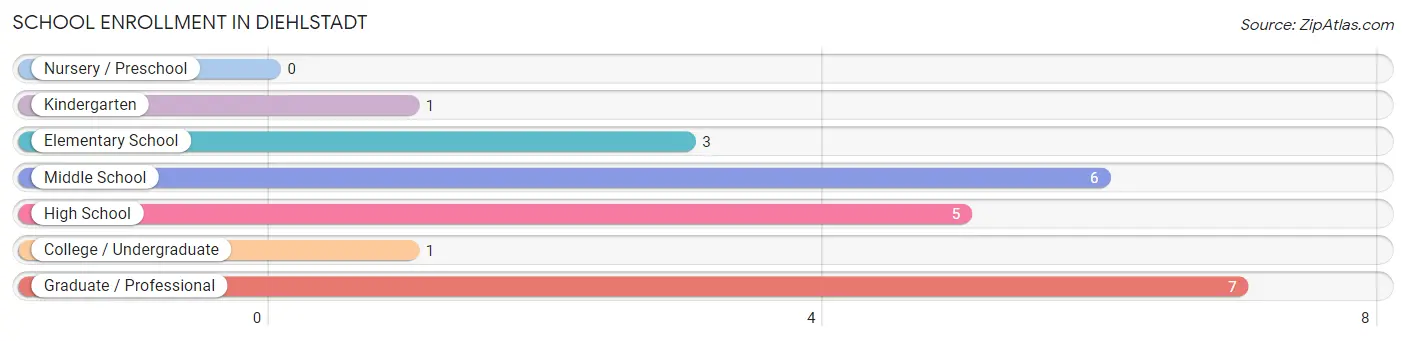
The most common levels of schooling among the 23 students in Diehlstadt are graduate / professional (7 | 30.4%), middle school (6 | 26.1%), and high school (5 | 21.7%).
| School Level | # Students | % Students |
| Nursery / Preschool | 0 | 0.0% |
| Kindergarten | 1 | 4.3% |
| Elementary School | 3 | 13.0% |
| Middle School | 6 | 26.1% |
| High School | 5 | 21.7% |
| College / Undergraduate | 1 | 4.3% |
| Graduate / Professional | 7 | 30.4% |
| Total | 23 | 100.0% |
School Enrollment by Age by Funding Source in Diehlstadt
| Age Bracket | Public School | Private School |
| 3 to 4 Year Olds | 0 (0.0%) | 0 (0.0%) |
| 5 to 9 Year Old | 4 (100.0%) | 0 (0.0%) |
| 10 to 14 Year Olds | 6 (100.0%) | 0 (0.0%) |
| 15 to 17 Year Olds | 5 (100.0%) | 0 (0.0%) |
| 18 to 19 Year Olds | 0 (0.0%) | 0 (0.0%) |
| 20 to 24 Year Olds | 0 (0.0%) | 0 (0.0%) |
| 25 to 34 Year Olds | 8 (100.0%) | 0 (0.0%) |
| 35 Years and over | 0 (0.0%) | 0 (0.0%) |
| Total | 23 (100.0%) | 0 (0.0%) |
Educational Attainment by Field of Study in Diehlstadt
Education (10 | 83.3%), business (1 | 8.3%), and arts & humanities (1 | 8.3%) are the most common fields of study among 12 individuals in Diehlstadt who have obtained a bachelor's degree or higher.
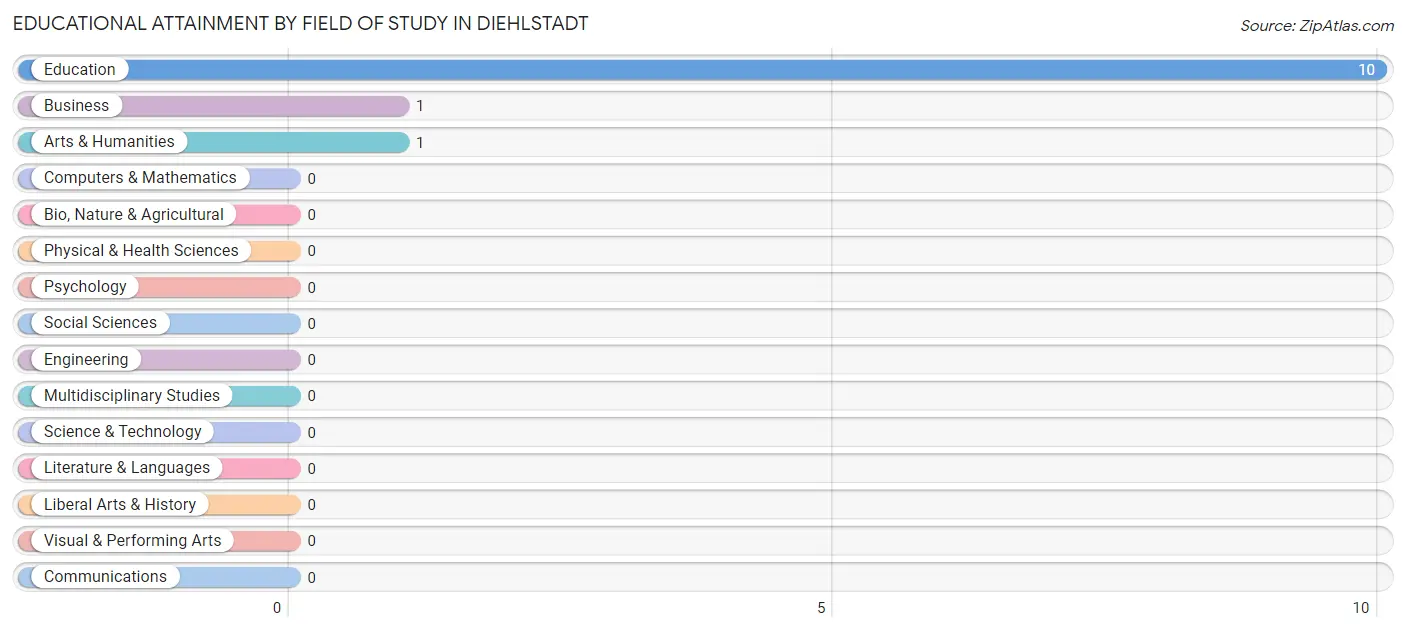
| Field of Study | # Graduates | % Graduates |
| Computers & Mathematics | 0 | 0.0% |
| Bio, Nature & Agricultural | 0 | 0.0% |
| Physical & Health Sciences | 0 | 0.0% |
| Psychology | 0 | 0.0% |
| Social Sciences | 0 | 0.0% |
| Engineering | 0 | 0.0% |
| Multidisciplinary Studies | 0 | 0.0% |
| Science & Technology | 0 | 0.0% |
| Business | 1 | 8.3% |
| Education | 10 | 83.3% |
| Literature & Languages | 0 | 0.0% |
| Liberal Arts & History | 0 | 0.0% |
| Visual & Performing Arts | 0 | 0.0% |
| Communications | 0 | 0.0% |
| Arts & Humanities | 1 | 8.3% |
| Total | 12 | 100.0% |
Transportation & Commute in Diehlstadt
Vehicle Availability by Sex in Diehlstadt
The most prevalent vehicle ownership categories in Diehlstadt are males with 2 vehicles (17, accounting for 70.8%) and females with 2 vehicles (12, making up 113.3%).
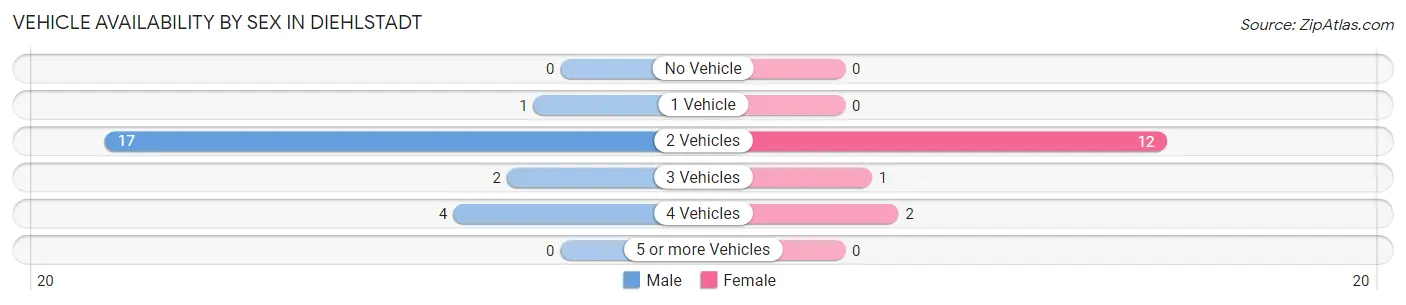
| Vehicles Available | Male | Female |
| No Vehicle | 0 (0.0%) | 0 (0.0%) |
| 1 Vehicle | 1 (4.2%) | 0 (0.0%) |
| 2 Vehicles | 17 (70.8%) | 12 (80.0%) |
| 3 Vehicles | 2 (8.3%) | 1 (6.7%) |
| 4 Vehicles | 4 (16.7%) | 2 (13.3%) |
| 5 or more Vehicles | 0 (0.0%) | 0 (0.0%) |
| Total | 24 (100.0%) | 15 (100.0%) |
Commute Time in Diehlstadt
The most frequently occuring commute durations in Diehlstadt are 30 to 34 minutes (19 commuters, 48.7%), 20 to 24 minutes (13 commuters, 33.3%), and 15 to 19 minutes (6 commuters, 15.4%).
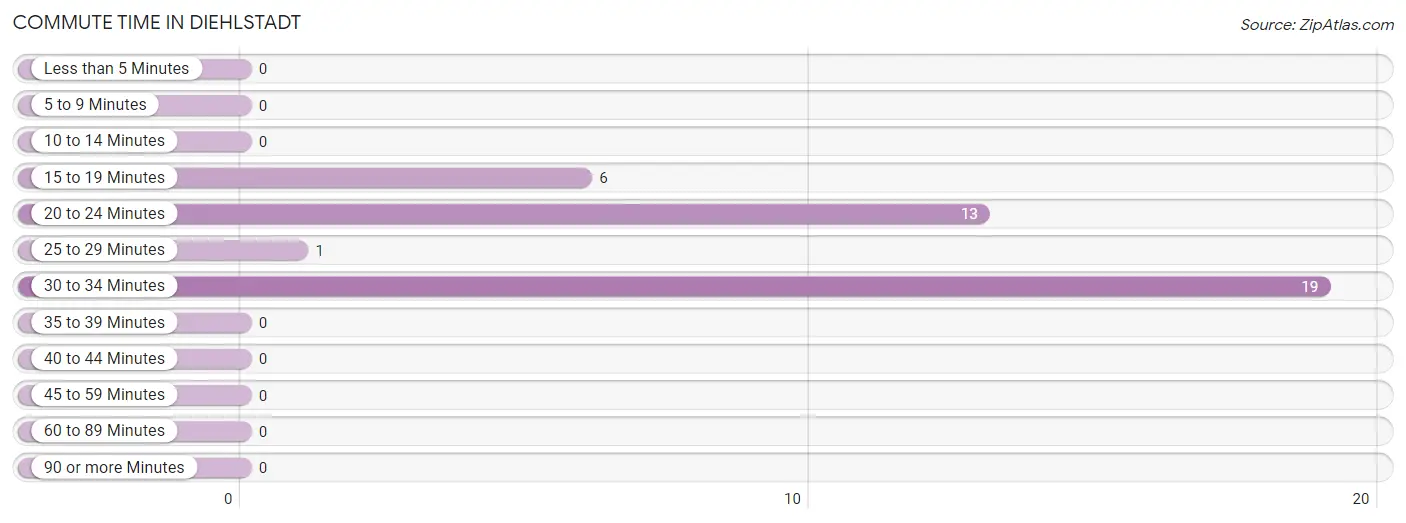
| Commute Time | # Commuters | % Commuters |
| Less than 5 Minutes | 0 | 0.0% |
| 5 to 9 Minutes | 0 | 0.0% |
| 10 to 14 Minutes | 0 | 0.0% |
| 15 to 19 Minutes | 6 | 15.4% |
| 20 to 24 Minutes | 13 | 33.3% |
| 25 to 29 Minutes | 1 | 2.6% |
| 30 to 34 Minutes | 19 | 48.7% |
| 35 to 39 Minutes | 0 | 0.0% |
| 40 to 44 Minutes | 0 | 0.0% |
| 45 to 59 Minutes | 0 | 0.0% |
| 60 to 89 Minutes | 0 | 0.0% |
| 90 or more Minutes | 0 | 0.0% |
Commute Time by Sex in Diehlstadt
The most common commute times in Diehlstadt are 30 to 34 minutes (12 commuters, 50.0%) for males and 30 to 34 minutes (7 commuters, 46.7%) for females.
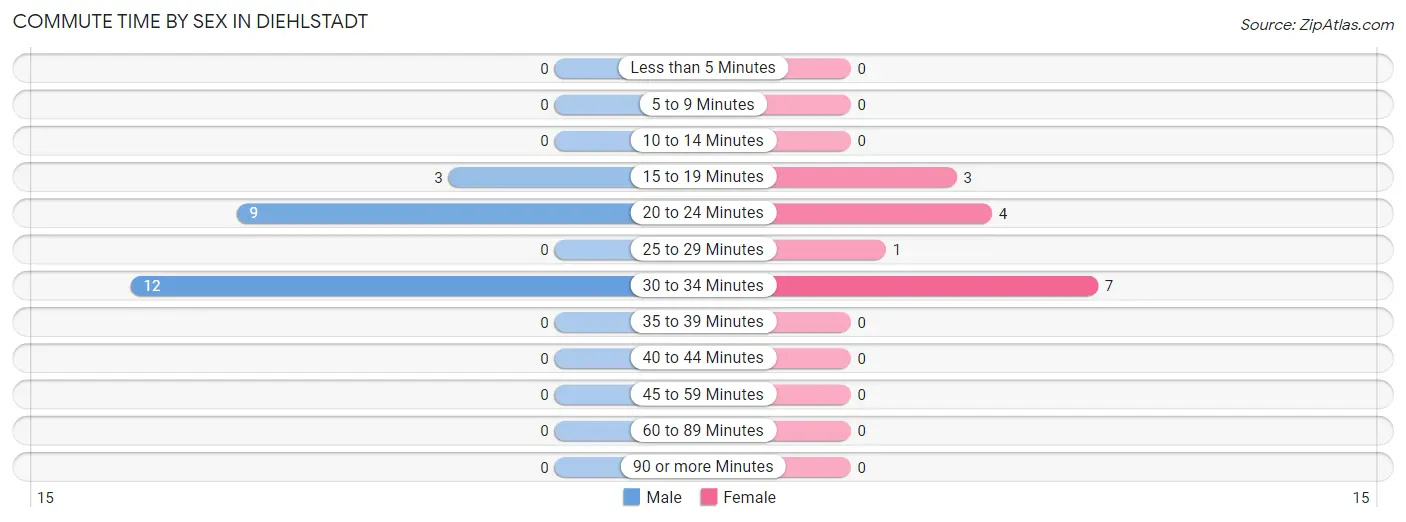
| Commute Time | Male | Female |
| Less than 5 Minutes | 0 (0.0%) | 0 (0.0%) |
| 5 to 9 Minutes | 0 (0.0%) | 0 (0.0%) |
| 10 to 14 Minutes | 0 (0.0%) | 0 (0.0%) |
| 15 to 19 Minutes | 3 (12.5%) | 3 (20.0%) |
| 20 to 24 Minutes | 9 (37.5%) | 4 (26.7%) |
| 25 to 29 Minutes | 0 (0.0%) | 1 (6.7%) |
| 30 to 34 Minutes | 12 (50.0%) | 7 (46.7%) |
| 35 to 39 Minutes | 0 (0.0%) | 0 (0.0%) |
| 40 to 44 Minutes | 0 (0.0%) | 0 (0.0%) |
| 45 to 59 Minutes | 0 (0.0%) | 0 (0.0%) |
| 60 to 89 Minutes | 0 (0.0%) | 0 (0.0%) |
| 90 or more Minutes | 0 (0.0%) | 0 (0.0%) |
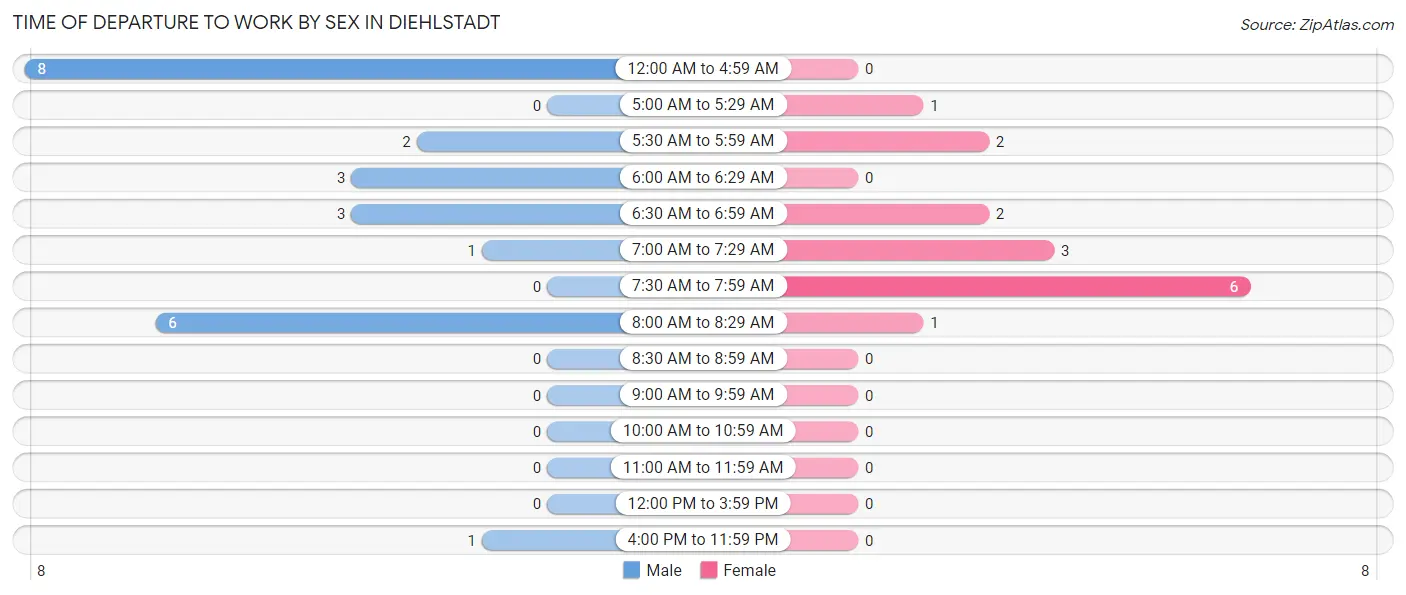
Time of Departure to Work by Sex in Diehlstadt
The most frequent times of departure to work in Diehlstadt are 12:00 AM to 4:59 AM (8, 33.3%) for males and 7:30 AM to 7:59 AM (6, 40.0%) for females.
| Time of Departure | Male | Female |
| 12:00 AM to 4:59 AM | 8 (33.3%) | 0 (0.0%) |
| 5:00 AM to 5:29 AM | 0 (0.0%) | 1 (6.7%) |
| 5:30 AM to 5:59 AM | 2 (8.3%) | 2 (13.3%) |
| 6:00 AM to 6:29 AM | 3 (12.5%) | 0 (0.0%) |
| 6:30 AM to 6:59 AM | 3 (12.5%) | 2 (13.3%) |
| 7:00 AM to 7:29 AM | 1 (4.2%) | 3 (20.0%) |
| 7:30 AM to 7:59 AM | 0 (0.0%) | 6 (40.0%) |
| 8:00 AM to 8:29 AM | 6 (25.0%) | 1 (6.7%) |
| 8:30 AM to 8:59 AM | 0 (0.0%) | 0 (0.0%) |
| 9:00 AM to 9:59 AM | 0 (0.0%) | 0 (0.0%) |
| 10:00 AM to 10:59 AM | 0 (0.0%) | 0 (0.0%) |
| 11:00 AM to 11:59 AM | 0 (0.0%) | 0 (0.0%) |
| 12:00 PM to 3:59 PM | 0 (0.0%) | 0 (0.0%) |
| 4:00 PM to 11:59 PM | 1 (4.2%) | 0 (0.0%) |
| Total | 24 (100.0%) | 15 (100.0%) |
Housing Occupancy in Diehlstadt
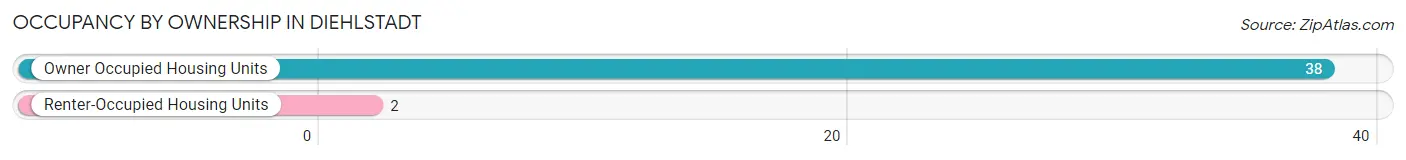
Occupancy by Ownership in Diehlstadt
Of the total 40 dwellings in Diehlstadt, owner-occupied units account for 38 (95.0%), while renter-occupied units make up 2 (5.0%).
| Occupancy | # Housing Units | % Housing Units |
| Owner Occupied Housing Units | 38 | 95.0% |
| Renter-Occupied Housing Units | 2 | 5.0% |
| Total Occupied Housing Units | 40 | 100.0% |
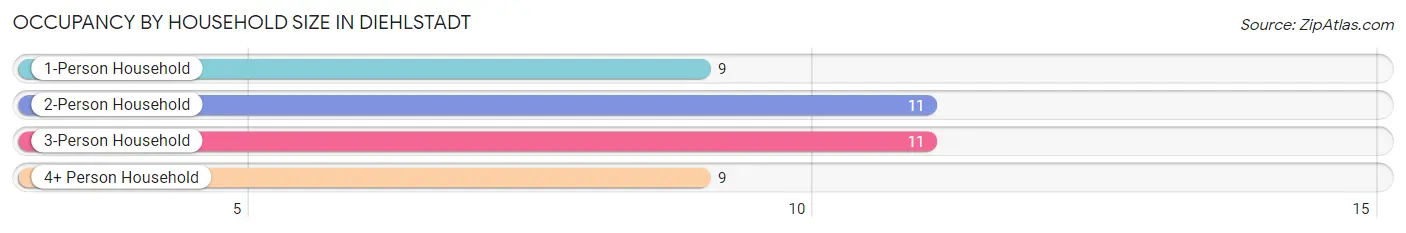
Occupancy by Household Size in Diehlstadt
| Household Size | # Housing Units | % Housing Units |
| 1-Person Household | 9 | 22.5% |
| 2-Person Household | 11 | 27.5% |
| 3-Person Household | 11 | 27.5% |
| 4+ Person Household | 9 | 22.5% |
| Total Housing Units | 40 | 100.0% |
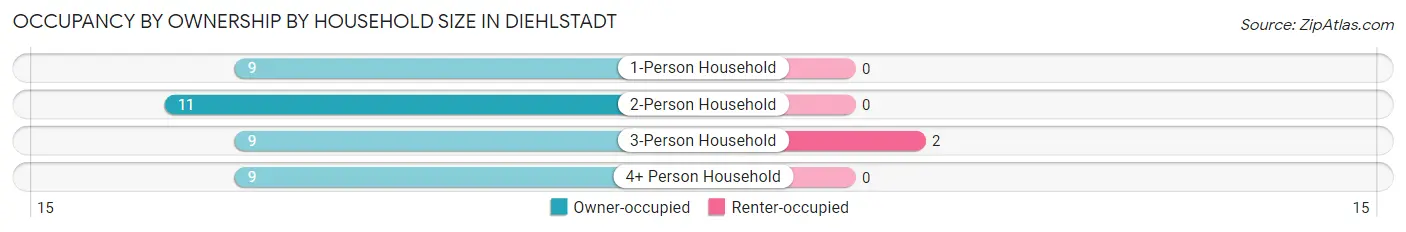
Occupancy by Ownership by Household Size in Diehlstadt
| Household Size | Owner-occupied | Renter-occupied |
| 1-Person Household | 9 (100.0%) | 0 (0.0%) |
| 2-Person Household | 11 (100.0%) | 0 (0.0%) |
| 3-Person Household | 9 (81.8%) | 2 (18.2%) |
| 4+ Person Household | 9 (100.0%) | 0 (0.0%) |
| Total Housing Units | 38 (95.0%) | 2 (5.0%) |
Occupancy by Educational Attainment in Diehlstadt
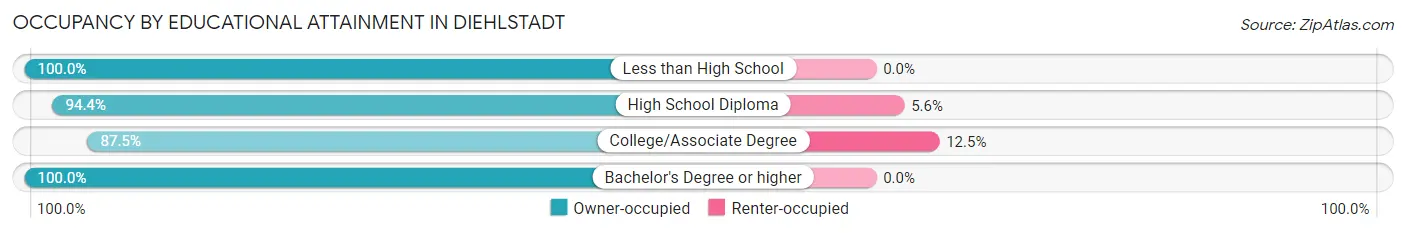
| Household Size | Owner-occupied | Renter-occupied |
| Less than High School | 11 (100.0%) | 0 (0.0%) |
| High School Diploma | 17 (94.4%) | 1 (5.6%) |
| College/Associate Degree | 7 (87.5%) | 1 (12.5%) |
| Bachelor's Degree or higher | 3 (100.0%) | 0 (0.0%) |
Occupancy by Age of Householder in Diehlstadt
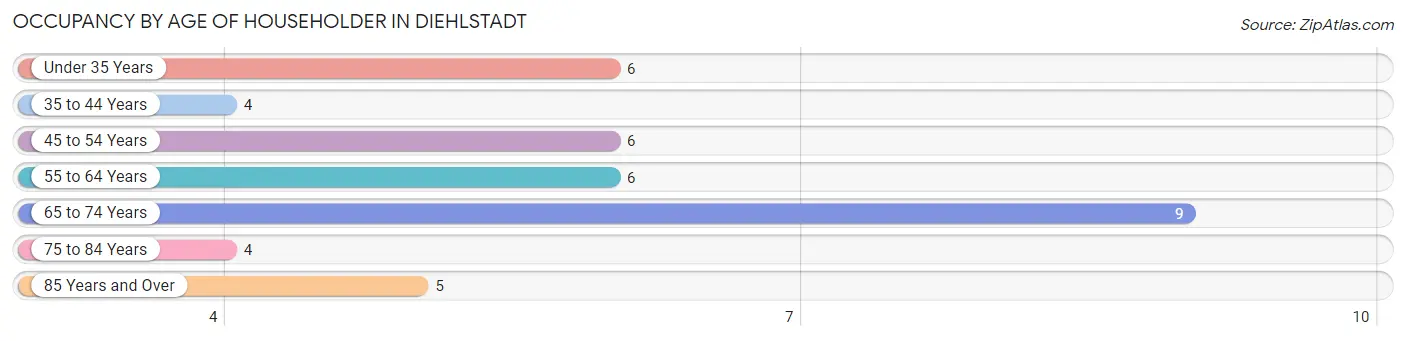
| Age Bracket | # Households | % Households |
| Under 35 Years | 6 | 15.0% |
| 35 to 44 Years | 4 | 10.0% |
| 45 to 54 Years | 6 | 15.0% |
| 55 to 64 Years | 6 | 15.0% |
| 65 to 74 Years | 9 | 22.5% |
| 75 to 84 Years | 4 | 10.0% |
| 85 Years and Over | 5 | 12.5% |
| Total | 40 | 100.0% |
Housing Finances in Diehlstadt
Median Income by Occupancy in Diehlstadt
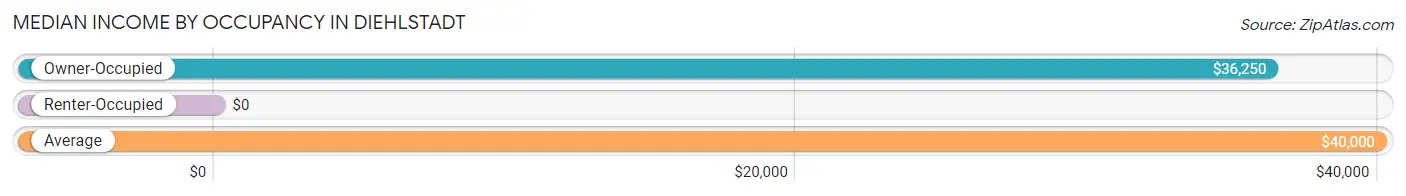
| Occupancy Type | # Households | Median Income |
| Owner-Occupied | 38 (95.0%) | $36,250 |
| Renter-Occupied | 2 (5.0%) | $0 |
| Average | 40 (100.0%) | $40,000 |
Occupancy by Householder Income Bracket in Diehlstadt
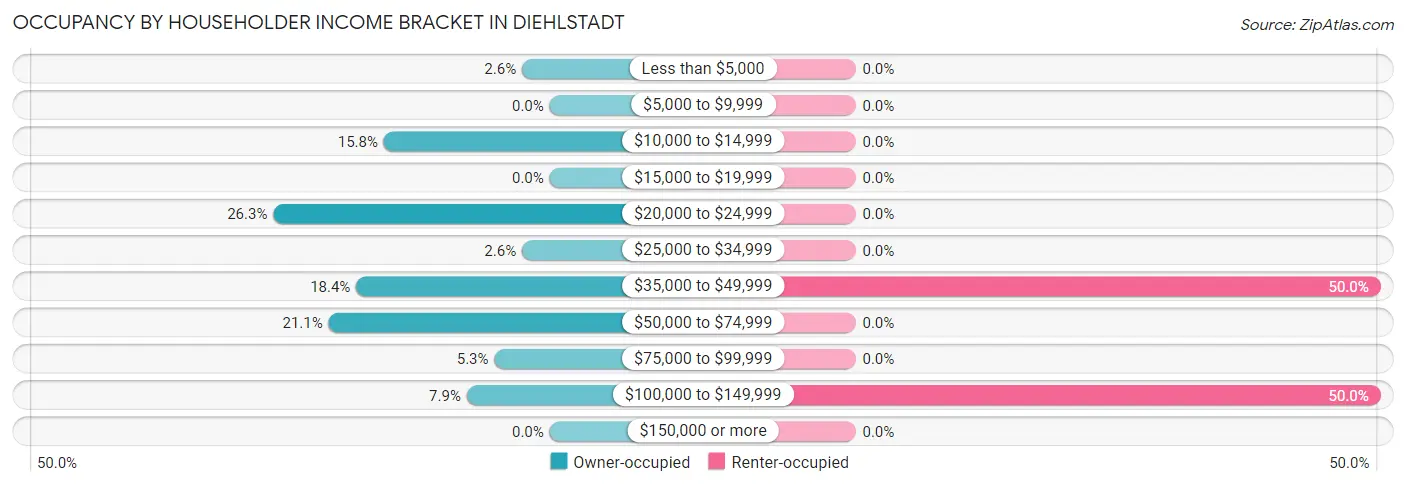
| Income Bracket | Owner-occupied | Renter-occupied |
| Less than $5,000 | 1 (2.6%) | 0 (0.0%) |
| $5,000 to $9,999 | 0 (0.0%) | 0 (0.0%) |
| $10,000 to $14,999 | 6 (15.8%) | 0 (0.0%) |
| $15,000 to $19,999 | 0 (0.0%) | 0 (0.0%) |
| $20,000 to $24,999 | 10 (26.3%) | 0 (0.0%) |
| $25,000 to $34,999 | 1 (2.6%) | 0 (0.0%) |
| $35,000 to $49,999 | 7 (18.4%) | 1 (50.0%) |
| $50,000 to $74,999 | 8 (21.0%) | 0 (0.0%) |
| $75,000 to $99,999 | 2 (5.3%) | 0 (0.0%) |
| $100,000 to $149,999 | 3 (7.9%) | 1 (50.0%) |
| $150,000 or more | 0 (0.0%) | 0 (0.0%) |
| Total | 38 (100.0%) | 2 (100.0%) |
Monthly Housing Cost Tiers in Diehlstadt
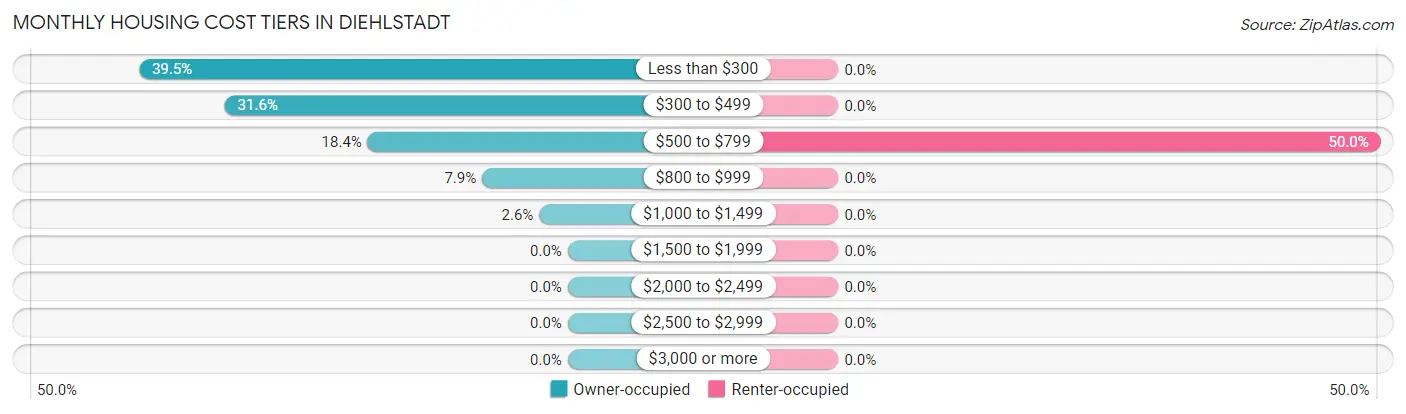
| Monthly Cost | Owner-occupied | Renter-occupied |
| Less than $300 | 15 (39.5%) | 0 (0.0%) |
| $300 to $499 | 12 (31.6%) | 0 (0.0%) |
| $500 to $799 | 7 (18.4%) | 1 (50.0%) |
| $800 to $999 | 3 (7.9%) | 0 (0.0%) |
| $1,000 to $1,499 | 1 (2.6%) | 0 (0.0%) |
| $1,500 to $1,999 | 0 (0.0%) | 0 (0.0%) |
| $2,000 to $2,499 | 0 (0.0%) | 0 (0.0%) |
| $2,500 to $2,999 | 0 (0.0%) | 0 (0.0%) |
| $3,000 or more | 0 (0.0%) | 0 (0.0%) |
| Total | 38 (100.0%) | 2 (100.0%) |
Physical Housing Characteristics in Diehlstadt
Housing Structures in Diehlstadt
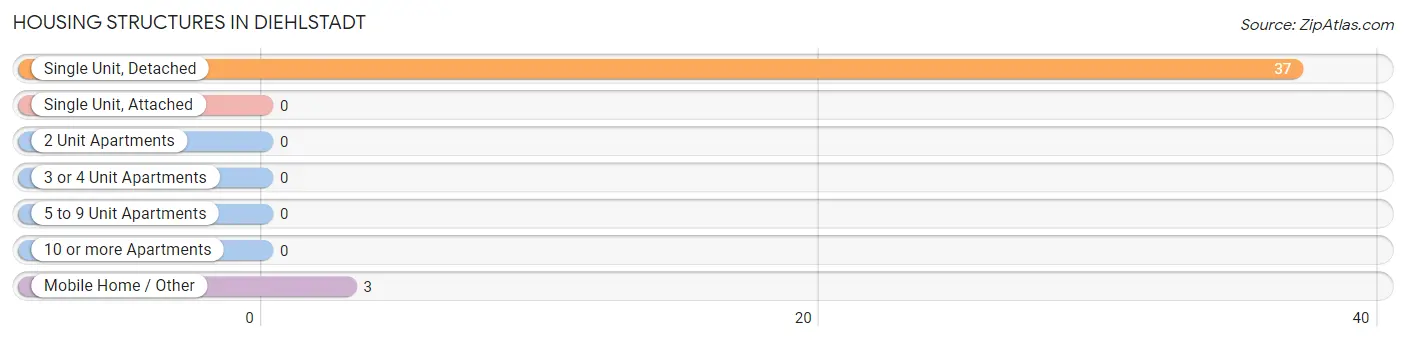
| Structure Type | # Housing Units | % Housing Units |
| Single Unit, Detached | 37 | 92.5% |
| Single Unit, Attached | 0 | 0.0% |
| 2 Unit Apartments | 0 | 0.0% |
| 3 or 4 Unit Apartments | 0 | 0.0% |
| 5 to 9 Unit Apartments | 0 | 0.0% |
| 10 or more Apartments | 0 | 0.0% |
| Mobile Home / Other | 3 | 7.5% |
| Total | 40 | 100.0% |
Housing Structures by Occupancy in Diehlstadt
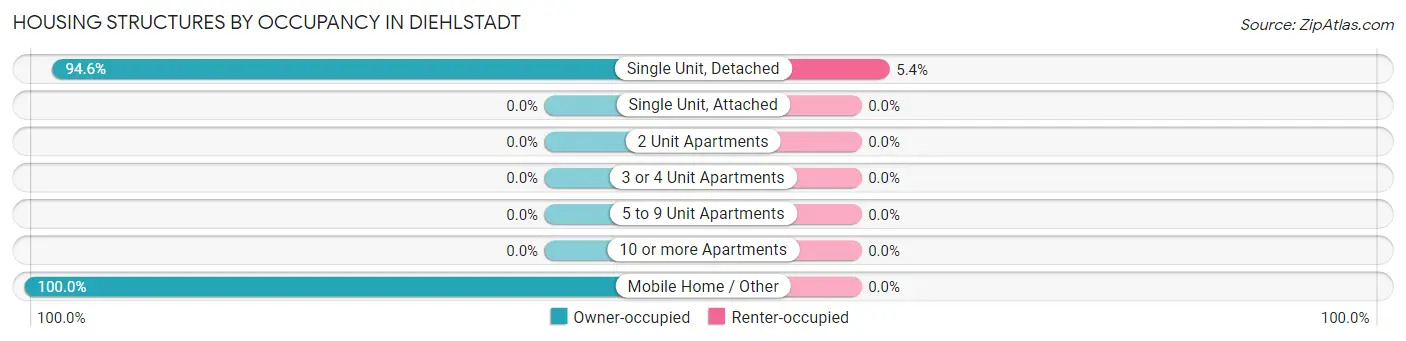
| Structure Type | Owner-occupied | Renter-occupied |
| Single Unit, Detached | 35 (94.6%) | 2 (5.4%) |
| Single Unit, Attached | 0 (0.0%) | 0 (0.0%) |
| 2 Unit Apartments | 0 (0.0%) | 0 (0.0%) |
| 3 or 4 Unit Apartments | 0 (0.0%) | 0 (0.0%) |
| 5 to 9 Unit Apartments | 0 (0.0%) | 0 (0.0%) |
| 10 or more Apartments | 0 (0.0%) | 0 (0.0%) |
| Mobile Home / Other | 3 (100.0%) | 0 (0.0%) |
| Total | 38 (95.0%) | 2 (5.0%) |
Housing Structures by Number of Rooms in Diehlstadt
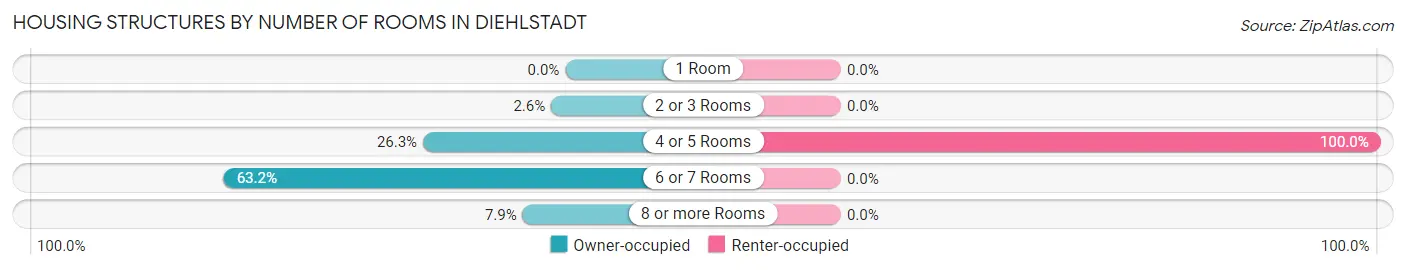
| Number of Rooms | Owner-occupied | Renter-occupied |
| 1 Room | 0 (0.0%) | 0 (0.0%) |
| 2 or 3 Rooms | 1 (2.6%) | 0 (0.0%) |
| 4 or 5 Rooms | 10 (26.3%) | 2 (100.0%) |
| 6 or 7 Rooms | 24 (63.2%) | 0 (0.0%) |
| 8 or more Rooms | 3 (7.9%) | 0 (0.0%) |
| Total | 38 (100.0%) | 2 (100.0%) |
Housing Structure by Heating Type in Diehlstadt
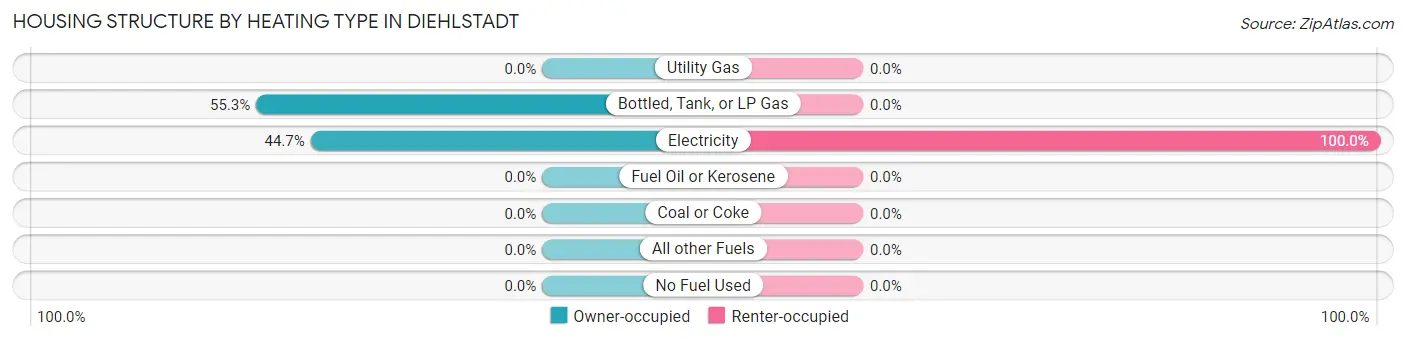
| Heating Type | Owner-occupied | Renter-occupied |
| Utility Gas | 0 (0.0%) | 0 (0.0%) |
| Bottled, Tank, or LP Gas | 21 (55.3%) | 0 (0.0%) |
| Electricity | 17 (44.7%) | 2 (100.0%) |
| Fuel Oil or Kerosene | 0 (0.0%) | 0 (0.0%) |
| Coal or Coke | 0 (0.0%) | 0 (0.0%) |
| All other Fuels | 0 (0.0%) | 0 (0.0%) |
| No Fuel Used | 0 (0.0%) | 0 (0.0%) |
| Total | 38 (100.0%) | 2 (100.0%) |
Household Vehicle Usage in Diehlstadt
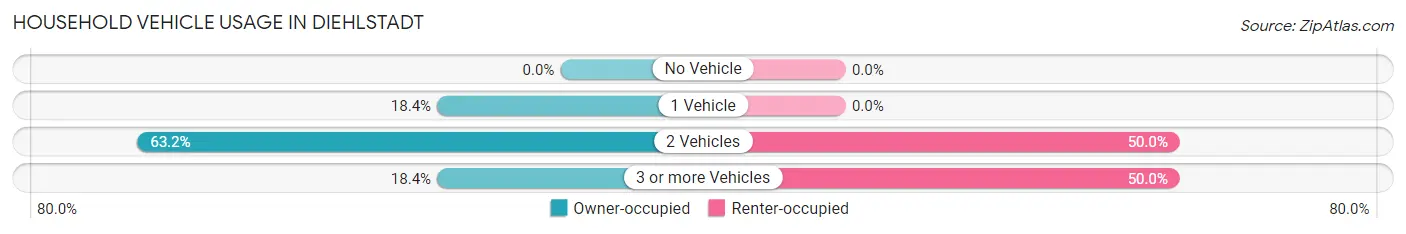
| Vehicles per Household | Owner-occupied | Renter-occupied |
| No Vehicle | 0 (0.0%) | 0 (0.0%) |
| 1 Vehicle | 7 (18.4%) | 0 (0.0%) |
| 2 Vehicles | 24 (63.2%) | 1 (50.0%) |
| 3 or more Vehicles | 7 (18.4%) | 1 (50.0%) |
| Total | 38 (100.0%) | 2 (100.0%) |
Real Estate & Mortgages in Diehlstadt
Real Estate and Mortgage Overview in Diehlstadt
| Characteristic | Without Mortgage | With Mortgage |
| Housing Units | 25 | 13 |
| Median Property Value | - | - |
| Median Household Income | $36,875 | $0 |
| Monthly Housing Costs | $286 | $0 |
| Real Estate Taxes | $379 | $0 |
Property Value by Mortgage Status in Diehlstadt
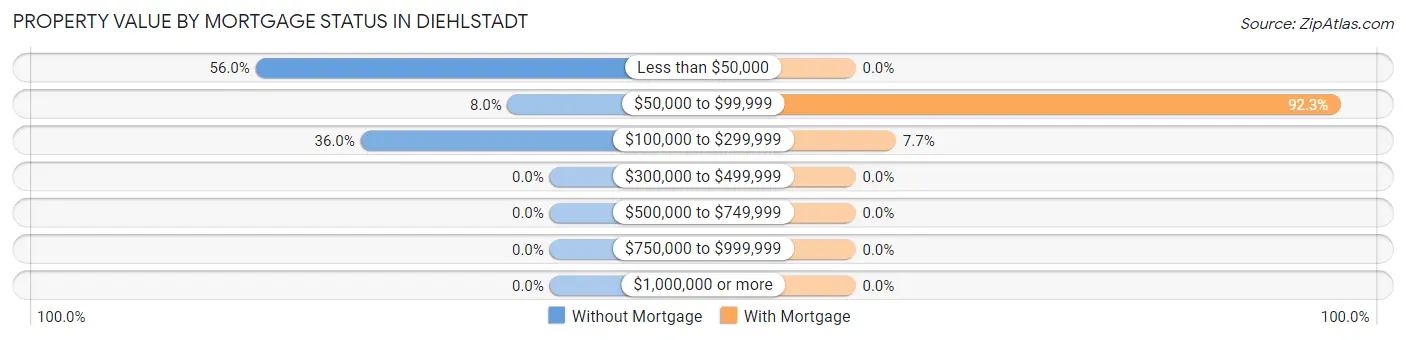
| Property Value | Without Mortgage | With Mortgage |
| Less than $50,000 | 14 (56.0%) | 0 (0.0%) |
| $50,000 to $99,999 | 2 (8.0%) | 12 (92.3%) |
| $100,000 to $299,999 | 9 (36.0%) | 1 (7.7%) |
| $300,000 to $499,999 | 0 (0.0%) | 0 (0.0%) |
| $500,000 to $749,999 | 0 (0.0%) | 0 (0.0%) |
| $750,000 to $999,999 | 0 (0.0%) | 0 (0.0%) |
| $1,000,000 or more | 0 (0.0%) | 0 (0.0%) |
| Total | 25 (100.0%) | 13 (100.0%) |
Household Income by Mortgage Status in Diehlstadt
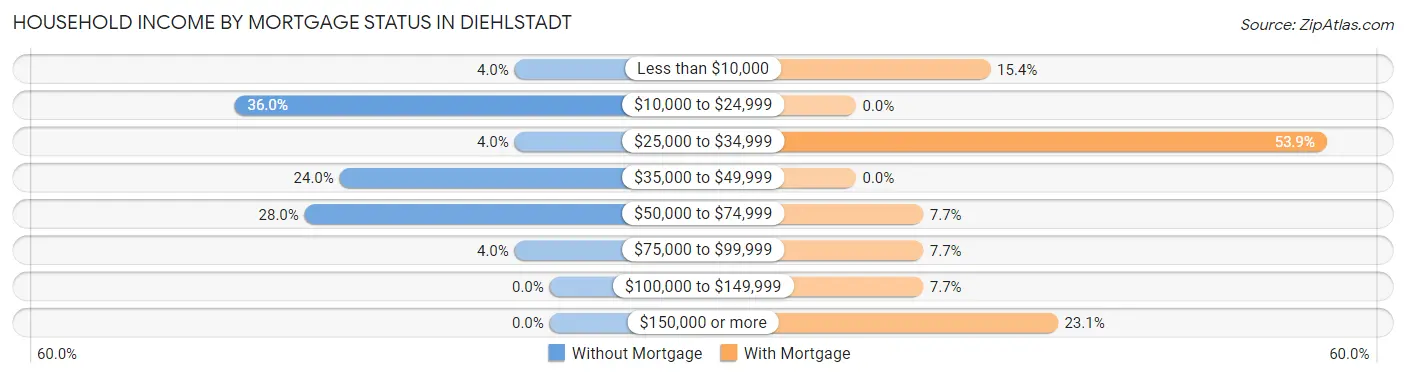
| Household Income | Without Mortgage | With Mortgage |
| Less than $10,000 | 1 (4.0%) | 2 (15.4%) |
| $10,000 to $24,999 | 9 (36.0%) | 0 (0.0%) |
| $25,000 to $34,999 | 1 (4.0%) | 7 (53.8%) |
| $35,000 to $49,999 | 6 (24.0%) | 0 (0.0%) |
| $50,000 to $74,999 | 7 (28.0%) | 1 (7.7%) |
| $75,000 to $99,999 | 1 (4.0%) | 1 (7.7%) |
| $100,000 to $149,999 | 0 (0.0%) | 1 (7.7%) |
| $150,000 or more | 0 (0.0%) | 3 (23.1%) |
| Total | 25 (100.0%) | 13 (100.0%) |
Property Value to Household Income Ratio in Diehlstadt
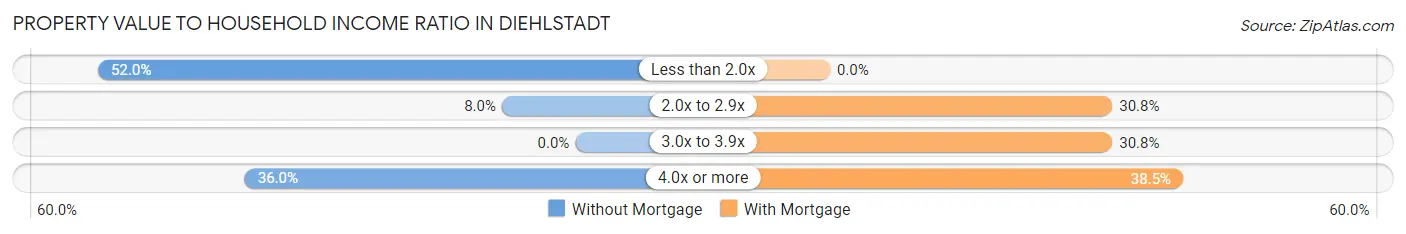
| Value-to-Income Ratio | Without Mortgage | With Mortgage |
| Less than 2.0x | 13 (52.0%) | 0 (0.0%) |
| 2.0x to 2.9x | 2 (8.0%) | 4 (30.8%) |
| 3.0x to 3.9x | 0 (0.0%) | 4 (30.8%) |
| 4.0x or more | 9 (36.0%) | 5 (38.5%) |
| Total | 25 (100.0%) | 13 (100.0%) |
Real Estate Taxes by Mortgage Status in Diehlstadt
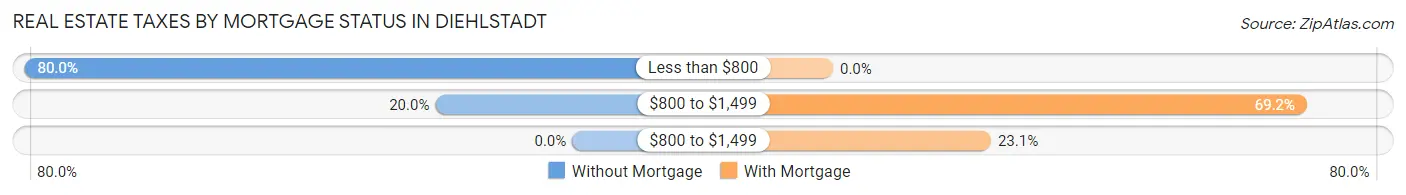
| Property Taxes | Without Mortgage | With Mortgage |
| Less than $800 | 20 (80.0%) | 0 (0.0%) |
| $800 to $1,499 | 5 (20.0%) | 9 (69.2%) |
| $800 to $1,499 | 0 (0.0%) | 3 (23.1%) |
| Total | 25 (100.0%) | 13 (100.0%) |
Health & Disability in Diehlstadt
Health Insurance Coverage by Age in Diehlstadt
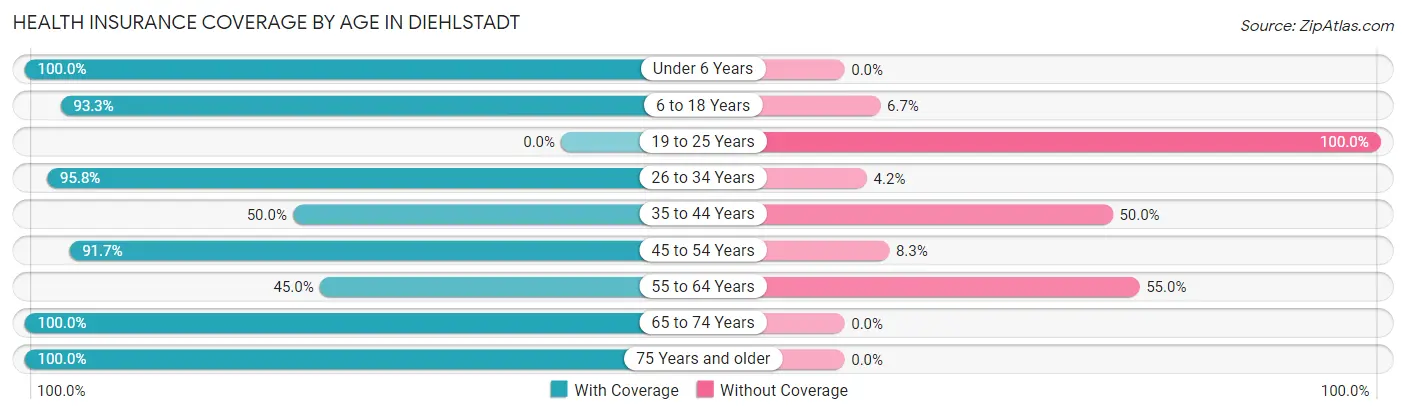
| Age Bracket | With Coverage | Without Coverage |
| Under 6 Years | 7 (100.0%) | 0 (0.0%) |
| 6 to 18 Years | 14 (93.3%) | 1 (6.7%) |
| 19 to 25 Years | 0 (0.0%) | 1 (100.0%) |
| 26 to 34 Years | 23 (95.8%) | 1 (4.2%) |
| 35 to 44 Years | 4 (50.0%) | 4 (50.0%) |
| 45 to 54 Years | 11 (91.7%) | 1 (8.3%) |
| 55 to 64 Years | 9 (45.0%) | 11 (55.0%) |
| 65 to 74 Years | 11 (100.0%) | 0 (0.0%) |
| 75 Years and older | 19 (100.0%) | 0 (0.0%) |
| Total | 98 (83.8%) | 19 (16.2%) |
Health Insurance Coverage by Citizenship Status in Diehlstadt
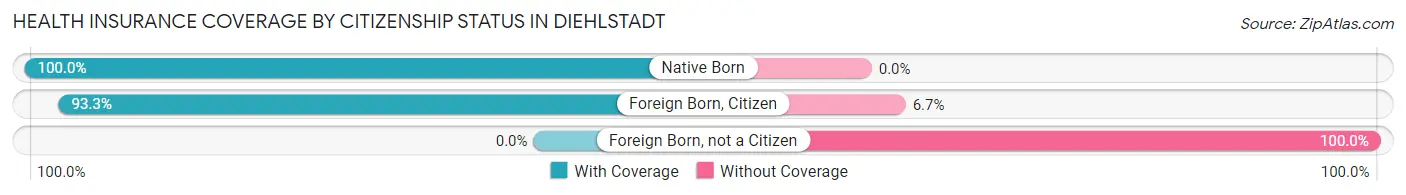
| Citizenship Status | With Coverage | Without Coverage |
| Native Born | 7 (100.0%) | 0 (0.0%) |
| Foreign Born, Citizen | 14 (93.3%) | 1 (6.7%) |
| Foreign Born, not a Citizen | 0 (0.0%) | 1 (100.0%) |
Health Insurance Coverage by Household Income in Diehlstadt
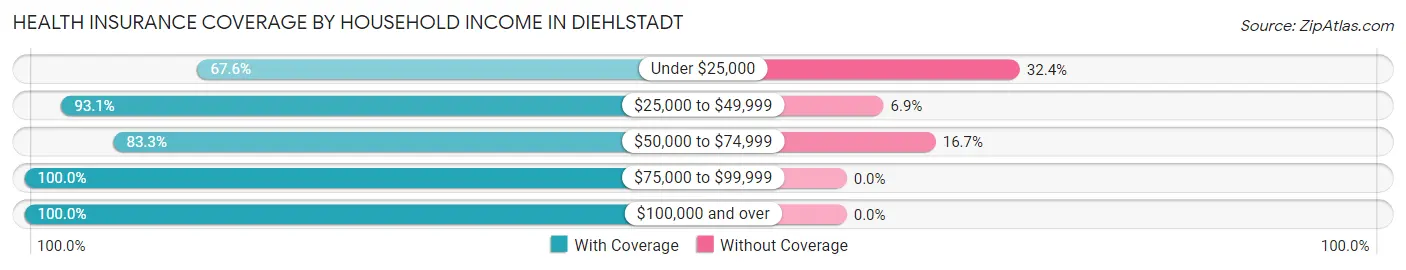
| Household Income | With Coverage | Without Coverage |
| Under $25,000 | 25 (67.6%) | 12 (32.4%) |
| $25,000 to $49,999 | 27 (93.1%) | 2 (6.9%) |
| $50,000 to $74,999 | 25 (83.3%) | 5 (16.7%) |
| $75,000 to $99,999 | 8 (100.0%) | 0 (0.0%) |
| $100,000 and over | 13 (100.0%) | 0 (0.0%) |
Public vs Private Health Insurance Coverage by Age in Diehlstadt
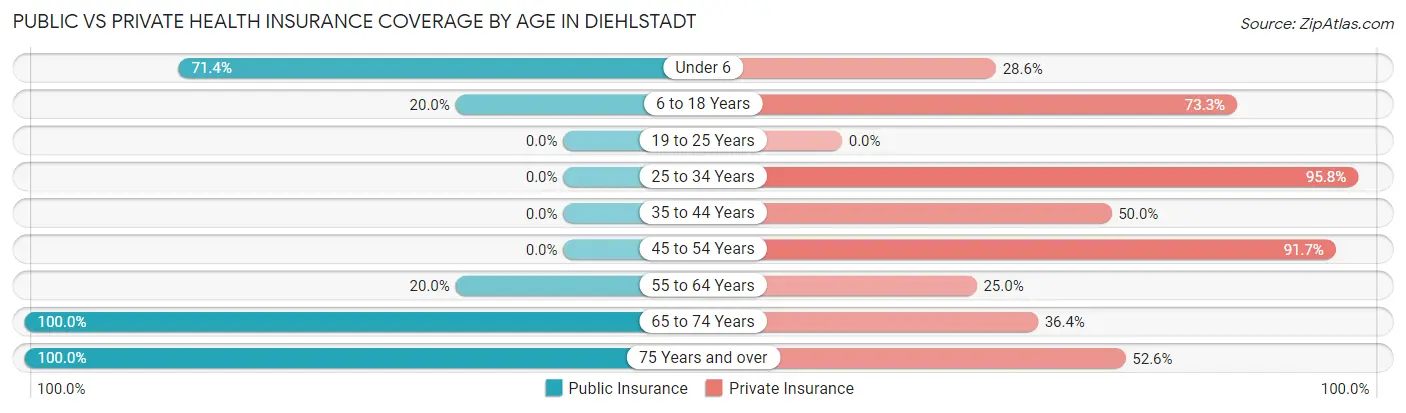
| Age Bracket | Public Insurance | Private Insurance |
| Under 6 | 5 (71.4%) | 2 (28.6%) |
| 6 to 18 Years | 3 (20.0%) | 11 (73.3%) |
| 19 to 25 Years | 0 (0.0%) | 0 (0.0%) |
| 25 to 34 Years | 0 (0.0%) | 23 (95.8%) |
| 35 to 44 Years | 0 (0.0%) | 4 (50.0%) |
| 45 to 54 Years | 0 (0.0%) | 11 (91.7%) |
| 55 to 64 Years | 4 (20.0%) | 5 (25.0%) |
| 65 to 74 Years | 11 (100.0%) | 4 (36.4%) |
| 75 Years and over | 19 (100.0%) | 10 (52.6%) |
| Total | 42 (35.9%) | 70 (59.8%) |
Disability Status by Sex by Age in Diehlstadt
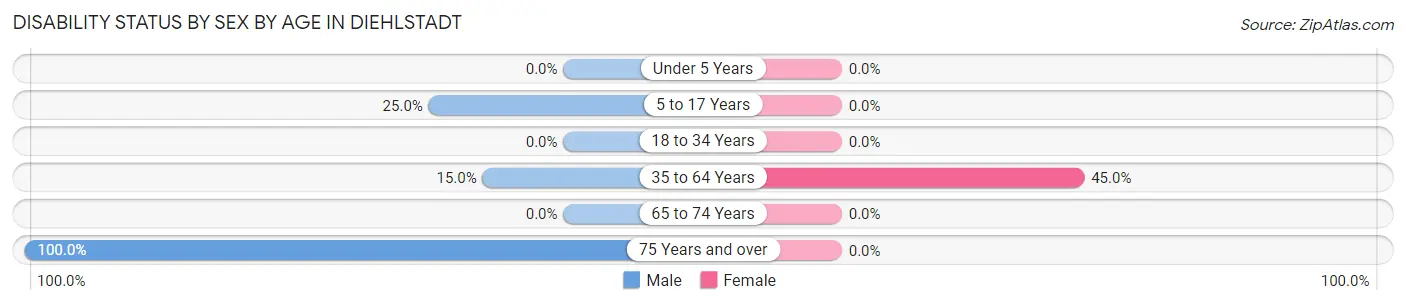
| Age Bracket | Male | Female |
| Under 5 Years | 0 (0.0%) | 0 (0.0%) |
| 5 to 17 Years | 2 (25.0%) | 0 (0.0%) |
| 18 to 34 Years | 0 (0.0%) | 0 (0.0%) |
| 35 to 64 Years | 3 (15.0%) | 9 (45.0%) |
| 65 to 74 Years | 0 (0.0%) | 0 (0.0%) |
| 75 Years and over | 17 (100.0%) | 0 (0.0%) |
Disability Class by Sex by Age in Diehlstadt
Disability Class: Hearing Difficulty
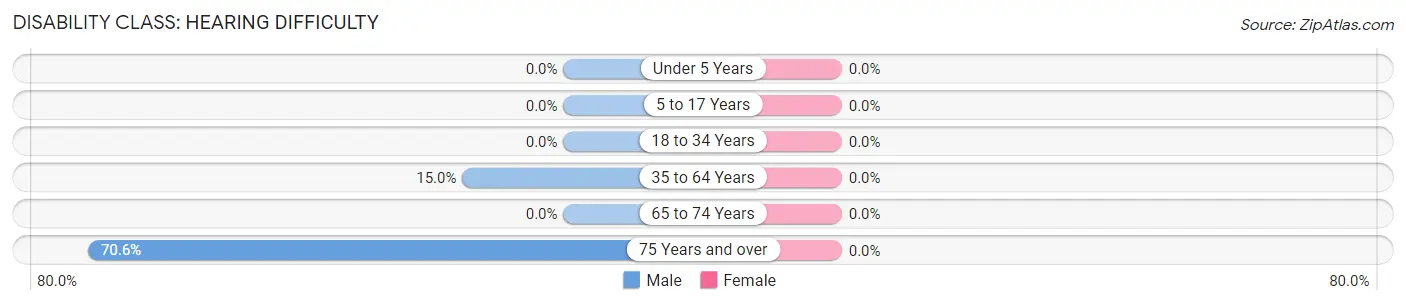
| Age Bracket | Male | Female |
| Under 5 Years | 0 (0.0%) | 0 (0.0%) |
| 5 to 17 Years | 0 (0.0%) | 0 (0.0%) |
| 18 to 34 Years | 0 (0.0%) | 0 (0.0%) |
| 35 to 64 Years | 3 (15.0%) | 0 (0.0%) |
| 65 to 74 Years | 0 (0.0%) | 0 (0.0%) |
| 75 Years and over | 12 (70.6%) | 0 (0.0%) |
Disability Class: Vision Difficulty
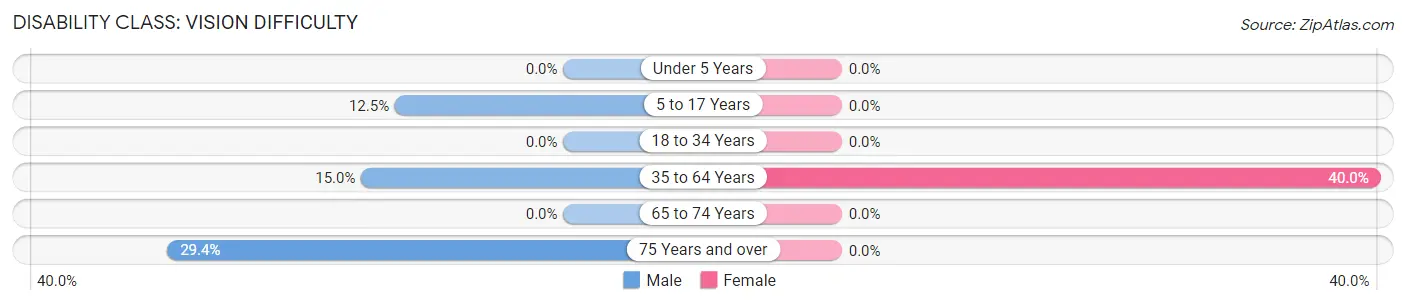
| Age Bracket | Male | Female |
| Under 5 Years | 0 (0.0%) | 0 (0.0%) |
| 5 to 17 Years | 1 (12.5%) | 0 (0.0%) |
| 18 to 34 Years | 0 (0.0%) | 0 (0.0%) |
| 35 to 64 Years | 3 (15.0%) | 8 (40.0%) |
| 65 to 74 Years | 0 (0.0%) | 0 (0.0%) |
| 75 Years and over | 5 (29.4%) | 0 (0.0%) |
Disability Class: Cognitive Difficulty
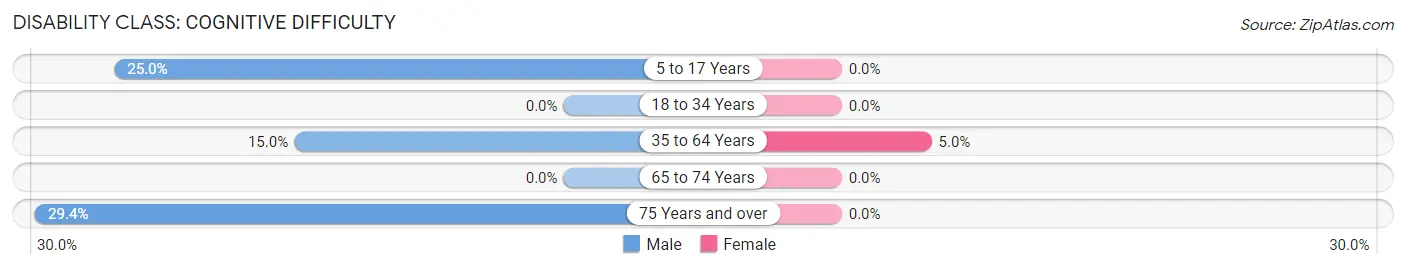
| Age Bracket | Male | Female |
| 5 to 17 Years | 2 (25.0%) | 0 (0.0%) |
| 18 to 34 Years | 0 (0.0%) | 0 (0.0%) |
| 35 to 64 Years | 3 (15.0%) | 1 (5.0%) |
| 65 to 74 Years | 0 (0.0%) | 0 (0.0%) |
| 75 Years and over | 5 (29.4%) | 0 (0.0%) |
Disability Class: Ambulatory Difficulty
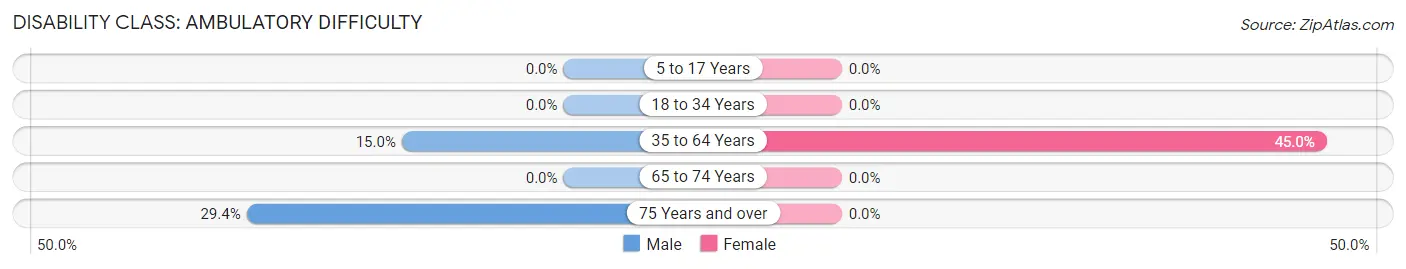
| Age Bracket | Male | Female |
| 5 to 17 Years | 0 (0.0%) | 0 (0.0%) |
| 18 to 34 Years | 0 (0.0%) | 0 (0.0%) |
| 35 to 64 Years | 3 (15.0%) | 9 (45.0%) |
| 65 to 74 Years | 0 (0.0%) | 0 (0.0%) |
| 75 Years and over | 5 (29.4%) | 0 (0.0%) |
Disability Class: Self-Care Difficulty
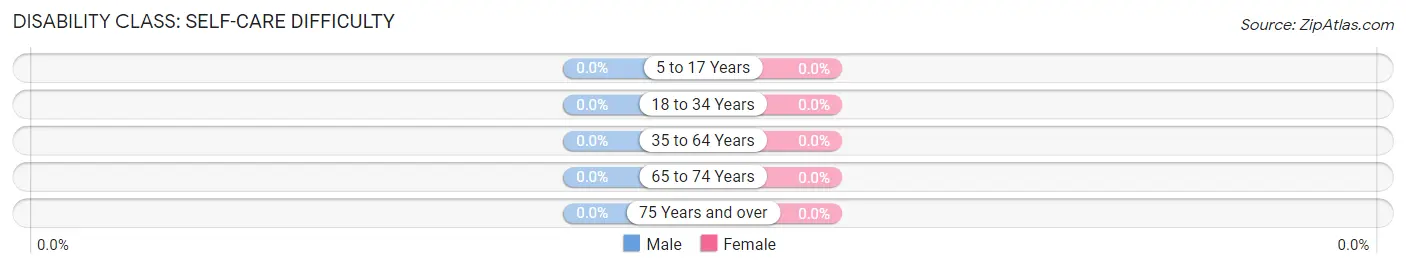
| Age Bracket | Male | Female |
| 5 to 17 Years | 0 (0.0%) | 0 (0.0%) |
| 18 to 34 Years | 0 (0.0%) | 0 (0.0%) |
| 35 to 64 Years | 0 (0.0%) | 0 (0.0%) |
| 65 to 74 Years | 0 (0.0%) | 0 (0.0%) |
| 75 Years and over | 0 (0.0%) | 0 (0.0%) |
Technology Access in Diehlstadt
Computing Device Access in Diehlstadt
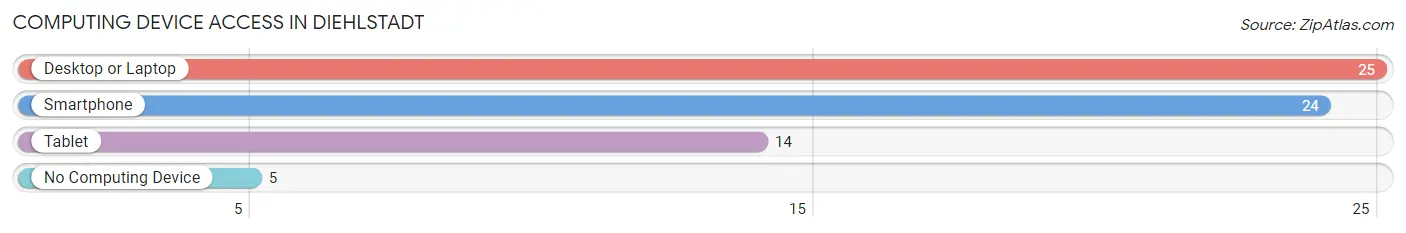
| Device Type | # Households | % Households |
| Desktop or Laptop | 25 | 62.5% |
| Smartphone | 24 | 60.0% |
| Tablet | 14 | 35.0% |
| No Computing Device | 5 | 12.5% |
| Total | 40 | 100.0% |
Internet Access in Diehlstadt
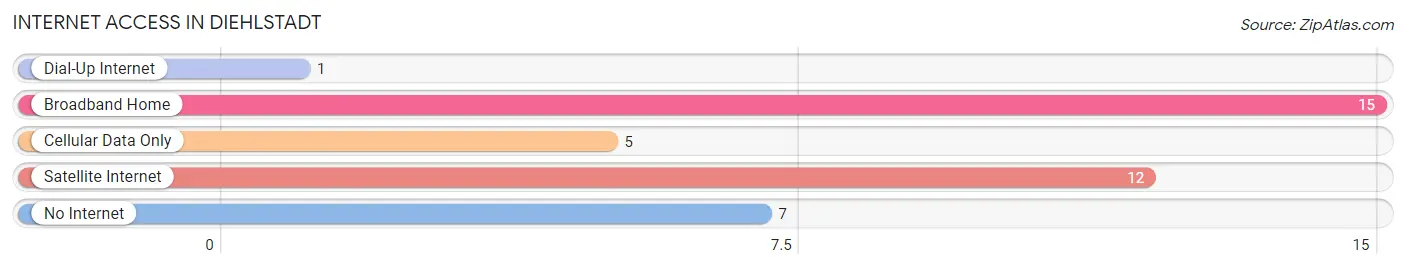
| Internet Type | # Households | % Households |
| Dial-Up Internet | 1 | 2.5% |
| Broadband Home | 15 | 37.5% |
| Cellular Data Only | 5 | 12.5% |
| Satellite Internet | 12 | 30.0% |
| No Internet | 7 | 17.5% |
| Total | 40 | 100.0% |
Diehlstadt Summary
History
Diehlstadt, Missouri is a small unincorporated community located in Scott County, Missouri. It is situated on the banks of the Mississippi River, just south of the city of Sikeston. The town was founded in 1837 by German immigrant, John Diehl, who had come to the area in search of a better life. The town was originally known as Diehl's Landing, but was later changed to Diehlstadt.
The town was a thriving river port in the mid-1800s, with steamboats regularly stopping at the landing to pick up and drop off passengers and goods. The town was also home to a number of businesses, including a general store, a blacksmith shop, a hotel, and a saloon.
In the late 1800s, the town began to decline as the river traffic shifted to other ports. The town was further impacted by the Great Depression, and by the 1940s, the population had dwindled to just a few hundred people.
Geography
Diehlstadt is located in southeastern Missouri, in Scott County. It is situated on the banks of the Mississippi River, just south of the city of Sikeston. The town is located in the Bootheel region of the state, which is known for its flat terrain and fertile soil.
The town is surrounded by agricultural land, with corn and soybeans being the primary crops. The town is also home to a number of small businesses, including a gas station, a convenience store, and a few restaurants.
Economy
The economy of Diehlstadt is largely based on agriculture. The town is surrounded by agricultural land, with corn and soybeans being the primary crops. The town is also home to a number of small businesses, including a gas station, a convenience store, and a few restaurants.
The town is also home to a number of manufacturing businesses, including a furniture factory and a plastics factory. The town is also home to a number of trucking companies, which provide transportation services to the surrounding area.
Demographics
As of the 2010 census, the population of Diehlstadt was 545. The racial makeup of the town was 97.3% White, 0.7% African American, 0.2% Native American, 0.2% Asian, and 1.6% from other races. The median household income was $31,250, and the median family income was $37,500.
The town is served by the Scott County School District, which includes two elementary schools, one middle school, and one high school. The town is also home to a number of churches, including the First Baptist Church, the First United Methodist Church, and the Church of Christ.
Common Questions
What is Per Capita Income in Diehlstadt?
Per Capita income in Diehlstadt is $16,952.
What is the Median Family Income in Diehlstadt?
Median Family Income in Diehlstadt is $49,063.
What is the Median Household income in Diehlstadt?
Median Household Income in Diehlstadt is $40,000.
What is Income or Wage Gap in Diehlstadt?
Income or Wage Gap in Diehlstadt is 43.8%.
Women in Diehlstadt earn 56.2 cents for every dollar earned by a man.
What is Inequality or Gini Index in Diehlstadt?
Inequality or Gini Index in Diehlstadt is 0.38.
What is the Total Population of Diehlstadt?
Total Population of Diehlstadt is 117.
What is the Total Male Population of Diehlstadt?
Total Male Population of Diehlstadt is 62.
What is the Total Female Population of Diehlstadt?
Total Female Population of Diehlstadt is 55.
What is the Ratio of Males per 100 Females in Diehlstadt?
There are 112.73 Males per 100 Females in Diehlstadt.
What is the Ratio of Females per 100 Males in Diehlstadt?
There are 88.71 Females per 100 Males in Diehlstadt.
What is the Median Population Age in Diehlstadt?
Median Population Age in Diehlstadt is 53.3 Years.
What is the Average Family Size in Diehlstadt
Average Family Size in Diehlstadt is 3.4 People.
What is the Average Household Size in Diehlstadt
Average Household Size in Diehlstadt is 2.9 People.
How Large is the Labor Force in Diehlstadt?
There are 48 People in the Labor Forcein in Diehlstadt.
What is the Percentage of People in the Labor Force in Diehlstadt?
49.0% of People are in the Labor Force in Diehlstadt.
What is the Unemployment Rate in Diehlstadt?
Unemployment Rate in Diehlstadt is 4.2%.