Dexter, MO Map & Demographics
Dexter Map
Dexter Overview
$23,638
PER CAPITA INCOME
$65,428
AVG FAMILY INCOME
$45,617
AVG HOUSEHOLD INCOME
40.0%
WAGE / INCOME GAP [ % ]
60.0¢/ $1
WAGE / INCOME GAP [ $ ]
0.41
INEQUALITY / GINI INDEX
7,910
TOTAL POPULATION
3,578
MALE POPULATION
4,332
FEMALE POPULATION
82.59
MALES / 100 FEMALES
121.07
FEMALES / 100 MALES
38.8
MEDIAN AGE
3.2
AVG FAMILY SIZE
2.3
AVG HOUSEHOLD SIZE
3,153
LABOR FORCE [ PEOPLE ]
51.2%
PERCENT IN LABOR FORCE
0.9%
UNEMPLOYMENT RATE
Dexter Zip Codes
Dexter Area Codes
Income in Dexter
Income Overview in Dexter
Per Capita Income in Dexter is $23,638, while median incomes of families and households are $65,428 and $45,617 respectively.
| Characteristic | Number | Measure |
| Per Capita Income | 7,910 | $23,638 |
| Median Family Income | 1,805 | $65,428 |
| Mean Family Income | 1,805 | $71,573 |
| Median Household Income | 3,290 | $45,617 |
| Mean Household Income | 3,290 | $55,308 |
| Income Deficit | 1,805 | $0 |
| Wage / Income Gap (%) | 7,910 | 40.03% |
| Wage / Income Gap ($) | 7,910 | 59.97¢ per $1 |
| Gini / Inequality Index | 7,910 | 0.41 |
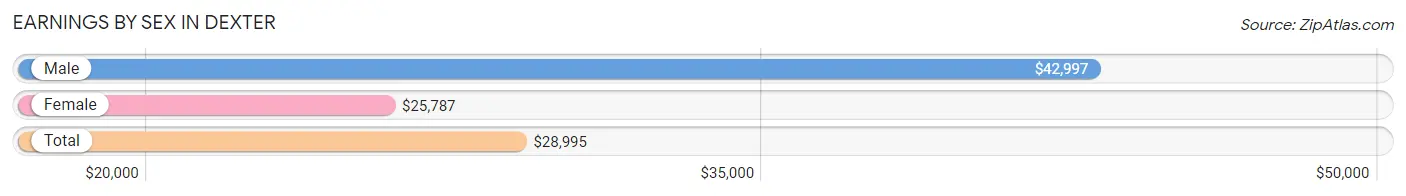
Earnings by Sex in Dexter
Average Earnings in Dexter are $28,995, $42,997 for men and $25,787 for women, a difference of 40.0%.
| Sex | Number | Average Earnings |
| Male | 1,611 (47.4%) | $42,997 |
| Female | 1,787 (52.6%) | $25,787 |
| Total | 3,398 (100.0%) | $28,995 |
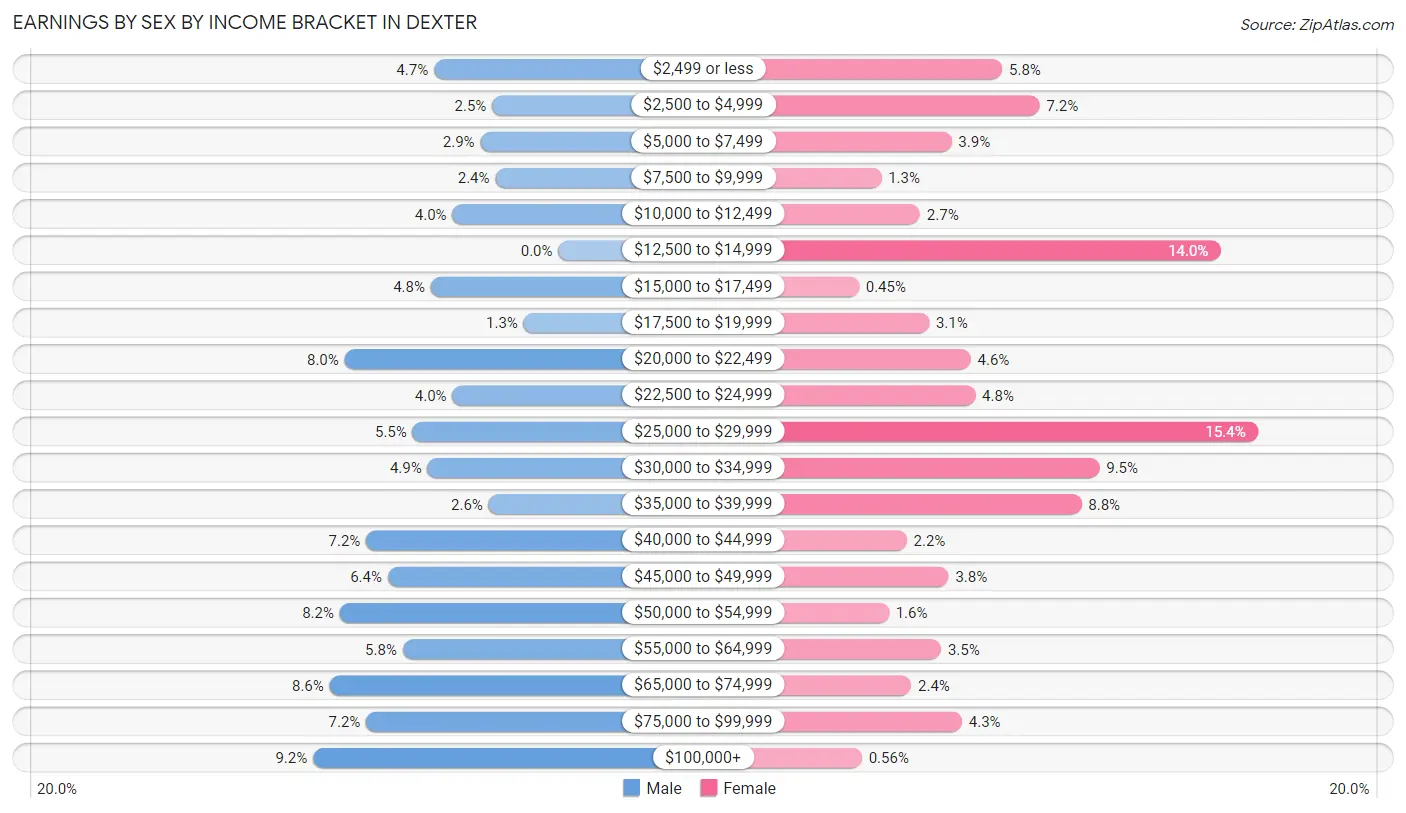
Earnings by Sex by Income Bracket in Dexter
The most common earnings brackets in Dexter are $100,000+ for men (148 | 9.2%) and $25,000 to $29,999 for women (275 | 15.4%).
| Income | Male | Female |
| $2,499 or less | 75 (4.7%) | 104 (5.8%) |
| $2,500 to $4,999 | 40 (2.5%) | 129 (7.2%) |
| $5,000 to $7,499 | 47 (2.9%) | 70 (3.9%) |
| $7,500 to $9,999 | 38 (2.4%) | 23 (1.3%) |
| $10,000 to $12,499 | 64 (4.0%) | 49 (2.7%) |
| $12,500 to $14,999 | 0 (0.0%) | 250 (14.0%) |
| $15,000 to $17,499 | 77 (4.8%) | 8 (0.4%) |
| $17,500 to $19,999 | 21 (1.3%) | 55 (3.1%) |
| $20,000 to $22,499 | 129 (8.0%) | 83 (4.6%) |
| $22,500 to $24,999 | 64 (4.0%) | 86 (4.8%) |
| $25,000 to $29,999 | 88 (5.5%) | 275 (15.4%) |
| $30,000 to $34,999 | 79 (4.9%) | 169 (9.5%) |
| $35,000 to $39,999 | 42 (2.6%) | 157 (8.8%) |
| $40,000 to $44,999 | 116 (7.2%) | 40 (2.2%) |
| $45,000 to $49,999 | 103 (6.4%) | 68 (3.8%) |
| $50,000 to $54,999 | 132 (8.2%) | 28 (1.6%) |
| $55,000 to $64,999 | 94 (5.8%) | 63 (3.5%) |
| $65,000 to $74,999 | 138 (8.6%) | 43 (2.4%) |
| $75,000 to $99,999 | 116 (7.2%) | 77 (4.3%) |
| $100,000+ | 148 (9.2%) | 10 (0.6%) |
| Total | 1,611 (100.0%) | 1,787 (100.0%) |
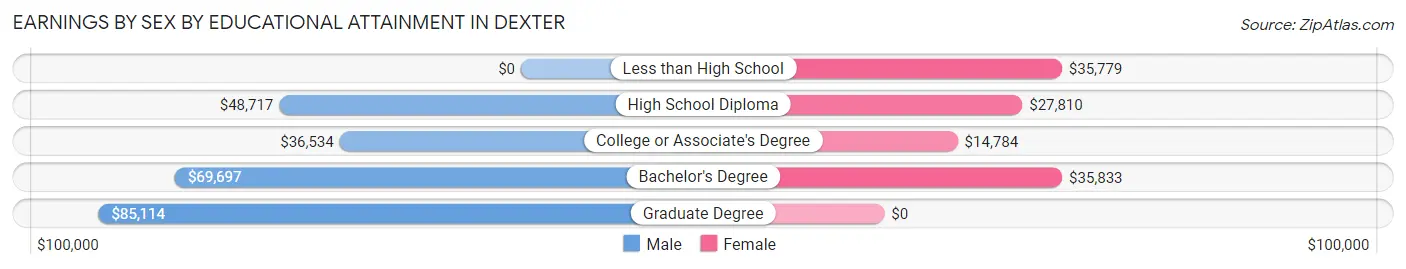
Earnings by Sex by Educational Attainment in Dexter
Average earnings in Dexter are $49,375 for men and $26,792 for women, a difference of 45.7%. Men with an educational attainment of graduate degree enjoy the highest average annual earnings of $85,114, while those with college or associate's degree education earn the least with $36,534. Women with an educational attainment of bachelor's degree earn the most with the average annual earnings of $35,833, while those with college or associate's degree education have the smallest earnings of $14,784.
| Educational Attainment | Male Income | Female Income |
| Less than High School | - | - |
| High School Diploma | $48,717 | $27,810 |
| College or Associate's Degree | $36,534 | $14,784 |
| Bachelor's Degree | $69,697 | $35,833 |
| Graduate Degree | $85,114 | $0 |
| Total | $49,375 | $26,792 |
Family Income in Dexter
Family Income Brackets in Dexter
According to the Dexter family income data, there are 417 families falling into the $50,000 to $74,999 income range, which is the most common income bracket and makes up 23.1% of all families. Conversely, the $10,000 to $14,999 income bracket is the least frequent group with only 11 families (0.6%) belonging to this category.
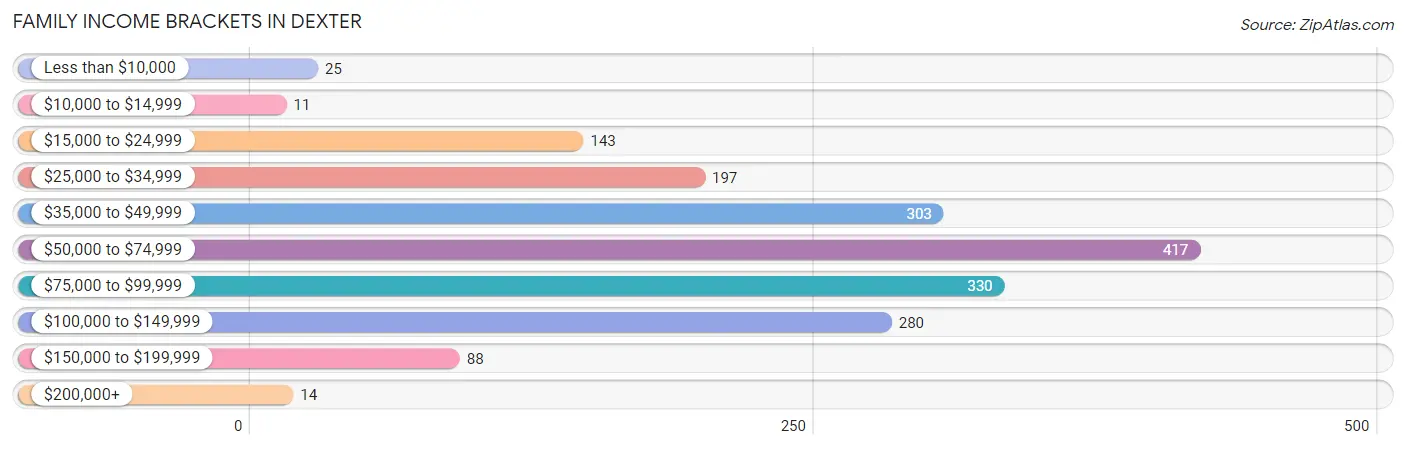
| Income Bracket | # Families | % Families |
| Less than $10,000 | 25 | 1.4% |
| $10,000 to $14,999 | 11 | 0.6% |
| $15,000 to $24,999 | 143 | 7.9% |
| $25,000 to $34,999 | 197 | 10.9% |
| $35,000 to $49,999 | 303 | 16.8% |
| $50,000 to $74,999 | 417 | 23.1% |
| $75,000 to $99,999 | 330 | 18.3% |
| $100,000 to $149,999 | 280 | 15.5% |
| $150,000 to $199,999 | 88 | 4.9% |
| $200,000+ | 14 | 0.8% |
Family Income by Famaliy Size in Dexter
4-person families (290 | 16.1%) account for the highest median family income in Dexter with $91,944 per family, while 2-person families (722 | 40.0%) have the highest median income of $31,634 per family member.
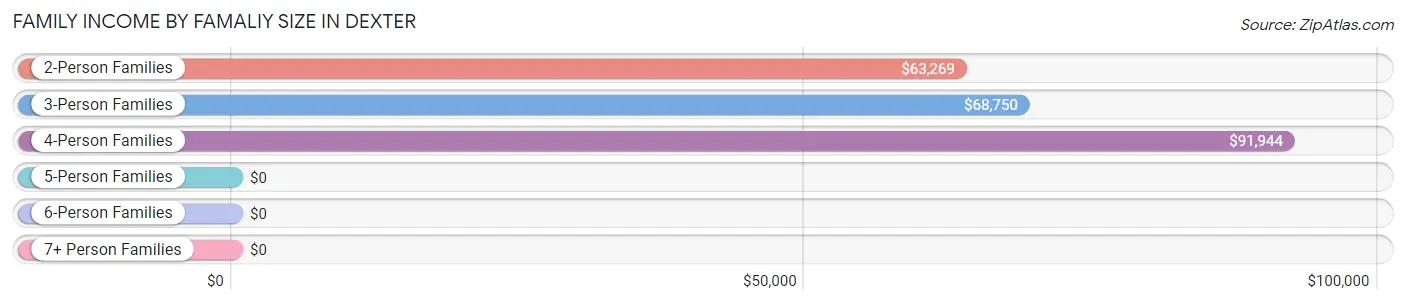
| Income Bracket | # Families | Median Income |
| 2-Person Families | 722 (40.0%) | $63,269 |
| 3-Person Families | 447 (24.8%) | $68,750 |
| 4-Person Families | 290 (16.1%) | $91,944 |
| 5-Person Families | 264 (14.6%) | $0 |
| 6-Person Families | 14 (0.8%) | $0 |
| 7+ Person Families | 68 (3.8%) | $0 |
| Total | 1,805 (100.0%) | $65,428 |
Family Income by Number of Earners in Dexter
The median family income in Dexter is $65,428, with families comprising 3+ earners (172) having the highest median family income of $109,462, while families with 1 earner (788) have the lowest median family income of $46,224, accounting for 9.5% and 43.7% of families, respectively.
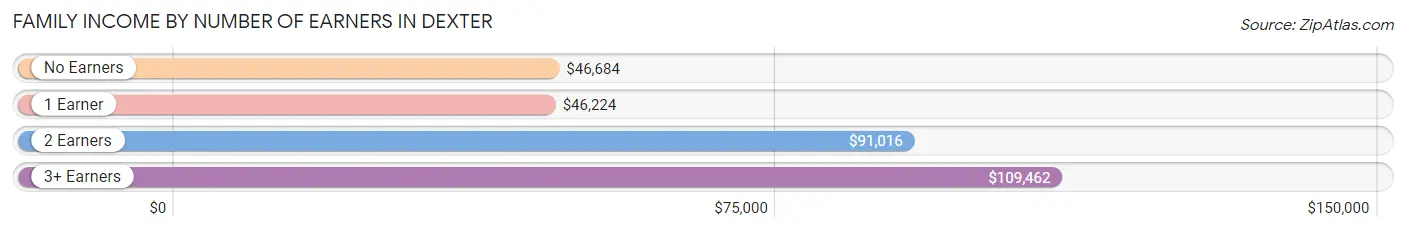
| Number of Earners | # Families | Median Income |
| No Earners | 262 (14.5%) | $46,684 |
| 1 Earner | 788 (43.7%) | $46,224 |
| 2 Earners | 583 (32.3%) | $91,016 |
| 3+ Earners | 172 (9.5%) | $109,462 |
| Total | 1,805 (100.0%) | $65,428 |
Household Income in Dexter
Household Income Brackets in Dexter
With 536 households falling in the category, the $35,000 to $49,999 income range is the most frequent in Dexter, accounting for 16.3% of all households. In contrast, only 13 households (0.4%) fall into the $200,000+ income bracket, making it the least populous group.
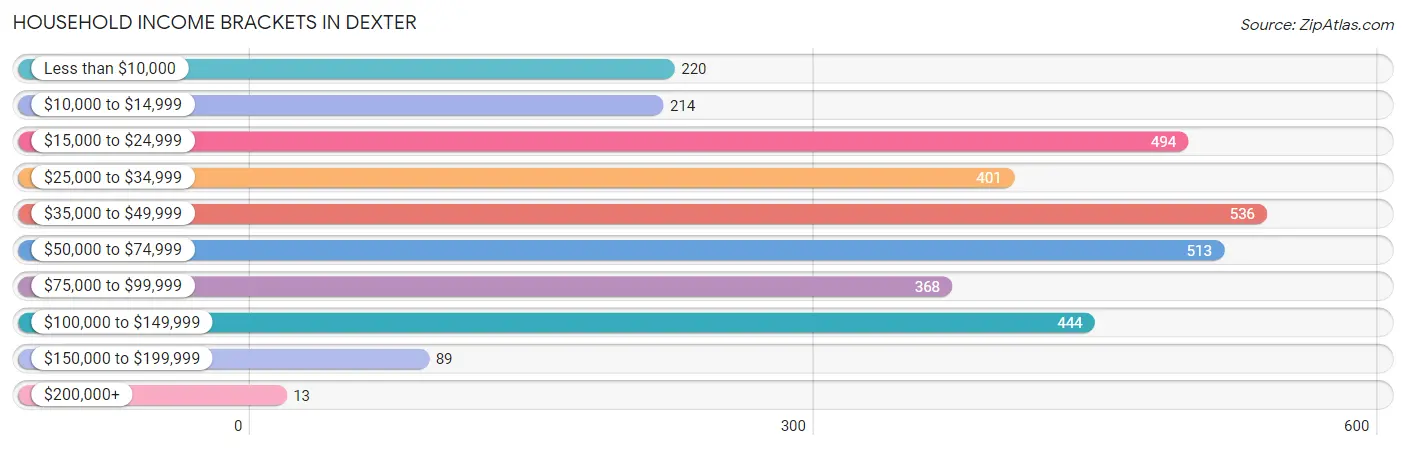
| Income Bracket | # Households | % Households |
| Less than $10,000 | 220 | 6.7% |
| $10,000 to $14,999 | 214 | 6.5% |
| $15,000 to $24,999 | 494 | 15.0% |
| $25,000 to $34,999 | 401 | 12.2% |
| $35,000 to $49,999 | 536 | 16.3% |
| $50,000 to $74,999 | 513 | 15.6% |
| $75,000 to $99,999 | 368 | 11.2% |
| $100,000 to $149,999 | 444 | 13.5% |
| $150,000 to $199,999 | 89 | 2.7% |
| $200,000+ | 13 | 0.4% |
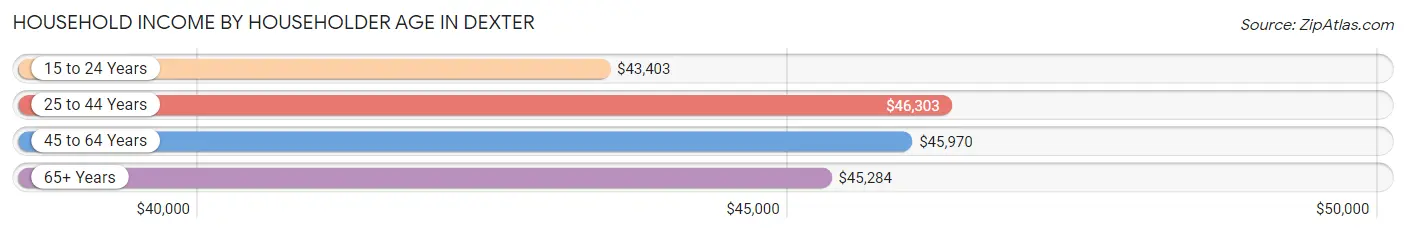
Household Income by Householder Age in Dexter
The median household income in Dexter is $45,617, with the highest median household income of $46,303 found in the 25 to 44 years age bracket for the primary householder. A total of 1,014 households (30.8%) fall into this category. Meanwhile, the 15 to 24 years age bracket for the primary householder has the lowest median household income of $43,403, with 201 households (6.1%) in this group.
| Income Bracket | # Households | Median Income |
| 15 to 24 Years | 201 (6.1%) | $43,403 |
| 25 to 44 Years | 1,014 (30.8%) | $46,303 |
| 45 to 64 Years | 1,083 (32.9%) | $45,970 |
| 65+ Years | 992 (30.1%) | $45,284 |
| Total | 3,290 (100.0%) | $45,617 |
Poverty in Dexter
Income Below Poverty by Sex and Age in Dexter
With 18.3% poverty level for males and 25.2% for females among the residents of Dexter, 6 to 11 year old males and 5 year old females are the most vulnerable to poverty, with 185 males (61.1%) and 66 females (100.0%) in their respective age groups living below the poverty level.
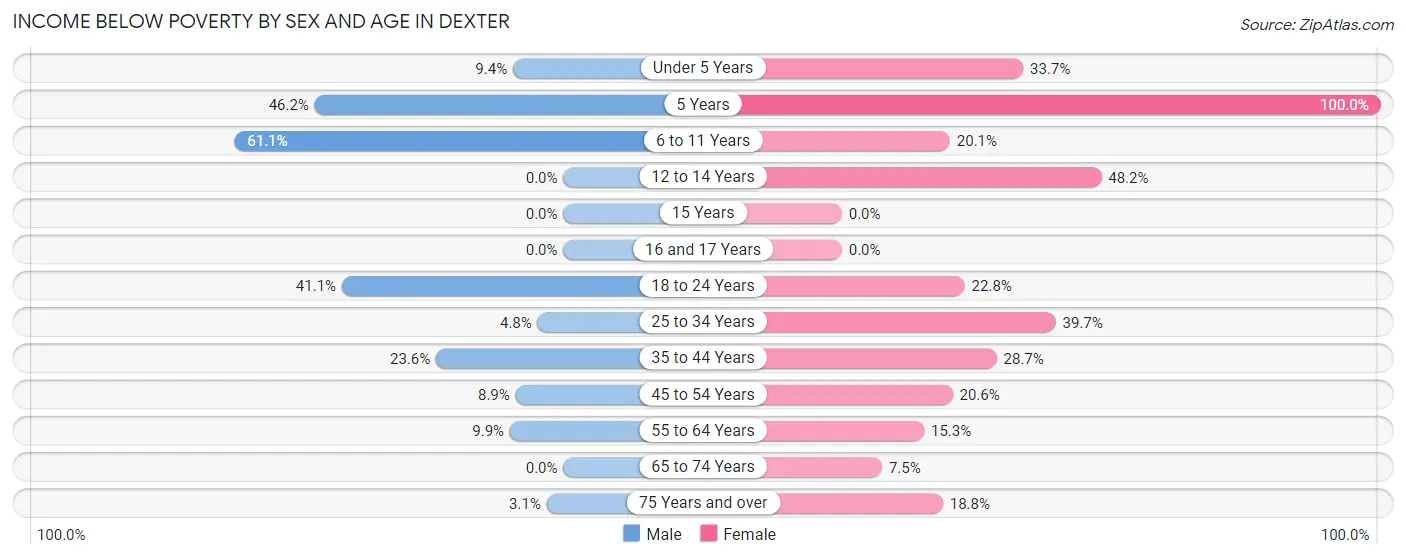
| Age Bracket | Male | Female |
| Under 5 Years | 23 (9.3%) | 107 (33.7%) |
| 5 Years | 36 (46.2%) | 66 (100.0%) |
| 6 to 11 Years | 185 (61.1%) | 67 (20.1%) |
| 12 to 14 Years | 0 (0.0%) | 92 (48.2%) |
| 15 Years | 0 (0.0%) | 0 (0.0%) |
| 16 and 17 Years | 0 (0.0%) | 0 (0.0%) |
| 18 to 24 Years | 187 (41.1%) | 88 (22.8%) |
| 25 to 34 Years | 12 (4.8%) | 179 (39.7%) |
| 35 to 44 Years | 107 (23.6%) | 196 (28.7%) |
| 45 to 54 Years | 32 (8.9%) | 59 (20.6%) |
| 55 to 64 Years | 44 (9.9%) | 85 (15.3%) |
| 65 to 74 Years | 0 (0.0%) | 24 (7.4%) |
| 75 Years and over | 11 (3.1%) | 96 (18.8%) |
| Total | 637 (18.3%) | 1,059 (25.2%) |
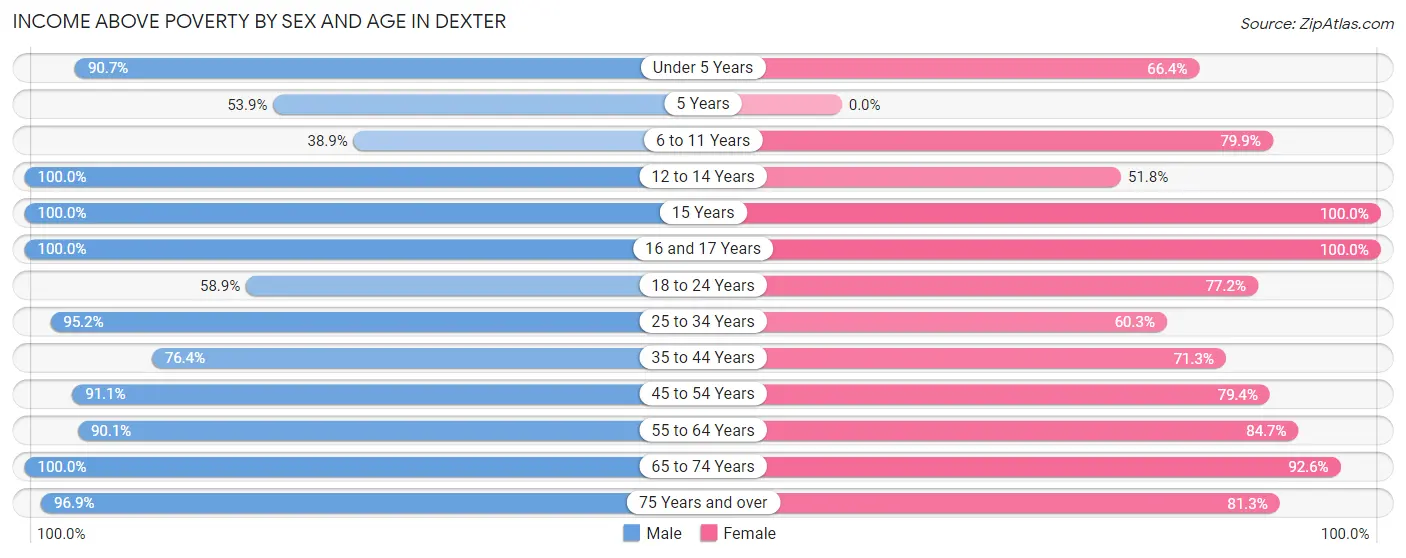
Income Above Poverty by Sex and Age in Dexter
According to the poverty statistics in Dexter, males aged 12 to 14 years and females aged 15 years are the age groups that are most secure financially, with 100.0% of males and 100.0% of females in these age groups living above the poverty line.
| Age Bracket | Male | Female |
| Under 5 Years | 223 (90.6%) | 211 (66.3%) |
| 5 Years | 42 (53.8%) | 0 (0.0%) |
| 6 to 11 Years | 118 (38.9%) | 267 (79.9%) |
| 12 to 14 Years | 99 (100.0%) | 99 (51.8%) |
| 15 Years | 55 (100.0%) | 19 (100.0%) |
| 16 and 17 Years | 99 (100.0%) | 71 (100.0%) |
| 18 to 24 Years | 268 (58.9%) | 298 (77.2%) |
| 25 to 34 Years | 239 (95.2%) | 272 (60.3%) |
| 35 to 44 Years | 346 (76.4%) | 486 (71.3%) |
| 45 to 54 Years | 329 (91.1%) | 228 (79.4%) |
| 55 to 64 Years | 400 (90.1%) | 472 (84.7%) |
| 65 to 74 Years | 280 (100.0%) | 298 (92.5%) |
| 75 Years and over | 346 (96.9%) | 416 (81.2%) |
| Total | 2,844 (81.7%) | 3,137 (74.8%) |
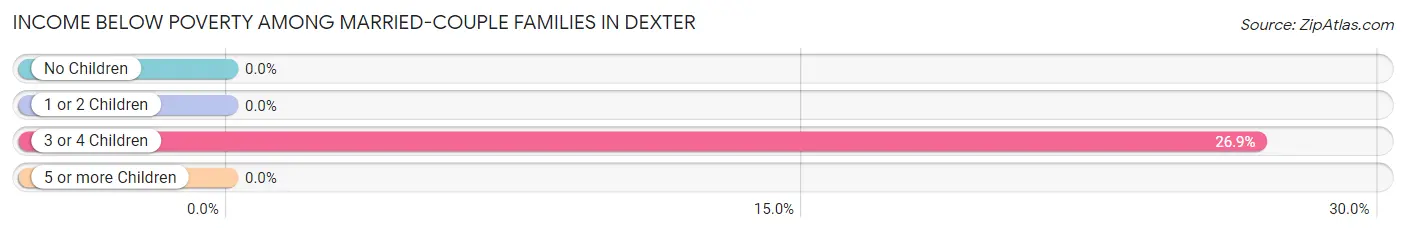
Income Below Poverty Among Married-Couple Families in Dexter
The poverty statistics for married-couple families in Dexter show that 4.2% or 50 of the total 1,189 families live below the poverty line. Families with 3 or 4 children have the highest poverty rate of 26.9%, comprising of 50 families. On the other hand, families with no children have the lowest poverty rate of 0.0%, which includes 0 families.
| Children | Above Poverty | Below Poverty |
| No Children | 596 (100.0%) | 0 (0.0%) |
| 1 or 2 Children | 362 (100.0%) | 0 (0.0%) |
| 3 or 4 Children | 136 (73.1%) | 50 (26.9%) |
| 5 or more Children | 45 (100.0%) | 0 (0.0%) |
| Total | 1,139 (95.8%) | 50 (4.2%) |
Income Below Poverty Among Single-Parent Households in Dexter
According to the poverty data in Dexter, 33.1% or 56 single-father households and 23.3% or 104 single-mother households are living below the poverty line. Among single-father households, those with 3 or 4 children have the highest poverty rate, with 56 households (100.0%) experiencing poverty. Likewise, among single-mother households, those with 3 or 4 children have the highest poverty rate, with 36 households (40.0%) falling below the poverty line.
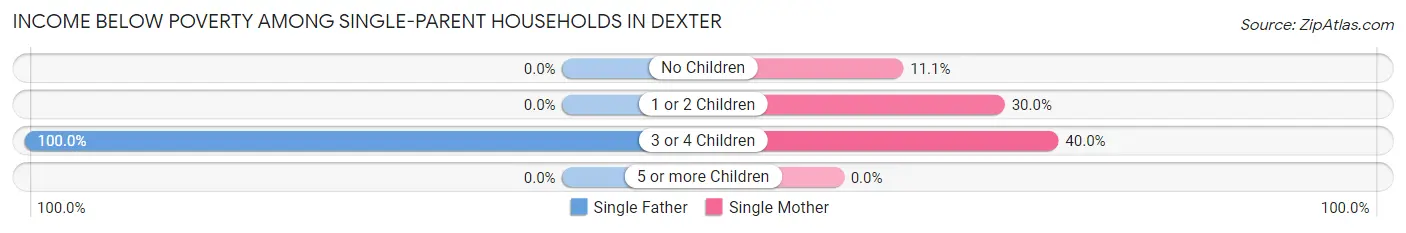
| Children | Single Father | Single Mother |
| No Children | 0 (0.0%) | 23 (11.1%) |
| 1 or 2 Children | 0 (0.0%) | 45 (30.0%) |
| 3 or 4 Children | 56 (100.0%) | 36 (40.0%) |
| 5 or more Children | 0 (0.0%) | 0 (0.0%) |
| Total | 56 (33.1%) | 104 (23.3%) |
Income Below Poverty Among Married-Couple vs Single-Parent Households in Dexter
The poverty data for Dexter shows that 50 of the married-couple family households (4.2%) and 160 of the single-parent households (26.0%) are living below the poverty level. Within the married-couple family households, those with 3 or 4 children have the highest poverty rate, with 50 households (26.9%) falling below the poverty line. Among the single-parent households, those with 3 or 4 children have the highest poverty rate, with 92 household (63.0%) living below poverty.
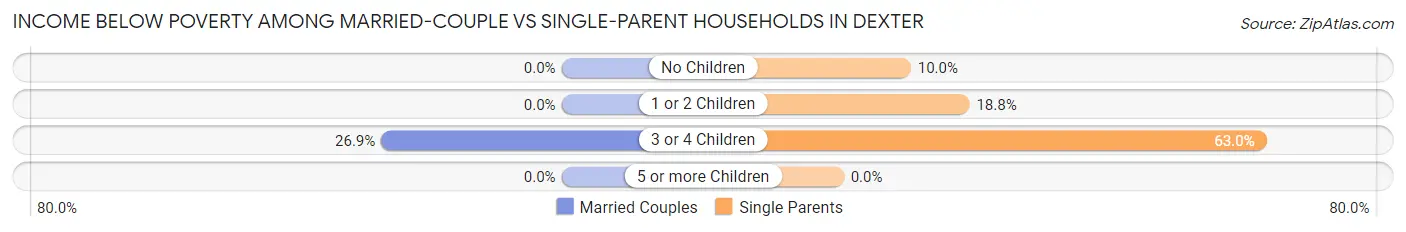
| Children | Married-Couple Families | Single-Parent Households |
| No Children | 0 (0.0%) | 23 (10.0%) |
| 1 or 2 Children | 0 (0.0%) | 45 (18.8%) |
| 3 or 4 Children | 50 (26.9%) | 92 (63.0%) |
| 5 or more Children | 0 (0.0%) | 0 (0.0%) |
| Total | 50 (4.2%) | 160 (26.0%) |
Race in Dexter
The most populous races in Dexter are White / Caucasian (7,546 | 95.4%), Hispanic or Latino (220 | 2.8%), and Two or more Races (185 | 2.3%).
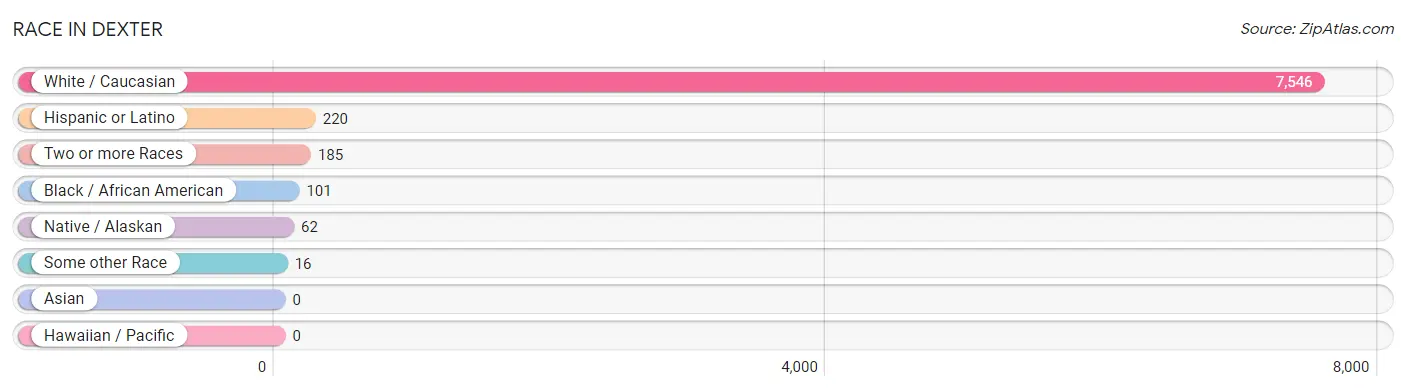
| Race | # Population | % Population |
| Asian | 0 | 0.0% |
| Black / African American | 101 | 1.3% |
| Hawaiian / Pacific | 0 | 0.0% |
| Hispanic or Latino | 220 | 2.8% |
| Native / Alaskan | 62 | 0.8% |
| White / Caucasian | 7,546 | 95.4% |
| Two or more Races | 185 | 2.3% |
| Some other Race | 16 | 0.2% |
| Total | 7,910 | 100.0% |
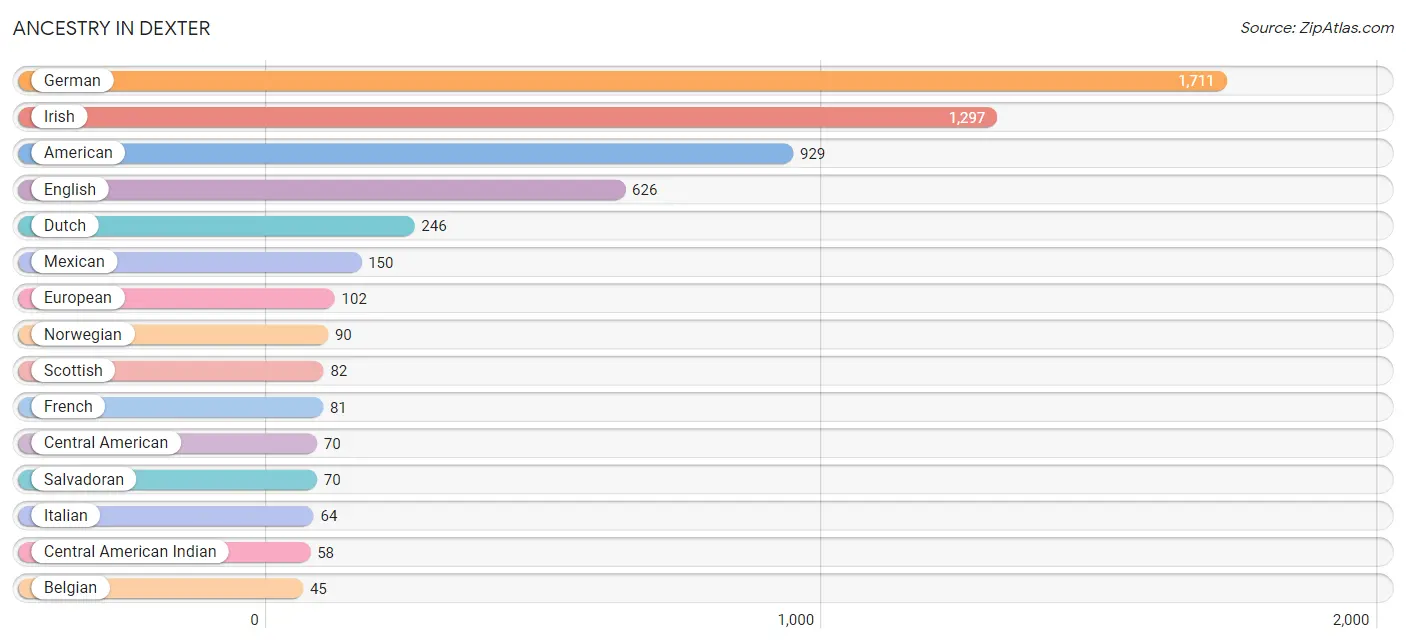
Ancestry in Dexter
The most populous ancestries reported in Dexter are German (1,711 | 21.6%), Irish (1,297 | 16.4%), American (929 | 11.7%), English (626 | 7.9%), and Dutch (246 | 3.1%), together accounting for 60.8% of all Dexter residents.
| Ancestry | # Population | % Population |
| American | 929 | 11.7% |
| Belgian | 45 | 0.6% |
| British | 18 | 0.2% |
| Central American | 70 | 0.9% |
| Central American Indian | 58 | 0.7% |
| Cherokee | 45 | 0.6% |
| Dutch | 246 | 3.1% |
| English | 626 | 7.9% |
| European | 102 | 1.3% |
| Finnish | 26 | 0.3% |
| French | 81 | 1.0% |
| German | 1,711 | 21.6% |
| Greek | 21 | 0.3% |
| Irish | 1,297 | 16.4% |
| Italian | 64 | 0.8% |
| Mexican | 150 | 1.9% |
| Norwegian | 90 | 1.1% |
| Polish | 31 | 0.4% |
| Portuguese | 10 | 0.1% |
| Salvadoran | 70 | 0.9% |
| Scotch-Irish | 14 | 0.2% |
| Scottish | 82 | 1.0% |
| Swedish | 36 | 0.5% |
| Welsh | 18 | 0.2% | View All 24 Rows |
Immigrants in Dexter

| Immigration Origin | # Population | % Population | View All 0 Rows |
Sex and Age in Dexter
Sex and Age in Dexter
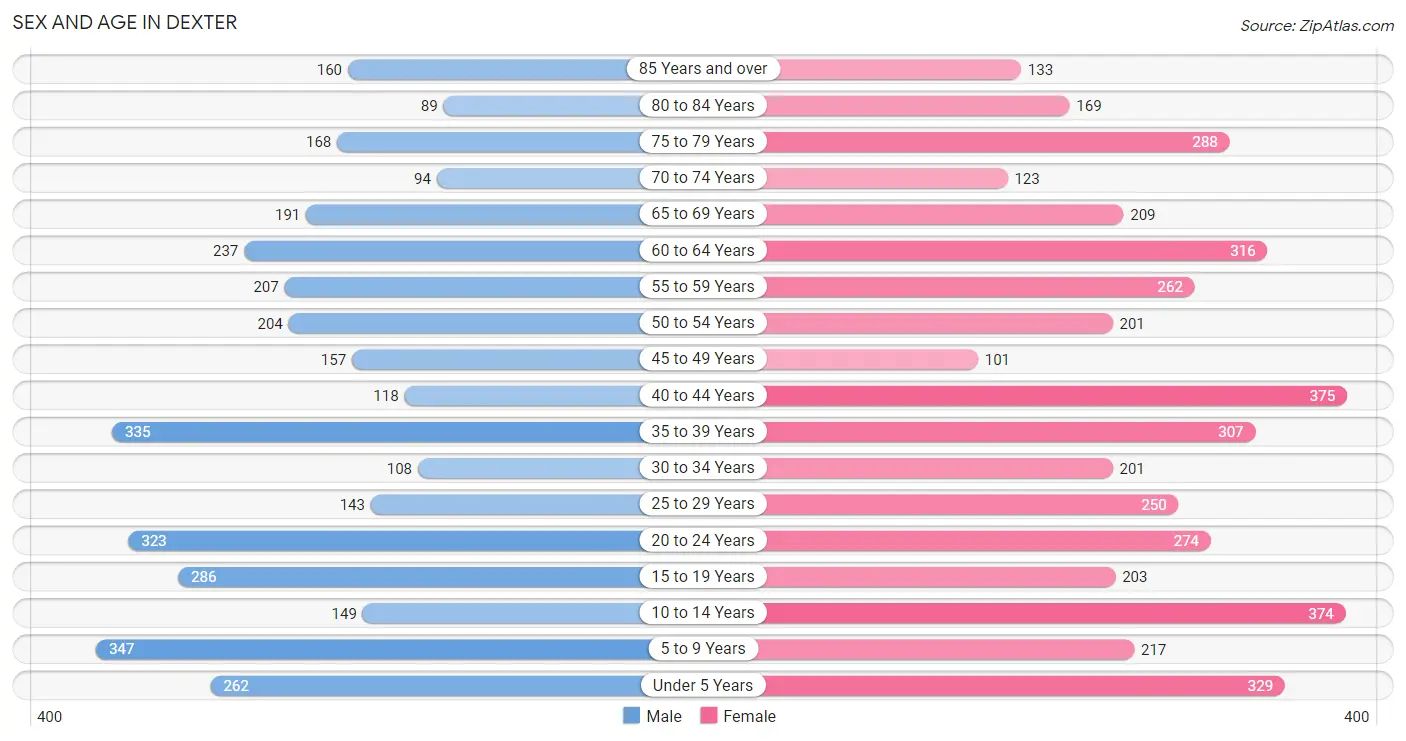
The most populous age groups in Dexter are 5 to 9 Years (347 | 9.7%) for men and 40 to 44 Years (375 | 8.7%) for women.
| Age Bracket | Male | Female |
| Under 5 Years | 262 (7.3%) | 329 (7.6%) |
| 5 to 9 Years | 347 (9.7%) | 217 (5.0%) |
| 10 to 14 Years | 149 (4.2%) | 374 (8.6%) |
| 15 to 19 Years | 286 (8.0%) | 203 (4.7%) |
| 20 to 24 Years | 323 (9.0%) | 274 (6.3%) |
| 25 to 29 Years | 143 (4.0%) | 250 (5.8%) |
| 30 to 34 Years | 108 (3.0%) | 201 (4.6%) |
| 35 to 39 Years | 335 (9.4%) | 307 (7.1%) |
| 40 to 44 Years | 118 (3.3%) | 375 (8.7%) |
| 45 to 49 Years | 157 (4.4%) | 101 (2.3%) |
| 50 to 54 Years | 204 (5.7%) | 201 (4.6%) |
| 55 to 59 Years | 207 (5.8%) | 262 (6.0%) |
| 60 to 64 Years | 237 (6.6%) | 316 (7.3%) |
| 65 to 69 Years | 191 (5.3%) | 209 (4.8%) |
| 70 to 74 Years | 94 (2.6%) | 123 (2.8%) |
| 75 to 79 Years | 168 (4.7%) | 288 (6.7%) |
| 80 to 84 Years | 89 (2.5%) | 169 (3.9%) |
| 85 Years and over | 160 (4.5%) | 133 (3.1%) |
| Total | 3,578 (100.0%) | 4,332 (100.0%) |
Families and Households in Dexter
Median Family Size in Dexter
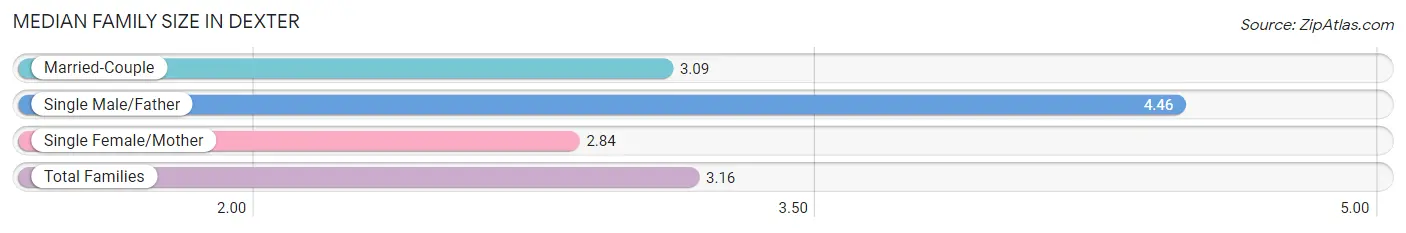
The median family size in Dexter is 3.16 persons per family, with single male/father families (169 | 9.4%) accounting for the largest median family size of 4.46 persons per family. On the other hand, single female/mother families (447 | 24.8%) represent the smallest median family size with 2.84 persons per family.
| Family Type | # Families | Family Size |
| Married-Couple | 1,189 (65.9%) | 3.09 |
| Single Male/Father | 169 (9.4%) | 4.46 |
| Single Female/Mother | 447 (24.8%) | 2.84 |
| Total Families | 1,805 (100.0%) | 3.16 |
Median Household Size in Dexter
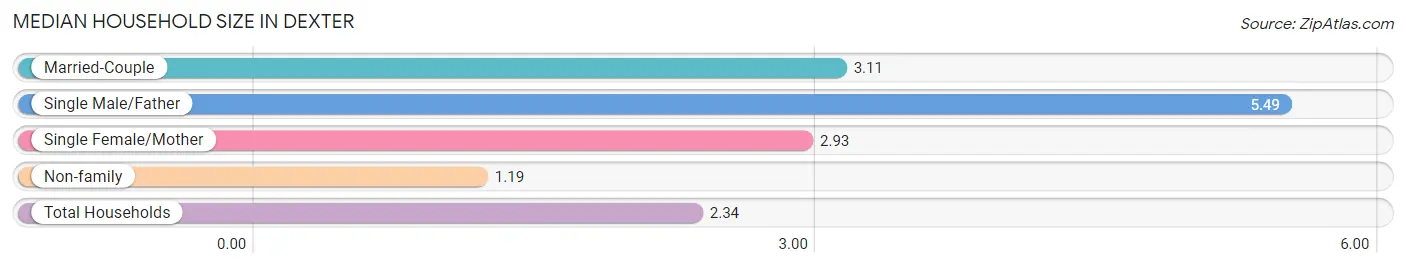
The median household size in Dexter is 2.34 persons per household, with single male/father households (169 | 5.1%) accounting for the largest median household size of 5.49 persons per household. non-family households (1,485 | 45.1%) represent the smallest median household size with 1.19 persons per household.
| Household Type | # Households | Household Size |
| Married-Couple | 1,189 (36.1%) | 3.11 |
| Single Male/Father | 169 (5.1%) | 5.49 |
| Single Female/Mother | 447 (13.6%) | 2.93 |
| Non-family | 1,485 (45.1%) | 1.19 |
| Total Households | 3,290 (100.0%) | 2.34 |
Household Size by Marriage Status in Dexter
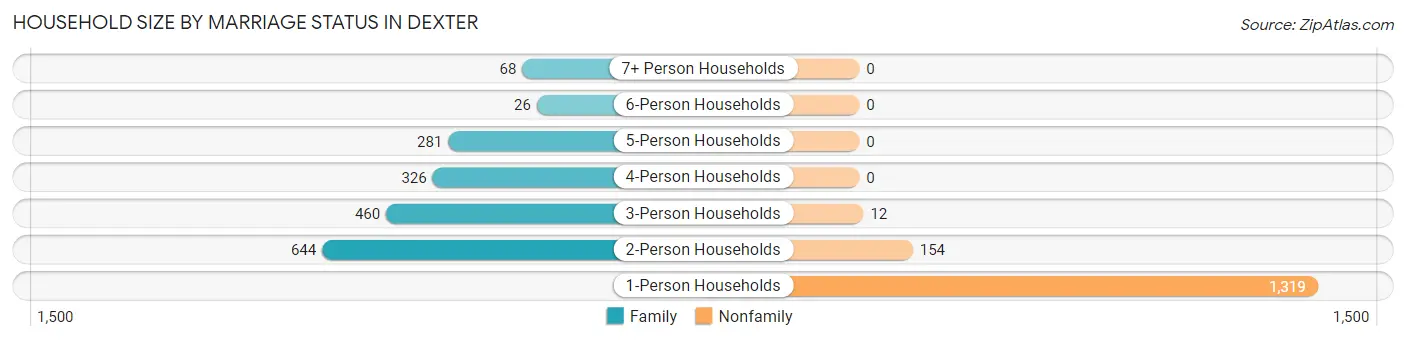
Out of a total of 3,290 households in Dexter, 1,805 (54.9%) are family households, while 1,485 (45.1%) are nonfamily households. The most numerous type of family households are 2-person households, comprising 644, and the most common type of nonfamily households are 1-person households, comprising 1,319.
| Household Size | Family Households | Nonfamily Households |
| 1-Person Households | - | 1,319 (40.1%) |
| 2-Person Households | 644 (19.6%) | 154 (4.7%) |
| 3-Person Households | 460 (14.0%) | 12 (0.4%) |
| 4-Person Households | 326 (9.9%) | 0 (0.0%) |
| 5-Person Households | 281 (8.5%) | 0 (0.0%) |
| 6-Person Households | 26 (0.8%) | 0 (0.0%) |
| 7+ Person Households | 68 (2.1%) | 0 (0.0%) |
| Total | 1,805 (54.9%) | 1,485 (45.1%) |
Female Fertility in Dexter
Fertility by Age in Dexter
Average fertility rate in Dexter is 113.0 births per 1,000 women. Women in the age bracket of 20 to 34 years have the highest fertility rate with 254.0 births per 1,000 women. Women in the age bracket of 20 to 34 years acount for 95.3% of all women with births.
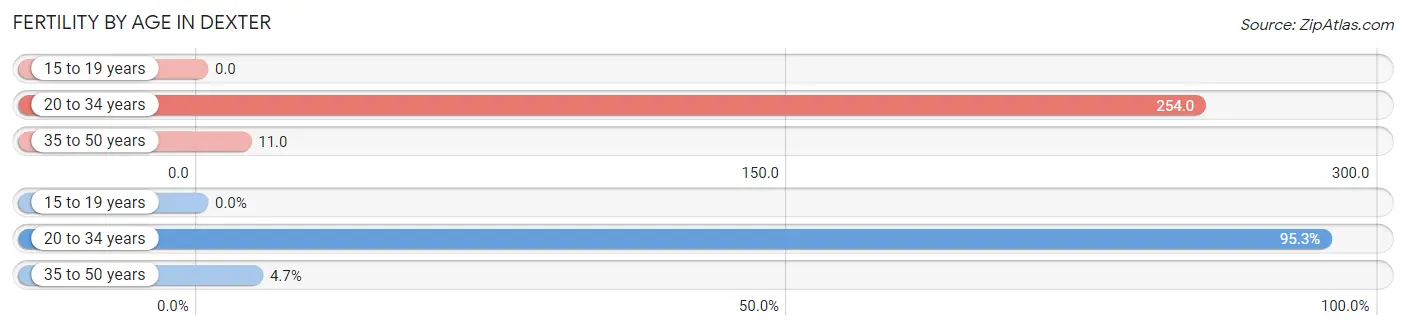
| Age Bracket | Women with Births | Births / 1,000 Women |
| 15 to 19 years | 0 (0.0%) | 0.0 |
| 20 to 34 years | 184 (95.3%) | 254.0 |
| 35 to 50 years | 9 (4.7%) | 11.0 |
| Total | 193 (100.0%) | 113.0 |
Fertility by Age by Marriage Status in Dexter
59.6% of women with births (193) in Dexter are married. The highest percentage of unmarried women with births falls into 20 to 34 years age bracket with 42.4% of them unmarried at the time of birth, while the lowest percentage of unmarried women with births belong to 35 to 50 years age bracket with 0.0% of them unmarried.
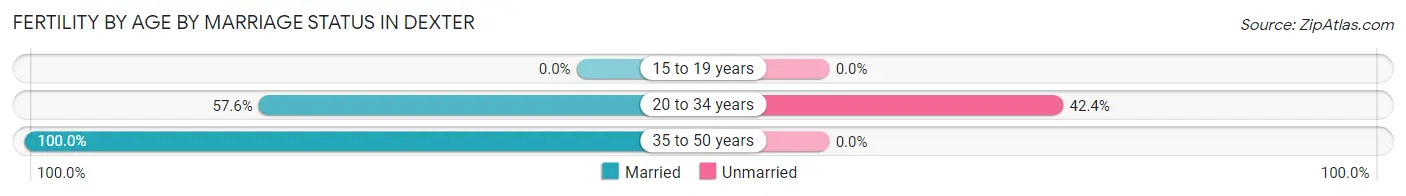
| Age Bracket | Married | Unmarried |
| 15 to 19 years | 0 (0.0%) | 0 (0.0%) |
| 20 to 34 years | 106 (57.6%) | 78 (42.4%) |
| 35 to 50 years | 9 (100.0%) | 0 (0.0%) |
| Total | 115 (59.6%) | 78 (40.4%) |
Fertility by Education in Dexter
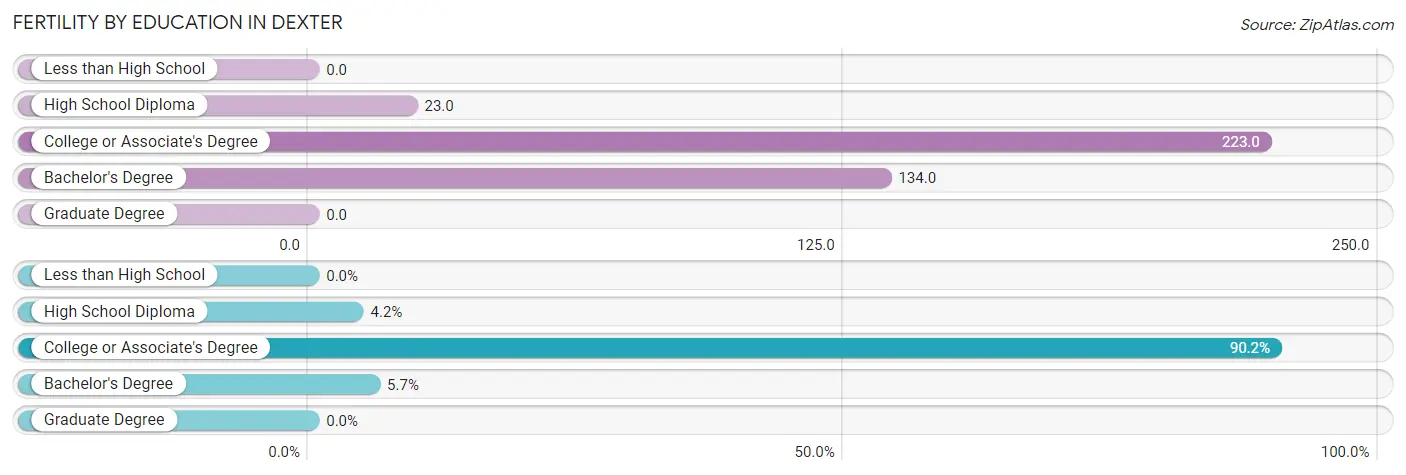
| Educational Attainment | Women with Births | Births / 1,000 Women |
| Less than High School | 0 (0.0%) | 0.0 |
| High School Diploma | 8 (4.2%) | 23.0 |
| College or Associate's Degree | 174 (90.2%) | 223.0 |
| Bachelor's Degree | 11 (5.7%) | 134.0 |
| Graduate Degree | 0 (0.0%) | 0.0 |
| Total | 193 (100.0%) | 113.0 |
Fertility by Education by Marriage Status in Dexter
40.4% of women with births in Dexter are unmarried. Women with the educational attainment of high school diploma are most likely to be married with 100.0% of them married at childbirth, while women with the educational attainment of college or associate's degree are least likely to be married with 44.8% of them unmarried at childbirth.
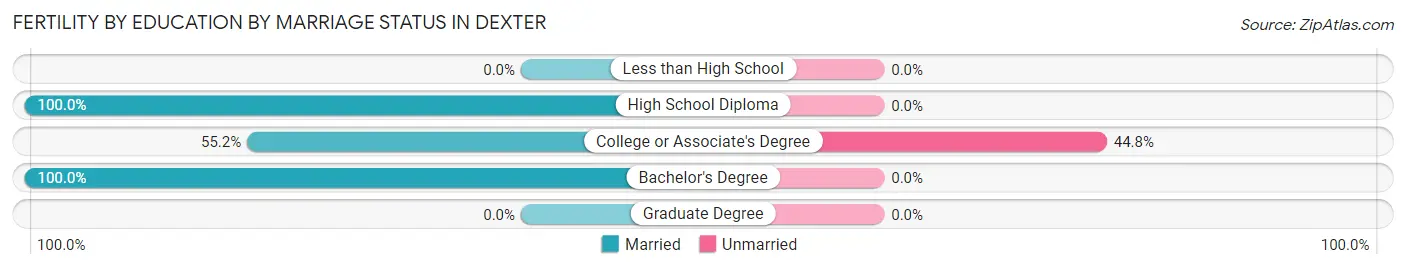
| Educational Attainment | Married | Unmarried |
| Less than High School | 0 (0.0%) | 0 (0.0%) |
| High School Diploma | 8 (100.0%) | 0 (0.0%) |
| College or Associate's Degree | 96 (55.2%) | 78 (44.8%) |
| Bachelor's Degree | 11 (100.0%) | 0 (0.0%) |
| Graduate Degree | 0 (0.0%) | 0 (0.0%) |
| Total | 115 (59.6%) | 78 (40.4%) |
Employment Characteristics in Dexter
Employment by Class of Employer in Dexter
Among the 3,093 employed individuals in Dexter, private company employees (2,181 | 70.5%), self-employed (not incorporated) (231 | 7.5%), and not-for-profit organizations (230 | 7.4%) make up the most common classes of employment.
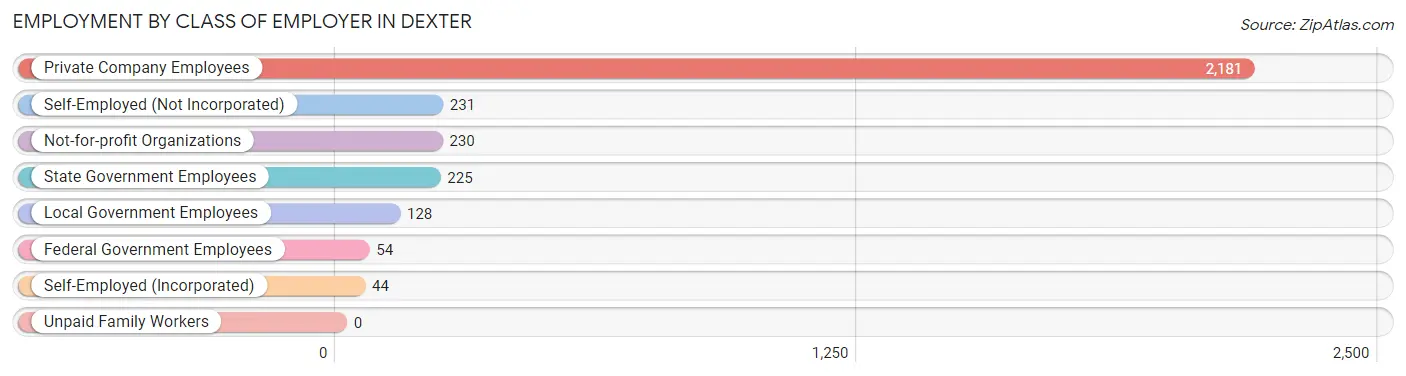
| Employer Class | # Employees | % Employees |
| Private Company Employees | 2,181 | 70.5% |
| Self-Employed (Incorporated) | 44 | 1.4% |
| Self-Employed (Not Incorporated) | 231 | 7.5% |
| Not-for-profit Organizations | 230 | 7.4% |
| Local Government Employees | 128 | 4.1% |
| State Government Employees | 225 | 7.3% |
| Federal Government Employees | 54 | 1.8% |
| Unpaid Family Workers | 0 | 0.0% |
| Total | 3,093 | 100.0% |
Employment Status by Age in Dexter
According to the labor force statistics for Dexter, out of the total population over 16 years of age (6,158), 51.2% or 3,153 individuals are in the labor force, with 0.9% or 28 of them unemployed. The age group with the highest labor force participation rate is 25 to 29 years, with 94.7% or 372 individuals in the labor force. Within the labor force, the 30 to 34 years age range has the highest percentage of unemployed individuals, with 7.8% or 16 of them being unemployed.
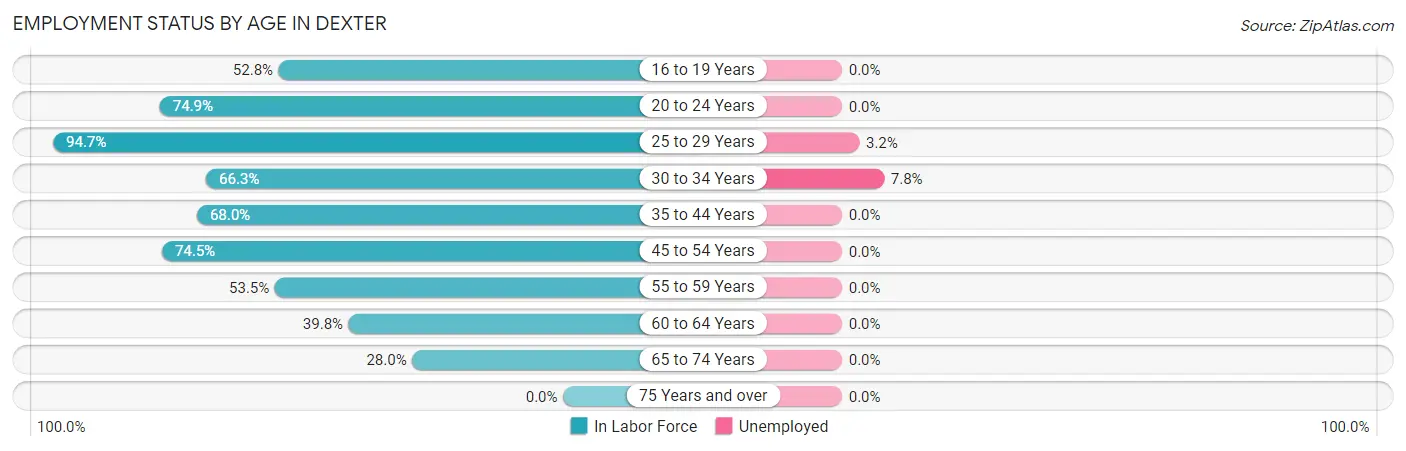
| Age Bracket | In Labor Force | Unemployed |
| 16 to 19 Years | 219 (52.8%) | 0 (0.0%) |
| 20 to 24 Years | 447 (74.9%) | 0 (0.0%) |
| 25 to 29 Years | 372 (94.7%) | 12 (3.2%) |
| 30 to 34 Years | 205 (66.3%) | 16 (7.8%) |
| 35 to 44 Years | 772 (68.0%) | 0 (0.0%) |
| 45 to 54 Years | 494 (74.5%) | 0 (0.0%) |
| 55 to 59 Years | 251 (53.5%) | 0 (0.0%) |
| 60 to 64 Years | 220 (39.8%) | 0 (0.0%) |
| 65 to 74 Years | 173 (28.0%) | 0 (0.0%) |
| 75 Years and over | 0 (0.0%) | 0 (0.0%) |
| Total | 3,153 (51.2%) | 28 (0.9%) |
Employment Status by Educational Attainment in Dexter
According to labor force statistics for Dexter, 65.7% of individuals (2,314) out of the total population between 25 and 64 years of age (3,522) are in the labor force, with 1.2% or 28 of them being unemployed. The group with the highest labor force participation rate are those with the educational attainment of bachelor's degree or higher, with 94.9% or 502 individuals in the labor force. Within the labor force, individuals with high school diploma education have the highest percentage of unemployment, with 2.0% or 16 of them being unemployed.
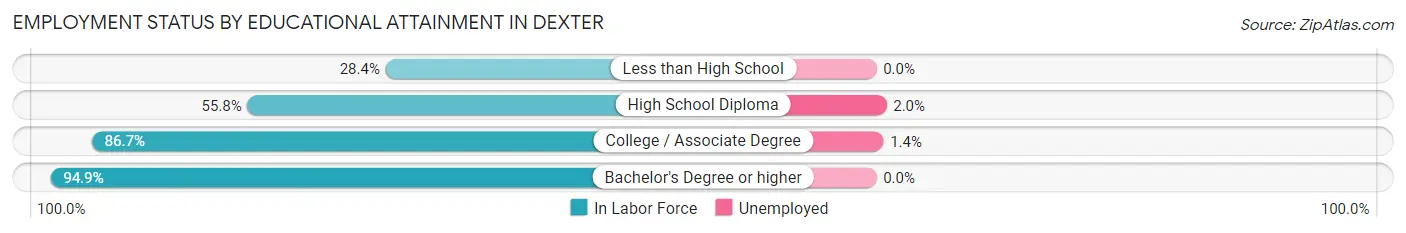
| Educational Attainment | In Labor Force | Unemployed |
| Less than High School | 170 (28.4%) | 0 (0.0%) |
| High School Diploma | 782 (55.8%) | 28 (2.0%) |
| College / Associate Degree | 860 (86.7%) | 14 (1.4%) |
| Bachelor's Degree or higher | 502 (94.9%) | 0 (0.0%) |
| Total | 2,314 (65.7%) | 42 (1.2%) |
Employment Occupations by Sex in Dexter
Management, Business, Science and Arts Occupations
The most common Management, Business, Science and Arts occupations in Dexter are Management (376 | 12.0%), Community & Social Service (358 | 11.5%), Health Diagnosing & Treating (256 | 8.2%), Education Instruction & Library (204 | 6.5%), and Arts, Media & Entertainment (78 | 2.5%).
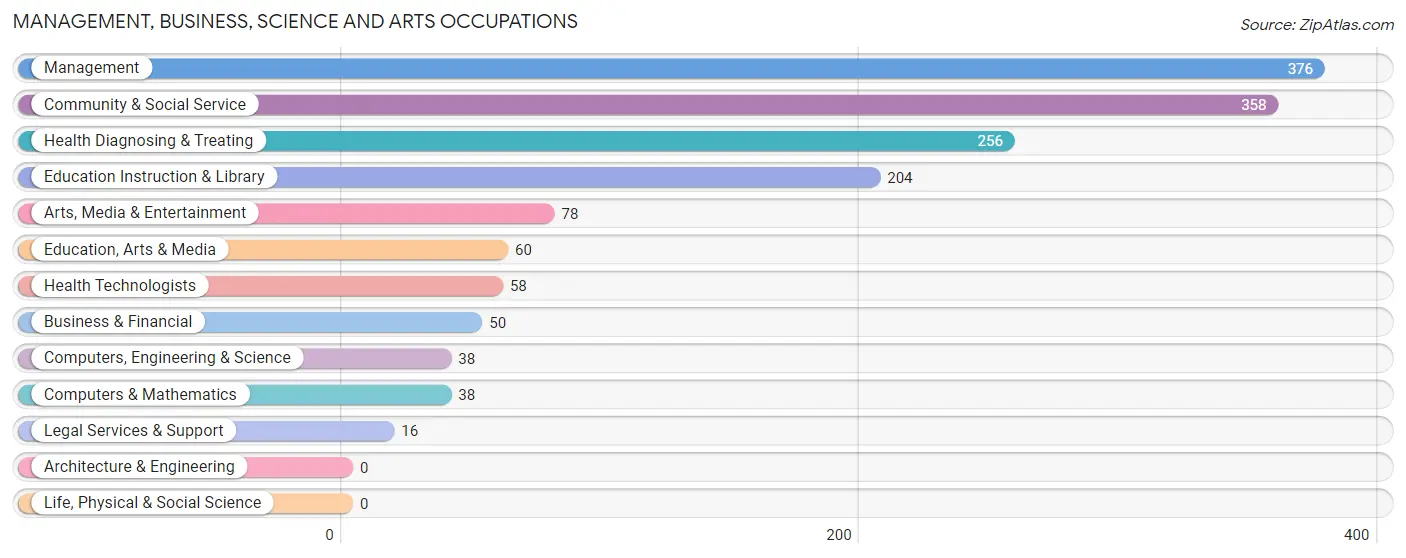
Management, Business, Science and Arts Occupations by Sex
Within the Management, Business, Science and Arts occupations in Dexter, the most male-oriented occupations are Legal Services & Support (100.0%), Management (80.8%), and Arts, Media & Entertainment (55.1%), while the most female-oriented occupations are Health Diagnosing & Treating (91.4%), Education Instruction & Library (88.7%), and Health Technologists (86.2%).
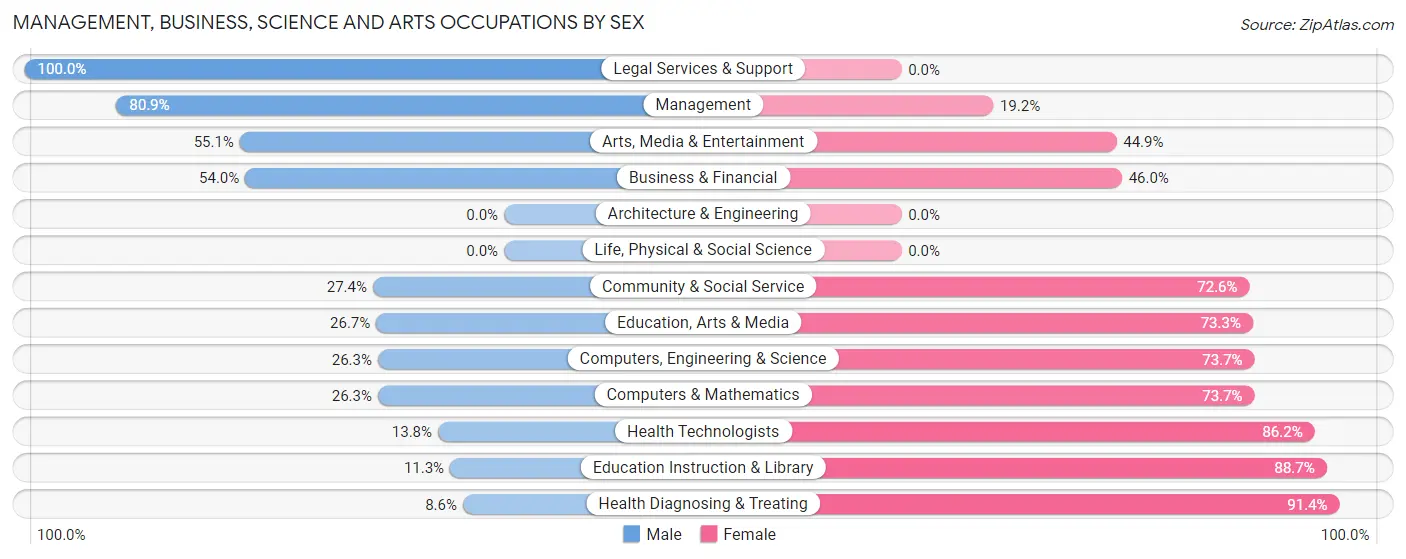
| Occupation | Male | Female |
| Management | 304 (80.8%) | 72 (19.2%) |
| Business & Financial | 27 (54.0%) | 23 (46.0%) |
| Computers, Engineering & Science | 10 (26.3%) | 28 (73.7%) |
| Computers & Mathematics | 10 (26.3%) | 28 (73.7%) |
| Architecture & Engineering | 0 (0.0%) | 0 (0.0%) |
| Life, Physical & Social Science | 0 (0.0%) | 0 (0.0%) |
| Community & Social Service | 98 (27.4%) | 260 (72.6%) |
| Education, Arts & Media | 16 (26.7%) | 44 (73.3%) |
| Legal Services & Support | 16 (100.0%) | 0 (0.0%) |
| Education Instruction & Library | 23 (11.3%) | 181 (88.7%) |
| Arts, Media & Entertainment | 43 (55.1%) | 35 (44.9%) |
| Health Diagnosing & Treating | 22 (8.6%) | 234 (91.4%) |
| Health Technologists | 8 (13.8%) | 50 (86.2%) |
| Total (Category) | 461 (42.8%) | 617 (57.2%) |
| Total (Overall) | 1,484 (47.5%) | 1,641 (52.5%) |
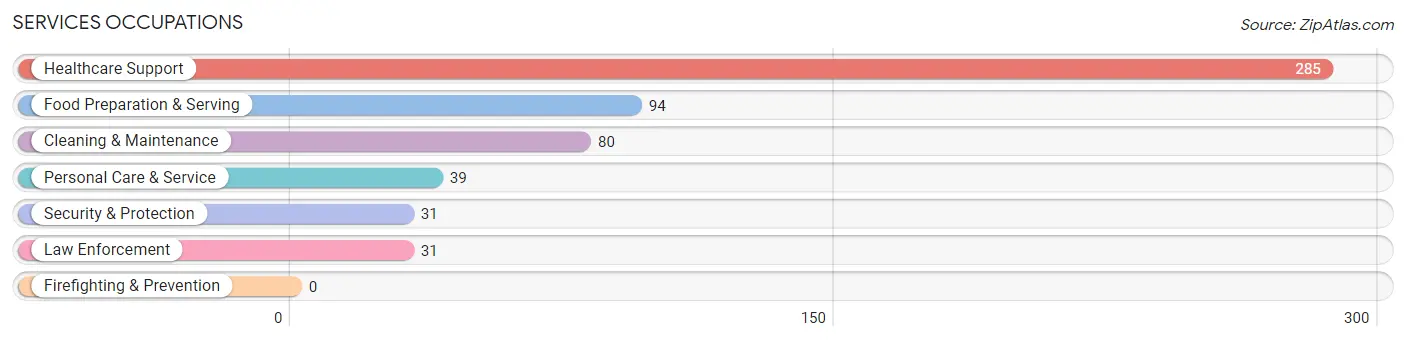
Services Occupations
The most common Services occupations in Dexter are Healthcare Support (285 | 9.1%), Food Preparation & Serving (94 | 3.0%), Cleaning & Maintenance (80 | 2.6%), Personal Care & Service (39 | 1.3%), and Security & Protection (31 | 1.0%).
Services Occupations by Sex
Within the Services occupations in Dexter, the most male-oriented occupations are Security & Protection (100.0%), Law Enforcement (100.0%), and Food Preparation & Serving (54.3%), while the most female-oriented occupations are Healthcare Support (100.0%), Cleaning & Maintenance (100.0%), and Personal Care & Service (66.7%).
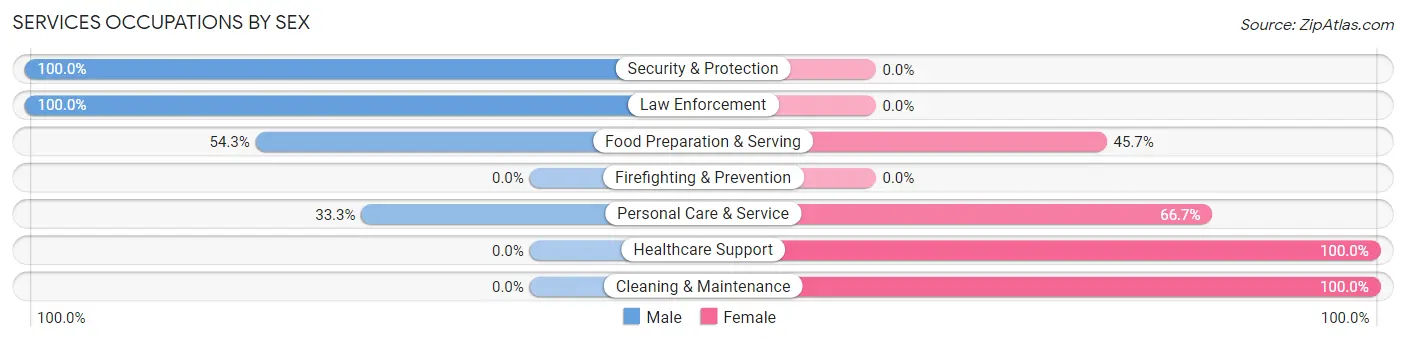
| Occupation | Male | Female |
| Healthcare Support | 0 (0.0%) | 285 (100.0%) |
| Security & Protection | 31 (100.0%) | 0 (0.0%) |
| Firefighting & Prevention | 0 (0.0%) | 0 (0.0%) |
| Law Enforcement | 31 (100.0%) | 0 (0.0%) |
| Food Preparation & Serving | 51 (54.3%) | 43 (45.7%) |
| Cleaning & Maintenance | 0 (0.0%) | 80 (100.0%) |
| Personal Care & Service | 13 (33.3%) | 26 (66.7%) |
| Total (Category) | 95 (18.0%) | 434 (82.0%) |
| Total (Overall) | 1,484 (47.5%) | 1,641 (52.5%) |
Sales and Office Occupations
The most common Sales and Office occupations in Dexter are Sales & Related (309 | 9.9%), and Office & Administration (296 | 9.5%).
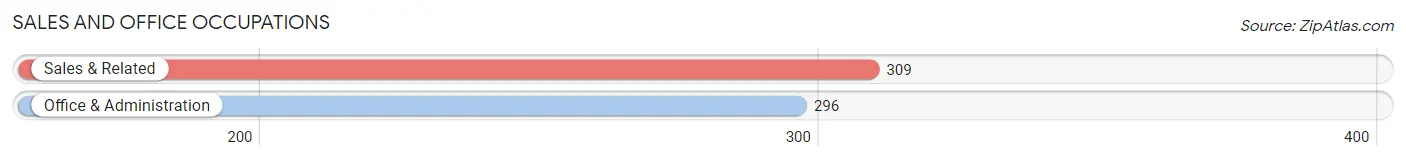
Sales and Office Occupations by Sex
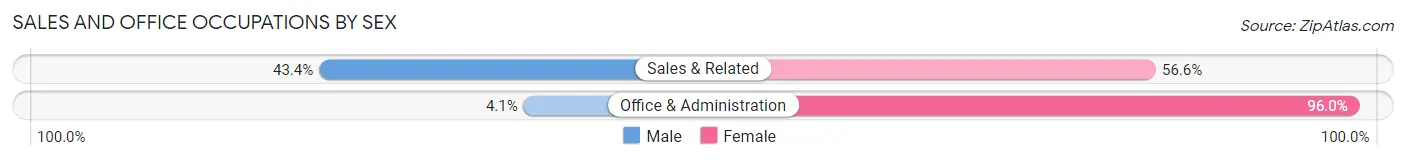
| Occupation | Male | Female |
| Sales & Related | 134 (43.4%) | 175 (56.6%) |
| Office & Administration | 12 (4.1%) | 284 (96.0%) |
| Total (Category) | 146 (24.1%) | 459 (75.9%) |
| Total (Overall) | 1,484 (47.5%) | 1,641 (52.5%) |
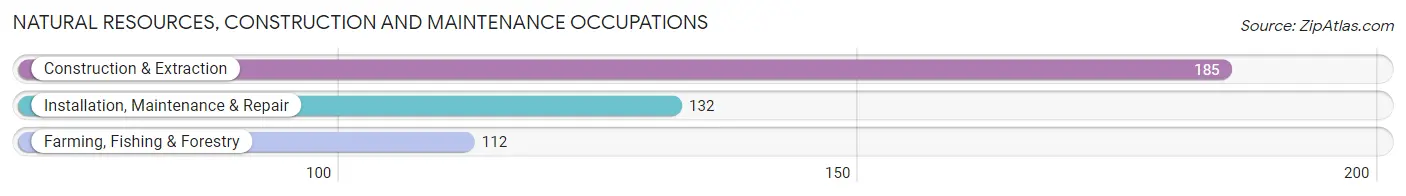
Natural Resources, Construction and Maintenance Occupations
The most common Natural Resources, Construction and Maintenance occupations in Dexter are Construction & Extraction (185 | 5.9%), Installation, Maintenance & Repair (132 | 4.2%), and Farming, Fishing & Forestry (112 | 3.6%).
Natural Resources, Construction and Maintenance Occupations by Sex
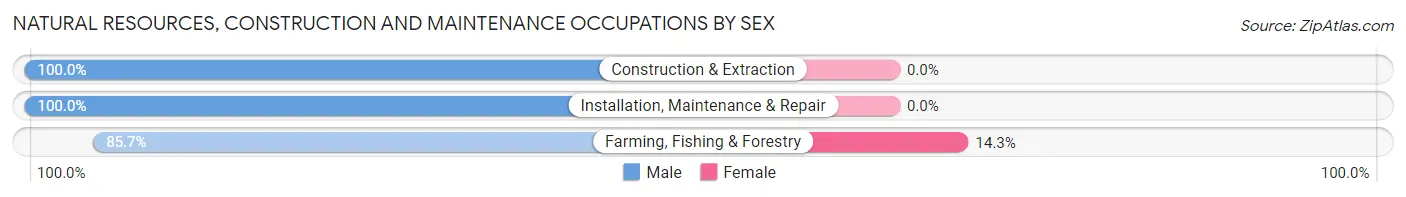
| Occupation | Male | Female |
| Farming, Fishing & Forestry | 96 (85.7%) | 16 (14.3%) |
| Construction & Extraction | 185 (100.0%) | 0 (0.0%) |
| Installation, Maintenance & Repair | 132 (100.0%) | 0 (0.0%) |
| Total (Category) | 413 (96.3%) | 16 (3.7%) |
| Total (Overall) | 1,484 (47.5%) | 1,641 (52.5%) |
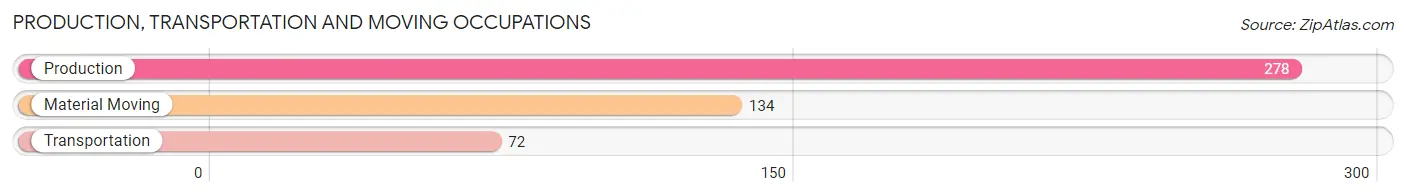
Production, Transportation and Moving Occupations
The most common Production, Transportation and Moving occupations in Dexter are Production (278 | 8.9%), Material Moving (134 | 4.3%), and Transportation (72 | 2.3%).
Production, Transportation and Moving Occupations by Sex
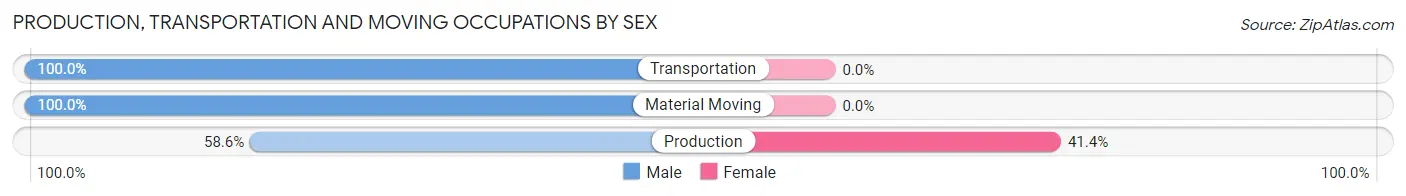
| Occupation | Male | Female |
| Production | 163 (58.6%) | 115 (41.4%) |
| Transportation | 72 (100.0%) | 0 (0.0%) |
| Material Moving | 134 (100.0%) | 0 (0.0%) |
| Total (Category) | 369 (76.2%) | 115 (23.8%) |
| Total (Overall) | 1,484 (47.5%) | 1,641 (52.5%) |
Employment Industries by Sex in Dexter
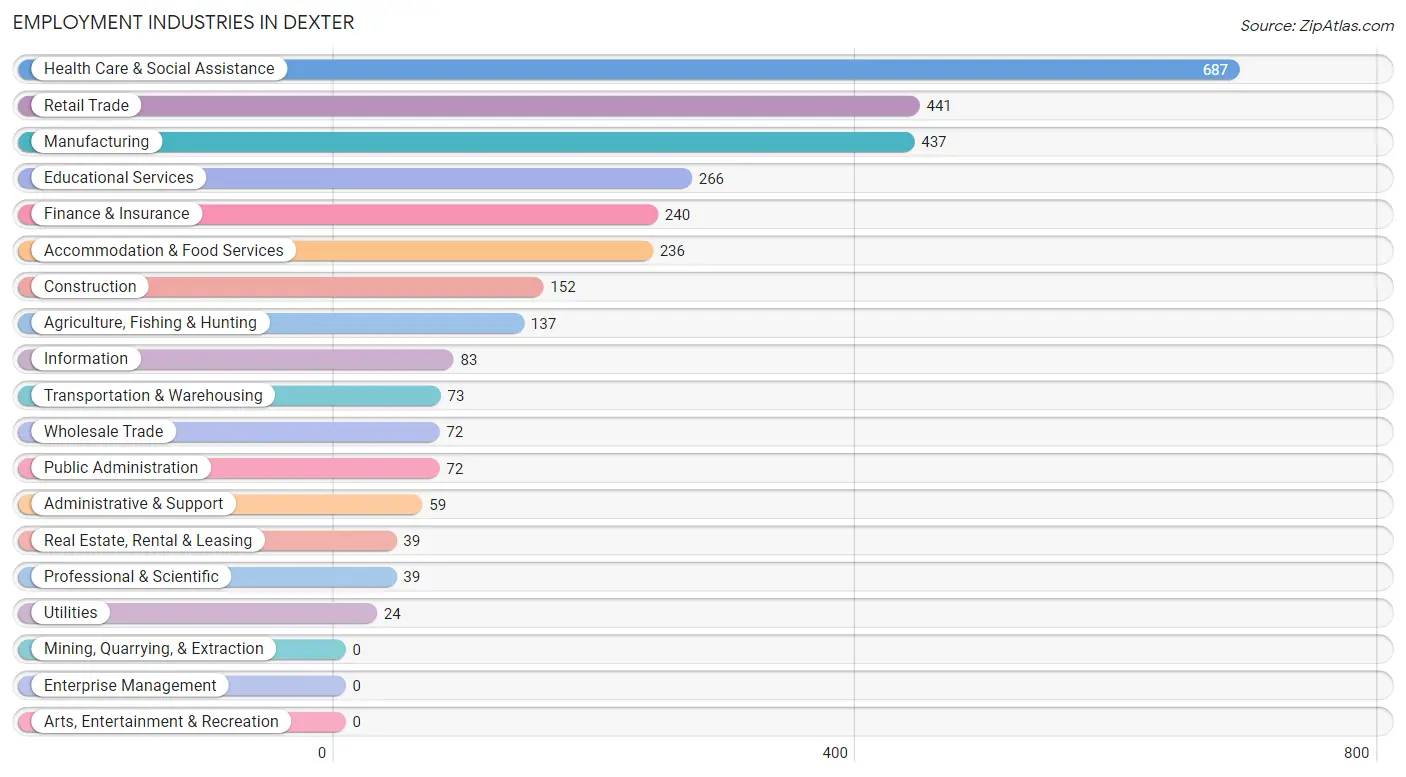
Employment Industries in Dexter
The major employment industries in Dexter include Health Care & Social Assistance (687 | 22.0%), Retail Trade (441 | 14.1%), Manufacturing (437 | 14.0%), Educational Services (266 | 8.5%), and Finance & Insurance (240 | 7.7%).
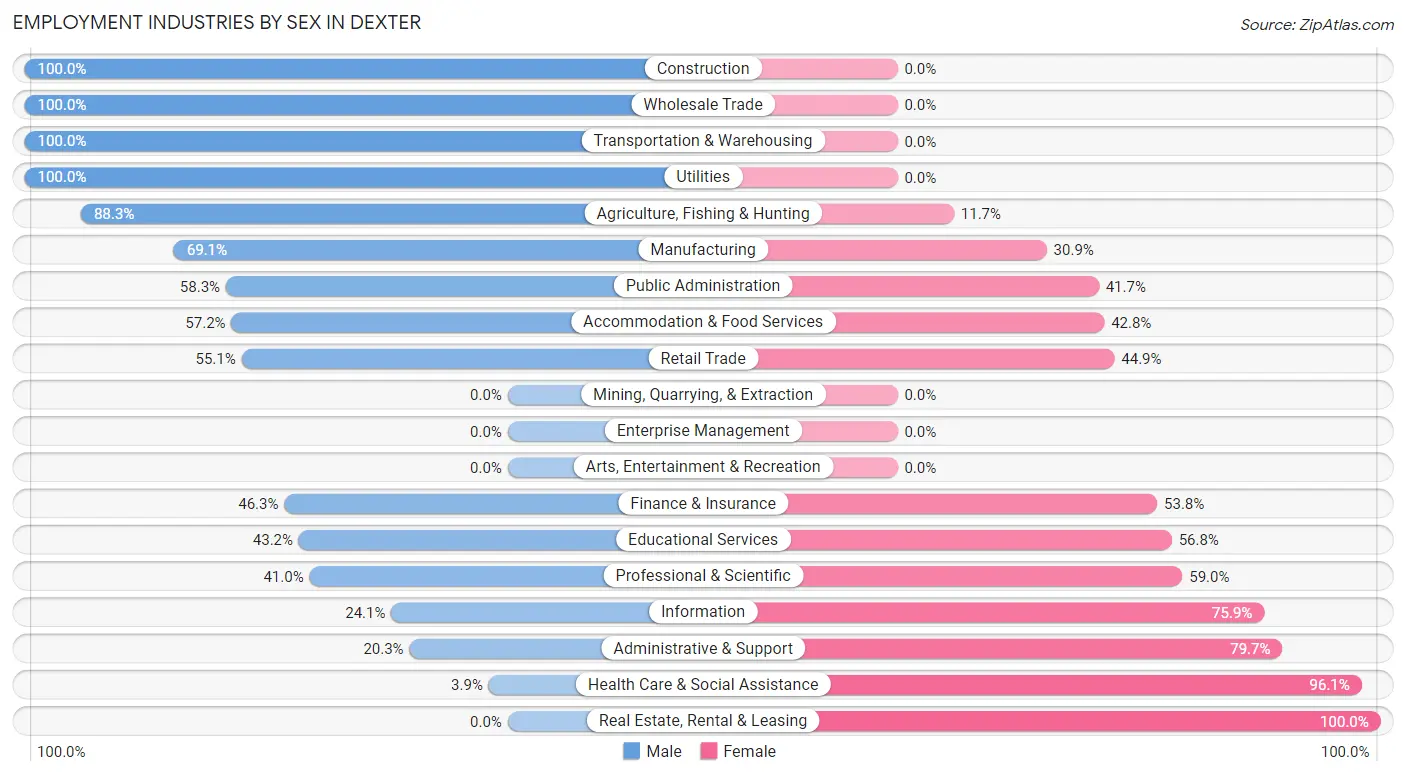
Employment Industries by Sex in Dexter
The Dexter industries that see more men than women are Construction (100.0%), Wholesale Trade (100.0%), and Transportation & Warehousing (100.0%), whereas the industries that tend to have a higher number of women are Real Estate, Rental & Leasing (100.0%), Health Care & Social Assistance (96.1%), and Administrative & Support (79.7%).
| Industry | Male | Female |
| Agriculture, Fishing & Hunting | 121 (88.3%) | 16 (11.7%) |
| Mining, Quarrying, & Extraction | 0 (0.0%) | 0 (0.0%) |
| Construction | 152 (100.0%) | 0 (0.0%) |
| Manufacturing | 302 (69.1%) | 135 (30.9%) |
| Wholesale Trade | 72 (100.0%) | 0 (0.0%) |
| Retail Trade | 243 (55.1%) | 198 (44.9%) |
| Transportation & Warehousing | 73 (100.0%) | 0 (0.0%) |
| Utilities | 24 (100.0%) | 0 (0.0%) |
| Information | 20 (24.1%) | 63 (75.9%) |
| Finance & Insurance | 111 (46.3%) | 129 (53.7%) |
| Real Estate, Rental & Leasing | 0 (0.0%) | 39 (100.0%) |
| Professional & Scientific | 16 (41.0%) | 23 (59.0%) |
| Enterprise Management | 0 (0.0%) | 0 (0.0%) |
| Administrative & Support | 12 (20.3%) | 47 (79.7%) |
| Educational Services | 115 (43.2%) | 151 (56.8%) |
| Health Care & Social Assistance | 27 (3.9%) | 660 (96.1%) |
| Arts, Entertainment & Recreation | 0 (0.0%) | 0 (0.0%) |
| Accommodation & Food Services | 135 (57.2%) | 101 (42.8%) |
| Public Administration | 42 (58.3%) | 30 (41.7%) |
| Total | 1,484 (47.5%) | 1,641 (52.5%) |
Education in Dexter
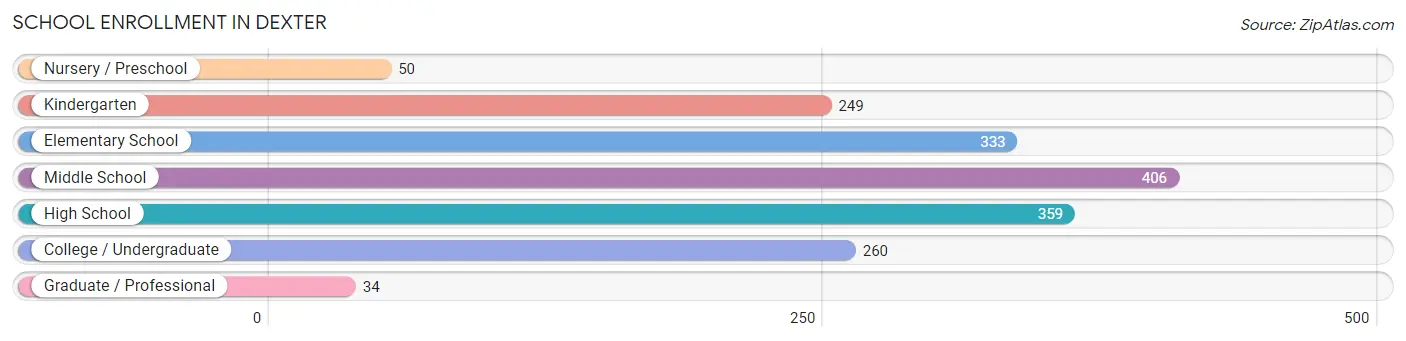
School Enrollment in Dexter
The most common levels of schooling among the 1,691 students in Dexter are middle school (406 | 24.0%), high school (359 | 21.2%), and elementary school (333 | 19.7%).
| School Level | # Students | % Students |
| Nursery / Preschool | 50 | 3.0% |
| Kindergarten | 249 | 14.7% |
| Elementary School | 333 | 19.7% |
| Middle School | 406 | 24.0% |
| High School | 359 | 21.2% |
| College / Undergraduate | 260 | 15.4% |
| Graduate / Professional | 34 | 2.0% |
| Total | 1,691 | 100.0% |
School Enrollment by Age by Funding Source in Dexter
Out of a total of 1,691 students who are enrolled in schools in Dexter, 39 (2.3%) attend a private institution, while the remaining 1,652 (97.7%) are enrolled in public schools. The age group of 3 to 4 year olds has the highest likelihood of being enrolled in private schools, with 7 (17.9% in the age bracket) enrolled. Conversely, the age group of 10 to 14 year olds has the lowest likelihood of being enrolled in a private school, with 509 (100.0% in the age bracket) attending a public institution.
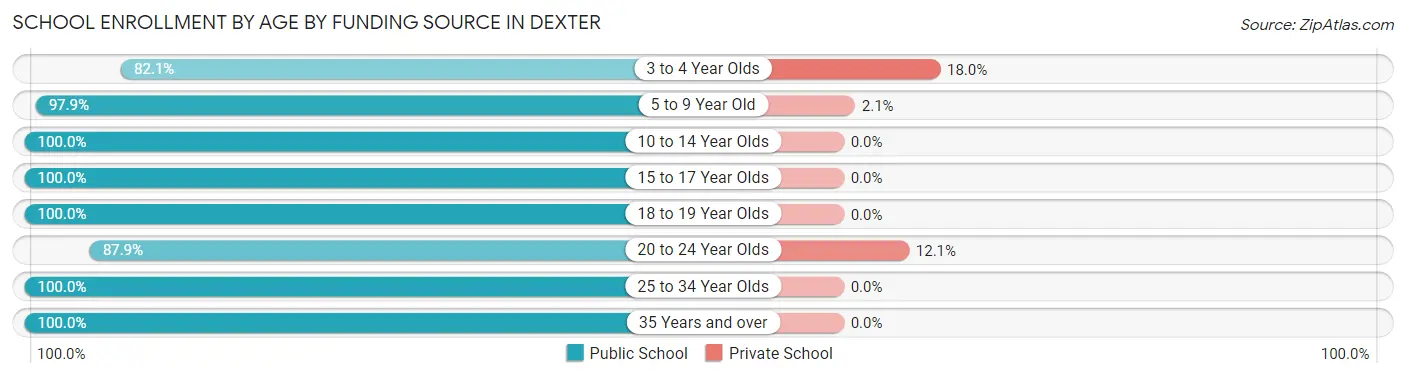
| Age Bracket | Public School | Private School |
| 3 to 4 Year Olds | 32 (82.1%) | 7 (17.9%) |
| 5 to 9 Year Old | 517 (97.9%) | 11 (2.1%) |
| 10 to 14 Year Olds | 509 (100.0%) | 0 (0.0%) |
| 15 to 17 Year Olds | 244 (100.0%) | 0 (0.0%) |
| 18 to 19 Year Olds | 63 (100.0%) | 0 (0.0%) |
| 20 to 24 Year Olds | 152 (87.9%) | 21 (12.1%) |
| 25 to 34 Year Olds | 50 (100.0%) | 0 (0.0%) |
| 35 Years and over | 85 (100.0%) | 0 (0.0%) |
| Total | 1,652 (97.7%) | 39 (2.3%) |
Educational Attainment by Field of Study in Dexter
Education (129 | 17.4%), bio, nature & agricultural (113 | 15.3%), business (94 | 12.7%), science & technology (91 | 12.3%), and engineering (71 | 9.6%) are the most common fields of study among 740 individuals in Dexter who have obtained a bachelor's degree or higher.
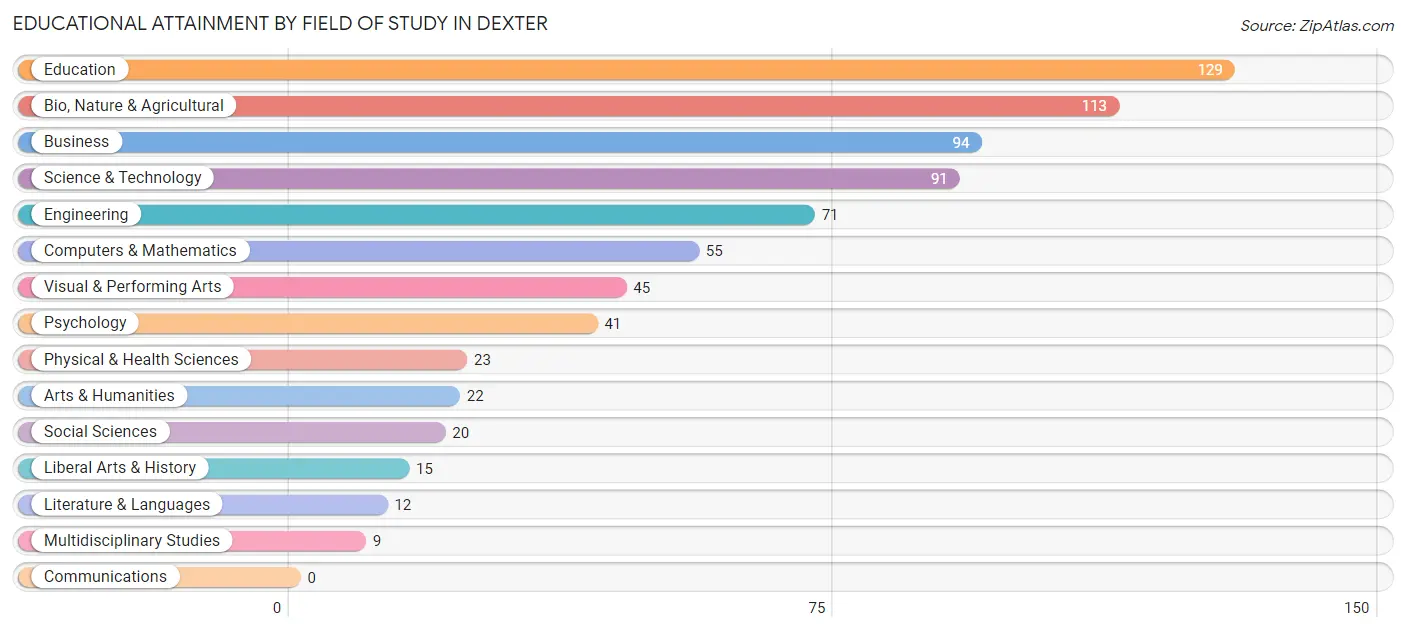
| Field of Study | # Graduates | % Graduates |
| Computers & Mathematics | 55 | 7.4% |
| Bio, Nature & Agricultural | 113 | 15.3% |
| Physical & Health Sciences | 23 | 3.1% |
| Psychology | 41 | 5.5% |
| Social Sciences | 20 | 2.7% |
| Engineering | 71 | 9.6% |
| Multidisciplinary Studies | 9 | 1.2% |
| Science & Technology | 91 | 12.3% |
| Business | 94 | 12.7% |
| Education | 129 | 17.4% |
| Literature & Languages | 12 | 1.6% |
| Liberal Arts & History | 15 | 2.0% |
| Visual & Performing Arts | 45 | 6.1% |
| Communications | 0 | 0.0% |
| Arts & Humanities | 22 | 3.0% |
| Total | 740 | 100.0% |
Transportation & Commute in Dexter
Vehicle Availability by Sex in Dexter
The most prevalent vehicle ownership categories in Dexter are males with 2 vehicles (533, accounting for 36.5%) and females with 2 vehicles (551, making up 32.9%).
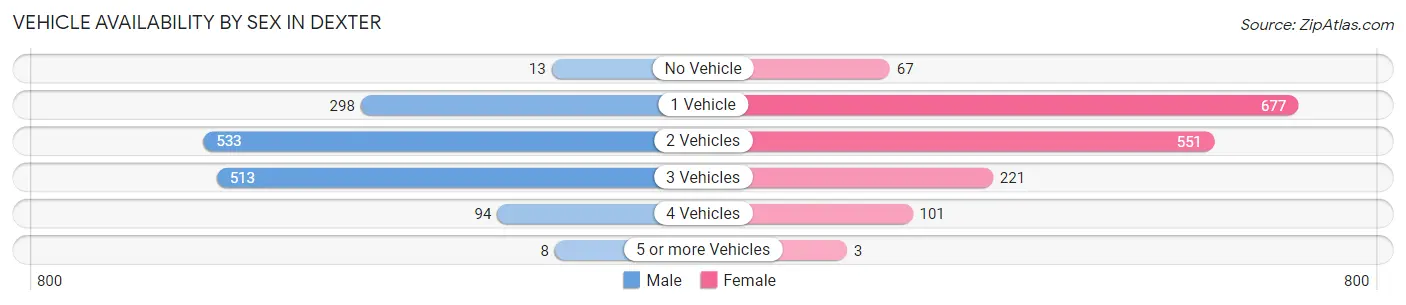
| Vehicles Available | Male | Female |
| No Vehicle | 13 (0.9%) | 67 (4.1%) |
| 1 Vehicle | 298 (20.4%) | 677 (41.8%) |
| 2 Vehicles | 533 (36.5%) | 551 (34.0%) |
| 3 Vehicles | 513 (35.2%) | 221 (13.6%) |
| 4 Vehicles | 94 (6.4%) | 101 (6.2%) |
| 5 or more Vehicles | 8 (0.5%) | 3 (0.2%) |
| Total | 1,459 (100.0%) | 1,620 (100.0%) |
Commute Time in Dexter
The most frequently occuring commute durations in Dexter are 5 to 9 minutes (958 commuters, 32.0%), 10 to 14 minutes (400 commuters, 13.4%), and 15 to 19 minutes (328 commuters, 11.0%).
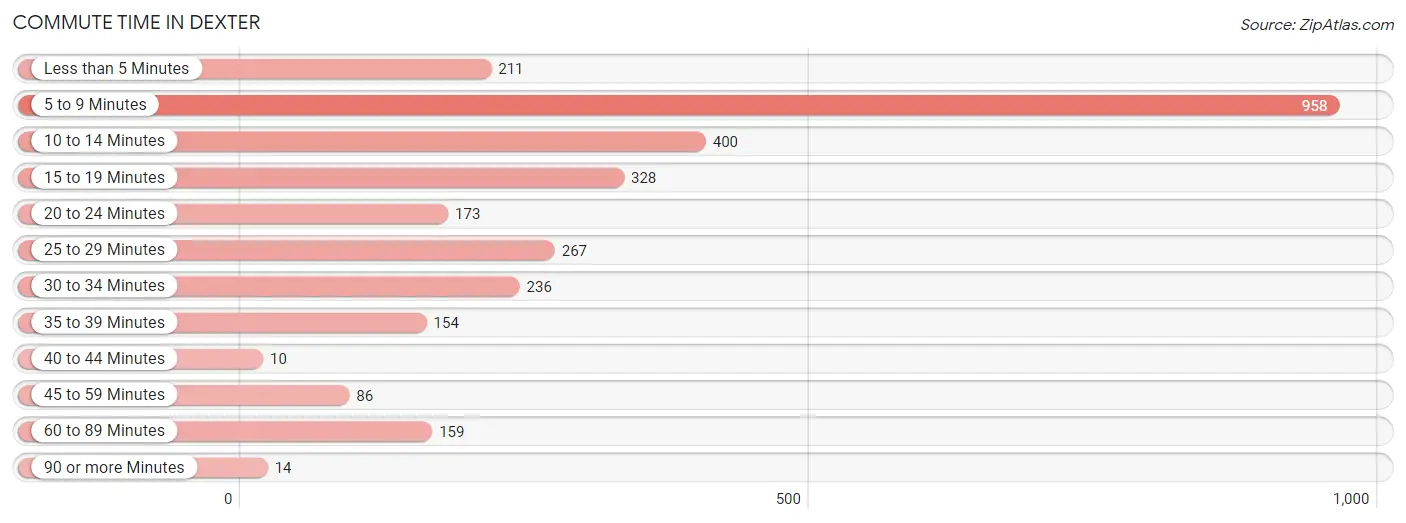
| Commute Time | # Commuters | % Commuters |
| Less than 5 Minutes | 211 | 7.0% |
| 5 to 9 Minutes | 958 | 32.0% |
| 10 to 14 Minutes | 400 | 13.4% |
| 15 to 19 Minutes | 328 | 11.0% |
| 20 to 24 Minutes | 173 | 5.8% |
| 25 to 29 Minutes | 267 | 8.9% |
| 30 to 34 Minutes | 236 | 7.9% |
| 35 to 39 Minutes | 154 | 5.1% |
| 40 to 44 Minutes | 10 | 0.3% |
| 45 to 59 Minutes | 86 | 2.9% |
| 60 to 89 Minutes | 159 | 5.3% |
| 90 or more Minutes | 14 | 0.5% |
Commute Time by Sex in Dexter
The most common commute times in Dexter are 5 to 9 minutes (350 commuters, 23.8%) for males and 5 to 9 minutes (608 commuters, 39.9%) for females.
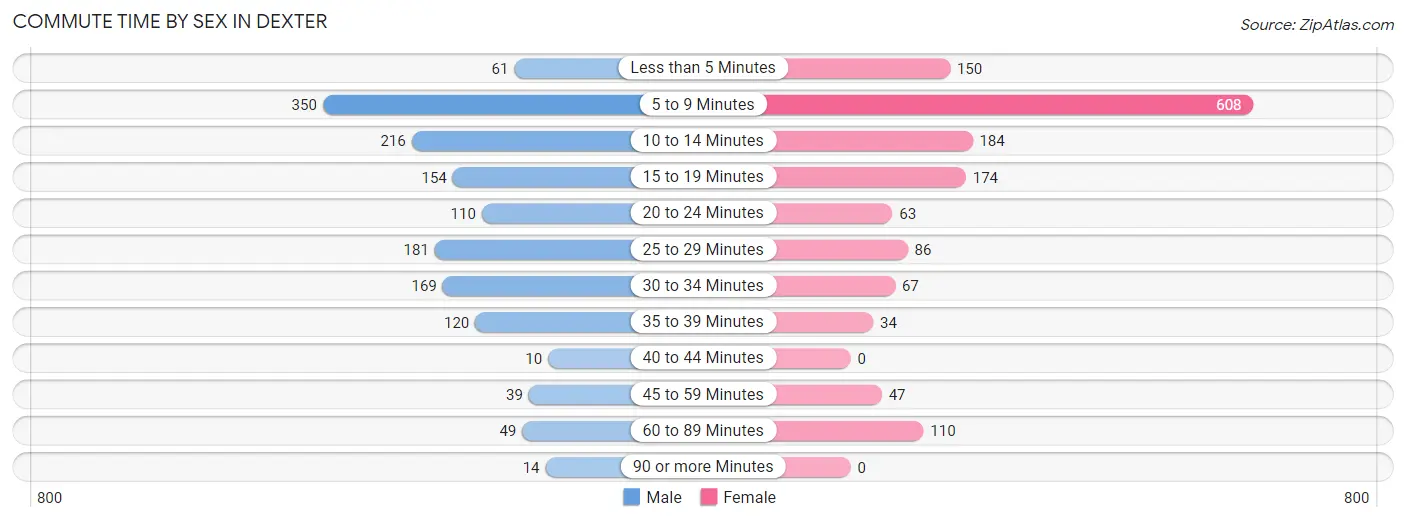
| Commute Time | Male | Female |
| Less than 5 Minutes | 61 (4.1%) | 150 (9.9%) |
| 5 to 9 Minutes | 350 (23.8%) | 608 (39.9%) |
| 10 to 14 Minutes | 216 (14.7%) | 184 (12.1%) |
| 15 to 19 Minutes | 154 (10.4%) | 174 (11.4%) |
| 20 to 24 Minutes | 110 (7.5%) | 63 (4.1%) |
| 25 to 29 Minutes | 181 (12.3%) | 86 (5.7%) |
| 30 to 34 Minutes | 169 (11.5%) | 67 (4.4%) |
| 35 to 39 Minutes | 120 (8.2%) | 34 (2.2%) |
| 40 to 44 Minutes | 10 (0.7%) | 0 (0.0%) |
| 45 to 59 Minutes | 39 (2.6%) | 47 (3.1%) |
| 60 to 89 Minutes | 49 (3.3%) | 110 (7.2%) |
| 90 or more Minutes | 14 (0.9%) | 0 (0.0%) |
Time of Departure to Work by Sex in Dexter
The most frequent times of departure to work in Dexter are 6:30 AM to 6:59 AM (245, 16.6%) for males and 7:30 AM to 7:59 AM (486, 31.9%) for females.
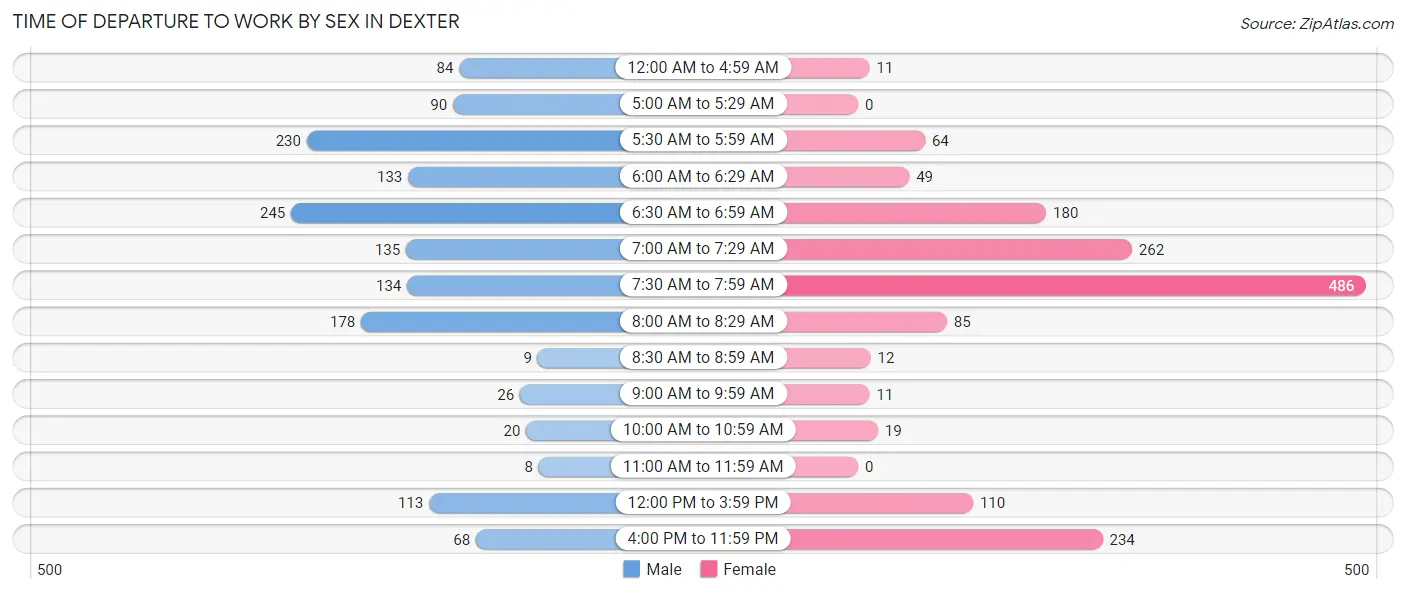
| Time of Departure | Male | Female |
| 12:00 AM to 4:59 AM | 84 (5.7%) | 11 (0.7%) |
| 5:00 AM to 5:29 AM | 90 (6.1%) | 0 (0.0%) |
| 5:30 AM to 5:59 AM | 230 (15.6%) | 64 (4.2%) |
| 6:00 AM to 6:29 AM | 133 (9.0%) | 49 (3.2%) |
| 6:30 AM to 6:59 AM | 245 (16.6%) | 180 (11.8%) |
| 7:00 AM to 7:29 AM | 135 (9.2%) | 262 (17.2%) |
| 7:30 AM to 7:59 AM | 134 (9.1%) | 486 (31.9%) |
| 8:00 AM to 8:29 AM | 178 (12.1%) | 85 (5.6%) |
| 8:30 AM to 8:59 AM | 9 (0.6%) | 12 (0.8%) |
| 9:00 AM to 9:59 AM | 26 (1.8%) | 11 (0.7%) |
| 10:00 AM to 10:59 AM | 20 (1.4%) | 19 (1.3%) |
| 11:00 AM to 11:59 AM | 8 (0.5%) | 0 (0.0%) |
| 12:00 PM to 3:59 PM | 113 (7.7%) | 110 (7.2%) |
| 4:00 PM to 11:59 PM | 68 (4.6%) | 234 (15.4%) |
| Total | 1,473 (100.0%) | 1,523 (100.0%) |
Housing Occupancy in Dexter
Occupancy by Ownership in Dexter
Of the total 3,290 dwellings in Dexter, owner-occupied units account for 1,924 (58.5%), while renter-occupied units make up 1,366 (41.5%).
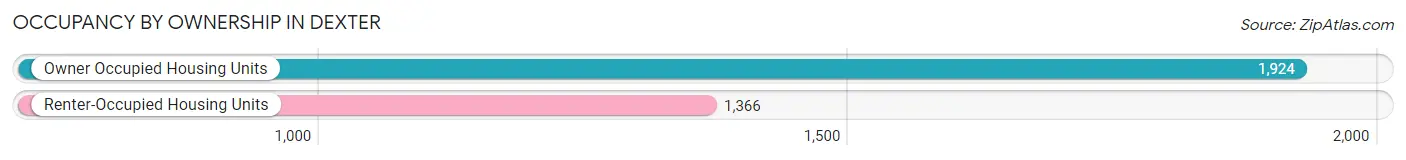
| Occupancy | # Housing Units | % Housing Units |
| Owner Occupied Housing Units | 1,924 | 58.5% |
| Renter-Occupied Housing Units | 1,366 | 41.5% |
| Total Occupied Housing Units | 3,290 | 100.0% |
Occupancy by Household Size in Dexter
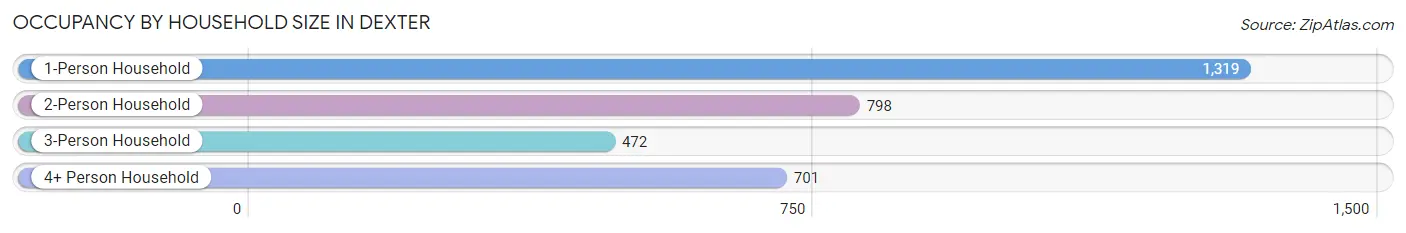
| Household Size | # Housing Units | % Housing Units |
| 1-Person Household | 1,319 | 40.1% |
| 2-Person Household | 798 | 24.3% |
| 3-Person Household | 472 | 14.3% |
| 4+ Person Household | 701 | 21.3% |
| Total Housing Units | 3,290 | 100.0% |
Occupancy by Ownership by Household Size in Dexter
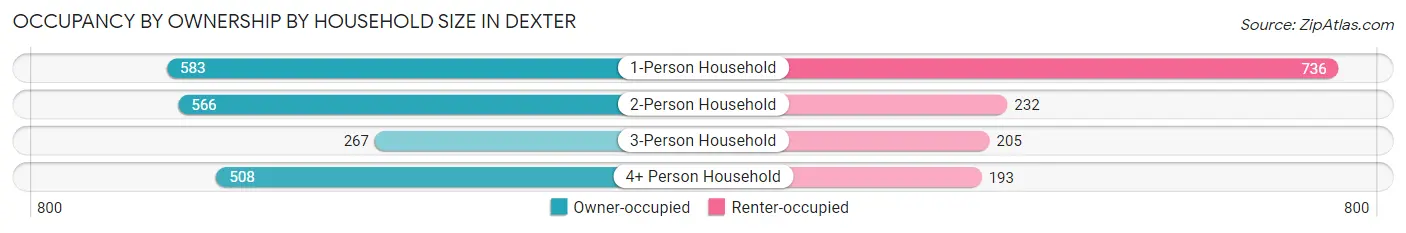
| Household Size | Owner-occupied | Renter-occupied |
| 1-Person Household | 583 (44.2%) | 736 (55.8%) |
| 2-Person Household | 566 (70.9%) | 232 (29.1%) |
| 3-Person Household | 267 (56.6%) | 205 (43.4%) |
| 4+ Person Household | 508 (72.5%) | 193 (27.5%) |
| Total Housing Units | 1,924 (58.5%) | 1,366 (41.5%) |
Occupancy by Educational Attainment in Dexter
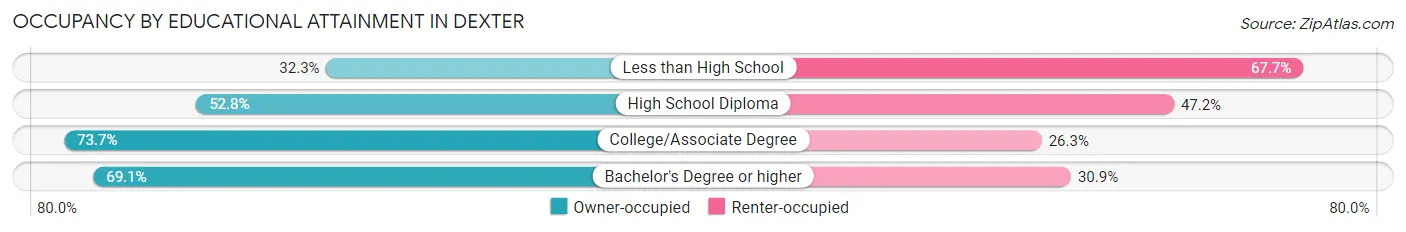
| Household Size | Owner-occupied | Renter-occupied |
| Less than High School | 134 (32.3%) | 281 (67.7%) |
| High School Diploma | 781 (52.8%) | 699 (47.2%) |
| College/Associate Degree | 716 (73.7%) | 255 (26.3%) |
| Bachelor's Degree or higher | 293 (69.1%) | 131 (30.9%) |
Occupancy by Age of Householder in Dexter
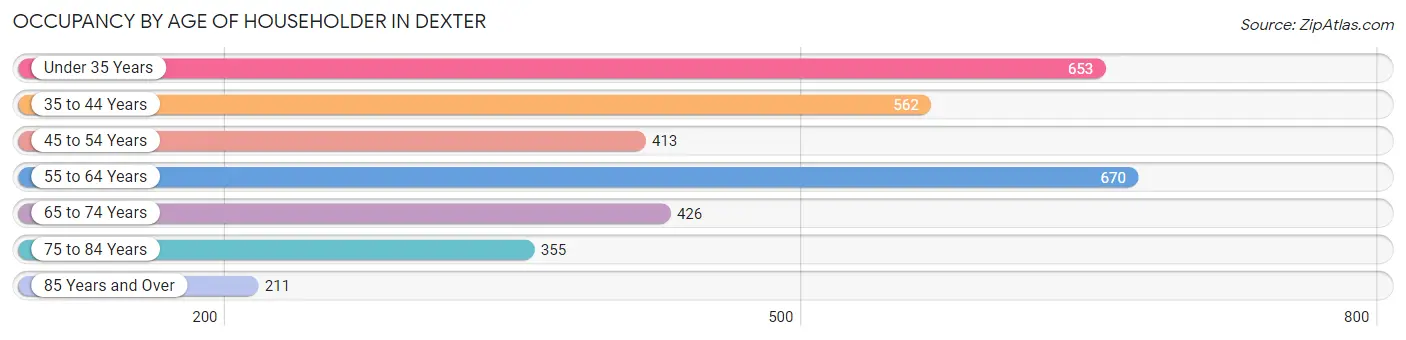
| Age Bracket | # Households | % Households |
| Under 35 Years | 653 | 19.9% |
| 35 to 44 Years | 562 | 17.1% |
| 45 to 54 Years | 413 | 12.6% |
| 55 to 64 Years | 670 | 20.4% |
| 65 to 74 Years | 426 | 13.0% |
| 75 to 84 Years | 355 | 10.8% |
| 85 Years and Over | 211 | 6.4% |
| Total | 3,290 | 100.0% |
Housing Finances in Dexter
Median Income by Occupancy in Dexter
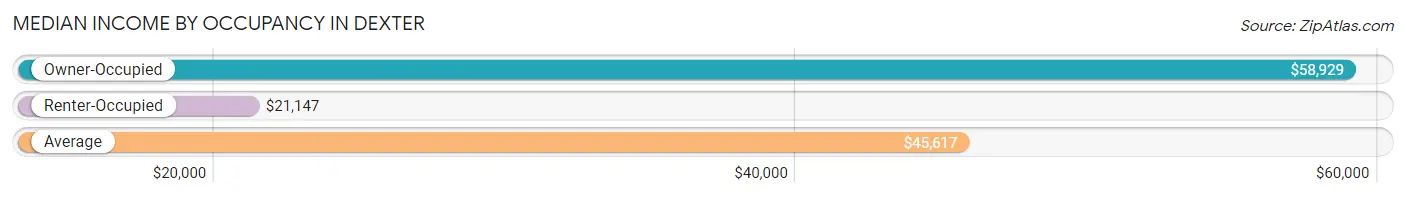
| Occupancy Type | # Households | Median Income |
| Owner-Occupied | 1,924 (58.5%) | $58,929 |
| Renter-Occupied | 1,366 (41.5%) | $21,147 |
| Average | 3,290 (100.0%) | $45,617 |
Occupancy by Householder Income Bracket in Dexter
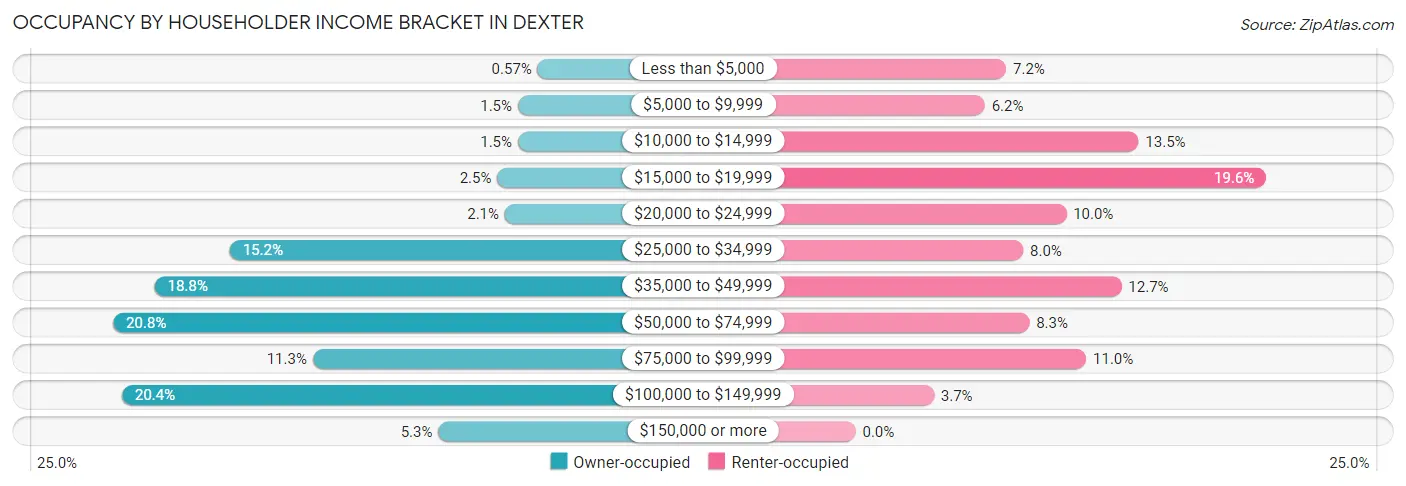
| Income Bracket | Owner-occupied | Renter-occupied |
| Less than $5,000 | 11 (0.6%) | 98 (7.2%) |
| $5,000 to $9,999 | 29 (1.5%) | 84 (6.1%) |
| $10,000 to $14,999 | 29 (1.5%) | 184 (13.5%) |
| $15,000 to $19,999 | 48 (2.5%) | 267 (19.6%) |
| $20,000 to $24,999 | 41 (2.1%) | 137 (10.0%) |
| $25,000 to $34,999 | 293 (15.2%) | 109 (8.0%) |
| $35,000 to $49,999 | 362 (18.8%) | 173 (12.7%) |
| $50,000 to $74,999 | 400 (20.8%) | 113 (8.3%) |
| $75,000 to $99,999 | 217 (11.3%) | 150 (11.0%) |
| $100,000 to $149,999 | 392 (20.4%) | 51 (3.7%) |
| $150,000 or more | 102 (5.3%) | 0 (0.0%) |
| Total | 1,924 (100.0%) | 1,366 (100.0%) |
Monthly Housing Cost Tiers in Dexter
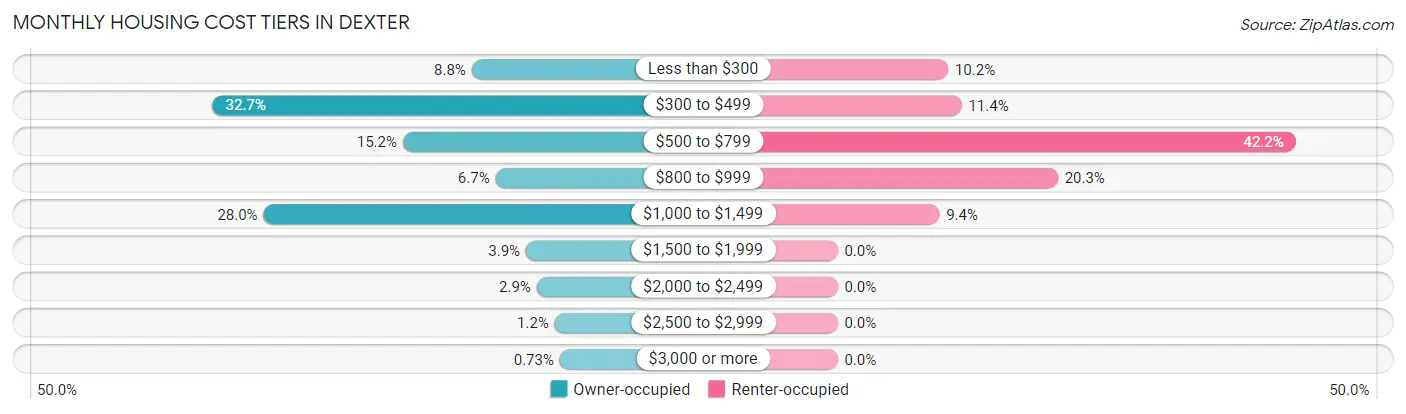
| Monthly Cost | Owner-occupied | Renter-occupied |
| Less than $300 | 170 (8.8%) | 139 (10.2%) |
| $300 to $499 | 629 (32.7%) | 156 (11.4%) |
| $500 to $799 | 292 (15.2%) | 576 (42.2%) |
| $800 to $999 | 128 (6.7%) | 277 (20.3%) |
| $1,000 to $1,499 | 539 (28.0%) | 128 (9.4%) |
| $1,500 to $1,999 | 74 (3.8%) | 0 (0.0%) |
| $2,000 to $2,499 | 55 (2.9%) | 0 (0.0%) |
| $2,500 to $2,999 | 23 (1.2%) | 0 (0.0%) |
| $3,000 or more | 14 (0.7%) | 0 (0.0%) |
| Total | 1,924 (100.0%) | 1,366 (100.0%) |
Physical Housing Characteristics in Dexter
Housing Structures in Dexter
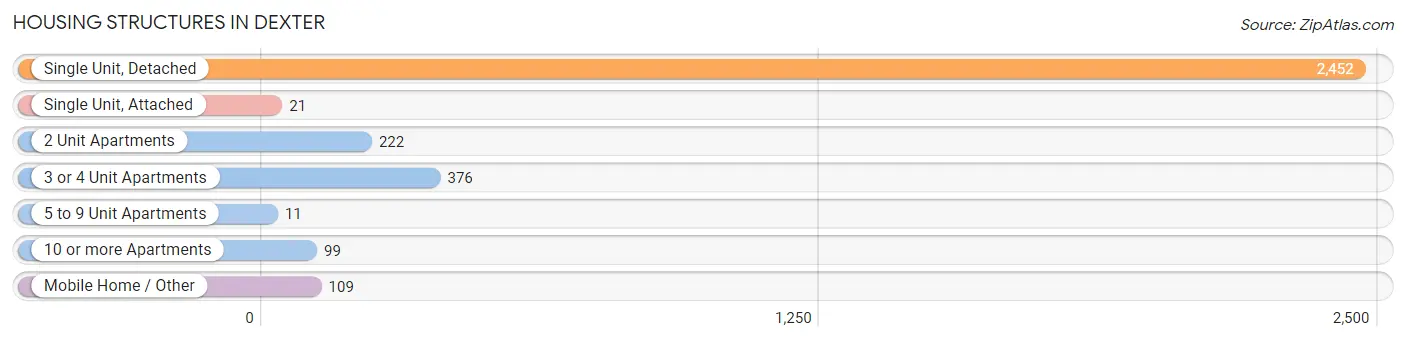
| Structure Type | # Housing Units | % Housing Units |
| Single Unit, Detached | 2,452 | 74.5% |
| Single Unit, Attached | 21 | 0.6% |
| 2 Unit Apartments | 222 | 6.8% |
| 3 or 4 Unit Apartments | 376 | 11.4% |
| 5 to 9 Unit Apartments | 11 | 0.3% |
| 10 or more Apartments | 99 | 3.0% |
| Mobile Home / Other | 109 | 3.3% |
| Total | 3,290 | 100.0% |
Housing Structures by Occupancy in Dexter
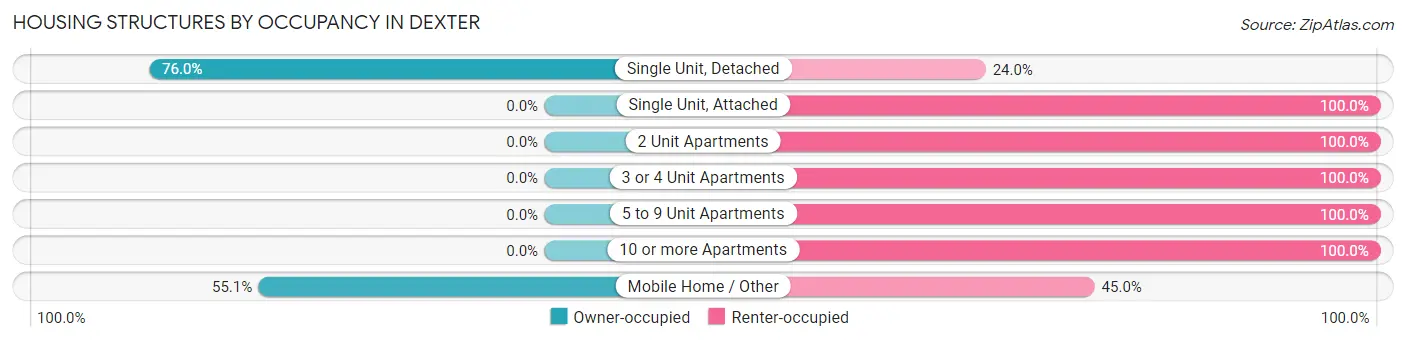
| Structure Type | Owner-occupied | Renter-occupied |
| Single Unit, Detached | 1,864 (76.0%) | 588 (24.0%) |
| Single Unit, Attached | 0 (0.0%) | 21 (100.0%) |
| 2 Unit Apartments | 0 (0.0%) | 222 (100.0%) |
| 3 or 4 Unit Apartments | 0 (0.0%) | 376 (100.0%) |
| 5 to 9 Unit Apartments | 0 (0.0%) | 11 (100.0%) |
| 10 or more Apartments | 0 (0.0%) | 99 (100.0%) |
| Mobile Home / Other | 60 (55.0%) | 49 (45.0%) |
| Total | 1,924 (58.5%) | 1,366 (41.5%) |
Housing Structures by Number of Rooms in Dexter
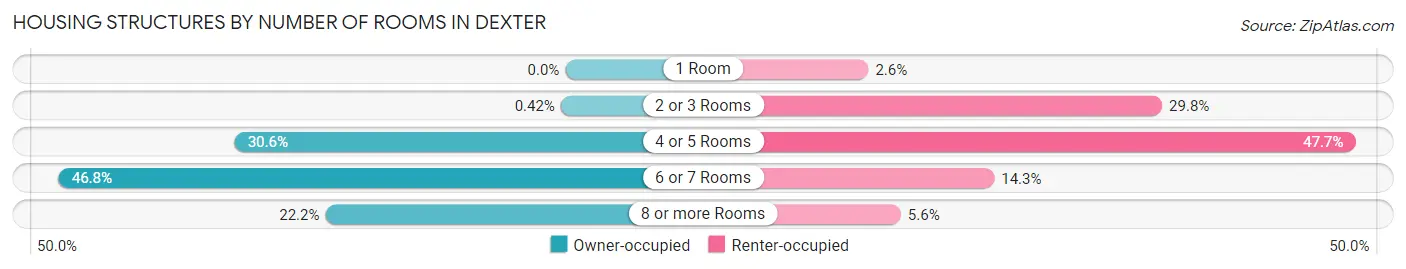
| Number of Rooms | Owner-occupied | Renter-occupied |
| 1 Room | 0 (0.0%) | 36 (2.6%) |
| 2 or 3 Rooms | 8 (0.4%) | 407 (29.8%) |
| 4 or 5 Rooms | 588 (30.6%) | 651 (47.7%) |
| 6 or 7 Rooms | 901 (46.8%) | 195 (14.3%) |
| 8 or more Rooms | 427 (22.2%) | 77 (5.6%) |
| Total | 1,924 (100.0%) | 1,366 (100.0%) |
Housing Structure by Heating Type in Dexter
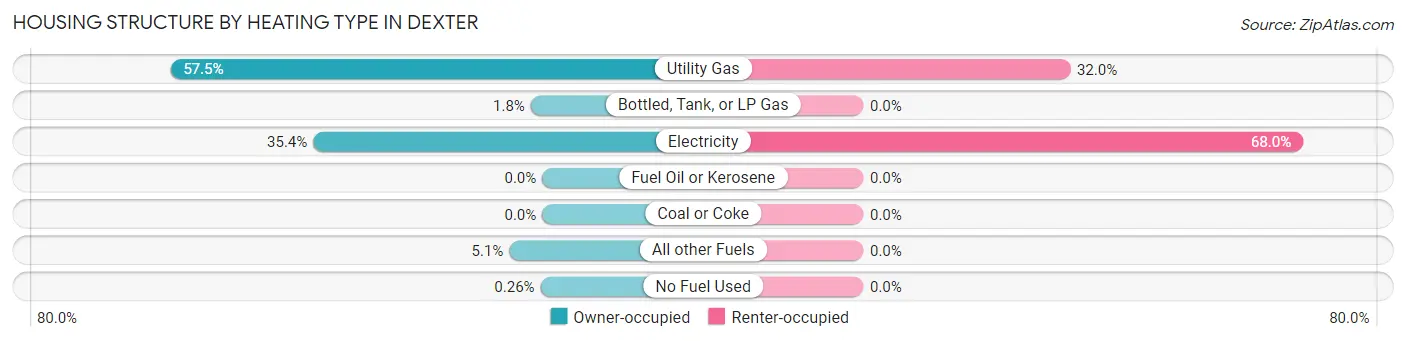
| Heating Type | Owner-occupied | Renter-occupied |
| Utility Gas | 1,106 (57.5%) | 437 (32.0%) |
| Bottled, Tank, or LP Gas | 34 (1.8%) | 0 (0.0%) |
| Electricity | 681 (35.4%) | 929 (68.0%) |
| Fuel Oil or Kerosene | 0 (0.0%) | 0 (0.0%) |
| Coal or Coke | 0 (0.0%) | 0 (0.0%) |
| All other Fuels | 98 (5.1%) | 0 (0.0%) |
| No Fuel Used | 5 (0.3%) | 0 (0.0%) |
| Total | 1,924 (100.0%) | 1,366 (100.0%) |
Household Vehicle Usage in Dexter
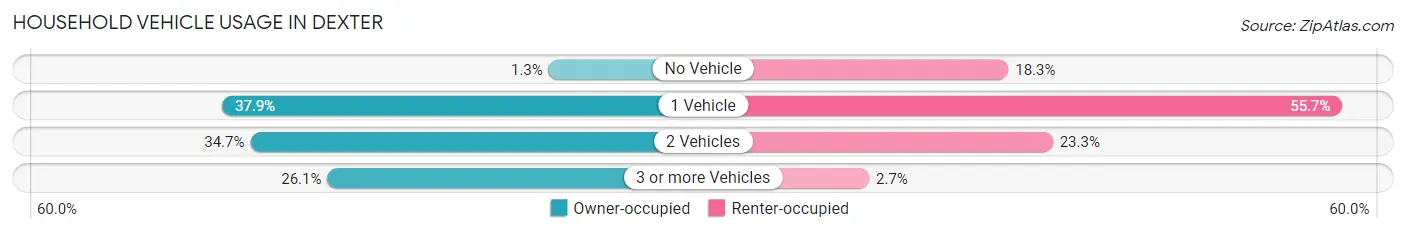
| Vehicles per Household | Owner-occupied | Renter-occupied |
| No Vehicle | 25 (1.3%) | 250 (18.3%) |
| 1 Vehicle | 729 (37.9%) | 761 (55.7%) |
| 2 Vehicles | 668 (34.7%) | 318 (23.3%) |
| 3 or more Vehicles | 502 (26.1%) | 37 (2.7%) |
| Total | 1,924 (100.0%) | 1,366 (100.0%) |
Real Estate & Mortgages in Dexter
Real Estate and Mortgage Overview in Dexter
| Characteristic | Without Mortgage | With Mortgage |
| Housing Units | 908 | 1,016 |
| Median Property Value | $99,100 | $141,900 |
| Median Household Income | $50,000 | $88 |
| Monthly Housing Costs | $409 | $14 |
| Real Estate Taxes | $1,230 | $54 |
Property Value by Mortgage Status in Dexter
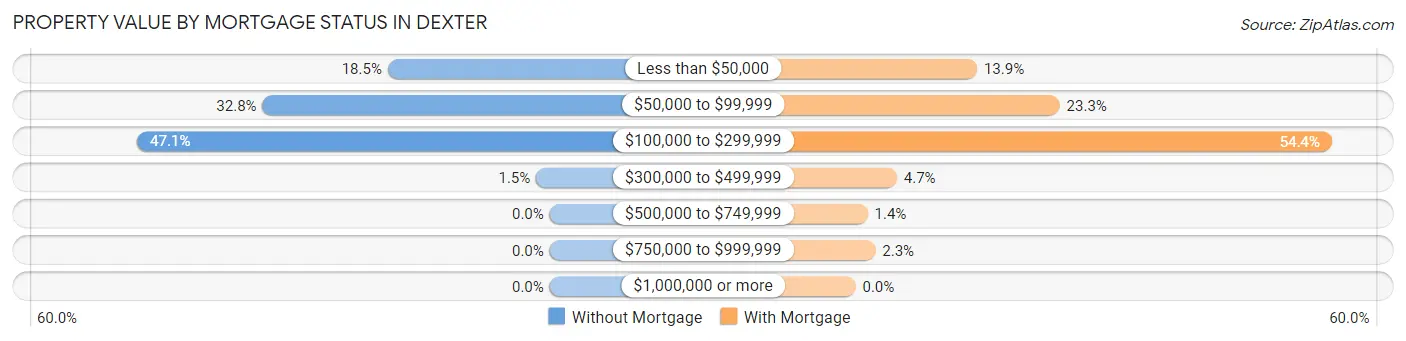
| Property Value | Without Mortgage | With Mortgage |
| Less than $50,000 | 168 (18.5%) | 141 (13.9%) |
| $50,000 to $99,999 | 298 (32.8%) | 237 (23.3%) |
| $100,000 to $299,999 | 428 (47.1%) | 553 (54.4%) |
| $300,000 to $499,999 | 14 (1.5%) | 48 (4.7%) |
| $500,000 to $749,999 | 0 (0.0%) | 14 (1.4%) |
| $750,000 to $999,999 | 0 (0.0%) | 23 (2.3%) |
| $1,000,000 or more | 0 (0.0%) | 0 (0.0%) |
| Total | 908 (100.0%) | 1,016 (100.0%) |
Household Income by Mortgage Status in Dexter
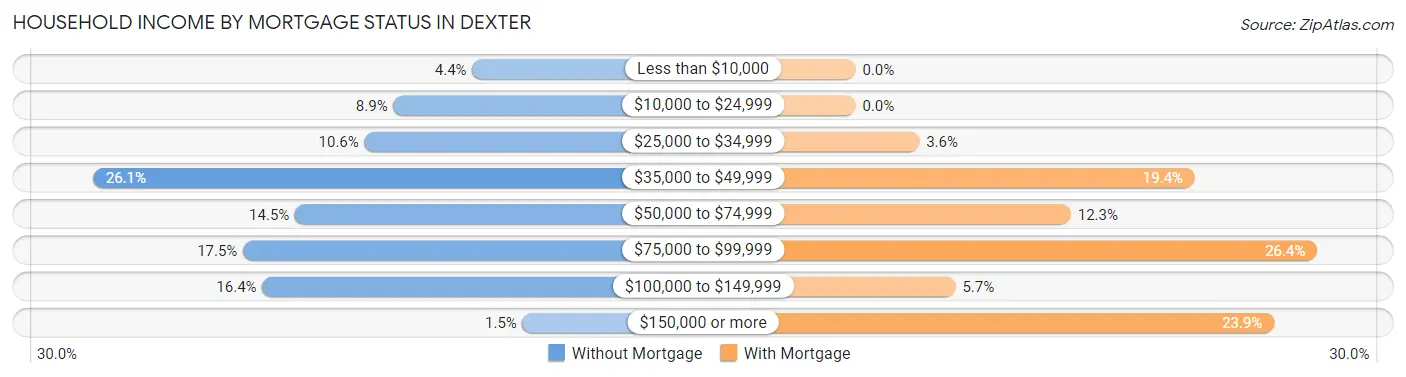
| Household Income | Without Mortgage | With Mortgage |
| Less than $10,000 | 40 (4.4%) | 0 (0.0%) |
| $10,000 to $24,999 | 81 (8.9%) | 0 (0.0%) |
| $25,000 to $34,999 | 96 (10.6%) | 37 (3.6%) |
| $35,000 to $49,999 | 237 (26.1%) | 197 (19.4%) |
| $50,000 to $74,999 | 132 (14.5%) | 125 (12.3%) |
| $75,000 to $99,999 | 159 (17.5%) | 268 (26.4%) |
| $100,000 to $149,999 | 149 (16.4%) | 58 (5.7%) |
| $150,000 or more | 14 (1.5%) | 243 (23.9%) |
| Total | 908 (100.0%) | 1,016 (100.0%) |
Property Value to Household Income Ratio in Dexter
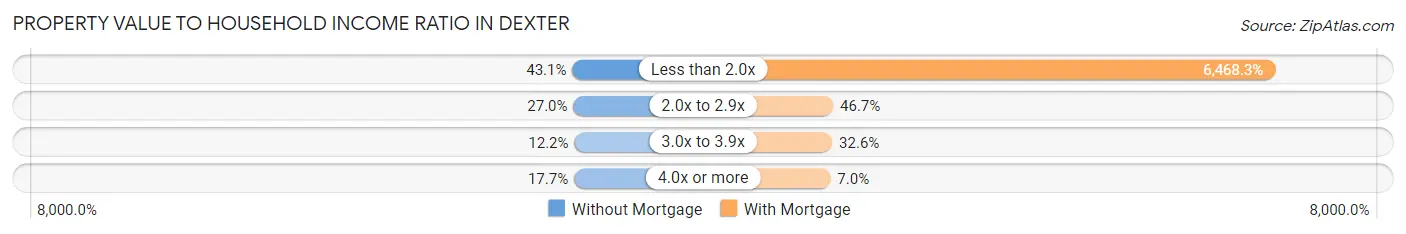
| Value-to-Income Ratio | Without Mortgage | With Mortgage |
| Less than 2.0x | 391 (43.1%) | 65,718 (6,468.3%) |
| 2.0x to 2.9x | 245 (27.0%) | 474 (46.7%) |
| 3.0x to 3.9x | 111 (12.2%) | 331 (32.6%) |
| 4.0x or more | 161 (17.7%) | 71 (7.0%) |
| Total | 908 (100.0%) | 1,016 (100.0%) |
Real Estate Taxes by Mortgage Status in Dexter
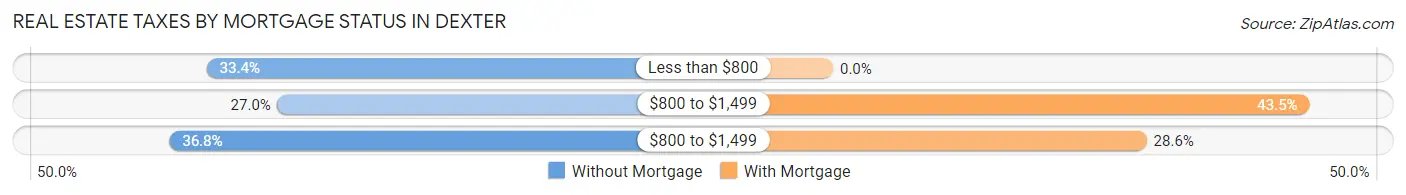
| Property Taxes | Without Mortgage | With Mortgage |
| Less than $800 | 303 (33.4%) | 0 (0.0%) |
| $800 to $1,499 | 245 (27.0%) | 442 (43.5%) |
| $800 to $1,499 | 334 (36.8%) | 291 (28.6%) |
| Total | 908 (100.0%) | 1,016 (100.0%) |
Health & Disability in Dexter
Health Insurance Coverage by Age in Dexter
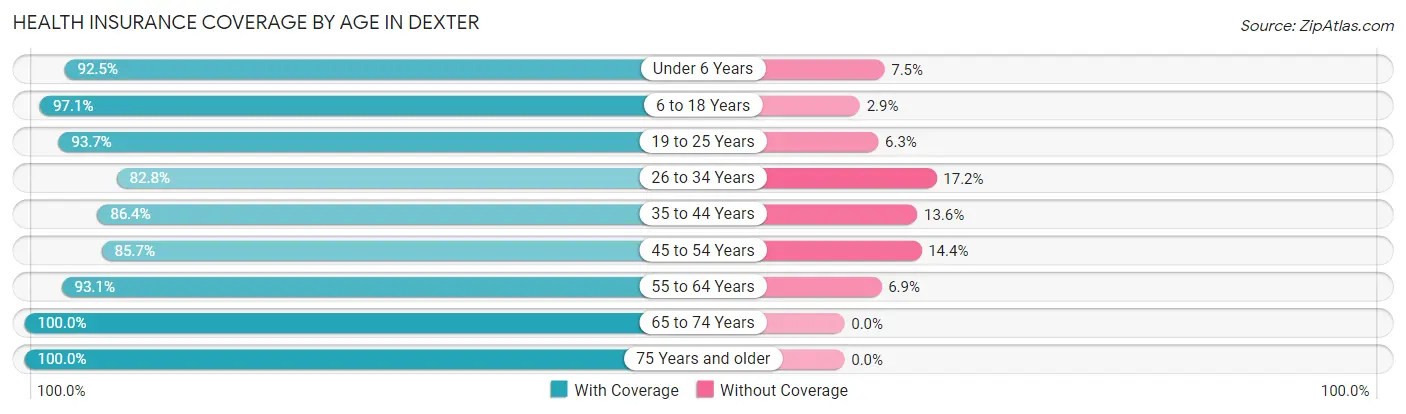
| Age Bracket | With Coverage | Without Coverage |
| Under 6 Years | 695 (92.5%) | 56 (7.5%) |
| 6 to 18 Years | 1,181 (97.1%) | 35 (2.9%) |
| 19 to 25 Years | 787 (93.7%) | 53 (6.3%) |
| 26 to 34 Years | 545 (82.8%) | 113 (17.2%) |
| 35 to 44 Years | 981 (86.4%) | 154 (13.6%) |
| 45 to 54 Years | 555 (85.7%) | 93 (14.3%) |
| 55 to 64 Years | 932 (93.1%) | 69 (6.9%) |
| 65 to 74 Years | 602 (100.0%) | 0 (0.0%) |
| 75 Years and older | 869 (100.0%) | 0 (0.0%) |
| Total | 7,147 (92.6%) | 573 (7.4%) |
Health Insurance Coverage by Citizenship Status in Dexter
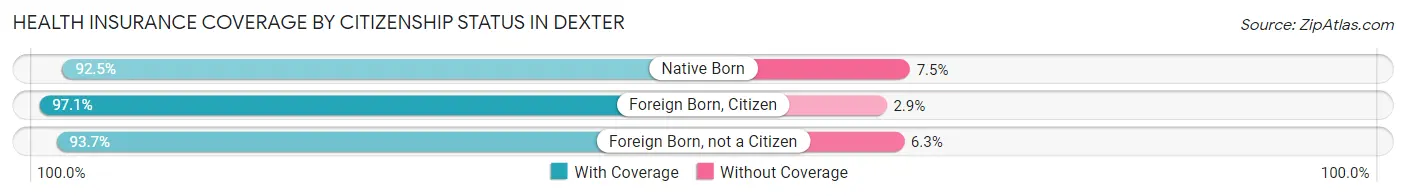
| Citizenship Status | With Coverage | Without Coverage |
| Native Born | 695 (92.5%) | 56 (7.5%) |
| Foreign Born, Citizen | 1,181 (97.1%) | 35 (2.9%) |
| Foreign Born, not a Citizen | 787 (93.7%) | 53 (6.3%) |
Health Insurance Coverage by Household Income in Dexter
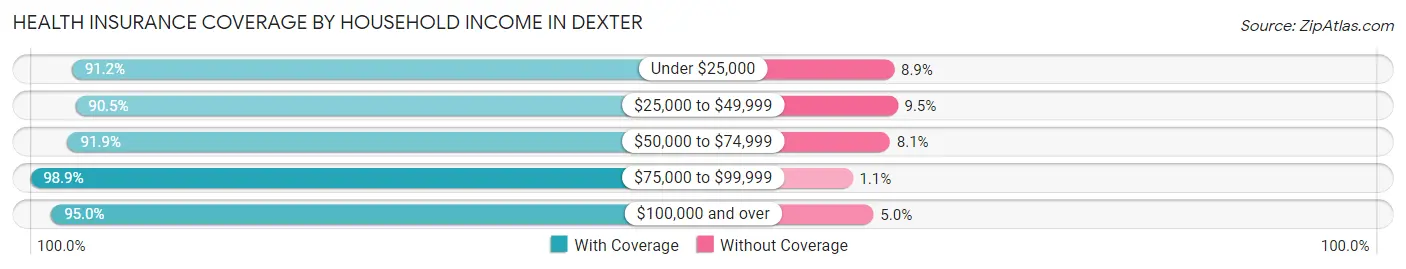
| Household Income | With Coverage | Without Coverage |
| Under $25,000 | 1,288 (91.1%) | 125 (8.8%) |
| $25,000 to $49,999 | 2,068 (90.5%) | 217 (9.5%) |
| $50,000 to $74,999 | 1,505 (91.9%) | 132 (8.1%) |
| $75,000 to $99,999 | 839 (98.9%) | 9 (1.1%) |
| $100,000 and over | 1,447 (95.0%) | 76 (5.0%) |
Public vs Private Health Insurance Coverage by Age in Dexter
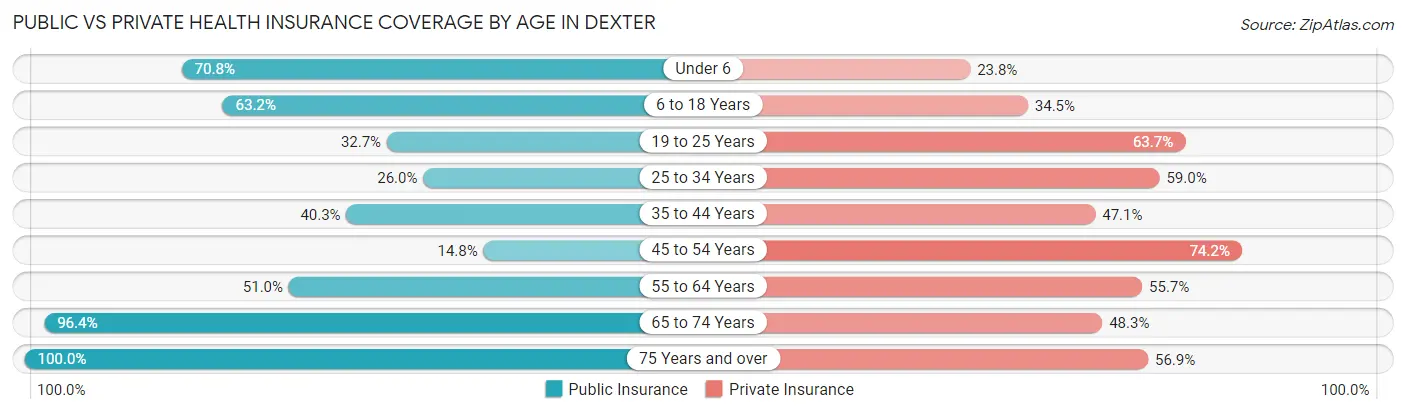
| Age Bracket | Public Insurance | Private Insurance |
| Under 6 | 532 (70.8%) | 179 (23.8%) |
| 6 to 18 Years | 769 (63.2%) | 420 (34.5%) |
| 19 to 25 Years | 275 (32.7%) | 535 (63.7%) |
| 25 to 34 Years | 171 (26.0%) | 388 (59.0%) |
| 35 to 44 Years | 457 (40.3%) | 534 (47.0%) |
| 45 to 54 Years | 96 (14.8%) | 481 (74.2%) |
| 55 to 64 Years | 510 (50.9%) | 558 (55.7%) |
| 65 to 74 Years | 580 (96.4%) | 291 (48.3%) |
| 75 Years and over | 869 (100.0%) | 494 (56.9%) |
| Total | 4,259 (55.2%) | 3,880 (50.3%) |
Disability Status by Sex by Age in Dexter
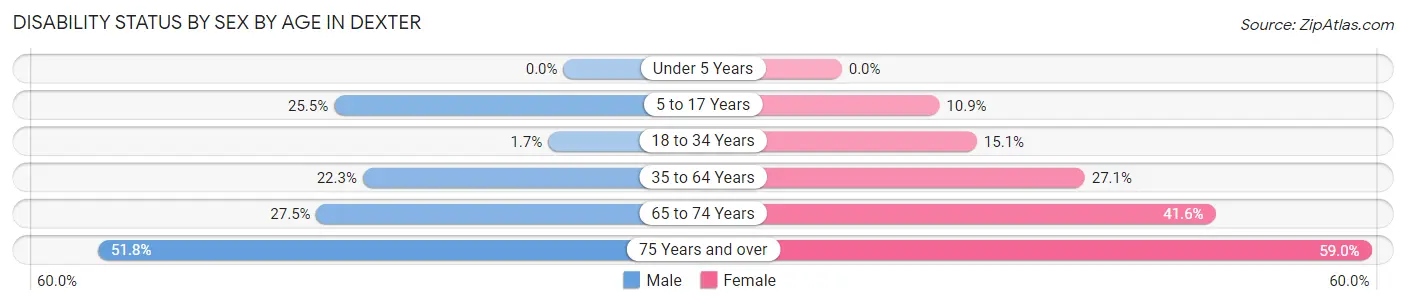
| Age Bracket | Male | Female |
| Under 5 Years | 0 (0.0%) | 0 (0.0%) |
| 5 to 17 Years | 166 (25.5%) | 74 (10.9%) |
| 18 to 34 Years | 12 (1.7%) | 126 (15.0%) |
| 35 to 64 Years | 281 (22.3%) | 413 (27.1%) |
| 65 to 74 Years | 77 (27.5%) | 134 (41.6%) |
| 75 Years and over | 185 (51.8%) | 302 (59.0%) |
Disability Class by Sex by Age in Dexter
Disability Class: Hearing Difficulty
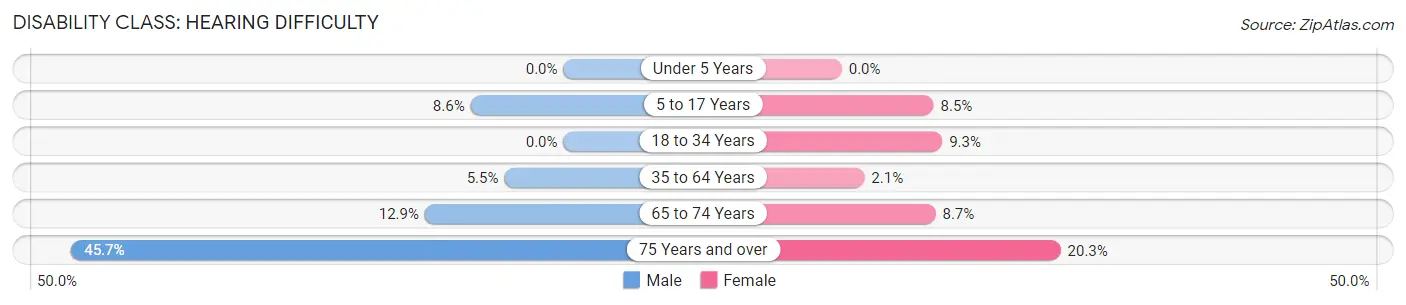
| Age Bracket | Male | Female |
| Under 5 Years | 0 (0.0%) | 0 (0.0%) |
| 5 to 17 Years | 56 (8.6%) | 58 (8.5%) |
| 18 to 34 Years | 0 (0.0%) | 78 (9.3%) |
| 35 to 64 Years | 69 (5.5%) | 32 (2.1%) |
| 65 to 74 Years | 36 (12.9%) | 28 (8.7%) |
| 75 Years and over | 163 (45.7%) | 104 (20.3%) |
Disability Class: Vision Difficulty
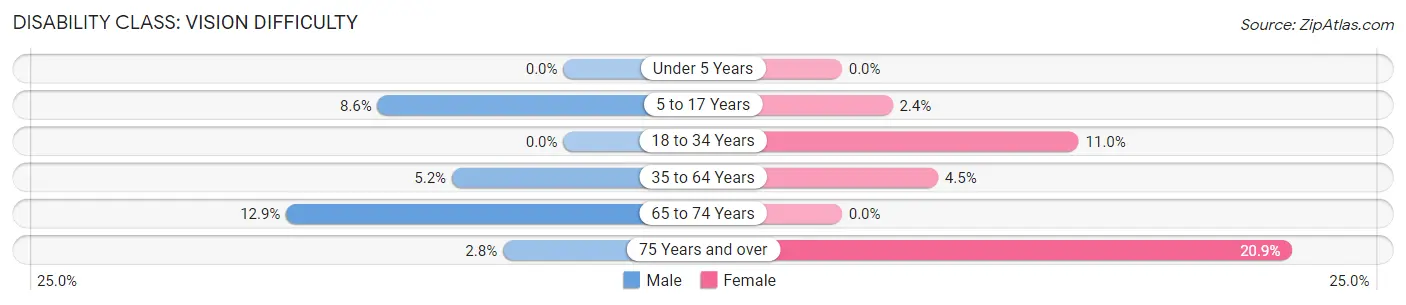
| Age Bracket | Male | Female |
| Under 5 Years | 0 (0.0%) | 0 (0.0%) |
| 5 to 17 Years | 56 (8.6%) | 16 (2.4%) |
| 18 to 34 Years | 0 (0.0%) | 92 (11.0%) |
| 35 to 64 Years | 65 (5.2%) | 68 (4.5%) |
| 65 to 74 Years | 36 (12.9%) | 0 (0.0%) |
| 75 Years and over | 10 (2.8%) | 107 (20.9%) |
Disability Class: Cognitive Difficulty
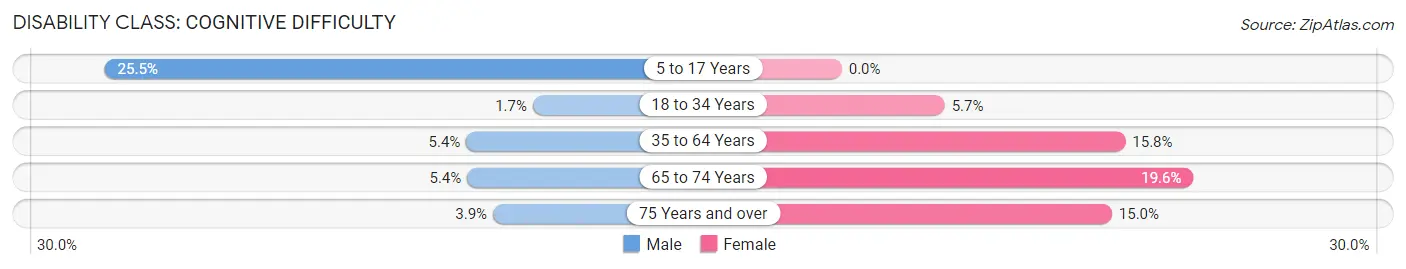
| Age Bracket | Male | Female |
| 5 to 17 Years | 166 (25.5%) | 0 (0.0%) |
| 18 to 34 Years | 12 (1.7%) | 48 (5.7%) |
| 35 to 64 Years | 68 (5.4%) | 241 (15.8%) |
| 65 to 74 Years | 15 (5.4%) | 63 (19.6%) |
| 75 Years and over | 14 (3.9%) | 77 (15.0%) |
Disability Class: Ambulatory Difficulty
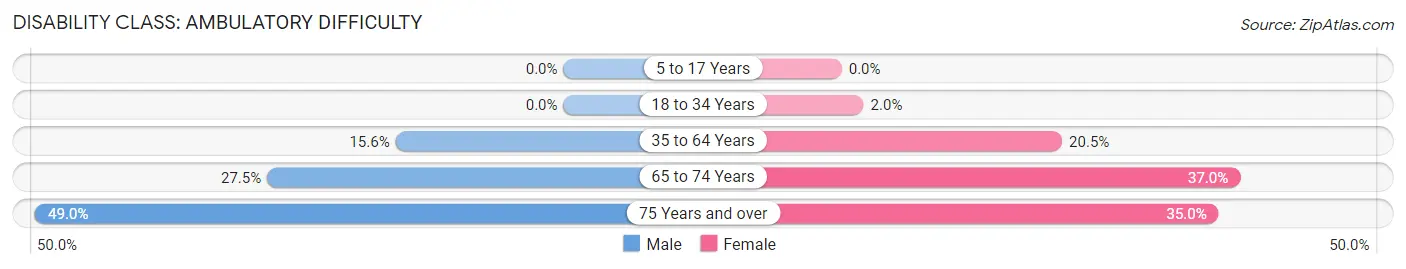
| Age Bracket | Male | Female |
| 5 to 17 Years | 0 (0.0%) | 0 (0.0%) |
| 18 to 34 Years | 0 (0.0%) | 17 (2.0%) |
| 35 to 64 Years | 196 (15.6%) | 312 (20.4%) |
| 65 to 74 Years | 77 (27.5%) | 119 (37.0%) |
| 75 Years and over | 175 (49.0%) | 179 (35.0%) |
Disability Class: Self-Care Difficulty
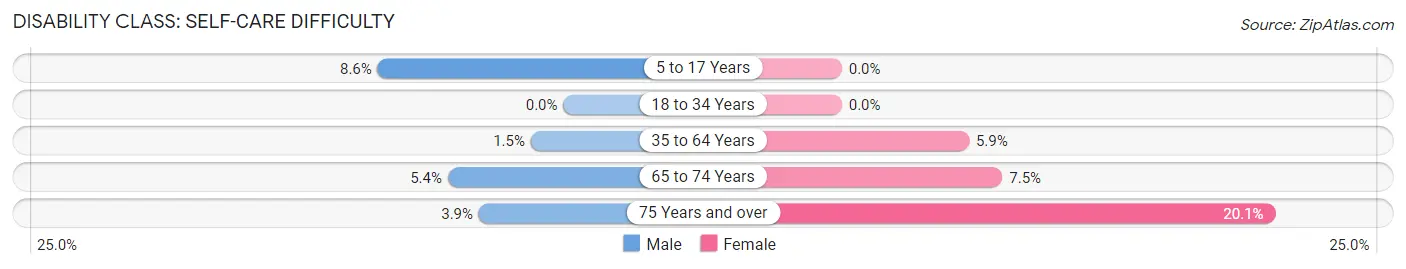
| Age Bracket | Male | Female |
| 5 to 17 Years | 56 (8.6%) | 0 (0.0%) |
| 18 to 34 Years | 0 (0.0%) | 0 (0.0%) |
| 35 to 64 Years | 19 (1.5%) | 90 (5.9%) |
| 65 to 74 Years | 15 (5.4%) | 24 (7.4%) |
| 75 Years and over | 14 (3.9%) | 103 (20.1%) |
Technology Access in Dexter
Computing Device Access in Dexter
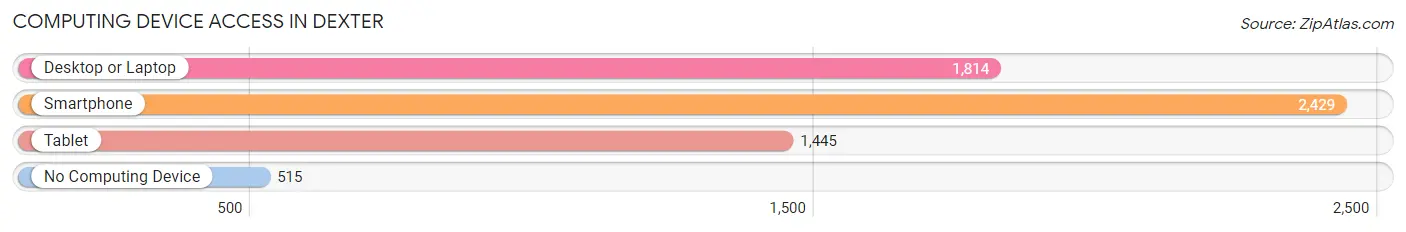
| Device Type | # Households | % Households |
| Desktop or Laptop | 1,814 | 55.1% |
| Smartphone | 2,429 | 73.8% |
| Tablet | 1,445 | 43.9% |
| No Computing Device | 515 | 15.7% |
| Total | 3,290 | 100.0% |
Internet Access in Dexter
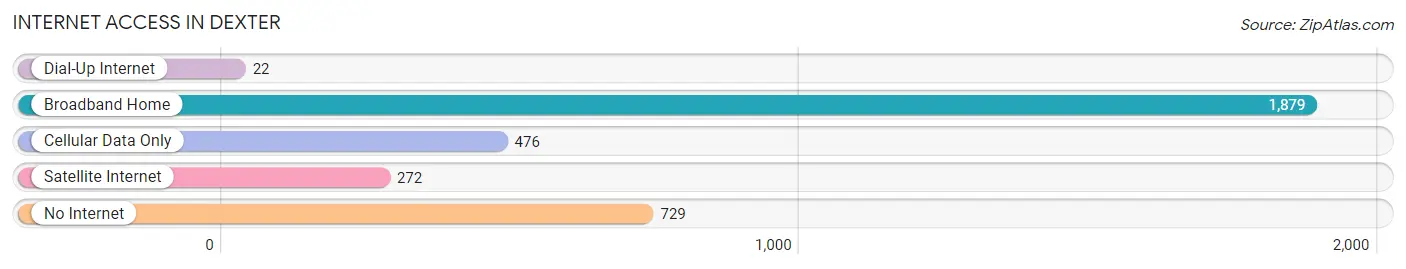
| Internet Type | # Households | % Households |
| Dial-Up Internet | 22 | 0.7% |
| Broadband Home | 1,879 | 57.1% |
| Cellular Data Only | 476 | 14.5% |
| Satellite Internet | 272 | 8.3% |
| No Internet | 729 | 22.2% |
| Total | 3,290 | 100.0% |
Dexter Summary
Dexter, Missouri is a small city located in Stoddard County in the southeastern corner of the state. It is situated on the banks of the St. Francis River and is home to a population of approximately 8,000 people. The city is known for its rich history, diverse geography, and vibrant economy.
History
The area that is now Dexter was first settled in the early 1800s by a group of settlers from Kentucky. The town was originally known as “New Kentucky” and was later renamed “Dexter” in honor of a local doctor. The town was officially incorporated in 1873 and quickly grew to become a thriving agricultural center. In the late 19th century, the town was home to several cotton gins, a sawmill, and a gristmill.
In the early 20th century, the town experienced a period of growth and prosperity. The St. Francis River was dredged to create a navigable channel, allowing for the transport of goods and services. The town also became a hub for the railroad industry, with several lines running through the city.
Geography
Dexter is located in the southeastern corner of Missouri, near the Arkansas and Tennessee borders. The city is situated on the banks of the St. Francis River and is surrounded by rolling hills and wooded areas. The city is located in the Ozark Plateau region of the state, which is characterized by its rugged terrain and lush vegetation.
The climate in Dexter is humid subtropical, with hot, humid summers and mild winters. The average annual temperature is around 60 degrees Fahrenheit, with an average annual precipitation of around 40 inches.
Economy
The economy of Dexter is largely based on agriculture and manufacturing. The city is home to several large agricultural operations, including poultry farms, cattle ranches, and cotton farms. The city is also home to several manufacturing companies, including a furniture factory, a plastics plant, and a paper mill.
The city is also home to several retail stores, restaurants, and other businesses. The city is served by several major highways, including Interstate 55 and U.S. Route 60.
Demographics
As of the 2010 census, the population of Dexter was 8,039. The racial makeup of the city was 79.3% White, 17.2% African American, 0.3% Native American, 0.5% Asian, 0.1% Pacific Islander, and 2.6% from other races. The median household income was $35,945, and the median family income was $41,945.
Conclusion
Dexter, Missouri is a small city located in Stoddard County in the southeastern corner of the state. It is situated on the banks of the St. Francis River and is home to a population of approximately 8,000 people. The city is known for its rich history, diverse geography, and vibrant economy. The economy of Dexter is largely based on agriculture and manufacturing, and the city is served by several major highways. The population of Dexter is largely white, with a median household income of $35,945.
Common Questions
What is Per Capita Income in Dexter?
Per Capita income in Dexter is $23,638.
What is the Median Family Income in Dexter?
Median Family Income in Dexter is $65,428.
What is the Median Household income in Dexter?
Median Household Income in Dexter is $45,617.
What is Income or Wage Gap in Dexter?
Income or Wage Gap in Dexter is 40.0%.
Women in Dexter earn 60.0 cents for every dollar earned by a man.
What is Inequality or Gini Index in Dexter?
Inequality or Gini Index in Dexter is 0.41.
What is the Total Population of Dexter?
Total Population of Dexter is 7,910.
What is the Total Male Population of Dexter?
Total Male Population of Dexter is 3,578.
What is the Total Female Population of Dexter?
Total Female Population of Dexter is 4,332.
What is the Ratio of Males per 100 Females in Dexter?
There are 82.59 Males per 100 Females in Dexter.
What is the Ratio of Females per 100 Males in Dexter?
There are 121.07 Females per 100 Males in Dexter.
What is the Median Population Age in Dexter?
Median Population Age in Dexter is 38.8 Years.
What is the Average Family Size in Dexter
Average Family Size in Dexter is 3.2 People.
What is the Average Household Size in Dexter
Average Household Size in Dexter is 2.3 People.
How Large is the Labor Force in Dexter?
There are 3,153 People in the Labor Forcein in Dexter.
What is the Percentage of People in the Labor Force in Dexter?
51.2% of People are in the Labor Force in Dexter.
What is the Unemployment Rate in Dexter?
Unemployment Rate in Dexter is 0.9%.