Cuba, MO Map & Demographics
Cuba Map
Cuba Overview
$22,351
PER CAPITA INCOME
$53,382
AVG FAMILY INCOME
$42,641
AVG HOUSEHOLD INCOME
29.3%
WAGE / INCOME GAP [ % ]
70.7¢/ $1
WAGE / INCOME GAP [ $ ]
0.48
INEQUALITY / GINI INDEX
3,173
TOTAL POPULATION
1,489
MALE POPULATION
1,684
FEMALE POPULATION
88.42
MALES / 100 FEMALES
113.10
FEMALES / 100 MALES
36.9
MEDIAN AGE
3.2
AVG FAMILY SIZE
2.7
AVG HOUSEHOLD SIZE
1,276
LABOR FORCE [ PEOPLE ]
50.1%
PERCENT IN LABOR FORCE
Cuba Zip Codes
Cuba Area Codes
Income in Cuba
Income Overview in Cuba
Per Capita Income in Cuba is $22,351, while median incomes of families and households are $53,382 and $42,641 respectively.
| Characteristic | Number | Measure |
| Per Capita Income | 3,173 | $22,351 |
| Median Family Income | 716 | $53,382 |
| Mean Family Income | 716 | $65,713 |
| Median Household Income | 1,151 | $42,641 |
| Mean Household Income | 1,151 | $57,851 |
| Income Deficit | 716 | $0 |
| Wage / Income Gap (%) | 3,173 | 29.34% |
| Wage / Income Gap ($) | 3,173 | 70.66¢ per $1 |
| Gini / Inequality Index | 3,173 | 0.48 |
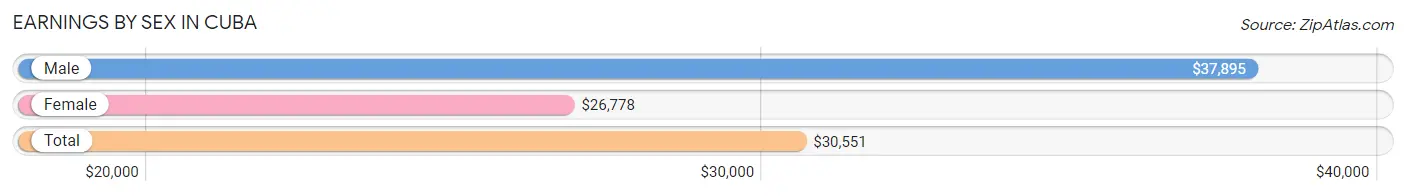
Earnings by Sex in Cuba
Average Earnings in Cuba are $30,551, $37,895 for men and $26,778 for women, a difference of 29.3%.
| Sex | Number | Average Earnings |
| Male | 614 (45.6%) | $37,895 |
| Female | 734 (54.4%) | $26,778 |
| Total | 1,348 (100.0%) | $30,551 |
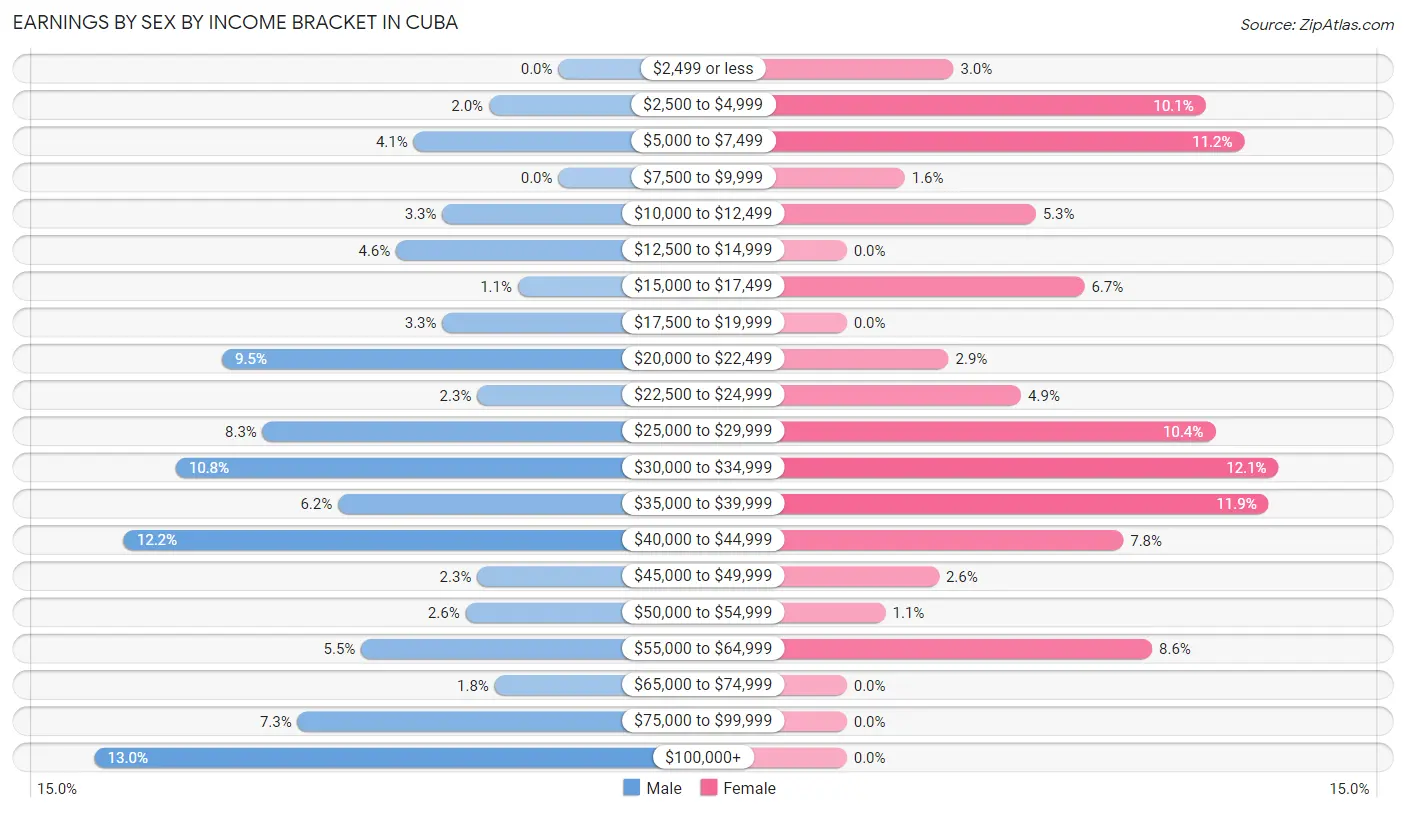
Earnings by Sex by Income Bracket in Cuba
The most common earnings brackets in Cuba are $100,000+ for men (80 | 13.0%) and $30,000 to $34,999 for women (89 | 12.1%).
| Income | Male | Female |
| $2,499 or less | 0 (0.0%) | 22 (3.0%) |
| $2,500 to $4,999 | 12 (1.9%) | 74 (10.1%) |
| $5,000 to $7,499 | 25 (4.1%) | 82 (11.2%) |
| $7,500 to $9,999 | 0 (0.0%) | 12 (1.6%) |
| $10,000 to $12,499 | 20 (3.3%) | 39 (5.3%) |
| $12,500 to $14,999 | 28 (4.6%) | 0 (0.0%) |
| $15,000 to $17,499 | 7 (1.1%) | 49 (6.7%) |
| $17,500 to $19,999 | 20 (3.3%) | 0 (0.0%) |
| $20,000 to $22,499 | 58 (9.5%) | 21 (2.9%) |
| $22,500 to $24,999 | 14 (2.3%) | 36 (4.9%) |
| $25,000 to $29,999 | 51 (8.3%) | 76 (10.3%) |
| $30,000 to $34,999 | 66 (10.7%) | 89 (12.1%) |
| $35,000 to $39,999 | 38 (6.2%) | 87 (11.8%) |
| $40,000 to $44,999 | 75 (12.2%) | 57 (7.8%) |
| $45,000 to $49,999 | 14 (2.3%) | 19 (2.6%) |
| $50,000 to $54,999 | 16 (2.6%) | 8 (1.1%) |
| $55,000 to $64,999 | 34 (5.5%) | 63 (8.6%) |
| $65,000 to $74,999 | 11 (1.8%) | 0 (0.0%) |
| $75,000 to $99,999 | 45 (7.3%) | 0 (0.0%) |
| $100,000+ | 80 (13.0%) | 0 (0.0%) |
| Total | 614 (100.0%) | 734 (100.0%) |
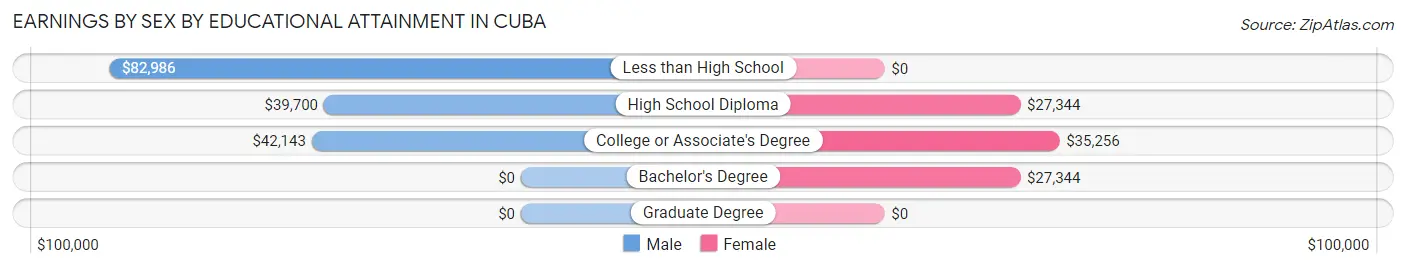
Earnings by Sex by Educational Attainment in Cuba
Average earnings in Cuba are $40,711 for men and $29,960 for women, a difference of 26.4%. Men with an educational attainment of less than high school enjoy the highest average annual earnings of $82,986, while those with high school diploma education earn the least with $39,700. Women with an educational attainment of college or associate's degree earn the most with the average annual earnings of $35,256, while those with high school diploma education have the smallest earnings of $27,344.
| Educational Attainment | Male Income | Female Income |
| Less than High School | $82,986 | $0 |
| High School Diploma | $39,700 | $27,344 |
| College or Associate's Degree | $42,143 | $35,256 |
| Bachelor's Degree | - | - |
| Graduate Degree | - | - |
| Total | $40,711 | $29,960 |
Family Income in Cuba
Family Income Brackets in Cuba
According to the Cuba family income data, there are 168 families falling into the $50,000 to $74,999 income range, which is the most common income bracket and makes up 23.5% of all families. Conversely, the $15,000 to $24,999 income bracket is the least frequent group with only 2 families (0.3%) belonging to this category.
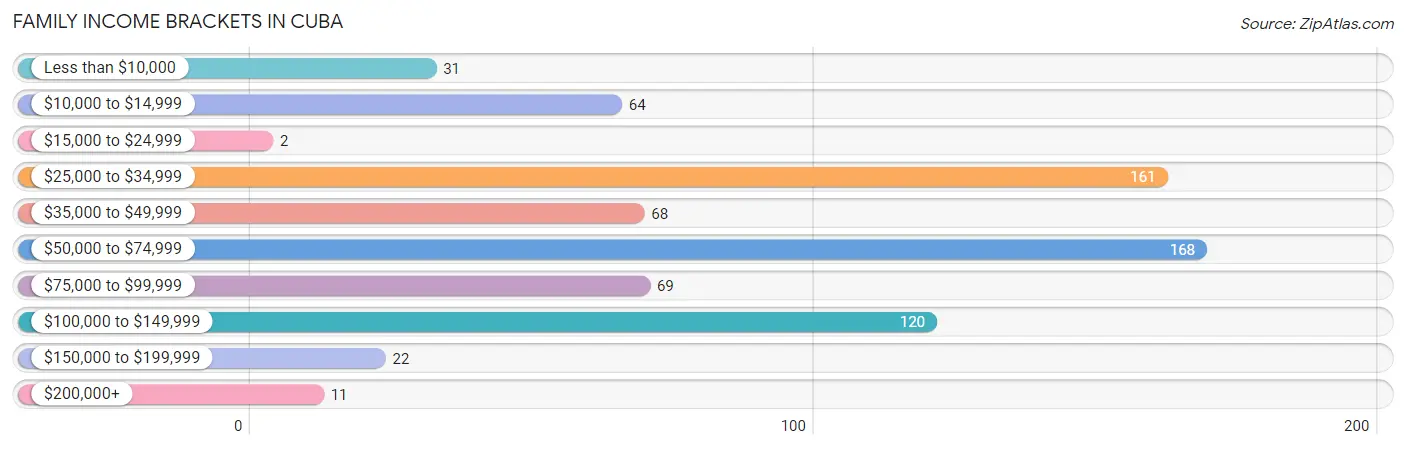
| Income Bracket | # Families | % Families |
| Less than $10,000 | 31 | 4.3% |
| $10,000 to $14,999 | 64 | 8.9% |
| $15,000 to $24,999 | 2 | 0.3% |
| $25,000 to $34,999 | 161 | 22.5% |
| $35,000 to $49,999 | 68 | 9.5% |
| $50,000 to $74,999 | 168 | 23.5% |
| $75,000 to $99,999 | 69 | 9.6% |
| $100,000 to $149,999 | 120 | 16.8% |
| $150,000 to $199,999 | 22 | 3.1% |
| $200,000+ | 11 | 1.5% |
Family Income by Famaliy Size in Cuba
3-person families (88 | 12.3%) account for the highest median family income in Cuba with $73,397 per family, while 3-person families (88 | 12.3%) have the highest median income of $24,466 per family member.
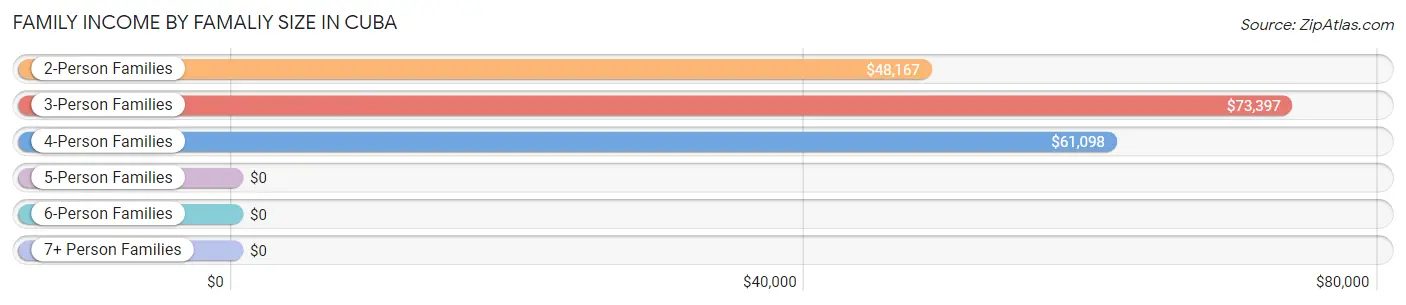
| Income Bracket | # Families | Median Income |
| 2-Person Families | 444 (62.0%) | $48,167 |
| 3-Person Families | 88 (12.3%) | $73,397 |
| 4-Person Families | 167 (23.3%) | $61,098 |
| 5-Person Families | 8 (1.1%) | $0 |
| 6-Person Families | 0 (0.0%) | $0 |
| 7+ Person Families | 9 (1.3%) | $0 |
| Total | 716 (100.0%) | $53,382 |
Family Income by Number of Earners in Cuba
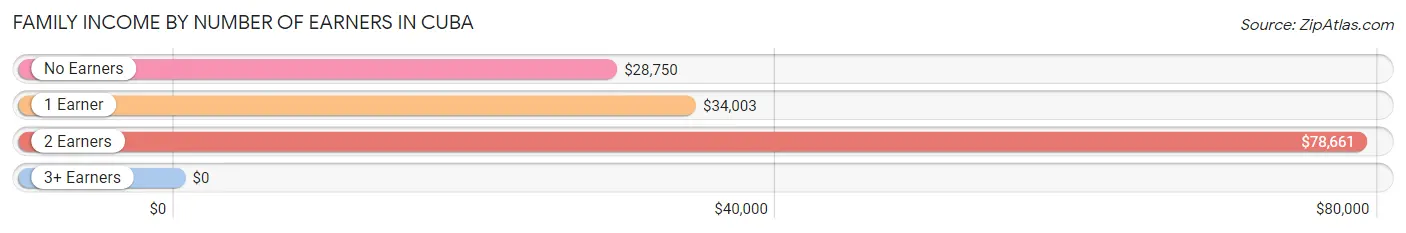
| Number of Earners | # Families | Median Income |
| No Earners | 112 (15.6%) | $28,750 |
| 1 Earner | 311 (43.4%) | $34,003 |
| 2 Earners | 263 (36.7%) | $78,661 |
| 3+ Earners | 30 (4.2%) | $0 |
| Total | 716 (100.0%) | $53,382 |
Household Income in Cuba
Household Income Brackets in Cuba
With 218 households falling in the category, the $50,000 to $74,999 income range is the most frequent in Cuba, accounting for 18.9% of all households. In contrast, only 22 households (1.9%) fall into the $150,000 to $199,999 income bracket, making it the least populous group.
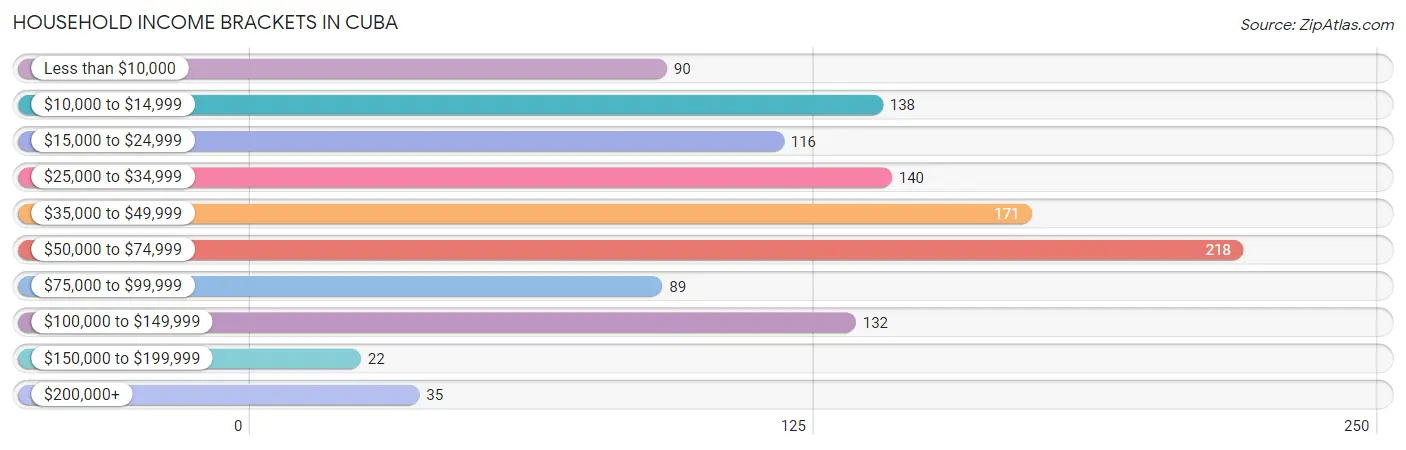
| Income Bracket | # Households | % Households |
| Less than $10,000 | 90 | 7.8% |
| $10,000 to $14,999 | 138 | 12.0% |
| $15,000 to $24,999 | 116 | 10.1% |
| $25,000 to $34,999 | 140 | 12.2% |
| $35,000 to $49,999 | 171 | 14.9% |
| $50,000 to $74,999 | 218 | 18.9% |
| $75,000 to $99,999 | 89 | 7.7% |
| $100,000 to $149,999 | 132 | 11.5% |
| $150,000 to $199,999 | 22 | 1.9% |
| $200,000+ | 35 | 3.0% |
Household Income by Householder Age in Cuba
The median household income in Cuba is $42,641, with the highest median household income of $73,207 found in the 45 to 64 years age bracket for the primary householder. A total of 336 households (29.2%) fall into this category. Meanwhile, the 65+ years age bracket for the primary householder has the lowest median household income of $32,500, with 290 households (25.2%) in this group.
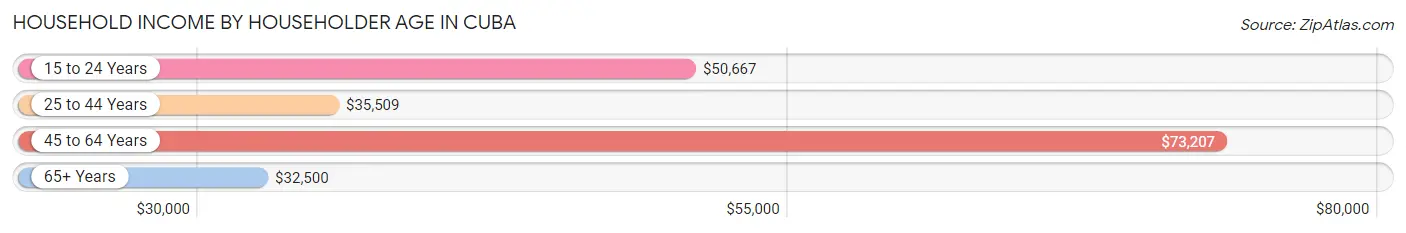
| Income Bracket | # Households | Median Income |
| 15 to 24 Years | 90 (7.8%) | $50,667 |
| 25 to 44 Years | 435 (37.8%) | $35,509 |
| 45 to 64 Years | 336 (29.2%) | $73,207 |
| 65+ Years | 290 (25.2%) | $32,500 |
| Total | 1,151 (100.0%) | $42,641 |
Poverty in Cuba
Income Below Poverty by Sex and Age in Cuba
With 19.3% poverty level for males and 18.3% for females among the residents of Cuba, under 5 year old males and 5 year old females are the most vulnerable to poverty, with 19 males (65.5%) and 5 females (100.0%) in their respective age groups living below the poverty level.
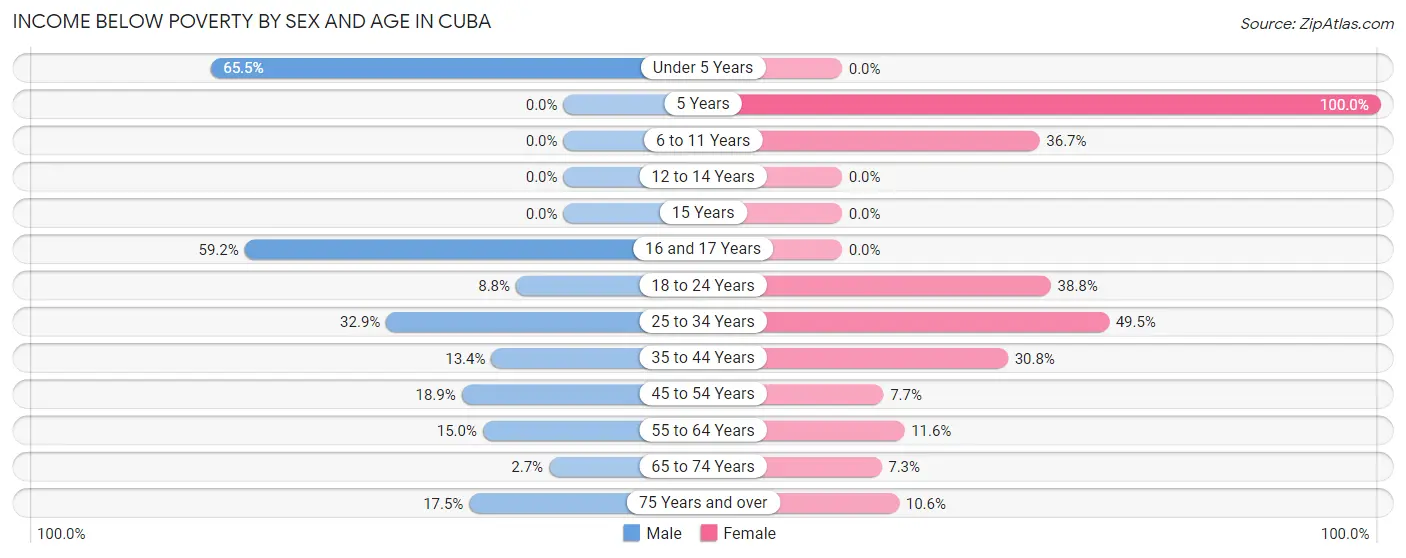
| Age Bracket | Male | Female |
| Under 5 Years | 19 (65.5%) | 0 (0.0%) |
| 5 Years | 0 (0.0%) | 5 (100.0%) |
| 6 to 11 Years | 0 (0.0%) | 22 (36.7%) |
| 12 to 14 Years | 0 (0.0%) | 0 (0.0%) |
| 15 Years | 0 (0.0%) | 0 (0.0%) |
| 16 and 17 Years | 87 (59.2%) | 0 (0.0%) |
| 18 to 24 Years | 18 (8.8%) | 50 (38.8%) |
| 25 to 34 Years | 50 (32.9%) | 54 (49.5%) |
| 35 to 44 Years | 21 (13.4%) | 97 (30.8%) |
| 45 to 54 Years | 24 (18.9%) | 10 (7.7%) |
| 55 to 64 Years | 29 (14.9%) | 30 (11.6%) |
| 65 to 74 Years | 2 (2.7%) | 11 (7.3%) |
| 75 Years and over | 18 (17.5%) | 11 (10.6%) |
| Total | 268 (19.3%) | 290 (18.3%) |
Income Above Poverty by Sex and Age in Cuba
According to the poverty statistics in Cuba, males aged 6 to 11 years and females aged under 5 years are the age groups that are most secure financially, with 100.0% of males and 100.0% of females in these age groups living above the poverty line.
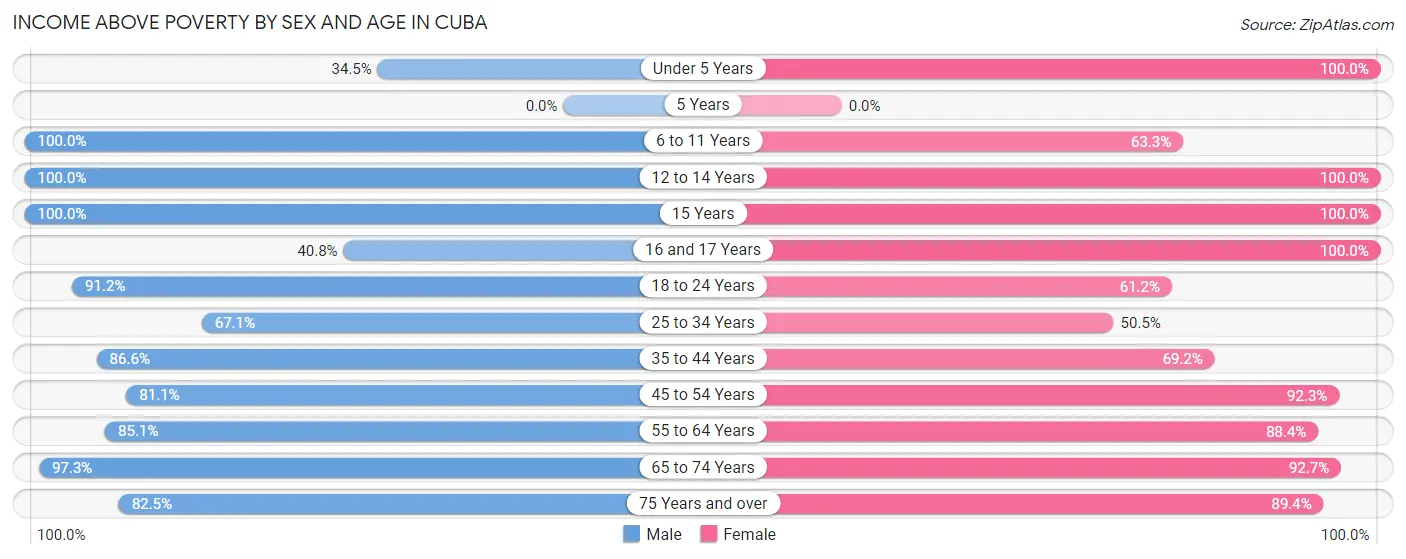
| Age Bracket | Male | Female |
| Under 5 Years | 10 (34.5%) | 42 (100.0%) |
| 5 Years | 0 (0.0%) | 0 (0.0%) |
| 6 to 11 Years | 41 (100.0%) | 38 (63.3%) |
| 12 to 14 Years | 86 (100.0%) | 126 (100.0%) |
| 15 Years | 74 (100.0%) | 46 (100.0%) |
| 16 and 17 Years | 60 (40.8%) | 113 (100.0%) |
| 18 to 24 Years | 186 (91.2%) | 79 (61.2%) |
| 25 to 34 Years | 102 (67.1%) | 55 (50.5%) |
| 35 to 44 Years | 136 (86.6%) | 218 (69.2%) |
| 45 to 54 Years | 103 (81.1%) | 120 (92.3%) |
| 55 to 64 Years | 165 (85.1%) | 229 (88.4%) |
| 65 to 74 Years | 73 (97.3%) | 139 (92.7%) |
| 75 Years and over | 85 (82.5%) | 93 (89.4%) |
| Total | 1,121 (80.7%) | 1,298 (81.7%) |
Income Below Poverty Among Married-Couple Families in Cuba
The poverty statistics for married-couple families in Cuba show that 0.5% or 2 of the total 426 families live below the poverty line. Families with no children have the highest poverty rate of 0.7%, comprising of 2 families. On the other hand, families with 1 or 2 children have the lowest poverty rate of 0.0%, which includes 0 families.
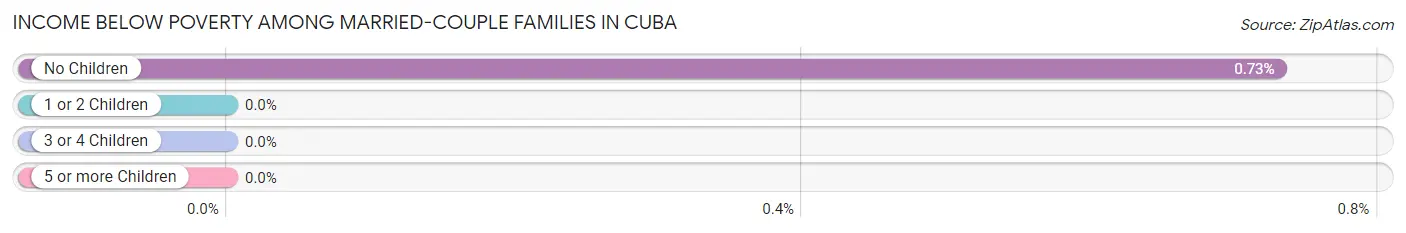
| Children | Above Poverty | Below Poverty |
| No Children | 272 (99.3%) | 2 (0.7%) |
| 1 or 2 Children | 144 (100.0%) | 0 (0.0%) |
| 3 or 4 Children | 8 (100.0%) | 0 (0.0%) |
| 5 or more Children | 0 (0.0%) | 0 (0.0%) |
| Total | 424 (99.5%) | 2 (0.5%) |
Income Below Poverty Among Single-Parent Households in Cuba
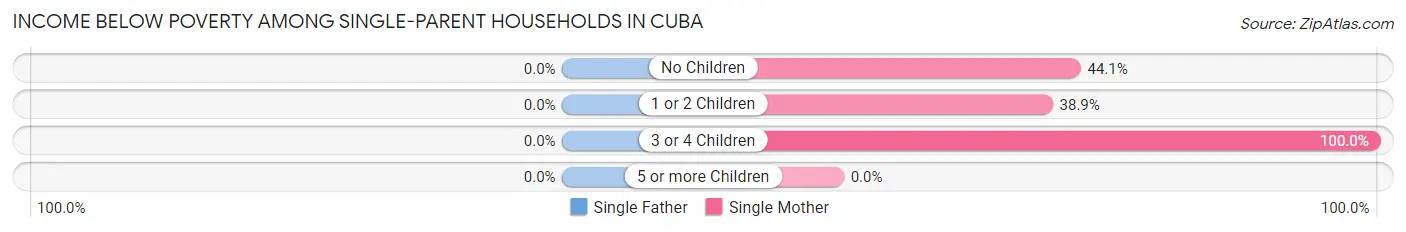
| Children | Single Father | Single Mother |
| No Children | 0 (0.0%) | 30 (44.1%) |
| 1 or 2 Children | 0 (0.0%) | 65 (38.9%) |
| 3 or 4 Children | 0 (0.0%) | 9 (100.0%) |
| 5 or more Children | 0 (0.0%) | 0 (0.0%) |
| Total | 0 (0.0%) | 104 (42.6%) |
Income Below Poverty Among Married-Couple vs Single-Parent Households in Cuba
The poverty data for Cuba shows that 2 of the married-couple family households (0.5%) and 104 of the single-parent households (35.9%) are living below the poverty level. Within the married-couple family households, those with no children have the highest poverty rate, with 2 households (0.7%) falling below the poverty line. Among the single-parent households, those with 3 or 4 children have the highest poverty rate, with 9 household (100.0%) living below poverty.
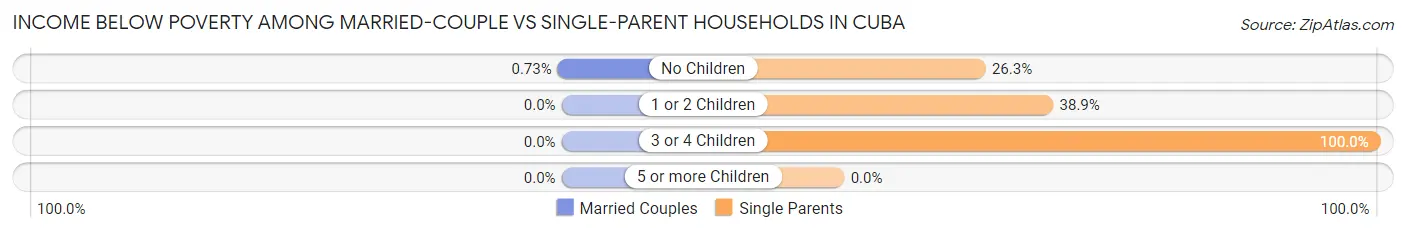
| Children | Married-Couple Families | Single-Parent Households |
| No Children | 2 (0.7%) | 30 (26.3%) |
| 1 or 2 Children | 0 (0.0%) | 65 (38.9%) |
| 3 or 4 Children | 0 (0.0%) | 9 (100.0%) |
| 5 or more Children | 0 (0.0%) | 0 (0.0%) |
| Total | 2 (0.5%) | 104 (35.9%) |
Race in Cuba
The most populous races in Cuba are White / Caucasian (2,942 | 92.7%), Hispanic or Latino (210 | 6.6%), and Two or more Races (178 | 5.6%).
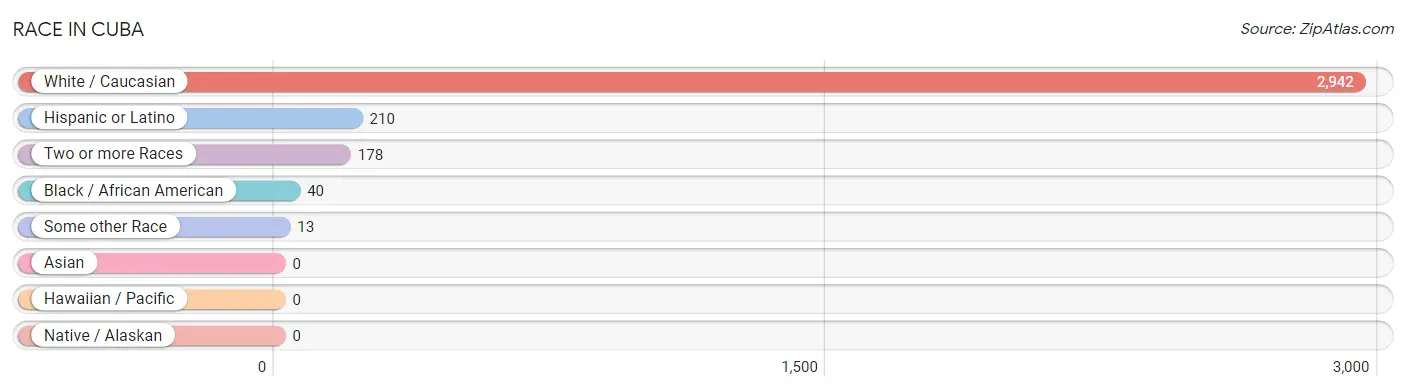
| Race | # Population | % Population |
| Asian | 0 | 0.0% |
| Black / African American | 40 | 1.3% |
| Hawaiian / Pacific | 0 | 0.0% |
| Hispanic or Latino | 210 | 6.6% |
| Native / Alaskan | 0 | 0.0% |
| White / Caucasian | 2,942 | 92.7% |
| Two or more Races | 178 | 5.6% |
| Some other Race | 13 | 0.4% |
| Total | 3,173 | 100.0% |
Ancestry in Cuba
The most populous ancestries reported in Cuba are German (387 | 12.2%), English (341 | 10.7%), Irish (315 | 9.9%), Mexican (210 | 6.6%), and American (199 | 6.3%), together accounting for 45.8% of all Cuba residents.
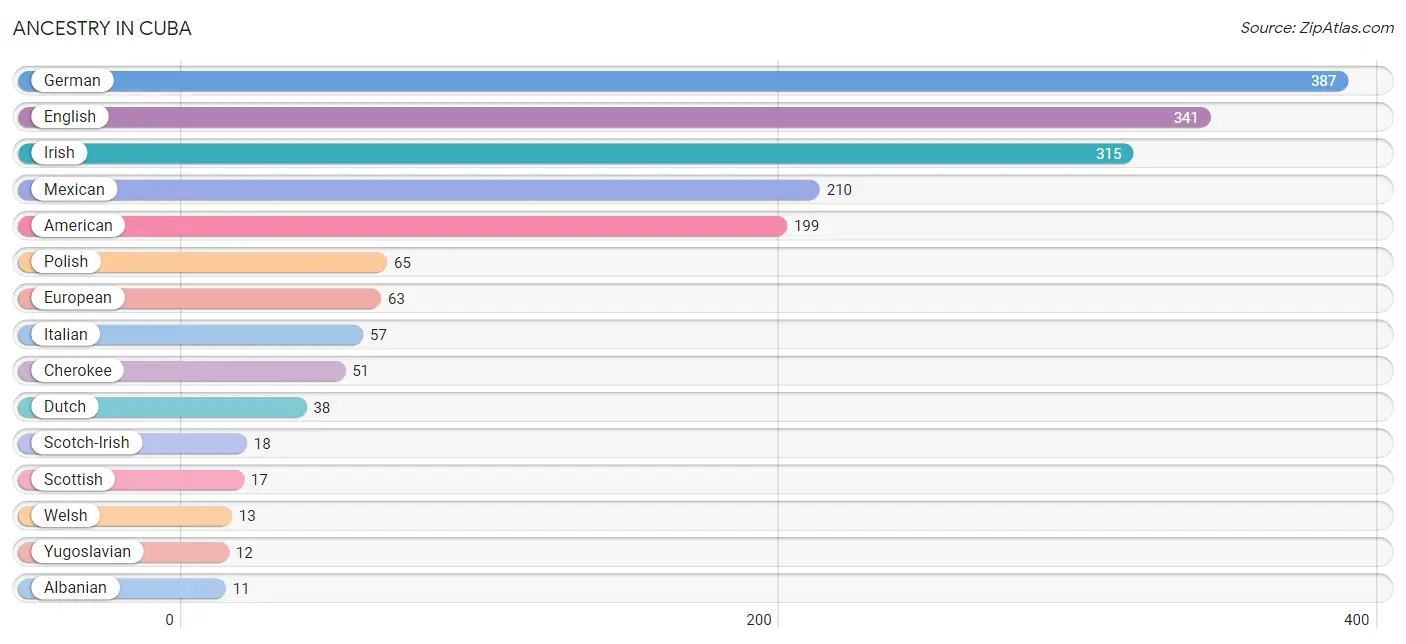
| Ancestry | # Population | % Population |
| Albanian | 11 | 0.4% |
| American | 199 | 6.3% |
| Cherokee | 51 | 1.6% |
| Dutch | 38 | 1.2% |
| English | 341 | 10.7% |
| European | 63 | 2.0% |
| French Canadian | 6 | 0.2% |
| German | 387 | 12.2% |
| Irish | 315 | 9.9% |
| Italian | 57 | 1.8% |
| Mexican | 210 | 6.6% |
| Polish | 65 | 2.1% |
| Russian | 11 | 0.4% |
| Scotch-Irish | 18 | 0.6% |
| Scottish | 17 | 0.5% |
| Swedish | 11 | 0.4% |
| Thai | 9 | 0.3% |
| Welsh | 13 | 0.4% |
| Yugoslavian | 12 | 0.4% | View All 19 Rows |
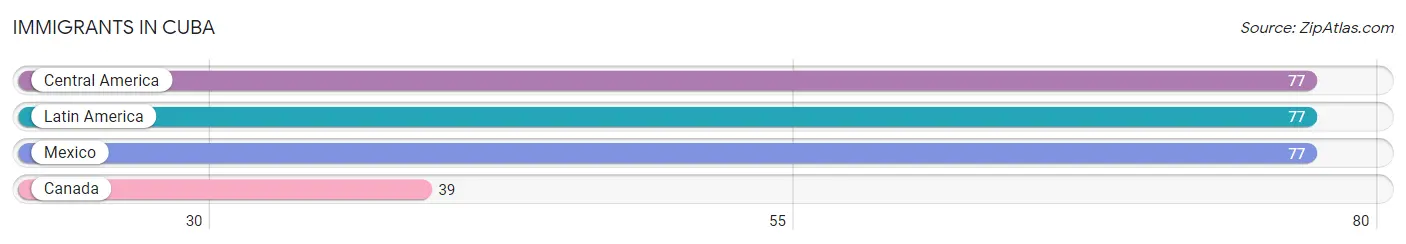
Immigrants in Cuba
The most numerous immigrant groups reported in Cuba came from Central America (77 | 2.4%), Latin America (77 | 2.4%), Mexico (77 | 2.4%), and Canada (39 | 1.2%), together accounting for 8.5% of all Cuba residents.
| Immigration Origin | # Population | % Population |
| Canada | 39 | 1.2% |
| Central America | 77 | 2.4% |
| Latin America | 77 | 2.4% |
| Mexico | 77 | 2.4% | View All 4 Rows |
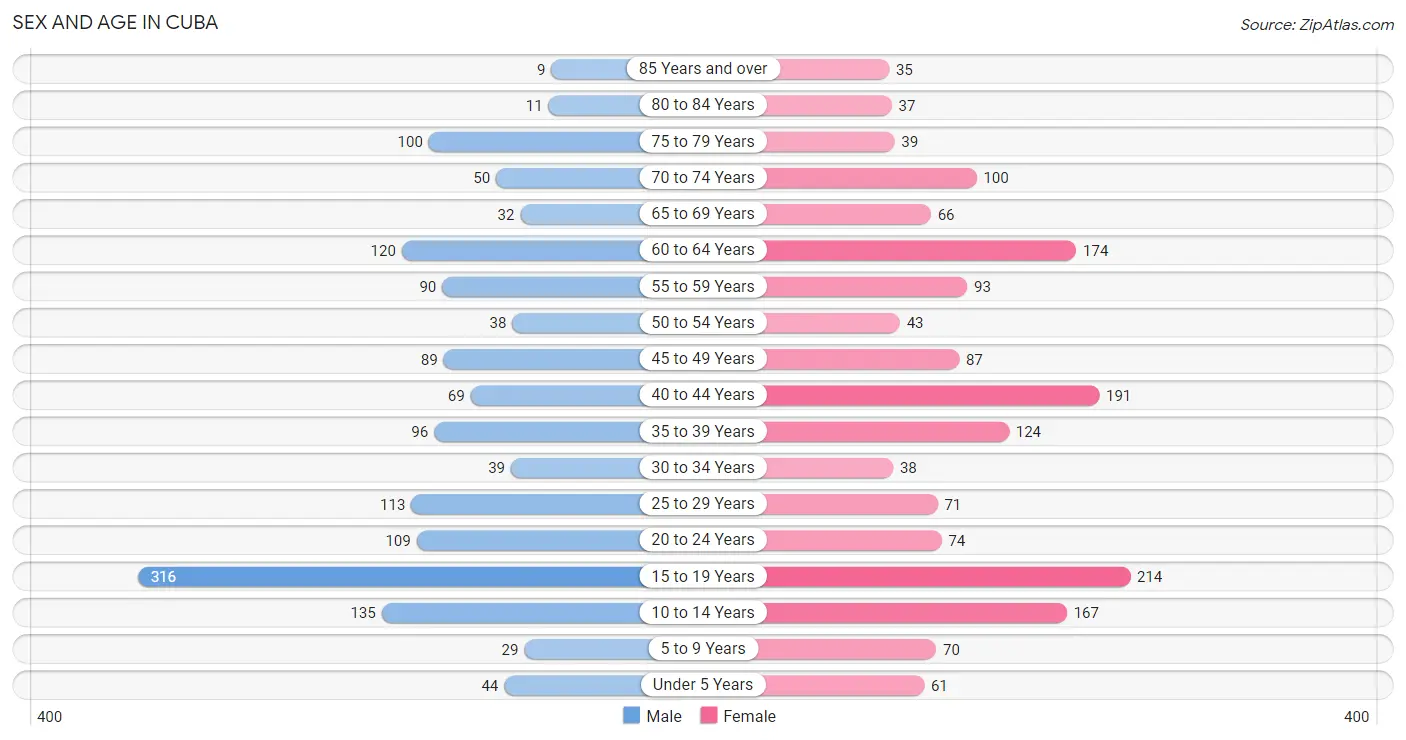
Sex and Age in Cuba
Sex and Age in Cuba
The most populous age groups in Cuba are 15 to 19 Years (316 | 21.2%) for men and 15 to 19 Years (214 | 12.7%) for women.
| Age Bracket | Male | Female |
| Under 5 Years | 44 (3.0%) | 61 (3.6%) |
| 5 to 9 Years | 29 (1.9%) | 70 (4.2%) |
| 10 to 14 Years | 135 (9.1%) | 167 (9.9%) |
| 15 to 19 Years | 316 (21.2%) | 214 (12.7%) |
| 20 to 24 Years | 109 (7.3%) | 74 (4.4%) |
| 25 to 29 Years | 113 (7.6%) | 71 (4.2%) |
| 30 to 34 Years | 39 (2.6%) | 38 (2.3%) |
| 35 to 39 Years | 96 (6.5%) | 124 (7.4%) |
| 40 to 44 Years | 69 (4.6%) | 191 (11.3%) |
| 45 to 49 Years | 89 (6.0%) | 87 (5.2%) |
| 50 to 54 Years | 38 (2.5%) | 43 (2.5%) |
| 55 to 59 Years | 90 (6.0%) | 93 (5.5%) |
| 60 to 64 Years | 120 (8.1%) | 174 (10.3%) |
| 65 to 69 Years | 32 (2.1%) | 66 (3.9%) |
| 70 to 74 Years | 50 (3.4%) | 100 (5.9%) |
| 75 to 79 Years | 100 (6.7%) | 39 (2.3%) |
| 80 to 84 Years | 11 (0.7%) | 37 (2.2%) |
| 85 Years and over | 9 (0.6%) | 35 (2.1%) |
| Total | 1,489 (100.0%) | 1,684 (100.0%) |
Families and Households in Cuba
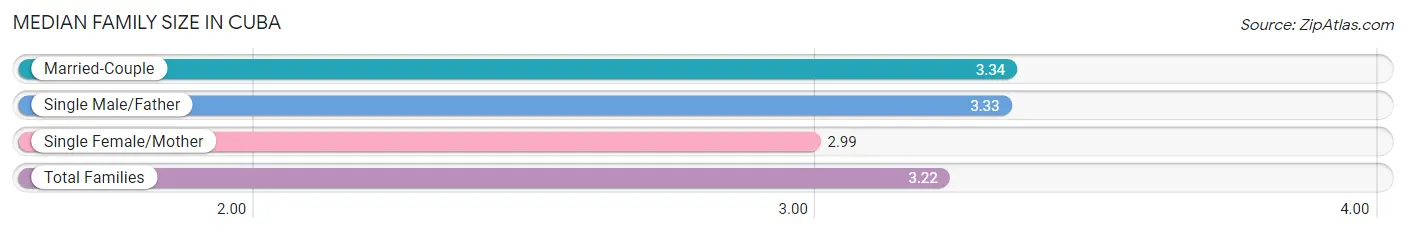
Median Family Size in Cuba
The median family size in Cuba is 3.22 persons per family, with married-couple families (426 | 59.5%) accounting for the largest median family size of 3.34 persons per family. On the other hand, single female/mother families (244 | 34.1%) represent the smallest median family size with 2.99 persons per family.
| Family Type | # Families | Family Size |
| Married-Couple | 426 (59.5%) | 3.34 |
| Single Male/Father | 46 (6.4%) | 3.33 |
| Single Female/Mother | 244 (34.1%) | 2.99 |
| Total Families | 716 (100.0%) | 3.22 |
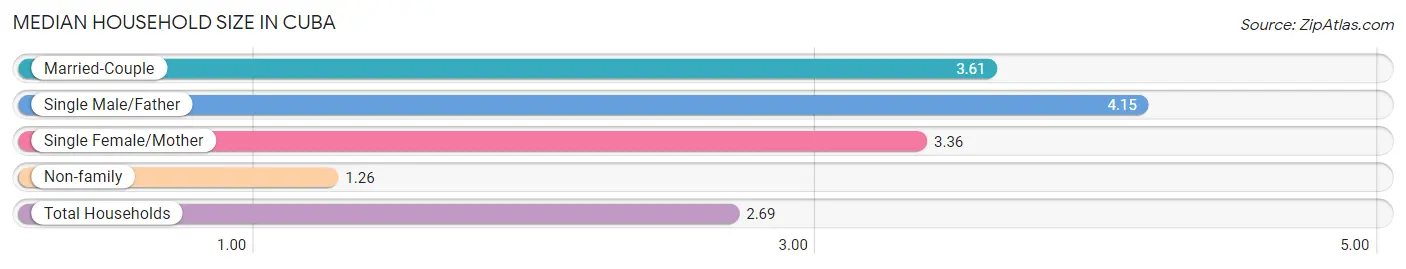
Median Household Size in Cuba
The median household size in Cuba is 2.69 persons per household, with single male/father households (46 | 4.0%) accounting for the largest median household size of 4.15 persons per household. non-family households (435 | 37.8%) represent the smallest median household size with 1.26 persons per household.
| Household Type | # Households | Household Size |
| Married-Couple | 426 (37.0%) | 3.61 |
| Single Male/Father | 46 (4.0%) | 4.15 |
| Single Female/Mother | 244 (21.2%) | 3.36 |
| Non-family | 435 (37.8%) | 1.26 |
| Total Households | 1,151 (100.0%) | 2.69 |
Household Size by Marriage Status in Cuba
Out of a total of 1,151 households in Cuba, 716 (62.2%) are family households, while 435 (37.8%) are nonfamily households. The most numerous type of family households are 2-person households, comprising 374, and the most common type of nonfamily households are 1-person households, comprising 317.
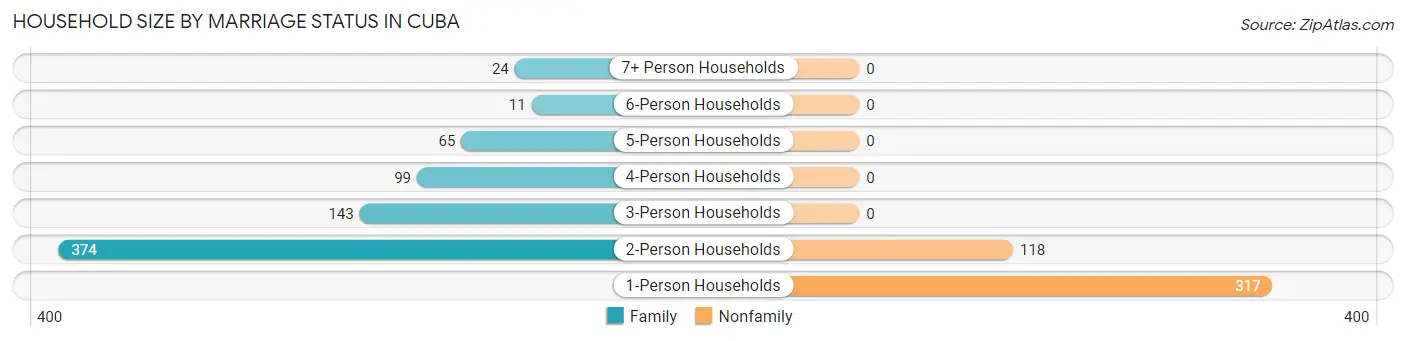
| Household Size | Family Households | Nonfamily Households |
| 1-Person Households | - | 317 (27.5%) |
| 2-Person Households | 374 (32.5%) | 118 (10.2%) |
| 3-Person Households | 143 (12.4%) | 0 (0.0%) |
| 4-Person Households | 99 (8.6%) | 0 (0.0%) |
| 5-Person Households | 65 (5.7%) | 0 (0.0%) |
| 6-Person Households | 11 (1.0%) | 0 (0.0%) |
| 7+ Person Households | 24 (2.1%) | 0 (0.0%) |
| Total | 716 (62.2%) | 435 (37.8%) |
Female Fertility in Cuba
Fertility by Age in Cuba
Average fertility rate in Cuba is 25.0 births per 1,000 women. Women in the age bracket of 20 to 34 years have the highest fertility rate with 109.0 births per 1,000 women. Women in the age bracket of 20 to 34 years acount for 100.0% of all women with births.
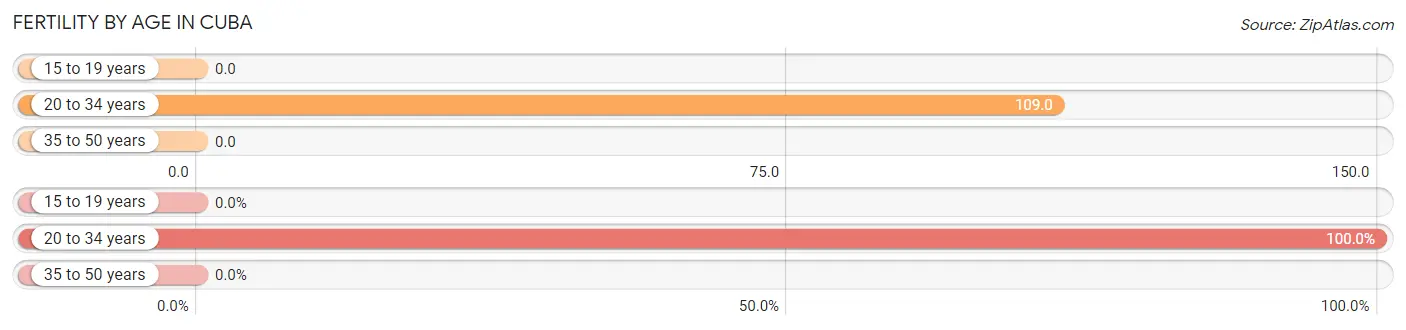
| Age Bracket | Women with Births | Births / 1,000 Women |
| 15 to 19 years | 0 (0.0%) | 0.0 |
| 20 to 34 years | 20 (100.0%) | 109.0 |
| 35 to 50 years | 0 (0.0%) | 0.0 |
| Total | 20 (100.0%) | 25.0 |
Fertility by Age by Marriage Status in Cuba
40.0% of women with births (20) in Cuba are married. The highest percentage of unmarried women with births falls into 20 to 34 years age bracket with 60.0% of them unmarried at the time of birth, while the lowest percentage of unmarried women with births belong to 20 to 34 years age bracket with 60.0% of them unmarried.
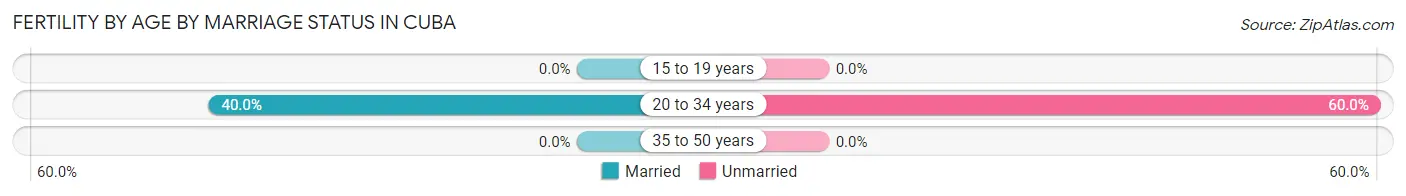
| Age Bracket | Married | Unmarried |
| 15 to 19 years | 0 (0.0%) | 0 (0.0%) |
| 20 to 34 years | 8 (40.0%) | 12 (60.0%) |
| 35 to 50 years | 0 (0.0%) | 0 (0.0%) |
| Total | 8 (40.0%) | 12 (60.0%) |
Fertility by Education in Cuba
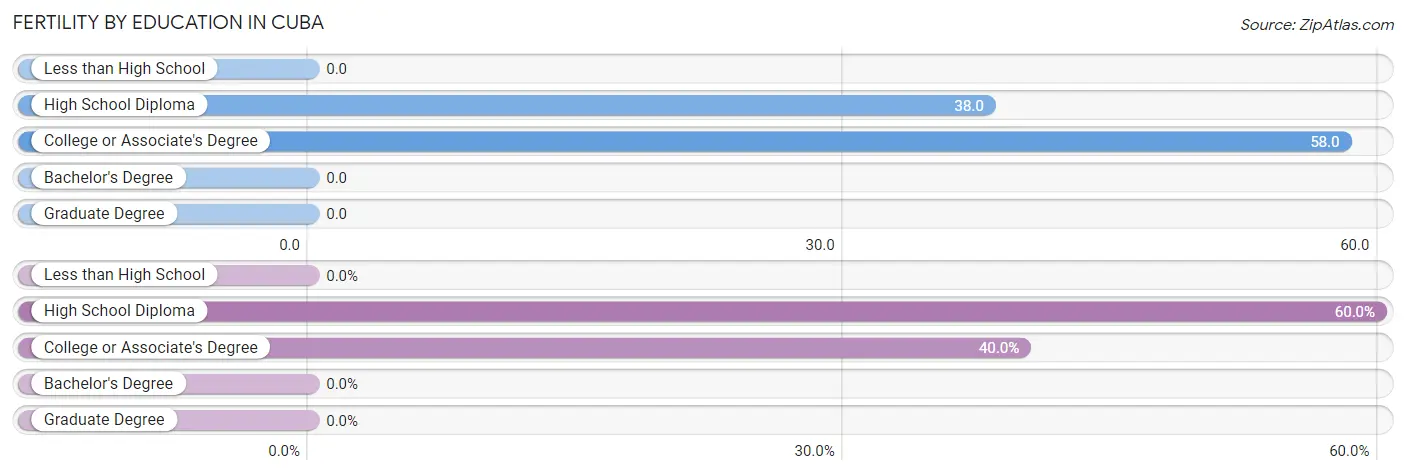
| Educational Attainment | Women with Births | Births / 1,000 Women |
| Less than High School | 0 (0.0%) | 0.0 |
| High School Diploma | 12 (60.0%) | 38.0 |
| College or Associate's Degree | 8 (40.0%) | 58.0 |
| Bachelor's Degree | 0 (0.0%) | 0.0 |
| Graduate Degree | 0 (0.0%) | 0.0 |
| Total | 20 (100.0%) | 25.0 |
Fertility by Education by Marriage Status in Cuba
60.0% of women with births in Cuba are unmarried. Women with the educational attainment of college or associate's degree are most likely to be married with 100.0% of them married at childbirth, while women with the educational attainment of high school diploma are least likely to be married with 100.0% of them unmarried at childbirth.
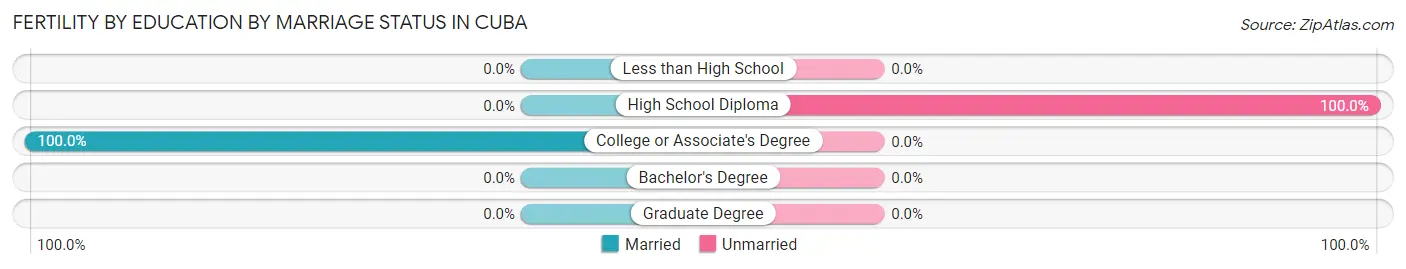
| Educational Attainment | Married | Unmarried |
| Less than High School | 0 (0.0%) | 0 (0.0%) |
| High School Diploma | 0 (0.0%) | 12 (100.0%) |
| College or Associate's Degree | 8 (100.0%) | 0 (0.0%) |
| Bachelor's Degree | 0 (0.0%) | 0 (0.0%) |
| Graduate Degree | 0 (0.0%) | 0 (0.0%) |
| Total | 8 (40.0%) | 12 (60.0%) |
Employment Characteristics in Cuba
Employment by Class of Employer in Cuba
Among the 1,224 employed individuals in Cuba, private company employees (998 | 81.5%), not-for-profit organizations (121 | 9.9%), and self-employed (not incorporated) (48 | 3.9%) make up the most common classes of employment.
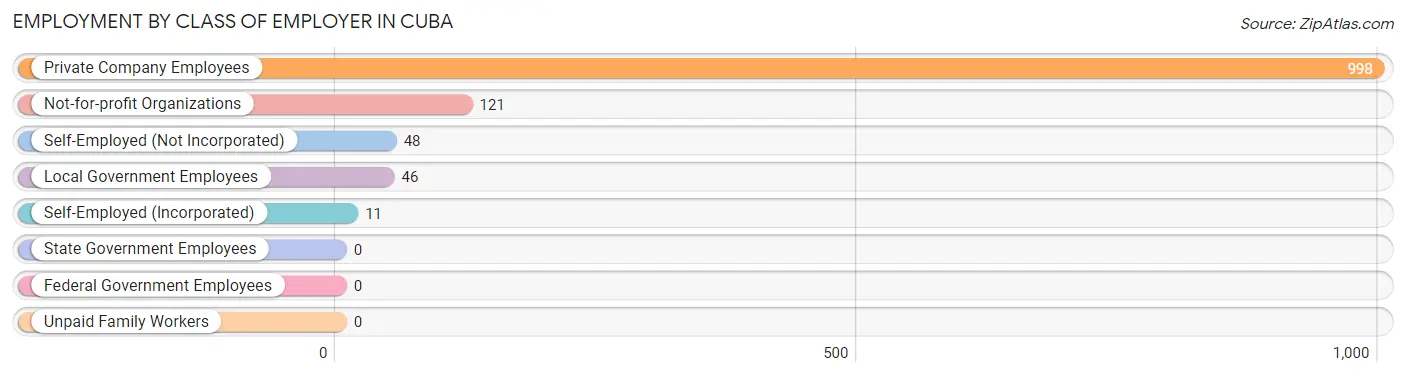
| Employer Class | # Employees | % Employees |
| Private Company Employees | 998 | 81.5% |
| Self-Employed (Incorporated) | 11 | 0.9% |
| Self-Employed (Not Incorporated) | 48 | 3.9% |
| Not-for-profit Organizations | 121 | 9.9% |
| Local Government Employees | 46 | 3.8% |
| State Government Employees | 0 | 0.0% |
| Federal Government Employees | 0 | 0.0% |
| Unpaid Family Workers | 0 | 0.0% |
| Total | 1,224 | 100.0% |
Employment Status by Age in Cuba
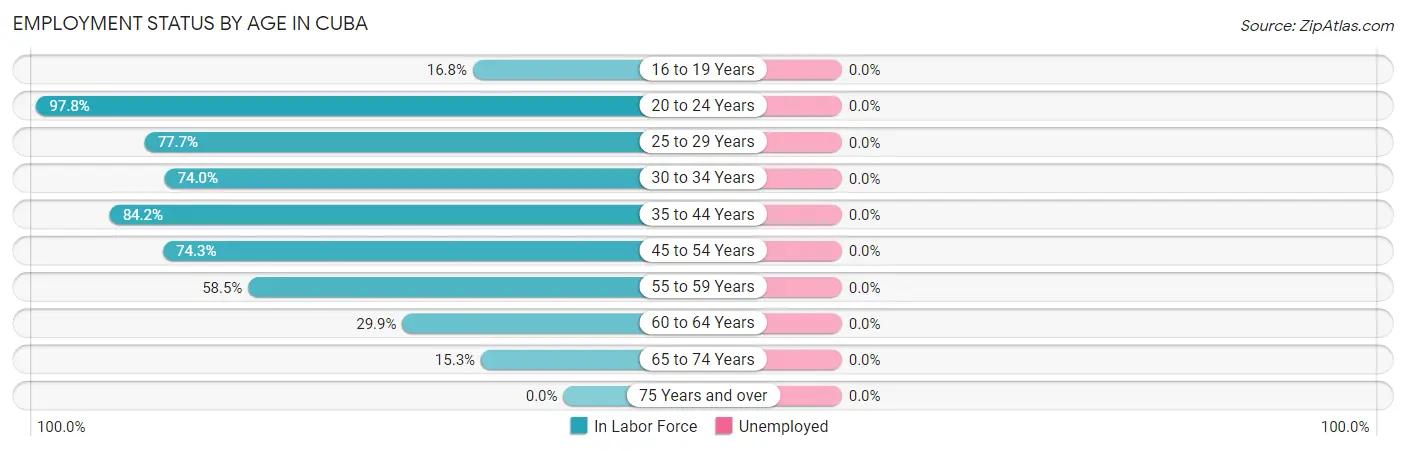
| Age Bracket | In Labor Force | Unemployed |
| 16 to 19 Years | 69 (16.8%) | 0 (0.0%) |
| 20 to 24 Years | 179 (97.8%) | 0 (0.0%) |
| 25 to 29 Years | 143 (77.7%) | 0 (0.0%) |
| 30 to 34 Years | 57 (74.0%) | 0 (0.0%) |
| 35 to 44 Years | 404 (84.2%) | 0 (0.0%) |
| 45 to 54 Years | 191 (74.3%) | 0 (0.0%) |
| 55 to 59 Years | 107 (58.5%) | 0 (0.0%) |
| 60 to 64 Years | 88 (29.9%) | 0 (0.0%) |
| 65 to 74 Years | 38 (15.3%) | 0 (0.0%) |
| 75 Years and over | 0 (0.0%) | 0 (0.0%) |
| Total | 1,276 (50.1%) | 0 (0.0%) |
Employment Status by Educational Attainment in Cuba
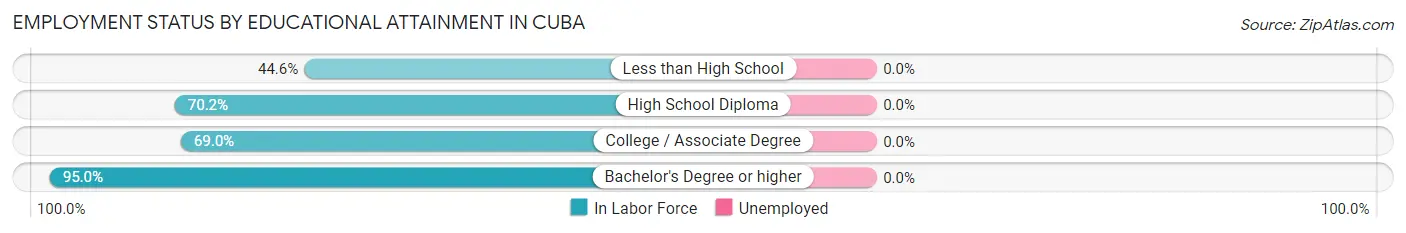
| Educational Attainment | In Labor Force | Unemployed |
| Less than High School | 140 (44.6%) | 0 (0.0%) |
| High School Diploma | 463 (70.2%) | 0 (0.0%) |
| College / Associate Degree | 236 (69.0%) | 0 (0.0%) |
| Bachelor's Degree or higher | 151 (95.0%) | 0 (0.0%) |
| Total | 990 (67.1%) | 0 (0.0%) |
Employment Occupations by Sex in Cuba
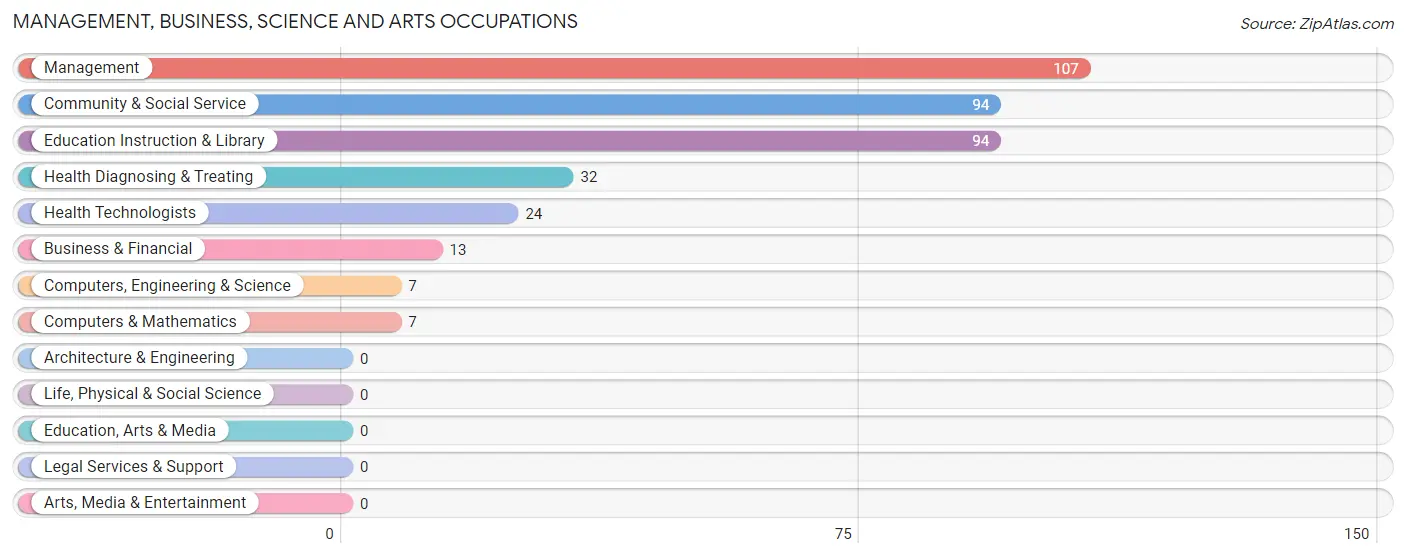
Management, Business, Science and Arts Occupations
The most common Management, Business, Science and Arts occupations in Cuba are Management (107 | 8.4%), Community & Social Service (94 | 7.4%), Education Instruction & Library (94 | 7.4%), Health Diagnosing & Treating (32 | 2.5%), and Health Technologists (24 | 1.9%).
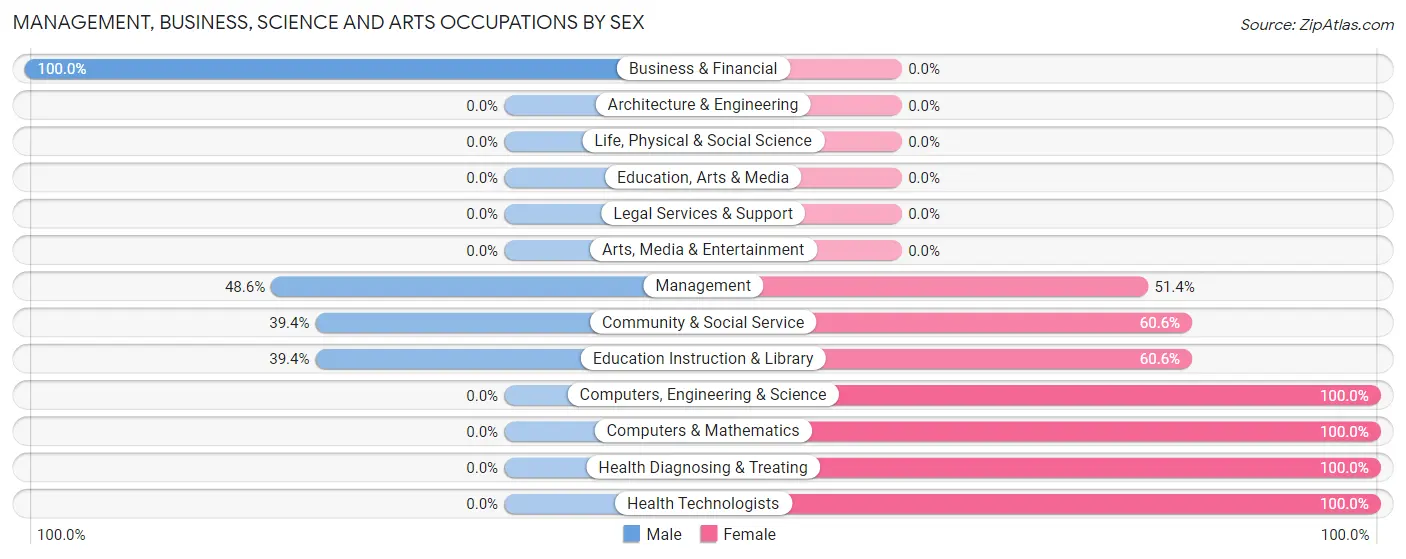
Management, Business, Science and Arts Occupations by Sex
Within the Management, Business, Science and Arts occupations in Cuba, the most male-oriented occupations are Business & Financial (100.0%), Management (48.6%), and Community & Social Service (39.4%), while the most female-oriented occupations are Computers, Engineering & Science (100.0%), Computers & Mathematics (100.0%), and Health Diagnosing & Treating (100.0%).
| Occupation | Male | Female |
| Management | 52 (48.6%) | 55 (51.4%) |
| Business & Financial | 13 (100.0%) | 0 (0.0%) |
| Computers, Engineering & Science | 0 (0.0%) | 7 (100.0%) |
| Computers & Mathematics | 0 (0.0%) | 7 (100.0%) |
| Architecture & Engineering | 0 (0.0%) | 0 (0.0%) |
| Life, Physical & Social Science | 0 (0.0%) | 0 (0.0%) |
| Community & Social Service | 37 (39.4%) | 57 (60.6%) |
| Education, Arts & Media | 0 (0.0%) | 0 (0.0%) |
| Legal Services & Support | 0 (0.0%) | 0 (0.0%) |
| Education Instruction & Library | 37 (39.4%) | 57 (60.6%) |
| Arts, Media & Entertainment | 0 (0.0%) | 0 (0.0%) |
| Health Diagnosing & Treating | 0 (0.0%) | 32 (100.0%) |
| Health Technologists | 0 (0.0%) | 24 (100.0%) |
| Total (Category) | 102 (40.3%) | 151 (59.7%) |
| Total (Overall) | 577 (45.2%) | 699 (54.8%) |
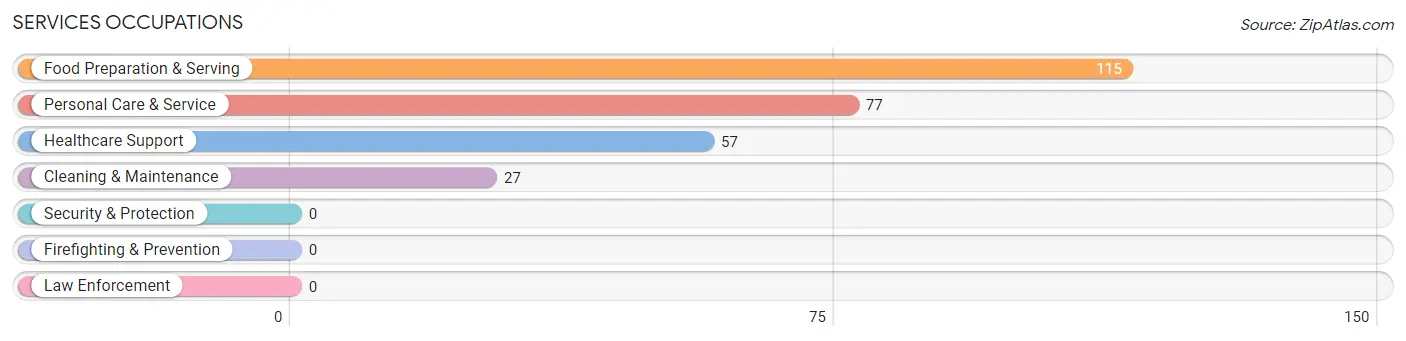
Services Occupations
The most common Services occupations in Cuba are Food Preparation & Serving (115 | 9.0%), Personal Care & Service (77 | 6.0%), Healthcare Support (57 | 4.5%), and Cleaning & Maintenance (27 | 2.1%).
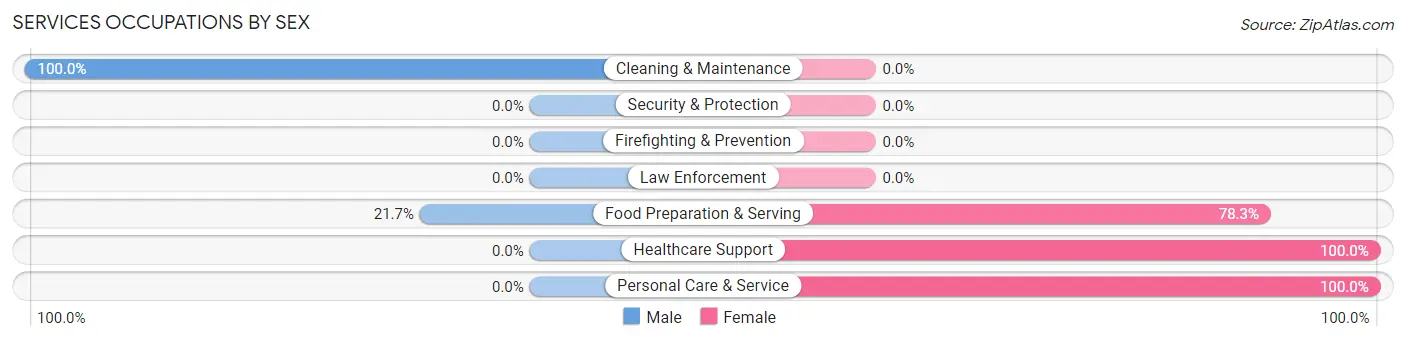
Services Occupations by Sex
Within the Services occupations in Cuba, the most male-oriented occupations are Cleaning & Maintenance (100.0%), and Food Preparation & Serving (21.7%), while the most female-oriented occupations are Healthcare Support (100.0%), Personal Care & Service (100.0%), and Food Preparation & Serving (78.3%).
| Occupation | Male | Female |
| Healthcare Support | 0 (0.0%) | 57 (100.0%) |
| Security & Protection | 0 (0.0%) | 0 (0.0%) |
| Firefighting & Prevention | 0 (0.0%) | 0 (0.0%) |
| Law Enforcement | 0 (0.0%) | 0 (0.0%) |
| Food Preparation & Serving | 25 (21.7%) | 90 (78.3%) |
| Cleaning & Maintenance | 27 (100.0%) | 0 (0.0%) |
| Personal Care & Service | 0 (0.0%) | 77 (100.0%) |
| Total (Category) | 52 (18.8%) | 224 (81.2%) |
| Total (Overall) | 577 (45.2%) | 699 (54.8%) |
Sales and Office Occupations
The most common Sales and Office occupations in Cuba are Office & Administration (137 | 10.7%), and Sales & Related (68 | 5.3%).

Sales and Office Occupations by Sex

| Occupation | Male | Female |
| Sales & Related | 14 (20.6%) | 54 (79.4%) |
| Office & Administration | 21 (15.3%) | 116 (84.7%) |
| Total (Category) | 35 (17.1%) | 170 (82.9%) |
| Total (Overall) | 577 (45.2%) | 699 (54.8%) |
Natural Resources, Construction and Maintenance Occupations
The most common Natural Resources, Construction and Maintenance occupations in Cuba are Installation, Maintenance & Repair (60 | 4.7%), and Construction & Extraction (36 | 2.8%).
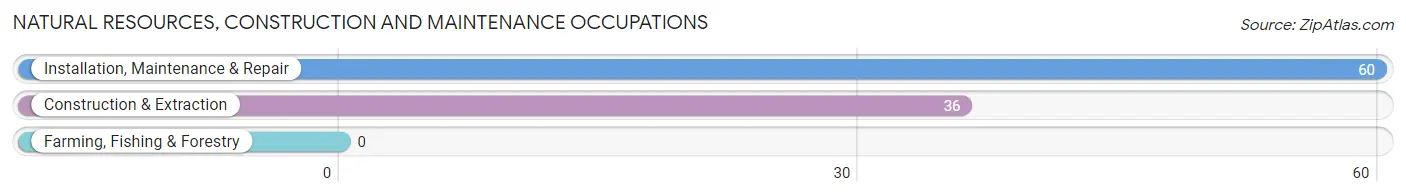
Natural Resources, Construction and Maintenance Occupations by Sex

| Occupation | Male | Female |
| Farming, Fishing & Forestry | 0 (0.0%) | 0 (0.0%) |
| Construction & Extraction | 36 (100.0%) | 0 (0.0%) |
| Installation, Maintenance & Repair | 51 (85.0%) | 9 (15.0%) |
| Total (Category) | 87 (90.6%) | 9 (9.4%) |
| Total (Overall) | 577 (45.2%) | 699 (54.8%) |
Production, Transportation and Moving Occupations
The most common Production, Transportation and Moving occupations in Cuba are Production (225 | 17.6%), Transportation (133 | 10.4%), and Material Moving (88 | 6.9%).
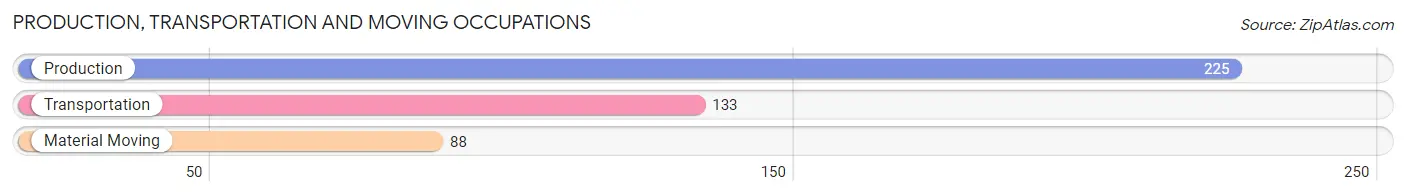
Production, Transportation and Moving Occupations by Sex
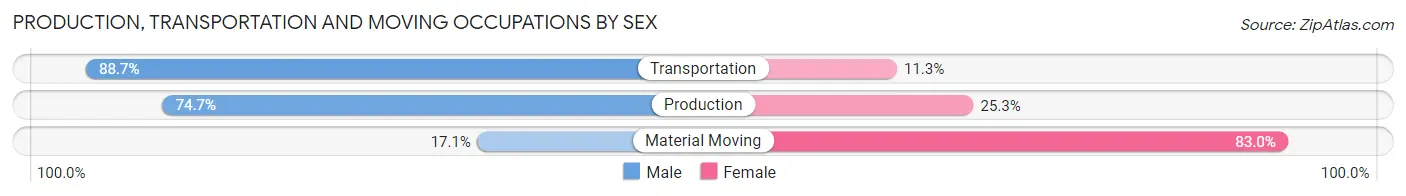
| Occupation | Male | Female |
| Production | 168 (74.7%) | 57 (25.3%) |
| Transportation | 118 (88.7%) | 15 (11.3%) |
| Material Moving | 15 (17.1%) | 73 (83.0%) |
| Total (Category) | 301 (67.5%) | 145 (32.5%) |
| Total (Overall) | 577 (45.2%) | 699 (54.8%) |
Employment Industries by Sex in Cuba
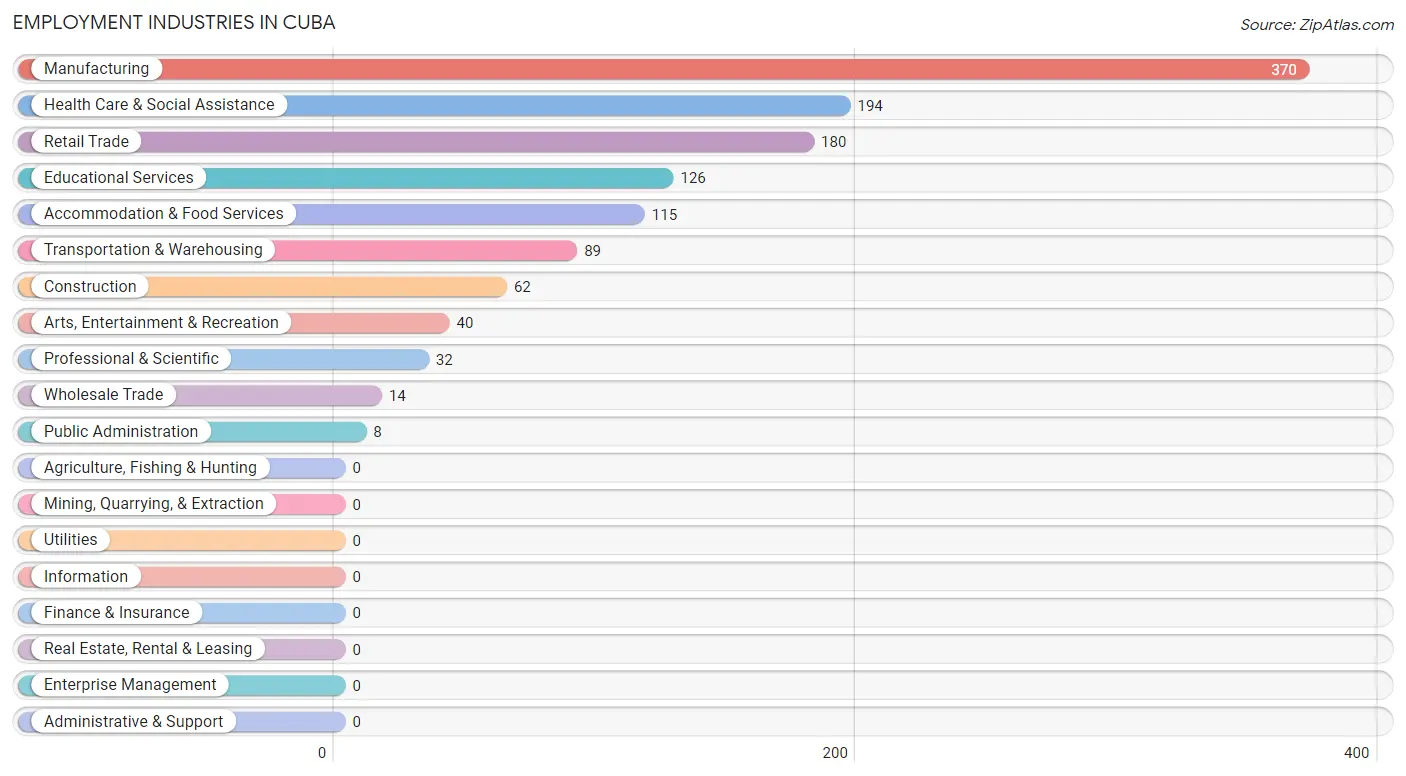
Employment Industries in Cuba
The major employment industries in Cuba include Manufacturing (370 | 29.0%), Health Care & Social Assistance (194 | 15.2%), Retail Trade (180 | 14.1%), Educational Services (126 | 9.9%), and Accommodation & Food Services (115 | 9.0%).
Employment Industries by Sex in Cuba
The Cuba industries that see more men than women are Wholesale Trade (100.0%), Public Administration (100.0%), and Transportation & Warehousing (91.0%), whereas the industries that tend to have a higher number of women are Arts, Entertainment & Recreation (100.0%), Health Care & Social Assistance (93.3%), and Accommodation & Food Services (78.3%).
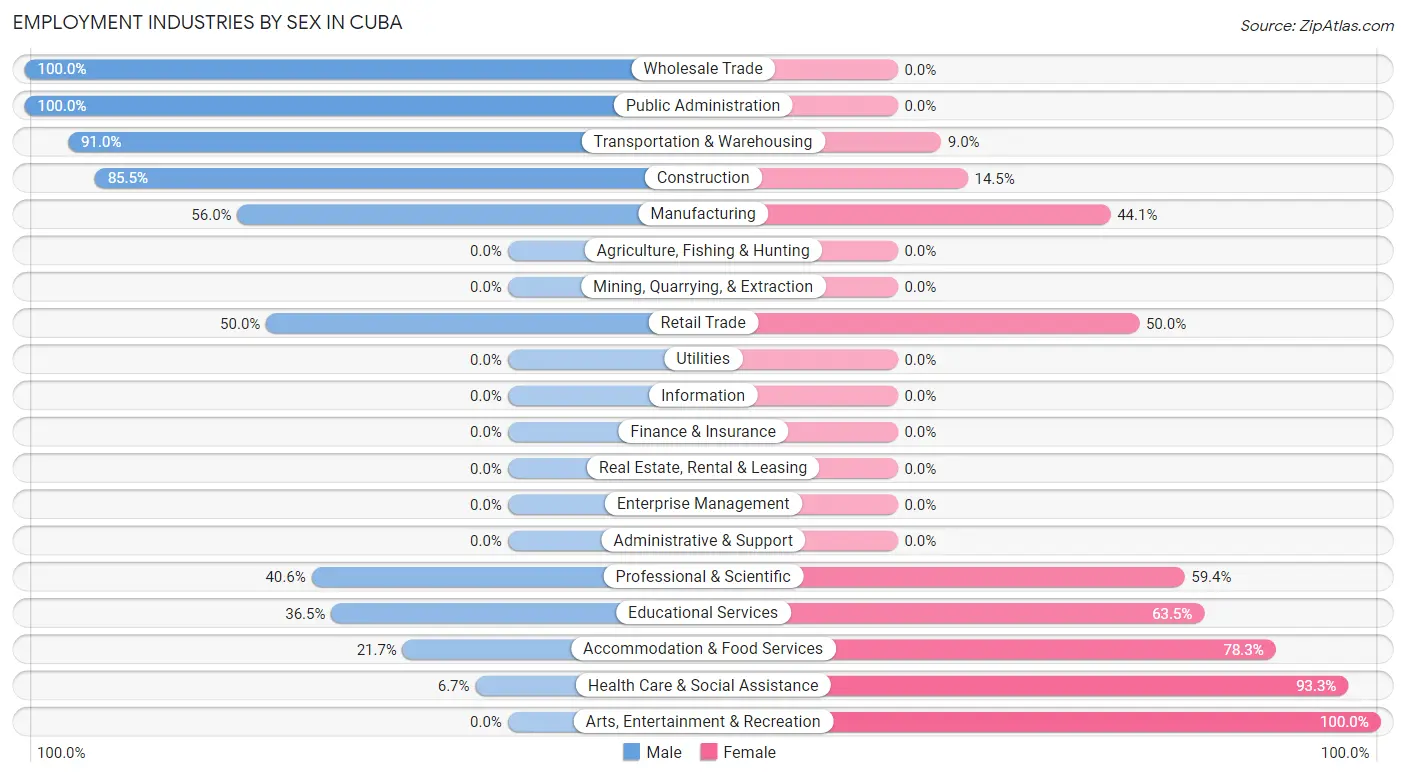
| Industry | Male | Female |
| Agriculture, Fishing & Hunting | 0 (0.0%) | 0 (0.0%) |
| Mining, Quarrying, & Extraction | 0 (0.0%) | 0 (0.0%) |
| Construction | 53 (85.5%) | 9 (14.5%) |
| Manufacturing | 207 (55.9%) | 163 (44.1%) |
| Wholesale Trade | 14 (100.0%) | 0 (0.0%) |
| Retail Trade | 90 (50.0%) | 90 (50.0%) |
| Transportation & Warehousing | 81 (91.0%) | 8 (9.0%) |
| Utilities | 0 (0.0%) | 0 (0.0%) |
| Information | 0 (0.0%) | 0 (0.0%) |
| Finance & Insurance | 0 (0.0%) | 0 (0.0%) |
| Real Estate, Rental & Leasing | 0 (0.0%) | 0 (0.0%) |
| Professional & Scientific | 13 (40.6%) | 19 (59.4%) |
| Enterprise Management | 0 (0.0%) | 0 (0.0%) |
| Administrative & Support | 0 (0.0%) | 0 (0.0%) |
| Educational Services | 46 (36.5%) | 80 (63.5%) |
| Health Care & Social Assistance | 13 (6.7%) | 181 (93.3%) |
| Arts, Entertainment & Recreation | 0 (0.0%) | 40 (100.0%) |
| Accommodation & Food Services | 25 (21.7%) | 90 (78.3%) |
| Public Administration | 8 (100.0%) | 0 (0.0%) |
| Total | 577 (45.2%) | 699 (54.8%) |
Education in Cuba
School Enrollment in Cuba
The most common levels of schooling among the 956 students in Cuba are high school (630 | 65.9%), middle school (157 | 16.4%), and elementary school (82 | 8.6%).
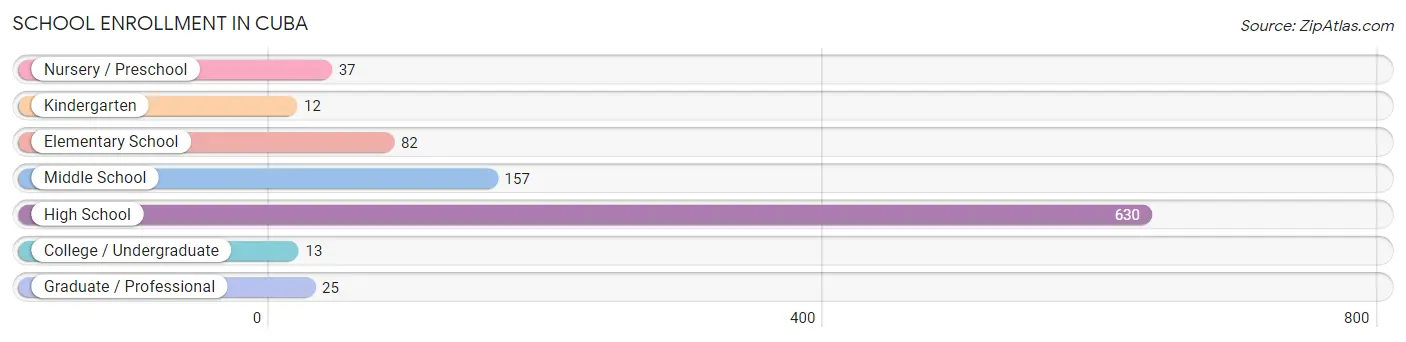
| School Level | # Students | % Students |
| Nursery / Preschool | 37 | 3.9% |
| Kindergarten | 12 | 1.3% |
| Elementary School | 82 | 8.6% |
| Middle School | 157 | 16.4% |
| High School | 630 | 65.9% |
| College / Undergraduate | 13 | 1.4% |
| Graduate / Professional | 25 | 2.6% |
| Total | 956 | 100.0% |
School Enrollment by Age by Funding Source in Cuba
Out of a total of 956 students who are enrolled in schools in Cuba, 110 (11.5%) attend a private institution, while the remaining 846 (88.5%) are enrolled in public schools. The age group of 20 to 24 year olds has the highest likelihood of being enrolled in private schools, with 13 (100.0% in the age bracket) enrolled. Conversely, the age group of 3 to 4 year olds has the lowest likelihood of being enrolled in a private school, with 37 (100.0% in the age bracket) attending a public institution.
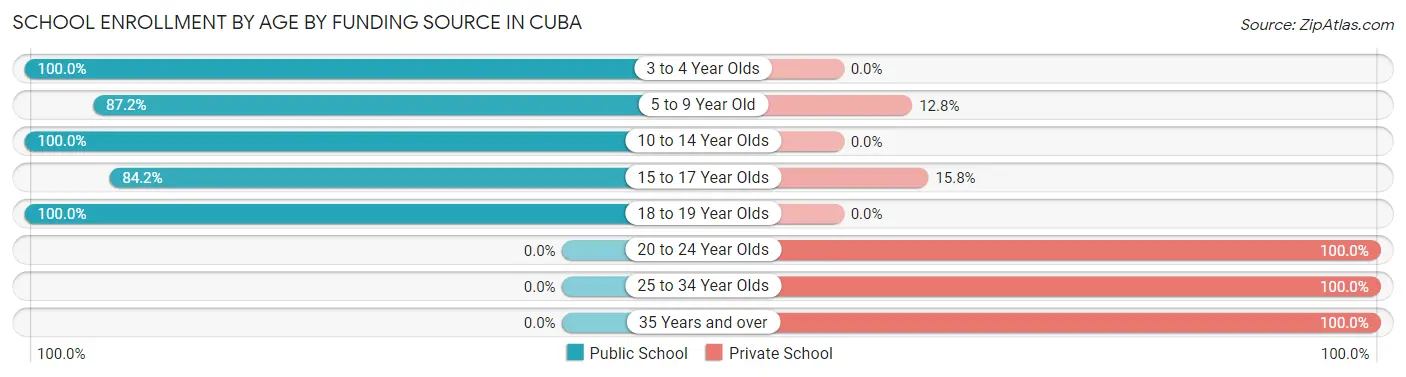
| Age Bracket | Public School | Private School |
| 3 to 4 Year Olds | 37 (100.0%) | 0 (0.0%) |
| 5 to 9 Year Old | 82 (87.2%) | 12 (12.8%) |
| 10 to 14 Year Olds | 302 (100.0%) | 0 (0.0%) |
| 15 to 17 Year Olds | 320 (84.2%) | 60 (15.8%) |
| 18 to 19 Year Olds | 105 (100.0%) | 0 (0.0%) |
| 20 to 24 Year Olds | 0 (0.0%) | 13 (100.0%) |
| 25 to 34 Year Olds | 0 (0.0%) | 6 (100.0%) |
| 35 Years and over | 0 (0.0%) | 19 (100.0%) |
| Total | 846 (88.5%) | 110 (11.5%) |
Educational Attainment by Field of Study in Cuba
Education (56 | 25.3%), science & technology (48 | 21.7%), business (30 | 13.6%), computers & mathematics (24 | 10.9%), and visual & performing arts (24 | 10.9%) are the most common fields of study among 221 individuals in Cuba who have obtained a bachelor's degree or higher.
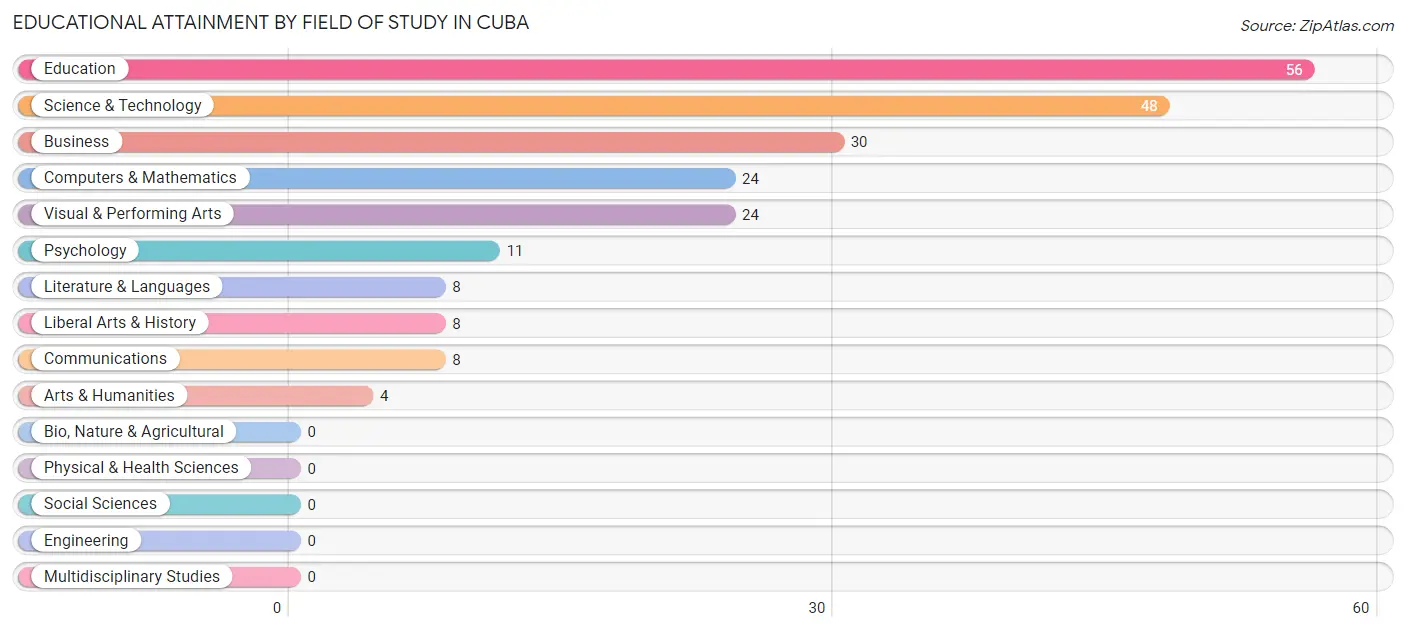
| Field of Study | # Graduates | % Graduates |
| Computers & Mathematics | 24 | 10.9% |
| Bio, Nature & Agricultural | 0 | 0.0% |
| Physical & Health Sciences | 0 | 0.0% |
| Psychology | 11 | 5.0% |
| Social Sciences | 0 | 0.0% |
| Engineering | 0 | 0.0% |
| Multidisciplinary Studies | 0 | 0.0% |
| Science & Technology | 48 | 21.7% |
| Business | 30 | 13.6% |
| Education | 56 | 25.3% |
| Literature & Languages | 8 | 3.6% |
| Liberal Arts & History | 8 | 3.6% |
| Visual & Performing Arts | 24 | 10.9% |
| Communications | 8 | 3.6% |
| Arts & Humanities | 4 | 1.8% |
| Total | 221 | 100.0% |
Transportation & Commute in Cuba
Vehicle Availability by Sex in Cuba
The most prevalent vehicle ownership categories in Cuba are males with 2 vehicles (275, accounting for 50.5%) and females with 2 vehicles (275, making up 40.4%).
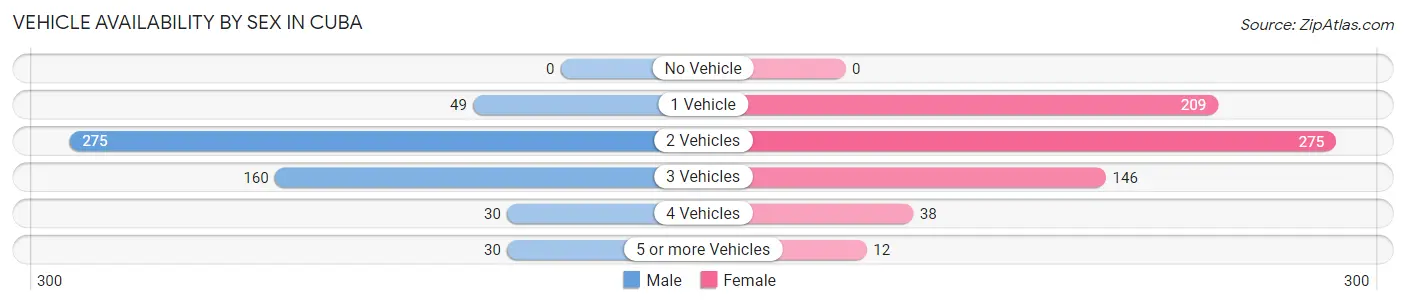
| Vehicles Available | Male | Female |
| No Vehicle | 0 (0.0%) | 0 (0.0%) |
| 1 Vehicle | 49 (9.0%) | 209 (30.7%) |
| 2 Vehicles | 275 (50.5%) | 275 (40.4%) |
| 3 Vehicles | 160 (29.4%) | 146 (21.5%) |
| 4 Vehicles | 30 (5.5%) | 38 (5.6%) |
| 5 or more Vehicles | 30 (5.5%) | 12 (1.8%) |
| Total | 544 (100.0%) | 680 (100.0%) |
Commute Time in Cuba
The most frequently occuring commute durations in Cuba are 5 to 9 minutes (330 commuters, 27.0%), 20 to 24 minutes (166 commuters, 13.6%), and 15 to 19 minutes (153 commuters, 12.5%).
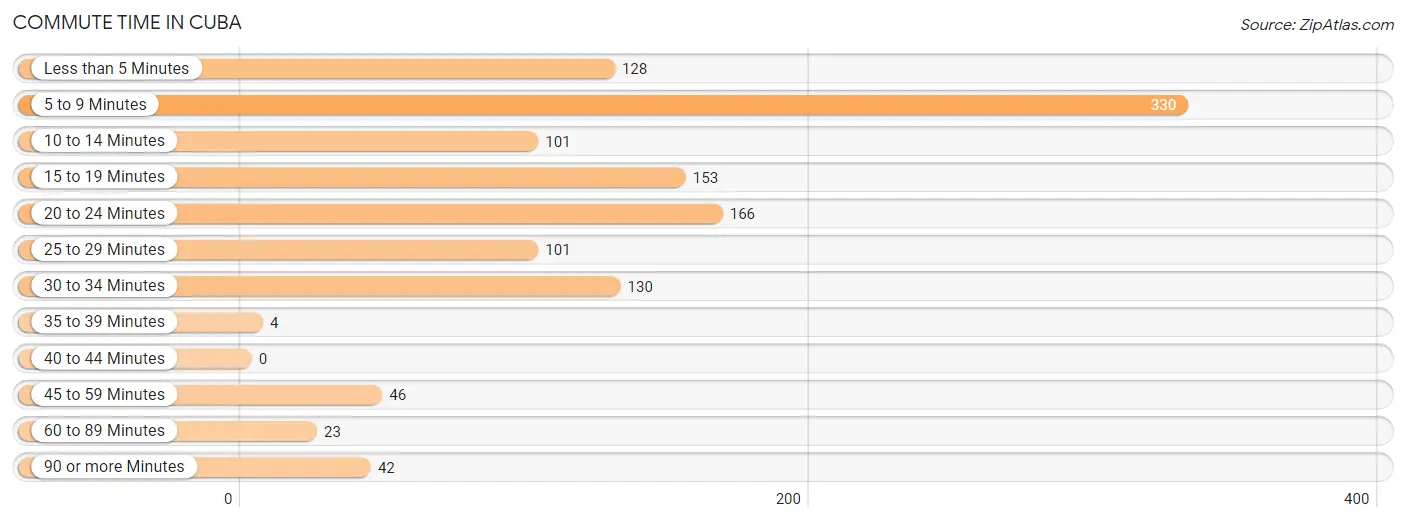
| Commute Time | # Commuters | % Commuters |
| Less than 5 Minutes | 128 | 10.5% |
| 5 to 9 Minutes | 330 | 27.0% |
| 10 to 14 Minutes | 101 | 8.3% |
| 15 to 19 Minutes | 153 | 12.5% |
| 20 to 24 Minutes | 166 | 13.6% |
| 25 to 29 Minutes | 101 | 8.3% |
| 30 to 34 Minutes | 130 | 10.6% |
| 35 to 39 Minutes | 4 | 0.3% |
| 40 to 44 Minutes | 0 | 0.0% |
| 45 to 59 Minutes | 46 | 3.8% |
| 60 to 89 Minutes | 23 | 1.9% |
| 90 or more Minutes | 42 | 3.4% |
Commute Time by Sex in Cuba
The most common commute times in Cuba are 5 to 9 minutes (146 commuters, 26.8%) for males and 5 to 9 minutes (184 commuters, 27.1%) for females.
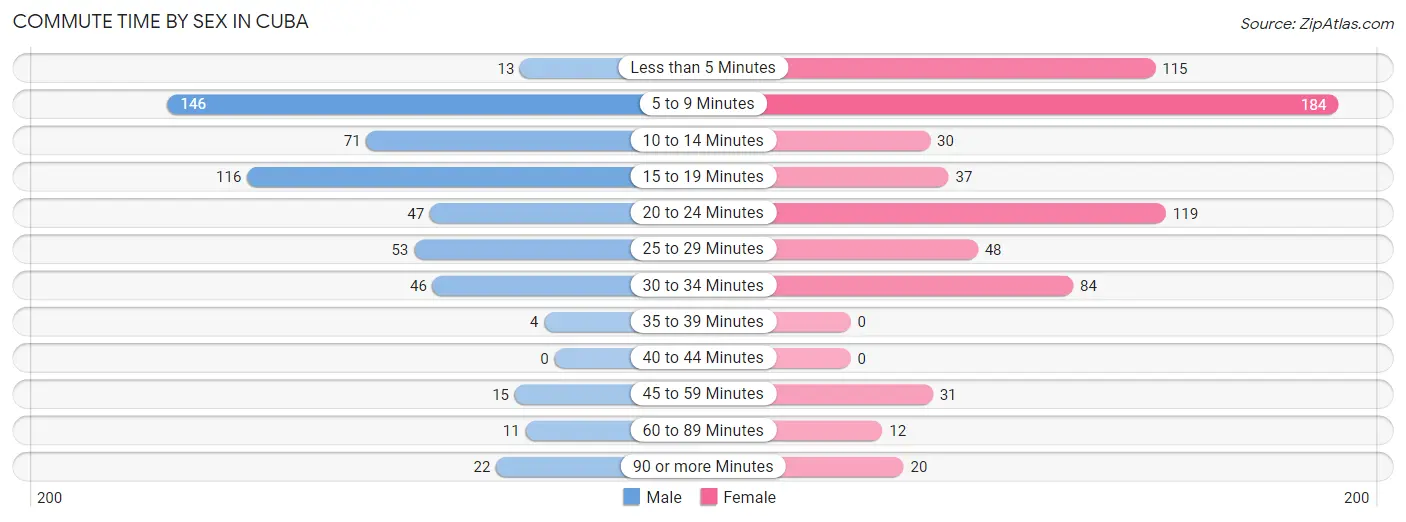
| Commute Time | Male | Female |
| Less than 5 Minutes | 13 (2.4%) | 115 (16.9%) |
| 5 to 9 Minutes | 146 (26.8%) | 184 (27.1%) |
| 10 to 14 Minutes | 71 (13.1%) | 30 (4.4%) |
| 15 to 19 Minutes | 116 (21.3%) | 37 (5.4%) |
| 20 to 24 Minutes | 47 (8.6%) | 119 (17.5%) |
| 25 to 29 Minutes | 53 (9.7%) | 48 (7.1%) |
| 30 to 34 Minutes | 46 (8.5%) | 84 (12.3%) |
| 35 to 39 Minutes | 4 (0.7%) | 0 (0.0%) |
| 40 to 44 Minutes | 0 (0.0%) | 0 (0.0%) |
| 45 to 59 Minutes | 15 (2.8%) | 31 (4.6%) |
| 60 to 89 Minutes | 11 (2.0%) | 12 (1.8%) |
| 90 or more Minutes | 22 (4.0%) | 20 (2.9%) |
Time of Departure to Work by Sex in Cuba
The most frequent times of departure to work in Cuba are 4:00 PM to 11:59 PM (179, 32.9%) for males and 7:00 AM to 7:29 AM (143, 21.0%) for females.
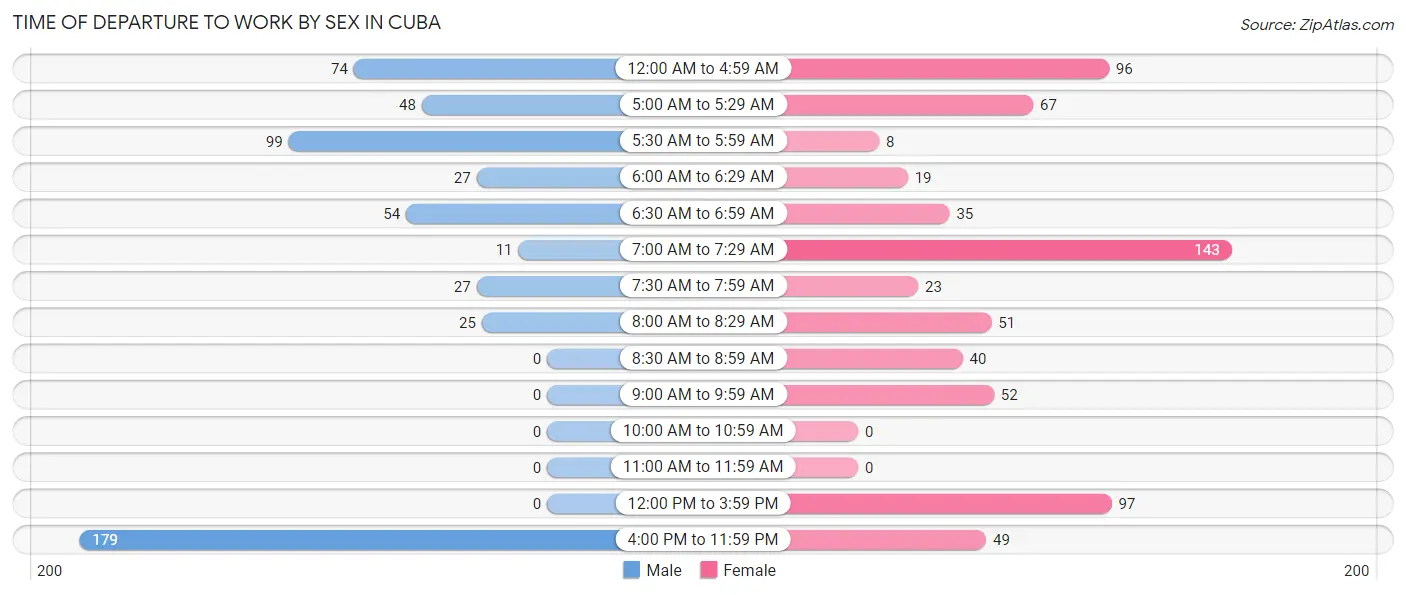
| Time of Departure | Male | Female |
| 12:00 AM to 4:59 AM | 74 (13.6%) | 96 (14.1%) |
| 5:00 AM to 5:29 AM | 48 (8.8%) | 67 (9.9%) |
| 5:30 AM to 5:59 AM | 99 (18.2%) | 8 (1.2%) |
| 6:00 AM to 6:29 AM | 27 (5.0%) | 19 (2.8%) |
| 6:30 AM to 6:59 AM | 54 (9.9%) | 35 (5.1%) |
| 7:00 AM to 7:29 AM | 11 (2.0%) | 143 (21.0%) |
| 7:30 AM to 7:59 AM | 27 (5.0%) | 23 (3.4%) |
| 8:00 AM to 8:29 AM | 25 (4.6%) | 51 (7.5%) |
| 8:30 AM to 8:59 AM | 0 (0.0%) | 40 (5.9%) |
| 9:00 AM to 9:59 AM | 0 (0.0%) | 52 (7.6%) |
| 10:00 AM to 10:59 AM | 0 (0.0%) | 0 (0.0%) |
| 11:00 AM to 11:59 AM | 0 (0.0%) | 0 (0.0%) |
| 12:00 PM to 3:59 PM | 0 (0.0%) | 97 (14.3%) |
| 4:00 PM to 11:59 PM | 179 (32.9%) | 49 (7.2%) |
| Total | 544 (100.0%) | 680 (100.0%) |
Housing Occupancy in Cuba
Occupancy by Ownership in Cuba
Of the total 1,151 dwellings in Cuba, owner-occupied units account for 467 (40.6%), while renter-occupied units make up 684 (59.4%).
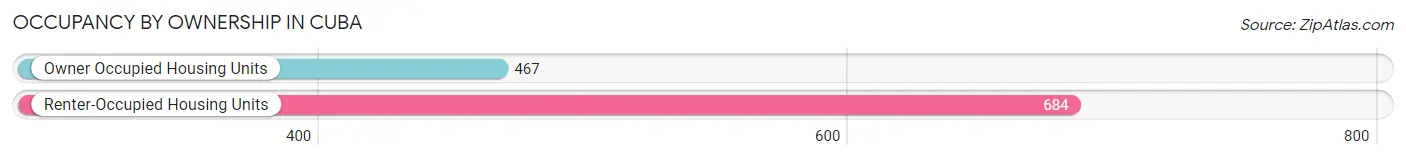
| Occupancy | # Housing Units | % Housing Units |
| Owner Occupied Housing Units | 467 | 40.6% |
| Renter-Occupied Housing Units | 684 | 59.4% |
| Total Occupied Housing Units | 1,151 | 100.0% |
Occupancy by Household Size in Cuba
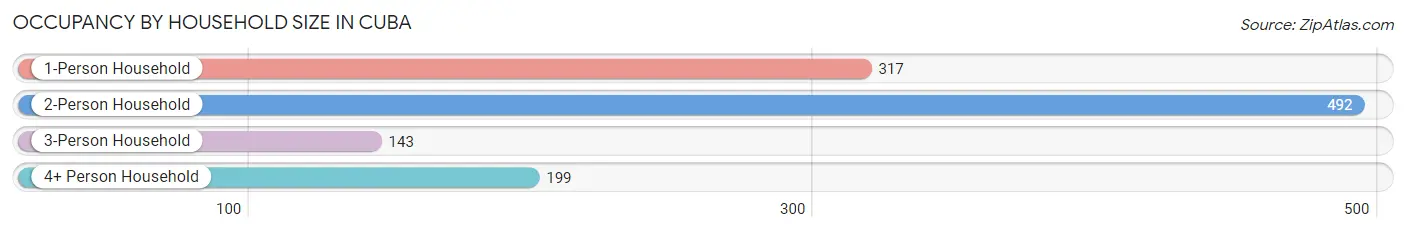
| Household Size | # Housing Units | % Housing Units |
| 1-Person Household | 317 | 27.5% |
| 2-Person Household | 492 | 42.7% |
| 3-Person Household | 143 | 12.4% |
| 4+ Person Household | 199 | 17.3% |
| Total Housing Units | 1,151 | 100.0% |
Occupancy by Ownership by Household Size in Cuba
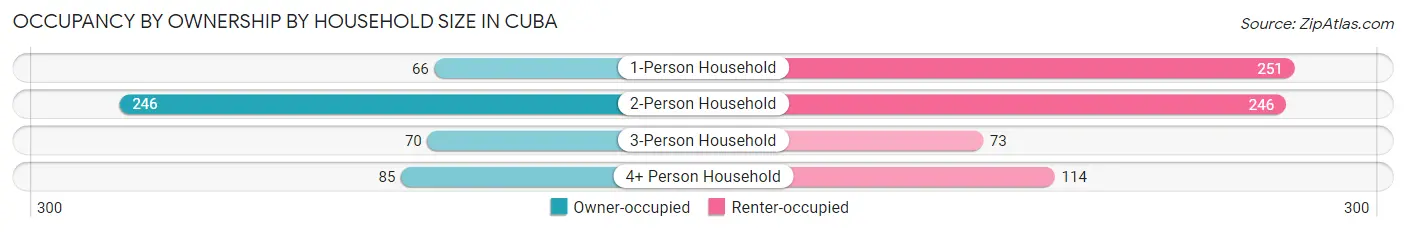
| Household Size | Owner-occupied | Renter-occupied |
| 1-Person Household | 66 (20.8%) | 251 (79.2%) |
| 2-Person Household | 246 (50.0%) | 246 (50.0%) |
| 3-Person Household | 70 (48.9%) | 73 (51.0%) |
| 4+ Person Household | 85 (42.7%) | 114 (57.3%) |
| Total Housing Units | 467 (40.6%) | 684 (59.4%) |
Occupancy by Educational Attainment in Cuba
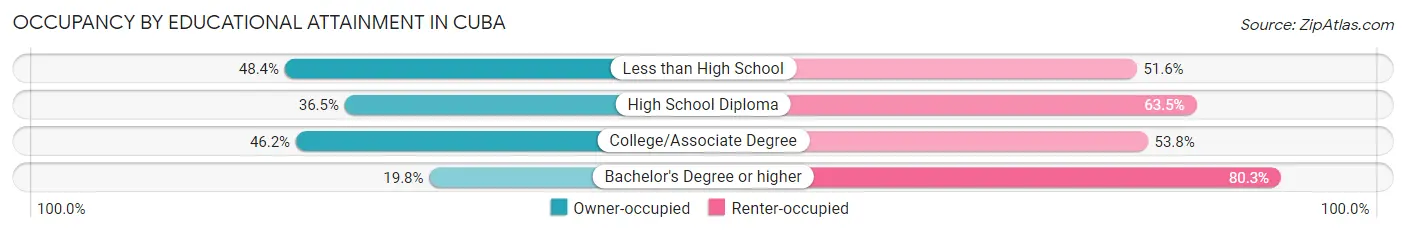
| Household Size | Owner-occupied | Renter-occupied |
| Less than High School | 121 (48.4%) | 129 (51.6%) |
| High School Diploma | 184 (36.5%) | 320 (63.5%) |
| College/Associate Degree | 146 (46.2%) | 170 (53.8%) |
| Bachelor's Degree or higher | 16 (19.8%) | 65 (80.2%) |
Occupancy by Age of Householder in Cuba
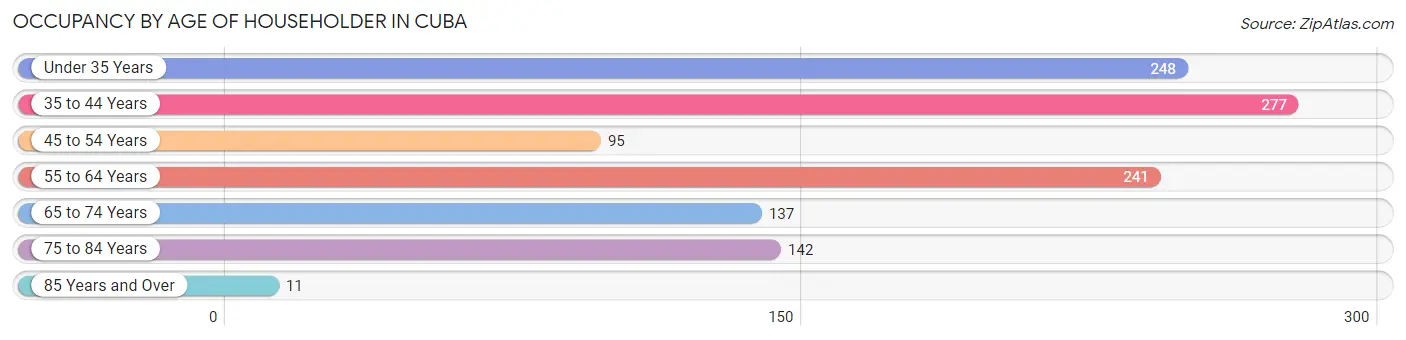
| Age Bracket | # Households | % Households |
| Under 35 Years | 248 | 21.5% |
| 35 to 44 Years | 277 | 24.1% |
| 45 to 54 Years | 95 | 8.3% |
| 55 to 64 Years | 241 | 20.9% |
| 65 to 74 Years | 137 | 11.9% |
| 75 to 84 Years | 142 | 12.3% |
| 85 Years and Over | 11 | 1.0% |
| Total | 1,151 | 100.0% |
Housing Finances in Cuba
Median Income by Occupancy in Cuba
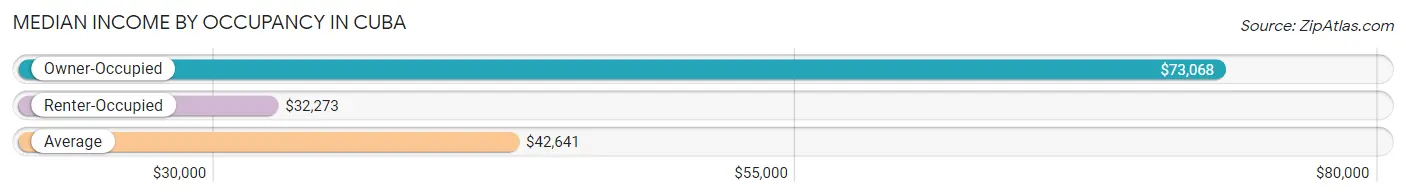
| Occupancy Type | # Households | Median Income |
| Owner-Occupied | 467 (40.6%) | $73,068 |
| Renter-Occupied | 684 (59.4%) | $32,273 |
| Average | 1,151 (100.0%) | $42,641 |
Occupancy by Householder Income Bracket in Cuba
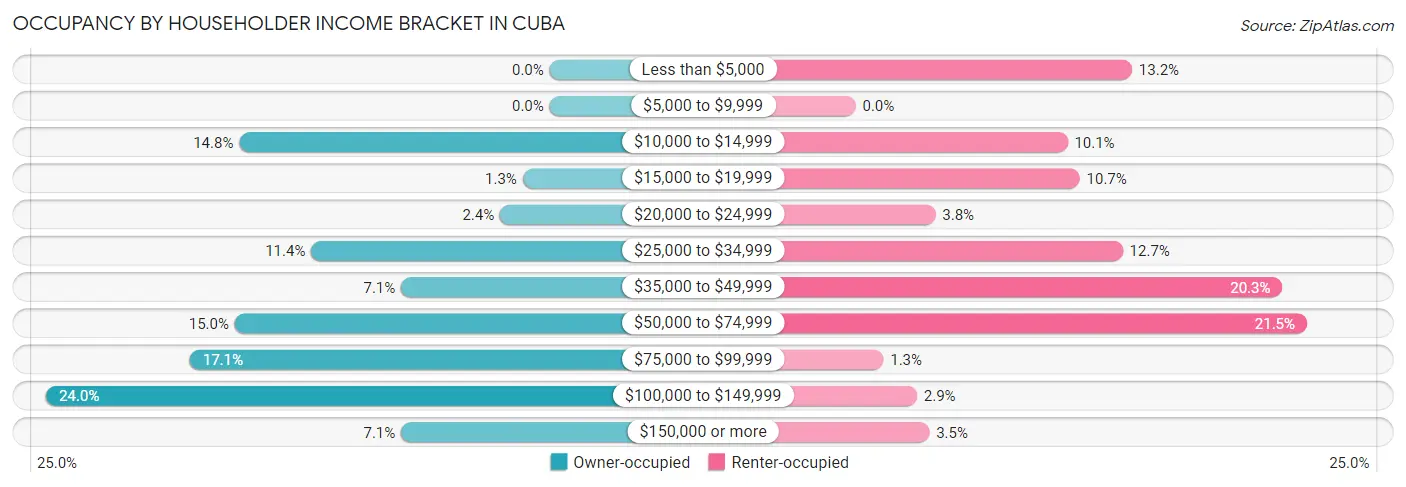
| Income Bracket | Owner-occupied | Renter-occupied |
| Less than $5,000 | 0 (0.0%) | 90 (13.2%) |
| $5,000 to $9,999 | 0 (0.0%) | 0 (0.0%) |
| $10,000 to $14,999 | 69 (14.8%) | 69 (10.1%) |
| $15,000 to $19,999 | 6 (1.3%) | 73 (10.7%) |
| $20,000 to $24,999 | 11 (2.4%) | 26 (3.8%) |
| $25,000 to $34,999 | 53 (11.4%) | 87 (12.7%) |
| $35,000 to $49,999 | 33 (7.1%) | 139 (20.3%) |
| $50,000 to $74,999 | 70 (15.0%) | 147 (21.5%) |
| $75,000 to $99,999 | 80 (17.1%) | 9 (1.3%) |
| $100,000 to $149,999 | 112 (24.0%) | 20 (2.9%) |
| $150,000 or more | 33 (7.1%) | 24 (3.5%) |
| Total | 467 (100.0%) | 684 (100.0%) |
Monthly Housing Cost Tiers in Cuba
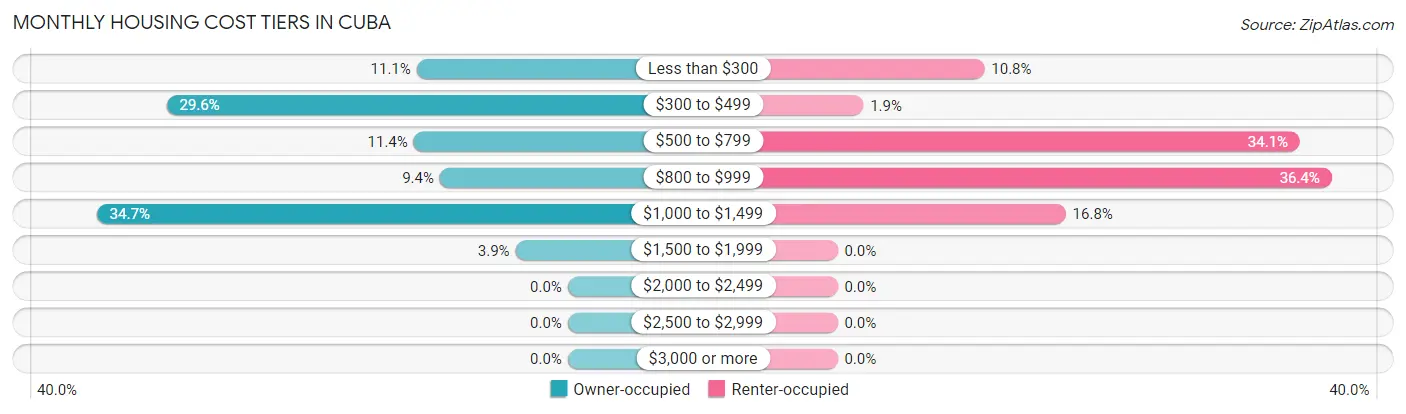
| Monthly Cost | Owner-occupied | Renter-occupied |
| Less than $300 | 52 (11.1%) | 74 (10.8%) |
| $300 to $499 | 138 (29.5%) | 13 (1.9%) |
| $500 to $799 | 53 (11.4%) | 233 (34.1%) |
| $800 to $999 | 44 (9.4%) | 249 (36.4%) |
| $1,000 to $1,499 | 162 (34.7%) | 115 (16.8%) |
| $1,500 to $1,999 | 18 (3.8%) | 0 (0.0%) |
| $2,000 to $2,499 | 0 (0.0%) | 0 (0.0%) |
| $2,500 to $2,999 | 0 (0.0%) | 0 (0.0%) |
| $3,000 or more | 0 (0.0%) | 0 (0.0%) |
| Total | 467 (100.0%) | 684 (100.0%) |
Physical Housing Characteristics in Cuba
Housing Structures in Cuba
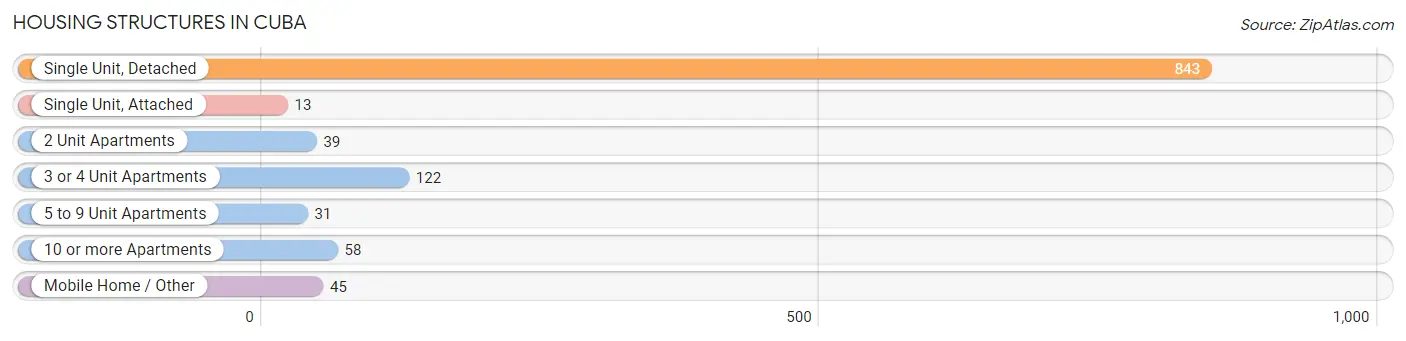
| Structure Type | # Housing Units | % Housing Units |
| Single Unit, Detached | 843 | 73.2% |
| Single Unit, Attached | 13 | 1.1% |
| 2 Unit Apartments | 39 | 3.4% |
| 3 or 4 Unit Apartments | 122 | 10.6% |
| 5 to 9 Unit Apartments | 31 | 2.7% |
| 10 or more Apartments | 58 | 5.0% |
| Mobile Home / Other | 45 | 3.9% |
| Total | 1,151 | 100.0% |
Housing Structures by Occupancy in Cuba
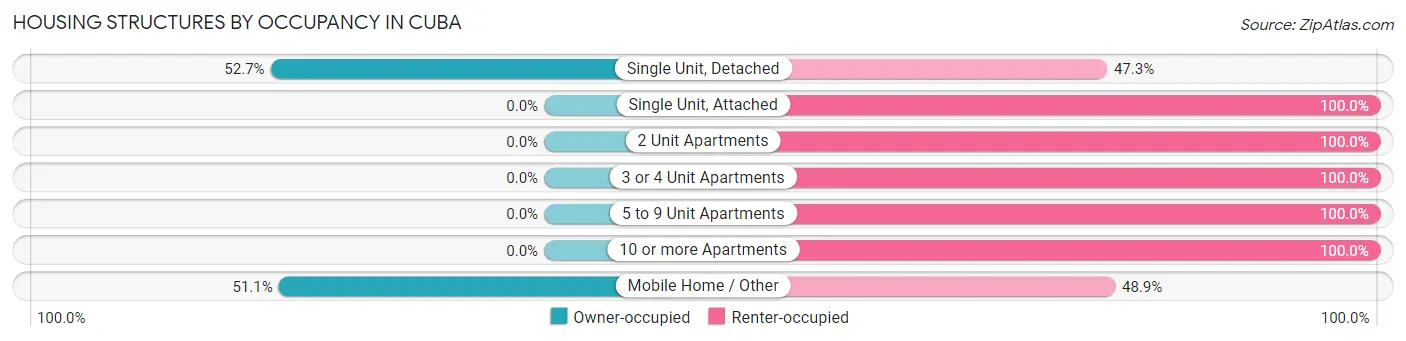
| Structure Type | Owner-occupied | Renter-occupied |
| Single Unit, Detached | 444 (52.7%) | 399 (47.3%) |
| Single Unit, Attached | 0 (0.0%) | 13 (100.0%) |
| 2 Unit Apartments | 0 (0.0%) | 39 (100.0%) |
| 3 or 4 Unit Apartments | 0 (0.0%) | 122 (100.0%) |
| 5 to 9 Unit Apartments | 0 (0.0%) | 31 (100.0%) |
| 10 or more Apartments | 0 (0.0%) | 58 (100.0%) |
| Mobile Home / Other | 23 (51.1%) | 22 (48.9%) |
| Total | 467 (40.6%) | 684 (59.4%) |
Housing Structures by Number of Rooms in Cuba
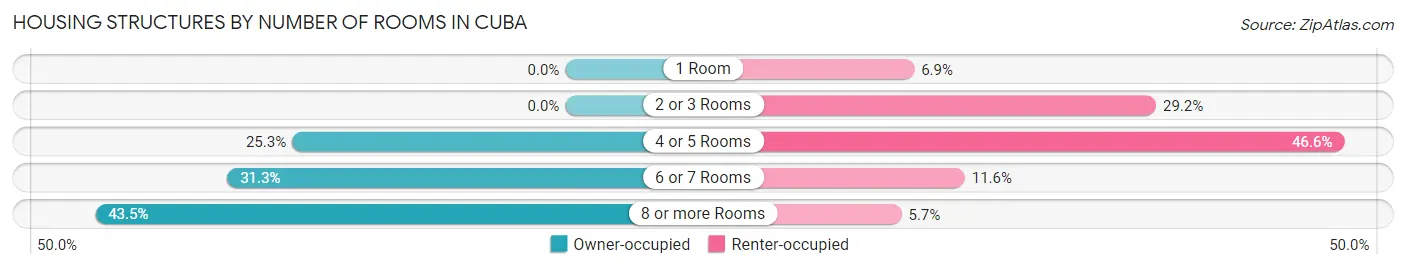
| Number of Rooms | Owner-occupied | Renter-occupied |
| 1 Room | 0 (0.0%) | 47 (6.9%) |
| 2 or 3 Rooms | 0 (0.0%) | 200 (29.2%) |
| 4 or 5 Rooms | 118 (25.3%) | 319 (46.6%) |
| 6 or 7 Rooms | 146 (31.3%) | 79 (11.6%) |
| 8 or more Rooms | 203 (43.5%) | 39 (5.7%) |
| Total | 467 (100.0%) | 684 (100.0%) |
Housing Structure by Heating Type in Cuba
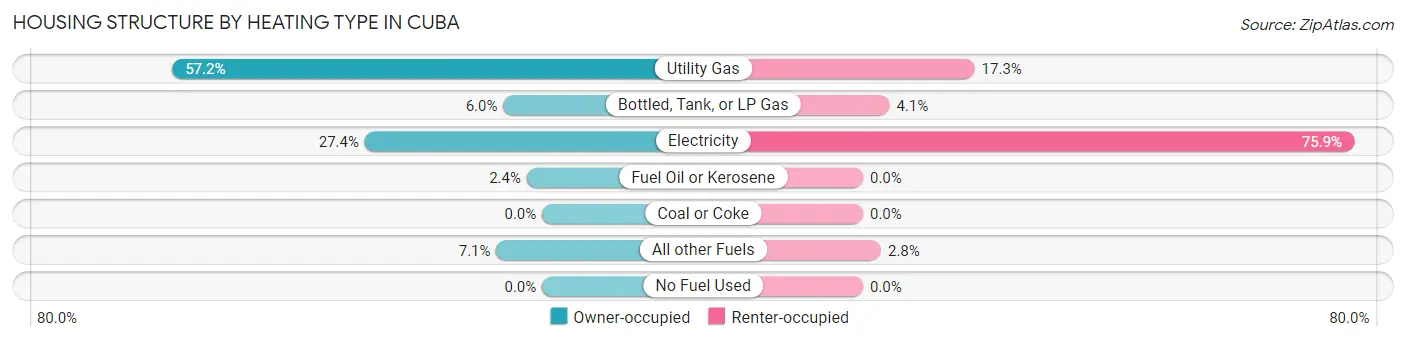
| Heating Type | Owner-occupied | Renter-occupied |
| Utility Gas | 267 (57.2%) | 118 (17.2%) |
| Bottled, Tank, or LP Gas | 28 (6.0%) | 28 (4.1%) |
| Electricity | 128 (27.4%) | 519 (75.9%) |
| Fuel Oil or Kerosene | 11 (2.4%) | 0 (0.0%) |
| Coal or Coke | 0 (0.0%) | 0 (0.0%) |
| All other Fuels | 33 (7.1%) | 19 (2.8%) |
| No Fuel Used | 0 (0.0%) | 0 (0.0%) |
| Total | 467 (100.0%) | 684 (100.0%) |
Household Vehicle Usage in Cuba
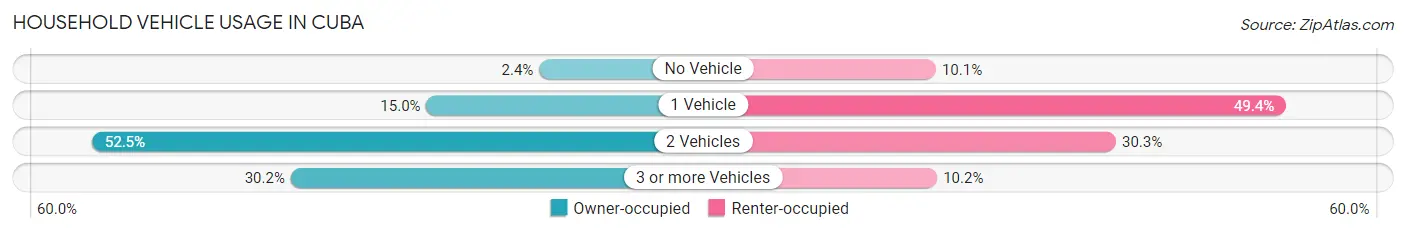
| Vehicles per Household | Owner-occupied | Renter-occupied |
| No Vehicle | 11 (2.4%) | 69 (10.1%) |
| 1 Vehicle | 70 (15.0%) | 338 (49.4%) |
| 2 Vehicles | 245 (52.5%) | 207 (30.3%) |
| 3 or more Vehicles | 141 (30.2%) | 70 (10.2%) |
| Total | 467 (100.0%) | 684 (100.0%) |
Real Estate & Mortgages in Cuba
Real Estate and Mortgage Overview in Cuba
| Characteristic | Without Mortgage | With Mortgage |
| Housing Units | 222 | 245 |
| Median Property Value | $139,600 | $184,500 |
| Median Household Income | $39,318 | $11 |
| Monthly Housing Costs | $369 | $0 |
| Real Estate Taxes | $922 | $0 |
Property Value by Mortgage Status in Cuba
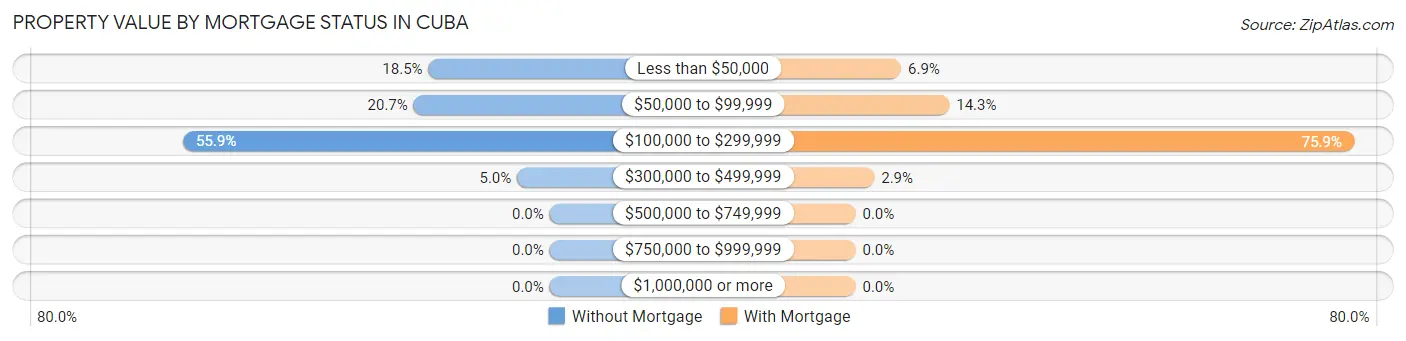
| Property Value | Without Mortgage | With Mortgage |
| Less than $50,000 | 41 (18.5%) | 17 (6.9%) |
| $50,000 to $99,999 | 46 (20.7%) | 35 (14.3%) |
| $100,000 to $299,999 | 124 (55.9%) | 186 (75.9%) |
| $300,000 to $499,999 | 11 (5.0%) | 7 (2.9%) |
| $500,000 to $749,999 | 0 (0.0%) | 0 (0.0%) |
| $750,000 to $999,999 | 0 (0.0%) | 0 (0.0%) |
| $1,000,000 or more | 0 (0.0%) | 0 (0.0%) |
| Total | 222 (100.0%) | 245 (100.0%) |
Household Income by Mortgage Status in Cuba
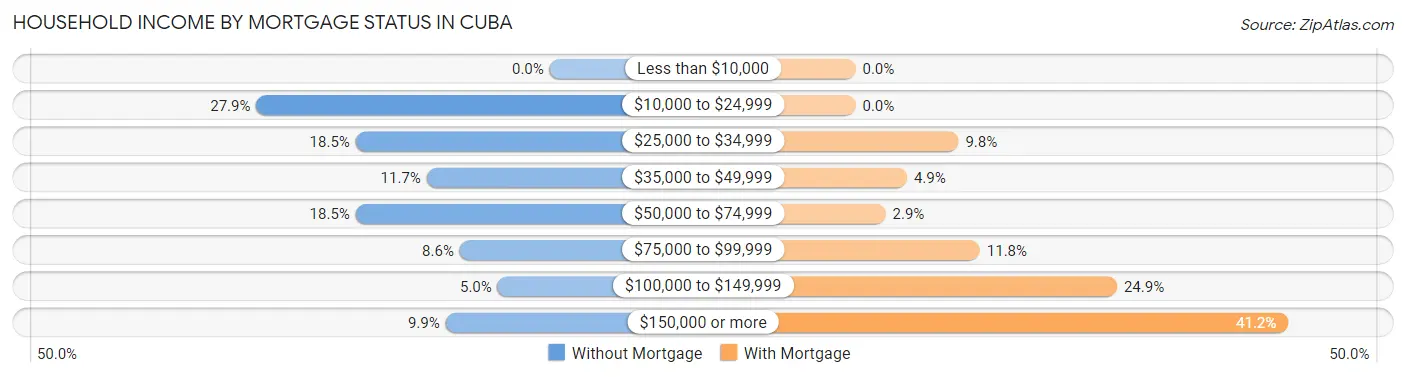
| Household Income | Without Mortgage | With Mortgage |
| Less than $10,000 | 0 (0.0%) | 0 (0.0%) |
| $10,000 to $24,999 | 62 (27.9%) | 0 (0.0%) |
| $25,000 to $34,999 | 41 (18.5%) | 24 (9.8%) |
| $35,000 to $49,999 | 26 (11.7%) | 12 (4.9%) |
| $50,000 to $74,999 | 41 (18.5%) | 7 (2.9%) |
| $75,000 to $99,999 | 19 (8.6%) | 29 (11.8%) |
| $100,000 to $149,999 | 11 (5.0%) | 61 (24.9%) |
| $150,000 or more | 22 (9.9%) | 101 (41.2%) |
| Total | 222 (100.0%) | 245 (100.0%) |
Property Value to Household Income Ratio in Cuba
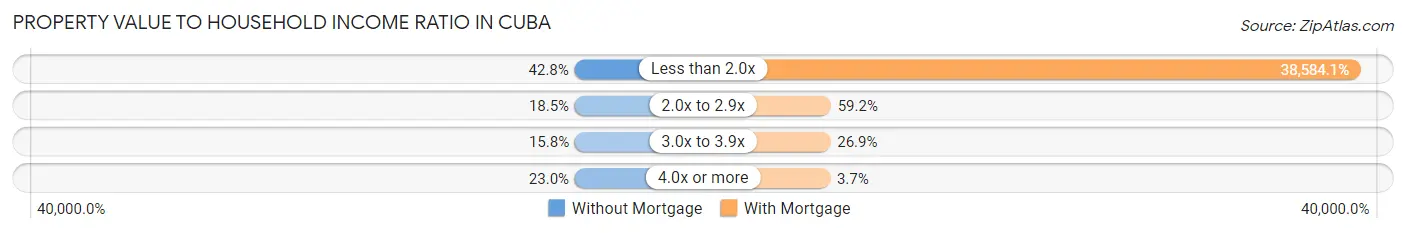
| Value-to-Income Ratio | Without Mortgage | With Mortgage |
| Less than 2.0x | 95 (42.8%) | 94,531 (38,584.1%) |
| 2.0x to 2.9x | 41 (18.5%) | 145 (59.2%) |
| 3.0x to 3.9x | 35 (15.8%) | 66 (26.9%) |
| 4.0x or more | 51 (23.0%) | 9 (3.7%) |
| Total | 222 (100.0%) | 245 (100.0%) |
Real Estate Taxes by Mortgage Status in Cuba
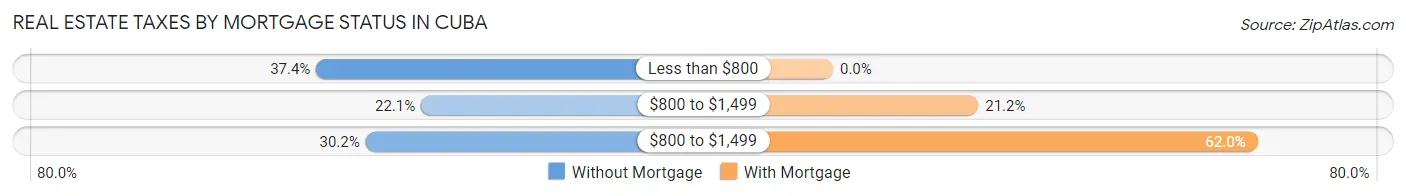
| Property Taxes | Without Mortgage | With Mortgage |
| Less than $800 | 83 (37.4%) | 0 (0.0%) |
| $800 to $1,499 | 49 (22.1%) | 52 (21.2%) |
| $800 to $1,499 | 67 (30.2%) | 152 (62.0%) |
| Total | 222 (100.0%) | 245 (100.0%) |
Health & Disability in Cuba
Health Insurance Coverage by Age in Cuba
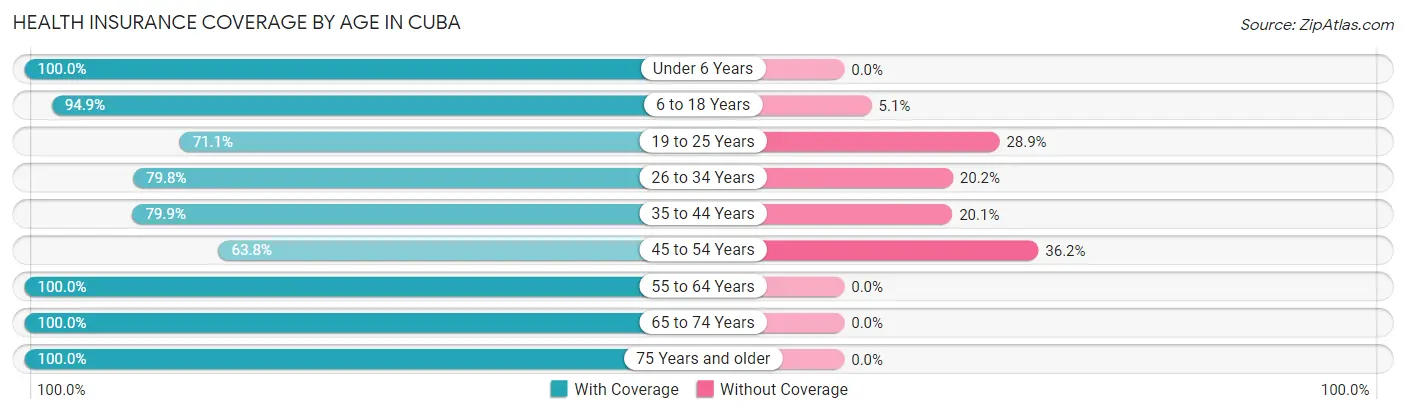
| Age Bracket | With Coverage | Without Coverage |
| Under 6 Years | 110 (100.0%) | 0 (0.0%) |
| 6 to 18 Years | 839 (94.9%) | 45 (5.1%) |
| 19 to 25 Years | 226 (71.1%) | 92 (28.9%) |
| 26 to 34 Years | 134 (79.8%) | 34 (20.2%) |
| 35 to 44 Years | 377 (79.9%) | 95 (20.1%) |
| 45 to 54 Years | 164 (63.8%) | 93 (36.2%) |
| 55 to 64 Years | 453 (100.0%) | 0 (0.0%) |
| 65 to 74 Years | 225 (100.0%) | 0 (0.0%) |
| 75 Years and older | 207 (100.0%) | 0 (0.0%) |
| Total | 2,735 (88.4%) | 359 (11.6%) |
Health Insurance Coverage by Citizenship Status in Cuba
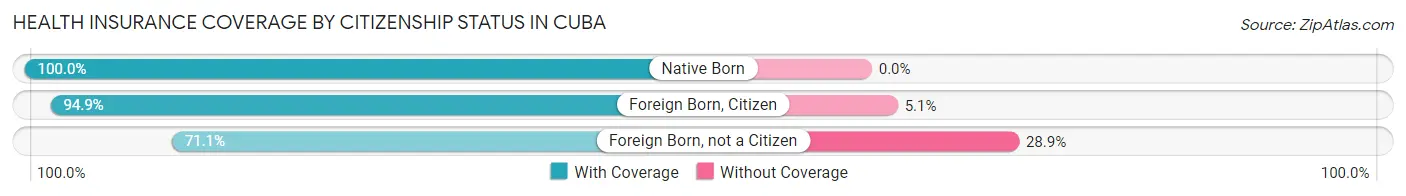
| Citizenship Status | With Coverage | Without Coverage |
| Native Born | 110 (100.0%) | 0 (0.0%) |
| Foreign Born, Citizen | 839 (94.9%) | 45 (5.1%) |
| Foreign Born, not a Citizen | 226 (71.1%) | 92 (28.9%) |
Health Insurance Coverage by Household Income in Cuba
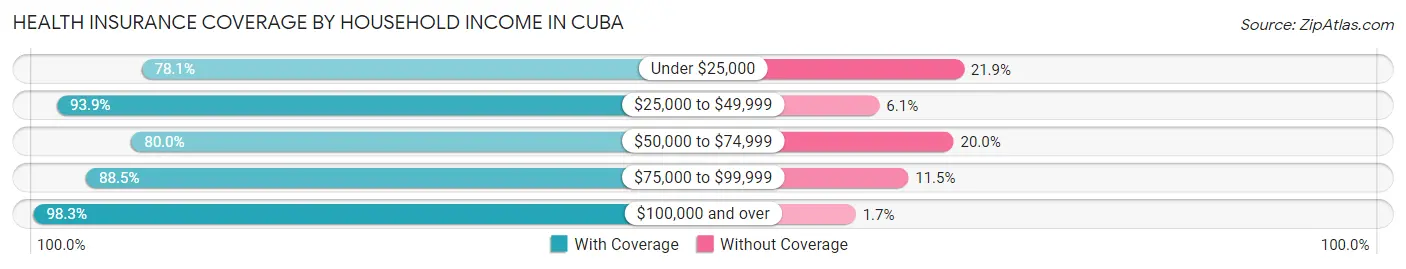
| Household Income | With Coverage | Without Coverage |
| Under $25,000 | 406 (78.1%) | 114 (21.9%) |
| $25,000 to $49,999 | 892 (93.9%) | 58 (6.1%) |
| $50,000 to $74,999 | 556 (80.0%) | 139 (20.0%) |
| $75,000 to $99,999 | 292 (88.5%) | 38 (11.5%) |
| $100,000 and over | 589 (98.3%) | 10 (1.7%) |
Public vs Private Health Insurance Coverage by Age in Cuba
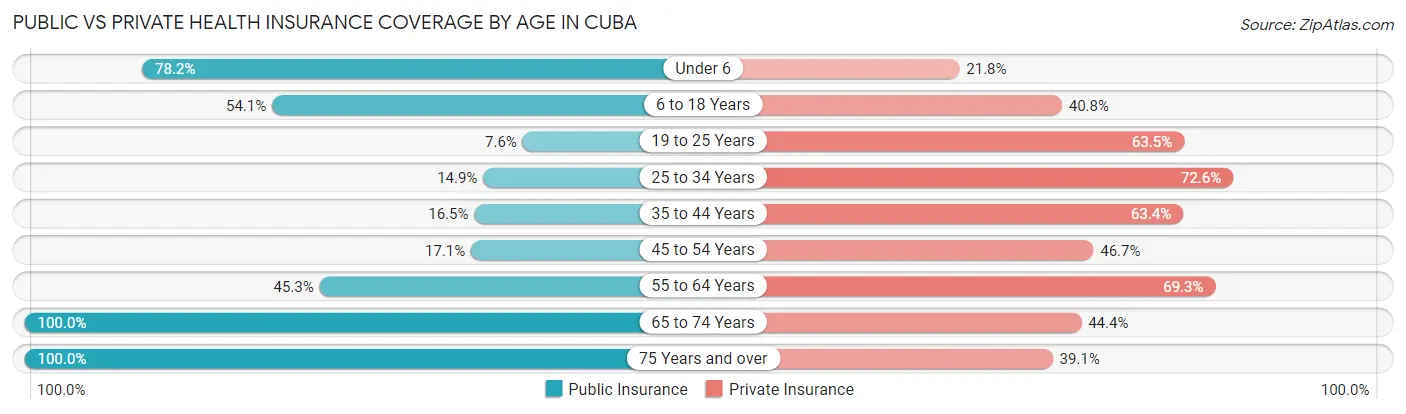
| Age Bracket | Public Insurance | Private Insurance |
| Under 6 | 86 (78.2%) | 24 (21.8%) |
| 6 to 18 Years | 478 (54.1%) | 361 (40.8%) |
| 19 to 25 Years | 24 (7.5%) | 202 (63.5%) |
| 25 to 34 Years | 25 (14.9%) | 122 (72.6%) |
| 35 to 44 Years | 78 (16.5%) | 299 (63.3%) |
| 45 to 54 Years | 44 (17.1%) | 120 (46.7%) |
| 55 to 64 Years | 205 (45.3%) | 314 (69.3%) |
| 65 to 74 Years | 225 (100.0%) | 100 (44.4%) |
| 75 Years and over | 207 (100.0%) | 81 (39.1%) |
| Total | 1,372 (44.3%) | 1,623 (52.5%) |
Disability Status by Sex by Age in Cuba
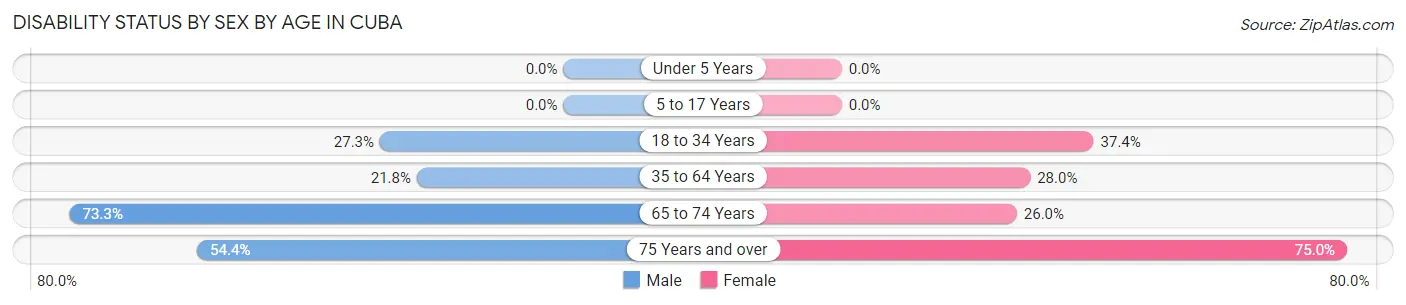
| Age Bracket | Male | Female |
| Under 5 Years | 0 (0.0%) | 0 (0.0%) |
| 5 to 17 Years | 0 (0.0%) | 0 (0.0%) |
| 18 to 34 Years | 97 (27.3%) | 89 (37.4%) |
| 35 to 64 Years | 104 (21.8%) | 197 (28.0%) |
| 65 to 74 Years | 55 (73.3%) | 39 (26.0%) |
| 75 Years and over | 56 (54.4%) | 78 (75.0%) |
Disability Class by Sex by Age in Cuba
Disability Class: Hearing Difficulty
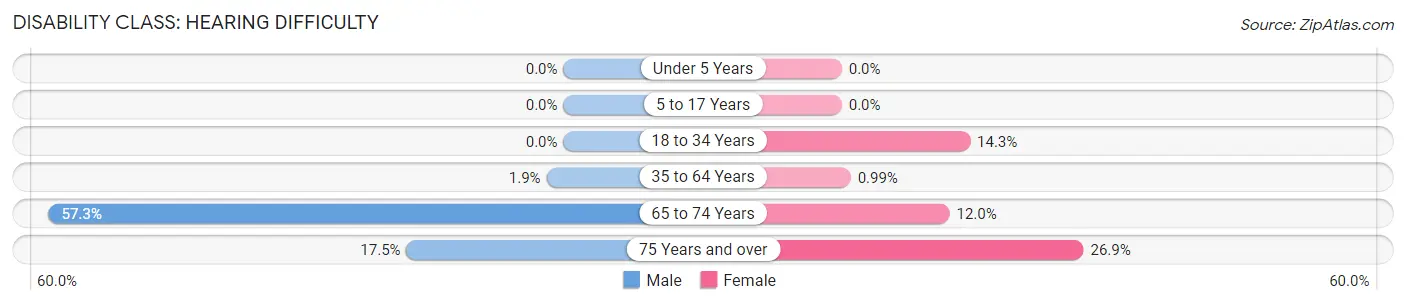
| Age Bracket | Male | Female |
| Under 5 Years | 0 (0.0%) | 0 (0.0%) |
| 5 to 17 Years | 0 (0.0%) | 0 (0.0%) |
| 18 to 34 Years | 0 (0.0%) | 34 (14.3%) |
| 35 to 64 Years | 9 (1.9%) | 7 (1.0%) |
| 65 to 74 Years | 43 (57.3%) | 18 (12.0%) |
| 75 Years and over | 18 (17.5%) | 28 (26.9%) |
Disability Class: Vision Difficulty
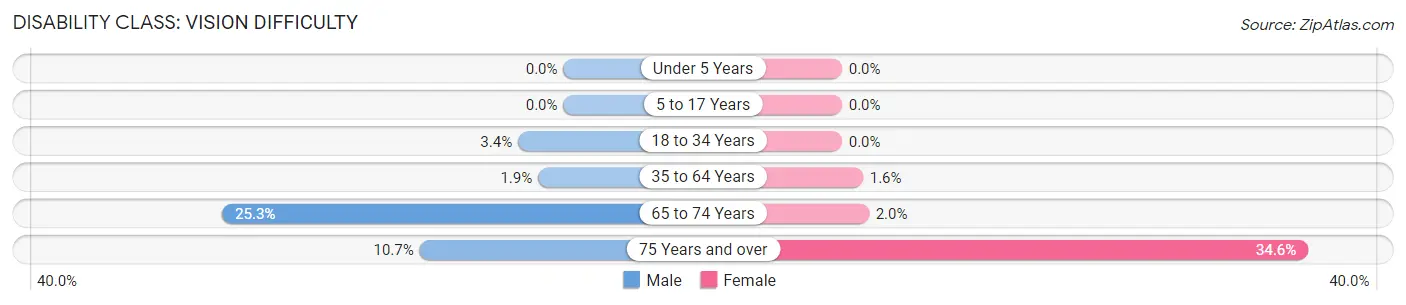
| Age Bracket | Male | Female |
| Under 5 Years | 0 (0.0%) | 0 (0.0%) |
| 5 to 17 Years | 0 (0.0%) | 0 (0.0%) |
| 18 to 34 Years | 12 (3.4%) | 0 (0.0%) |
| 35 to 64 Years | 9 (1.9%) | 11 (1.6%) |
| 65 to 74 Years | 19 (25.3%) | 3 (2.0%) |
| 75 Years and over | 11 (10.7%) | 36 (34.6%) |
Disability Class: Cognitive Difficulty
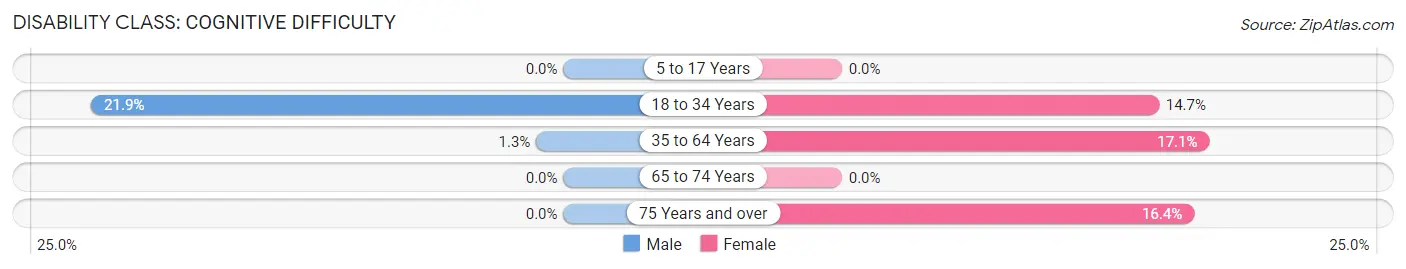
| Age Bracket | Male | Female |
| 5 to 17 Years | 0 (0.0%) | 0 (0.0%) |
| 18 to 34 Years | 78 (21.9%) | 35 (14.7%) |
| 35 to 64 Years | 6 (1.3%) | 120 (17.1%) |
| 65 to 74 Years | 0 (0.0%) | 0 (0.0%) |
| 75 Years and over | 0 (0.0%) | 17 (16.4%) |
Disability Class: Ambulatory Difficulty
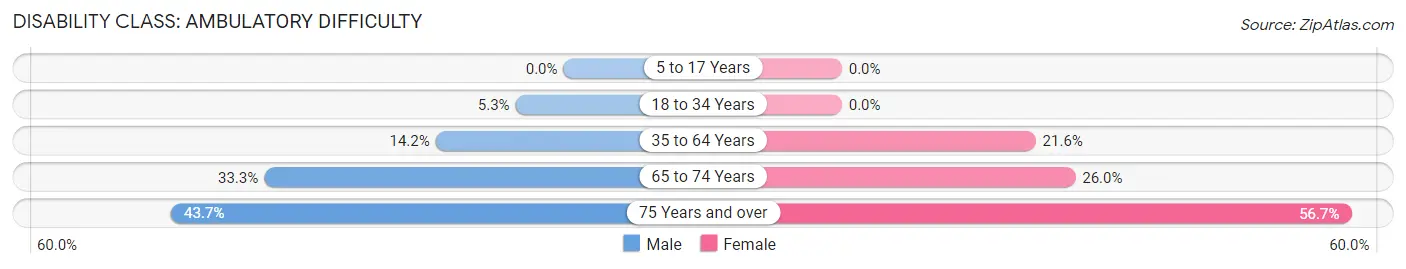
| Age Bracket | Male | Female |
| 5 to 17 Years | 0 (0.0%) | 0 (0.0%) |
| 18 to 34 Years | 19 (5.3%) | 0 (0.0%) |
| 35 to 64 Years | 68 (14.2%) | 152 (21.6%) |
| 65 to 74 Years | 25 (33.3%) | 39 (26.0%) |
| 75 Years and over | 45 (43.7%) | 59 (56.7%) |
Disability Class: Self-Care Difficulty
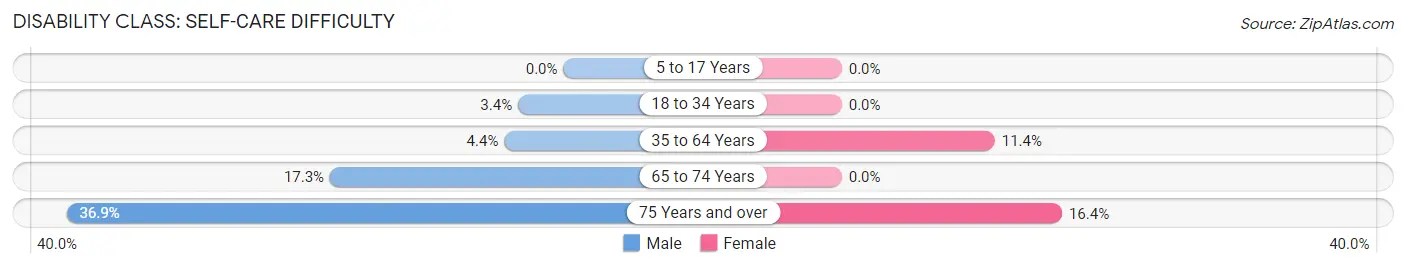
| Age Bracket | Male | Female |
| 5 to 17 Years | 0 (0.0%) | 0 (0.0%) |
| 18 to 34 Years | 12 (3.4%) | 0 (0.0%) |
| 35 to 64 Years | 21 (4.4%) | 80 (11.4%) |
| 65 to 74 Years | 13 (17.3%) | 0 (0.0%) |
| 75 Years and over | 38 (36.9%) | 17 (16.4%) |
Technology Access in Cuba
Computing Device Access in Cuba
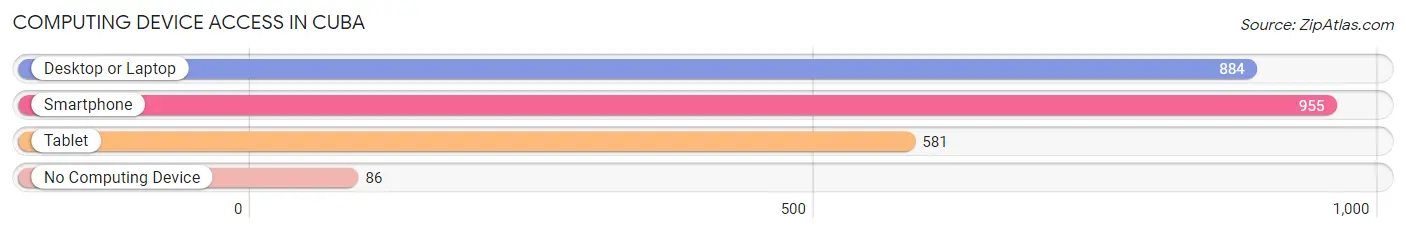
| Device Type | # Households | % Households |
| Desktop or Laptop | 884 | 76.8% |
| Smartphone | 955 | 83.0% |
| Tablet | 581 | 50.5% |
| No Computing Device | 86 | 7.5% |
| Total | 1,151 | 100.0% |
Internet Access in Cuba
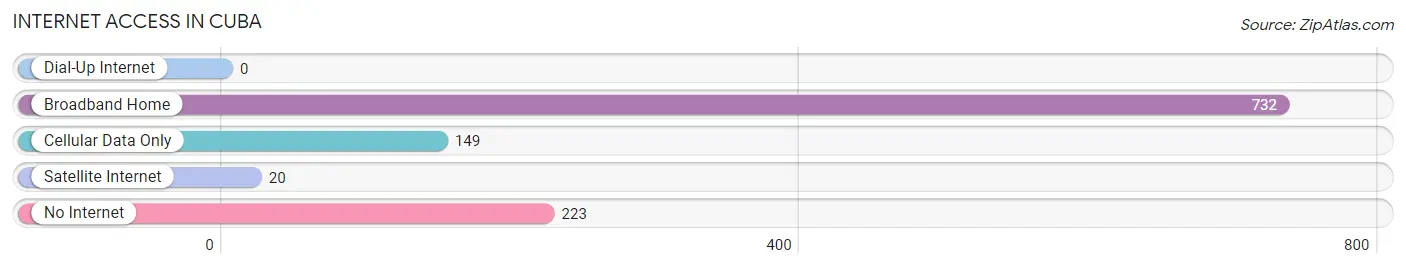
| Internet Type | # Households | % Households |
| Dial-Up Internet | 0 | 0.0% |
| Broadband Home | 732 | 63.6% |
| Cellular Data Only | 149 | 13.0% |
| Satellite Internet | 20 | 1.7% |
| No Internet | 223 | 19.4% |
| Total | 1,151 | 100.0% |
Cuba Summary
Cuba, Missouri is a small city located in Crawford County, Missouri. It is situated in the Ozark Mountains, approximately 70 miles southwest of St. Louis. The city has a population of 4,281 as of the 2010 census, and is the county seat of Crawford County.
Geography
Cuba is located at the intersection of Interstate 44 and U.S. Route 66. It is situated in the Ozark Mountains, and is surrounded by rolling hills and forests. The city is located in the Meramec River Valley, and is situated on the banks of the Meramec River. The city is located at an elevation of 890 feet above sea level.
History
Cuba was founded in 1835 by a group of settlers from Kentucky. The city was named after the island of Cuba, which was located off the coast of Florida. The city was incorporated in 1837, and was designated as the county seat of Crawford County.
In the late 19th century, Cuba was a major stop on the St. Louis-San Francisco Railway, and was a popular tourist destination. The city was also home to a number of coal mines, which provided employment for many of the city’s residents.
In the early 20th century, Cuba was a popular destination for tourists, and was home to a number of resorts and hotels. The city was also home to a number of manufacturing plants, including a shoe factory and a furniture factory.
Economy
Cuba’s economy is largely based on tourism and manufacturing. The city is home to a number of tourist attractions, including the Meramec Caverns, which are the largest commercial caves in the United States. The city is also home to a number of manufacturing plants, including a shoe factory and a furniture factory.
Demographics
As of the 2010 census, Cuba had a population of 4,281. The racial makeup of the city was 95.2% White, 0.7% African American, 0.3% Native American, 0.3% Asian, 0.1% Pacific Islander, 1.2% from other races, and 2.3% from two or more races. Hispanic or Latino of any race were 3.2% of the population.
The median income for a household in the city was $30,938, and the median income for a family was $37,917. The per capita income for the city was $17,845. About 16.2% of families and 19.2% of the population were below the poverty line, including 28.2% of those under age 18 and 11.2% of those age 65 or over.
Conclusion
Cuba, Missouri is a small city located in Crawford County, Missouri. It is situated in the Ozark Mountains, and is surrounded by rolling hills and forests. The city has a population of 4,281 as of the 2010 census, and is the county seat of Crawford County. The city’s economy is largely based on tourism and manufacturing, and it is home to a number of tourist attractions and manufacturing plants. The racial makeup of the city is 95.2% White, 0.7% African American, 0.3% Native American, 0.3% Asian, 0.1% Pacific Islander, 1.2% from other races, and 2.3% from two or more races. The median income for a household in the city was $30,938, and the median income for a family was $37,917. About 16.2% of families and 19.2% of the population were below the poverty line.
Common Questions
What is Per Capita Income in Cuba?
Per Capita income in Cuba is $22,351.
What is the Median Family Income in Cuba?
Median Family Income in Cuba is $53,382.
What is the Median Household income in Cuba?
Median Household Income in Cuba is $42,641.
What is Income or Wage Gap in Cuba?
Income or Wage Gap in Cuba is 29.3%.
Women in Cuba earn 70.7 cents for every dollar earned by a man.
What is Inequality or Gini Index in Cuba?
Inequality or Gini Index in Cuba is 0.48.
What is the Total Population of Cuba?
Total Population of Cuba is 3,173.
What is the Total Male Population of Cuba?
Total Male Population of Cuba is 1,489.
What is the Total Female Population of Cuba?
Total Female Population of Cuba is 1,684.
What is the Ratio of Males per 100 Females in Cuba?
There are 88.42 Males per 100 Females in Cuba.
What is the Ratio of Females per 100 Males in Cuba?
There are 113.10 Females per 100 Males in Cuba.
What is the Median Population Age in Cuba?
Median Population Age in Cuba is 36.9 Years.
What is the Average Family Size in Cuba
Average Family Size in Cuba is 3.2 People.
What is the Average Household Size in Cuba
Average Household Size in Cuba is 2.7 People.
How Large is the Labor Force in Cuba?
There are 1,276 People in the Labor Forcein in Cuba.
What is the Percentage of People in the Labor Force in Cuba?
50.1% of People are in the Labor Force in Cuba.