Cole Camp, MO Map & Demographics
Cole Camp Map
Cole Camp Overview
$25,028
PER CAPITA INCOME
$70,833
AVG FAMILY INCOME
$40,192
AVG HOUSEHOLD INCOME
36.8%
WAGE / INCOME GAP [ % ]
63.2¢/ $1
WAGE / INCOME GAP [ $ ]
0.47
INEQUALITY / GINI INDEX
1,363
TOTAL POPULATION
628
MALE POPULATION
735
FEMALE POPULATION
85.44
MALES / 100 FEMALES
117.04
FEMALES / 100 MALES
47.2
MEDIAN AGE
3.3
AVG FAMILY SIZE
2.3
AVG HOUSEHOLD SIZE
549
LABOR FORCE [ PEOPLE ]
48.0%
PERCENT IN LABOR FORCE
0.5%
UNEMPLOYMENT RATE
Cole Camp Zip Codes
Cole Camp Area Codes
Income in Cole Camp
Income Overview in Cole Camp
Per Capita Income in Cole Camp is $25,028, while median incomes of families and households are $70,833 and $40,192 respectively.
| Characteristic | Number | Measure |
| Per Capita Income | 1,363 | $25,028 |
| Median Family Income | 314 | $70,833 |
| Mean Family Income | 314 | $79,565 |
| Median Household Income | 564 | $40,192 |
| Mean Household Income | 564 | $57,803 |
| Income Deficit | 314 | $0 |
| Wage / Income Gap (%) | 1,363 | 36.81% |
| Wage / Income Gap ($) | 1,363 | 63.19¢ per $1 |
| Gini / Inequality Index | 1,363 | 0.47 |
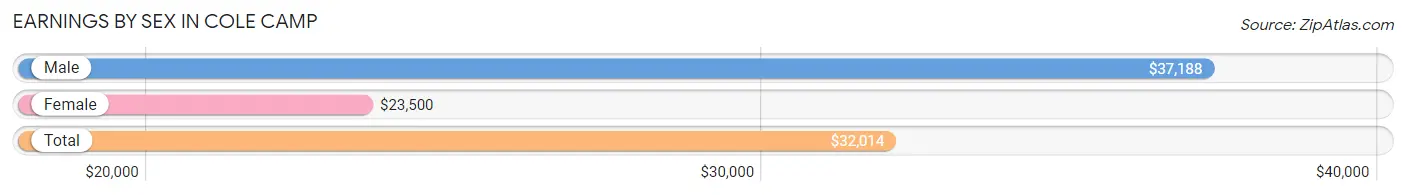
Earnings by Sex in Cole Camp
Average Earnings in Cole Camp are $32,014, $37,188 for men and $23,500 for women, a difference of 36.8%.
| Sex | Number | Average Earnings |
| Male | 363 (52.8%) | $37,188 |
| Female | 324 (47.2%) | $23,500 |
| Total | 687 (100.0%) | $32,014 |
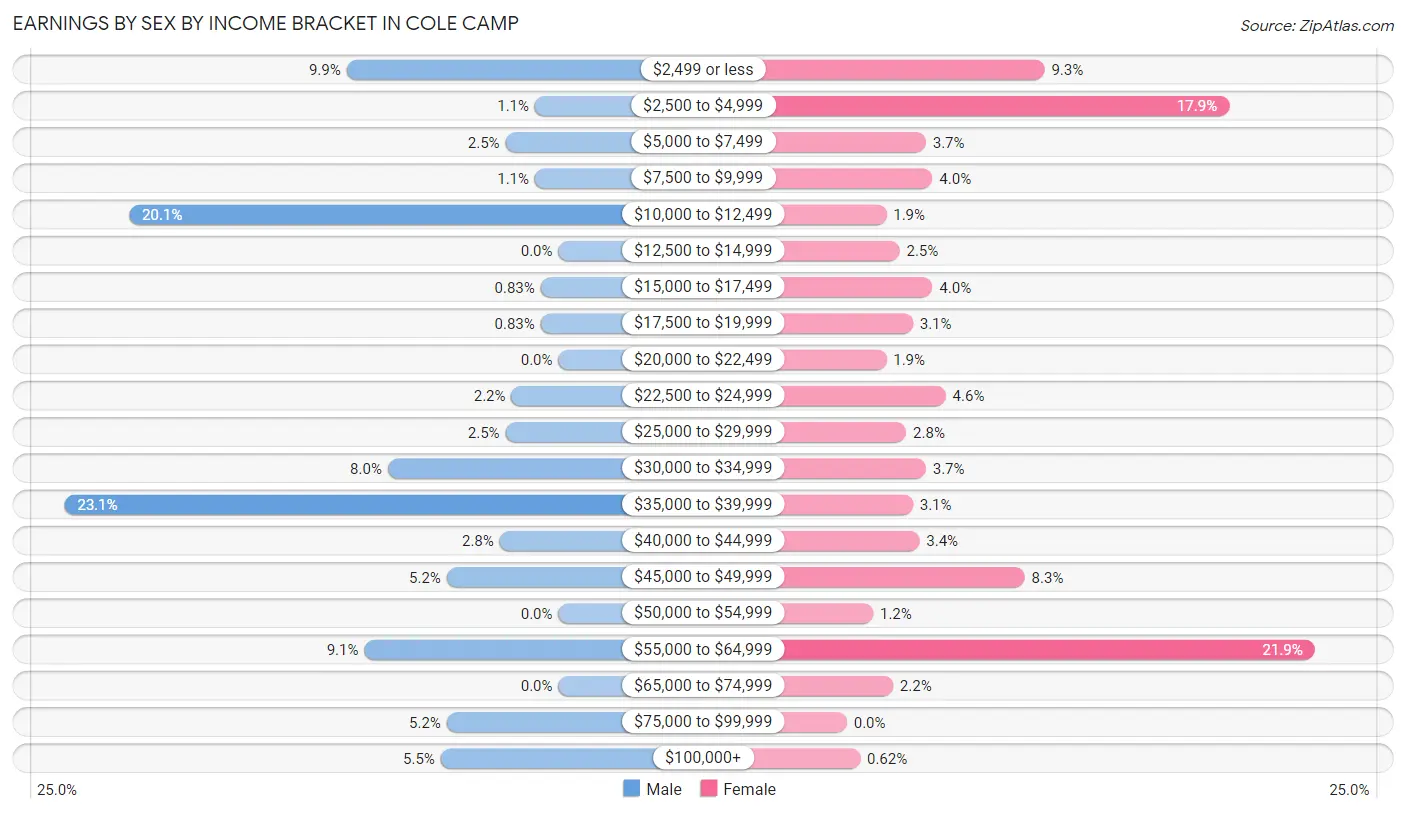
Earnings by Sex by Income Bracket in Cole Camp
The most common earnings brackets in Cole Camp are $35,000 to $39,999 for men (84 | 23.1%) and $55,000 to $64,999 for women (71 | 21.9%).
| Income | Male | Female |
| $2,499 or less | 36 (9.9%) | 30 (9.3%) |
| $2,500 to $4,999 | 4 (1.1%) | 58 (17.9%) |
| $5,000 to $7,499 | 9 (2.5%) | 12 (3.7%) |
| $7,500 to $9,999 | 4 (1.1%) | 13 (4.0%) |
| $10,000 to $12,499 | 73 (20.1%) | 6 (1.8%) |
| $12,500 to $14,999 | 0 (0.0%) | 8 (2.5%) |
| $15,000 to $17,499 | 3 (0.8%) | 13 (4.0%) |
| $17,500 to $19,999 | 3 (0.8%) | 10 (3.1%) |
| $20,000 to $22,499 | 0 (0.0%) | 6 (1.8%) |
| $22,500 to $24,999 | 8 (2.2%) | 15 (4.6%) |
| $25,000 to $29,999 | 9 (2.5%) | 9 (2.8%) |
| $30,000 to $34,999 | 29 (8.0%) | 12 (3.7%) |
| $35,000 to $39,999 | 84 (23.1%) | 10 (3.1%) |
| $40,000 to $44,999 | 10 (2.8%) | 11 (3.4%) |
| $45,000 to $49,999 | 19 (5.2%) | 27 (8.3%) |
| $50,000 to $54,999 | 0 (0.0%) | 4 (1.2%) |
| $55,000 to $64,999 | 33 (9.1%) | 71 (21.9%) |
| $65,000 to $74,999 | 0 (0.0%) | 7 (2.2%) |
| $75,000 to $99,999 | 19 (5.2%) | 0 (0.0%) |
| $100,000+ | 20 (5.5%) | 2 (0.6%) |
| Total | 363 (100.0%) | 324 (100.0%) |
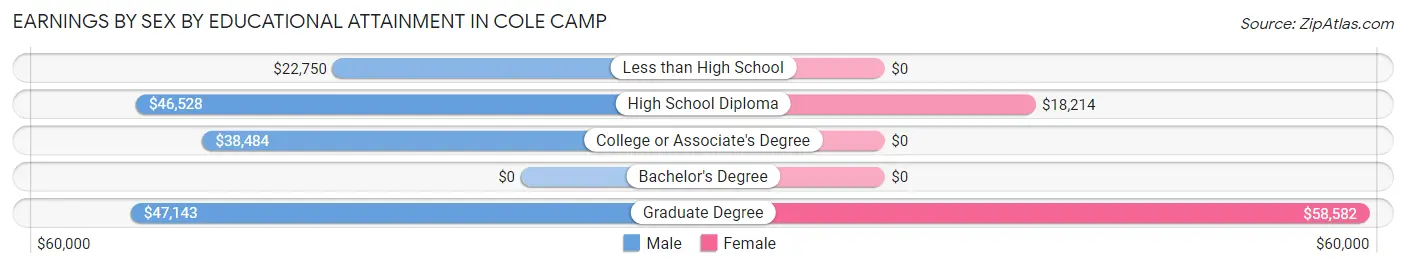
Earnings by Sex by Educational Attainment in Cole Camp
Average earnings in Cole Camp are $38,734 for men and $32,679 for women, a difference of 15.6%. Men with an educational attainment of graduate degree enjoy the highest average annual earnings of $47,143, while those with less than high school education earn the least with $22,750. Women with an educational attainment of graduate degree earn the most with the average annual earnings of $58,582, while those with high school diploma education have the smallest earnings of $18,214.
| Educational Attainment | Male Income | Female Income |
| Less than High School | $22,750 | $0 |
| High School Diploma | $46,528 | $18,214 |
| College or Associate's Degree | $38,484 | $0 |
| Bachelor's Degree | - | - |
| Graduate Degree | $47,143 | $58,582 |
| Total | $38,734 | $32,679 |
Family Income in Cole Camp
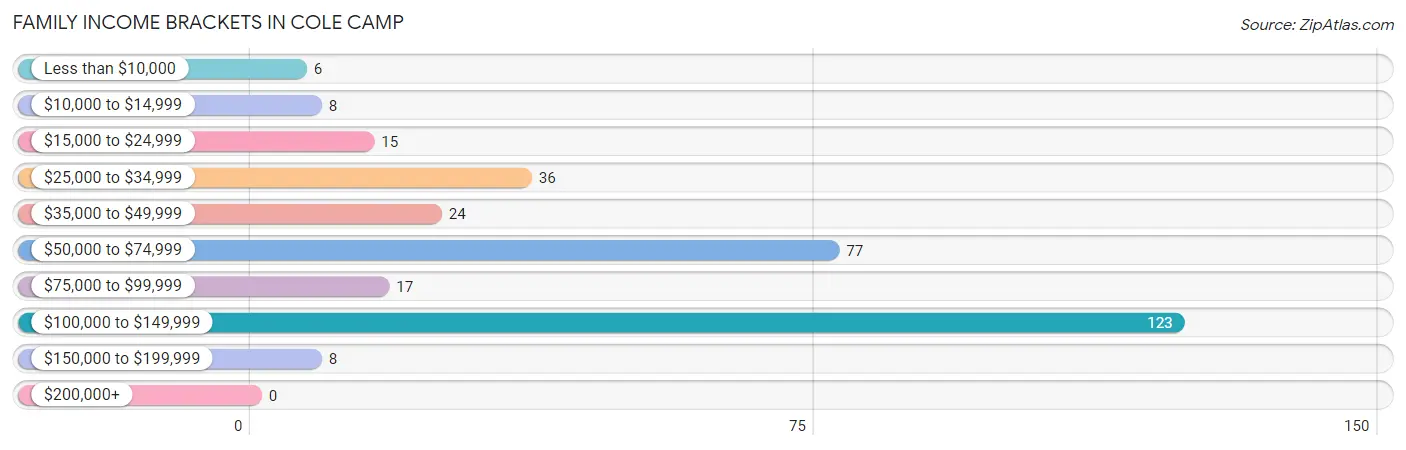
Family Income Brackets in Cole Camp
According to the Cole Camp family income data, there are 123 families falling into the $100,000 to $149,999 income range, which is the most common income bracket and makes up 39.2% of all families.
| Income Bracket | # Families | % Families |
| Less than $10,000 | 6 | 1.9% |
| $10,000 to $14,999 | 8 | 2.5% |
| $15,000 to $24,999 | 15 | 4.8% |
| $25,000 to $34,999 | 36 | 11.5% |
| $35,000 to $49,999 | 24 | 7.6% |
| $50,000 to $74,999 | 77 | 24.5% |
| $75,000 to $99,999 | 17 | 5.4% |
| $100,000 to $149,999 | 123 | 39.2% |
| $150,000 to $199,999 | 8 | 2.5% |
| $200,000+ | 0 | 0.0% |
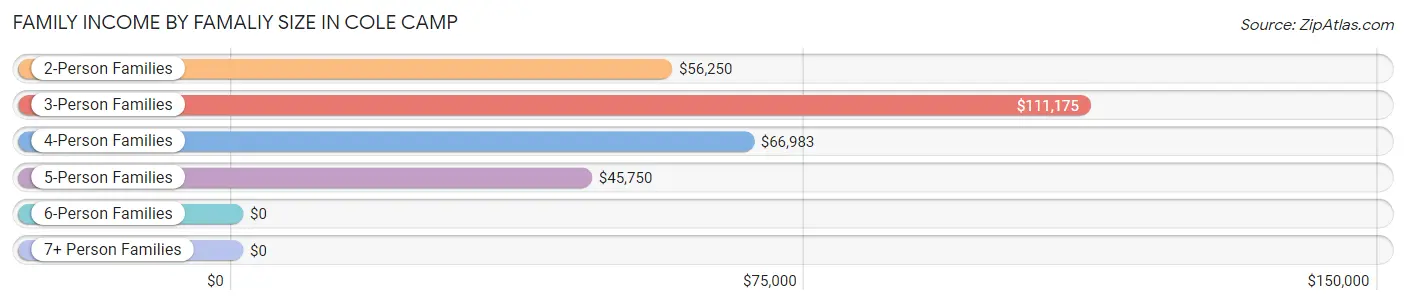
Family Income by Famaliy Size in Cole Camp
3-person families (109 | 34.7%) account for the highest median family income in Cole Camp with $111,175 per family, while 3-person families (109 | 34.7%) have the highest median income of $37,058 per family member.
| Income Bracket | # Families | Median Income |
| 2-Person Families | 122 (38.9%) | $56,250 |
| 3-Person Families | 109 (34.7%) | $111,175 |
| 4-Person Families | 54 (17.2%) | $66,983 |
| 5-Person Families | 19 (6.0%) | $45,750 |
| 6-Person Families | 8 (2.5%) | $0 |
| 7+ Person Families | 2 (0.6%) | $0 |
| Total | 314 (100.0%) | $70,833 |
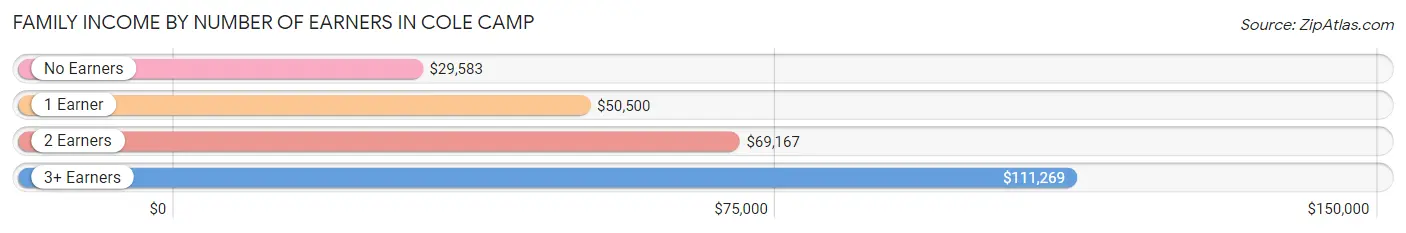
Family Income by Number of Earners in Cole Camp
The median family income in Cole Camp is $70,833, with families comprising 3+ earners (74) having the highest median family income of $111,269, while families with no earners (50) have the lowest median family income of $29,583, accounting for 23.6% and 15.9% of families, respectively.
| Number of Earners | # Families | Median Income |
| No Earners | 50 (15.9%) | $29,583 |
| 1 Earner | 78 (24.8%) | $50,500 |
| 2 Earners | 112 (35.7%) | $69,167 |
| 3+ Earners | 74 (23.6%) | $111,269 |
| Total | 314 (100.0%) | $70,833 |
Household Income in Cole Camp
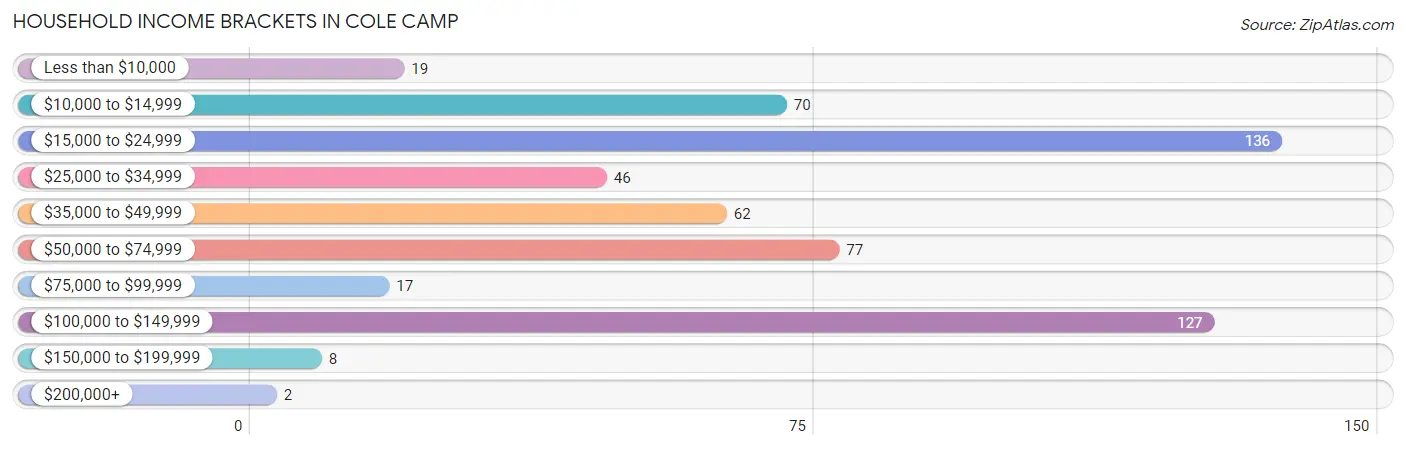
Household Income Brackets in Cole Camp
With 136 households falling in the category, the $15,000 to $24,999 income range is the most frequent in Cole Camp, accounting for 24.1% of all households. In contrast, only 2 households (0.4%) fall into the $200,000+ income bracket, making it the least populous group.
| Income Bracket | # Households | % Households |
| Less than $10,000 | 19 | 3.4% |
| $10,000 to $14,999 | 70 | 12.4% |
| $15,000 to $24,999 | 136 | 24.1% |
| $25,000 to $34,999 | 46 | 8.2% |
| $35,000 to $49,999 | 62 | 11.0% |
| $50,000 to $74,999 | 77 | 13.7% |
| $75,000 to $99,999 | 17 | 3.0% |
| $100,000 to $149,999 | 127 | 22.5% |
| $150,000 to $199,999 | 8 | 1.4% |
| $200,000+ | 2 | 0.4% |
Household Income by Householder Age in Cole Camp
The median household income in Cole Camp is $40,192, with the highest median household income of $72,083 found in the 45 to 64 years age bracket for the primary householder. A total of 227 households (40.3%) fall into this category.
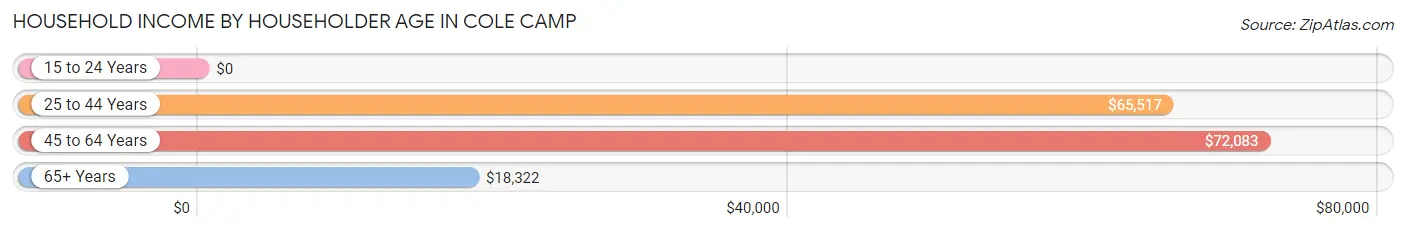
| Income Bracket | # Households | Median Income |
| 15 to 24 Years | 0 (0.0%) | $0 |
| 25 to 44 Years | 80 (14.2%) | $65,517 |
| 45 to 64 Years | 227 (40.3%) | $72,083 |
| 65+ Years | 257 (45.6%) | $18,322 |
| Total | 564 (100.0%) | $40,192 |
Poverty in Cole Camp
Income Below Poverty by Sex and Age in Cole Camp
With 10.4% poverty level for males and 18.9% for females among the residents of Cole Camp, under 5 year old males and 18 to 24 year old females are the most vulnerable to poverty, with 13 males (50.0%) and 24 females (45.3%) in their respective age groups living below the poverty level.
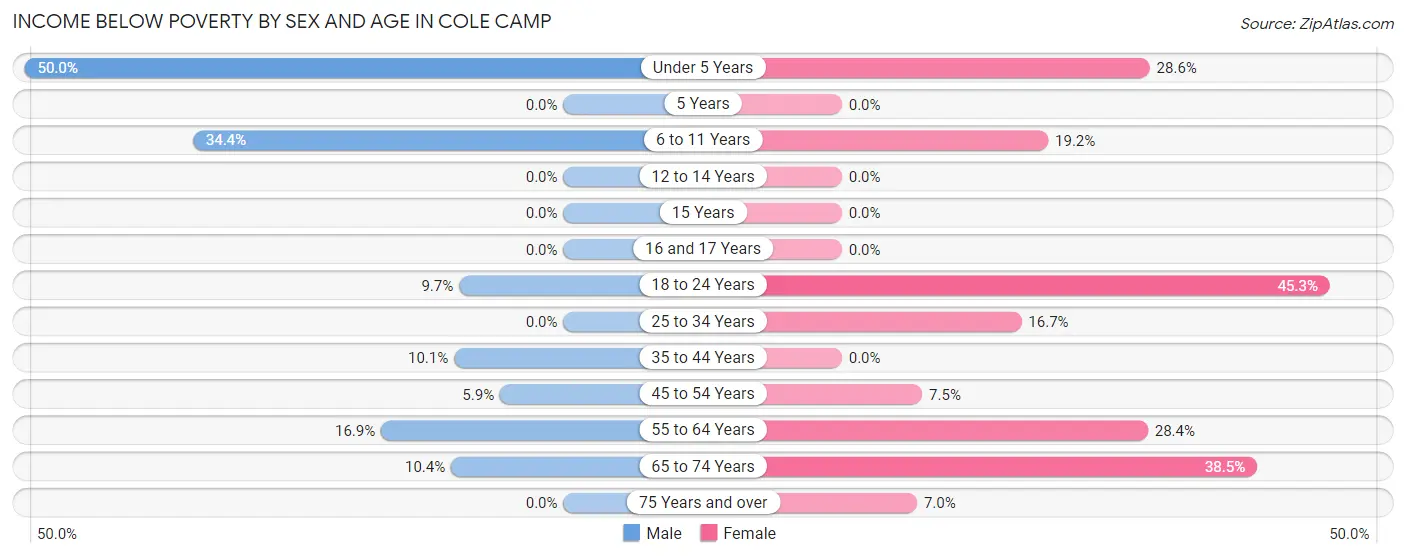
| Age Bracket | Male | Female |
| Under 5 Years | 13 (50.0%) | 8 (28.6%) |
| 5 Years | 0 (0.0%) | 0 (0.0%) |
| 6 to 11 Years | 11 (34.4%) | 9 (19.2%) |
| 12 to 14 Years | 0 (0.0%) | 0 (0.0%) |
| 15 Years | 0 (0.0%) | 0 (0.0%) |
| 16 and 17 Years | 0 (0.0%) | 0 (0.0%) |
| 18 to 24 Years | 9 (9.7%) | 24 (45.3%) |
| 25 to 34 Years | 0 (0.0%) | 8 (16.7%) |
| 35 to 44 Years | 7 (10.1%) | 0 (0.0%) |
| 45 to 54 Years | 7 (5.9%) | 10 (7.5%) |
| 55 to 64 Years | 11 (16.9%) | 23 (28.4%) |
| 65 to 74 Years | 5 (10.4%) | 42 (38.5%) |
| 75 Years and over | 0 (0.0%) | 9 (7.0%) |
| Total | 63 (10.4%) | 133 (18.9%) |
Income Above Poverty by Sex and Age in Cole Camp
According to the poverty statistics in Cole Camp, males aged 5 years and females aged 12 to 14 years are the age groups that are most secure financially, with 100.0% of males and 100.0% of females in these age groups living above the poverty line.
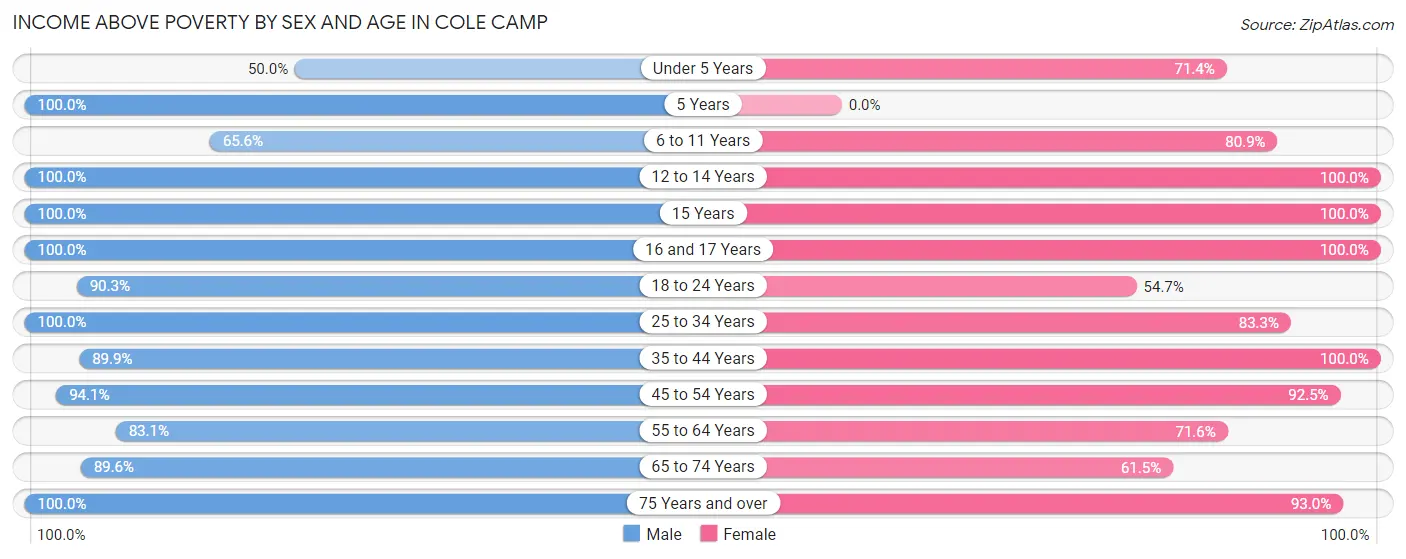
| Age Bracket | Male | Female |
| Under 5 Years | 13 (50.0%) | 20 (71.4%) |
| 5 Years | 27 (100.0%) | 0 (0.0%) |
| 6 to 11 Years | 21 (65.6%) | 38 (80.8%) |
| 12 to 14 Years | 30 (100.0%) | 16 (100.0%) |
| 15 Years | 10 (100.0%) | 4 (100.0%) |
| 16 and 17 Years | 6 (100.0%) | 30 (100.0%) |
| 18 to 24 Years | 84 (90.3%) | 29 (54.7%) |
| 25 to 34 Years | 43 (100.0%) | 40 (83.3%) |
| 35 to 44 Years | 62 (89.9%) | 25 (100.0%) |
| 45 to 54 Years | 112 (94.1%) | 124 (92.5%) |
| 55 to 64 Years | 54 (83.1%) | 58 (71.6%) |
| 65 to 74 Years | 43 (89.6%) | 67 (61.5%) |
| 75 Years and over | 40 (100.0%) | 120 (93.0%) |
| Total | 545 (89.6%) | 571 (81.1%) |
Income Below Poverty Among Married-Couple Families in Cole Camp
The poverty statistics for married-couple families in Cole Camp show that 6.5% or 17 of the total 262 families live below the poverty line. Families with 3 or 4 children have the highest poverty rate of 36.4%, comprising of 8 families. On the other hand, families with 1 or 2 children have the lowest poverty rate of 0.0%, which includes 0 families.
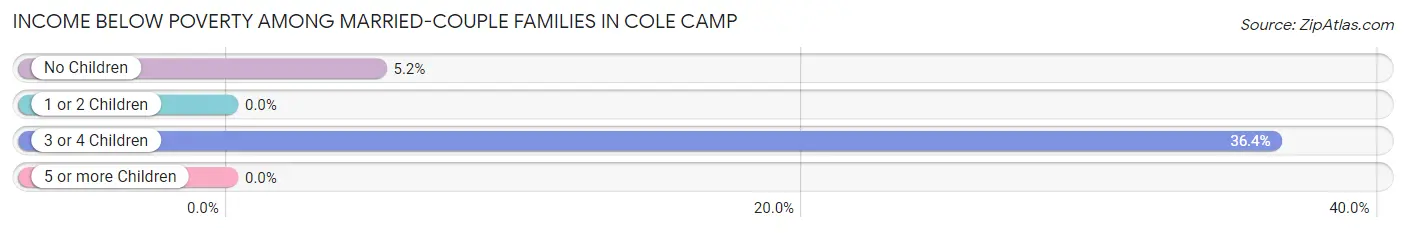
| Children | Above Poverty | Below Poverty |
| No Children | 165 (94.8%) | 9 (5.2%) |
| 1 or 2 Children | 64 (100.0%) | 0 (0.0%) |
| 3 or 4 Children | 14 (63.6%) | 8 (36.4%) |
| 5 or more Children | 2 (100.0%) | 0 (0.0%) |
| Total | 245 (93.5%) | 17 (6.5%) |
Income Below Poverty Among Single-Parent Households in Cole Camp
According to the poverty data in Cole Camp, 31.2% or 5 single-father households and 8.3% or 3 single-mother households are living below the poverty line. Among single-father households, those with no children have the highest poverty rate, with 5 households (100.0%) experiencing poverty. Likewise, among single-mother households, those with no children have the highest poverty rate, with 3 households (27.3%) falling below the poverty line.
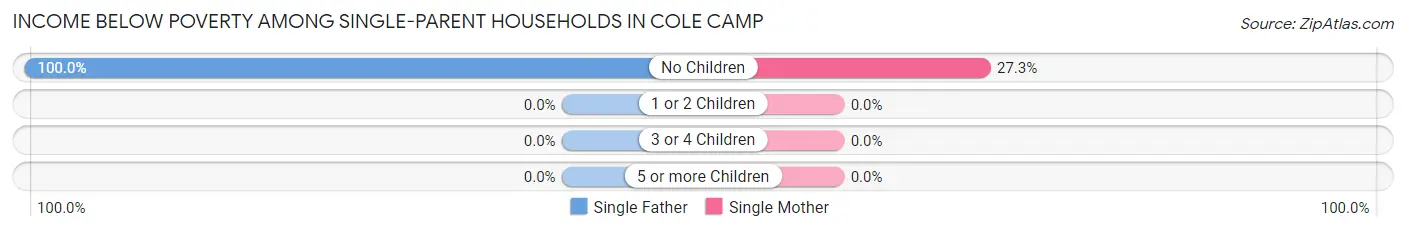
| Children | Single Father | Single Mother |
| No Children | 5 (100.0%) | 3 (27.3%) |
| 1 or 2 Children | 0 (0.0%) | 0 (0.0%) |
| 3 or 4 Children | 0 (0.0%) | 0 (0.0%) |
| 5 or more Children | 0 (0.0%) | 0 (0.0%) |
| Total | 5 (31.2%) | 3 (8.3%) |
Income Below Poverty Among Married-Couple vs Single-Parent Households in Cole Camp
The poverty data for Cole Camp shows that 17 of the married-couple family households (6.5%) and 8 of the single-parent households (15.4%) are living below the poverty level. Within the married-couple family households, those with 3 or 4 children have the highest poverty rate, with 8 households (36.4%) falling below the poverty line. Among the single-parent households, those with no children have the highest poverty rate, with 8 household (50.0%) living below poverty.
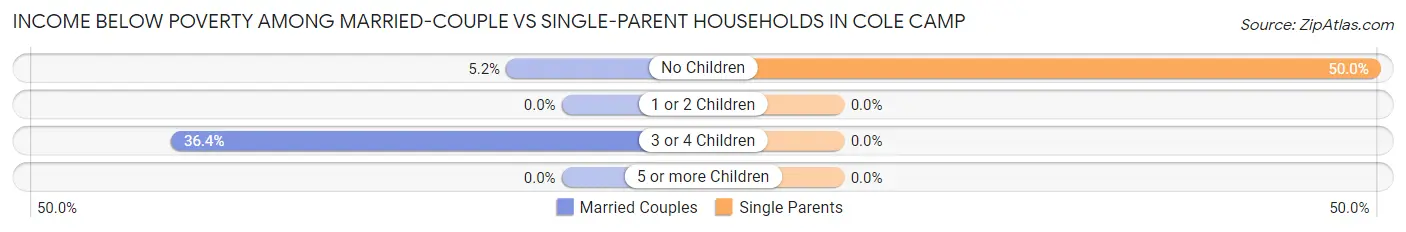
| Children | Married-Couple Families | Single-Parent Households |
| No Children | 9 (5.2%) | 8 (50.0%) |
| 1 or 2 Children | 0 (0.0%) | 0 (0.0%) |
| 3 or 4 Children | 8 (36.4%) | 0 (0.0%) |
| 5 or more Children | 0 (0.0%) | 0 (0.0%) |
| Total | 17 (6.5%) | 8 (15.4%) |
Race in Cole Camp
The most populous races in Cole Camp are White / Caucasian (1,353 | 99.3%), Some other Race (5 | 0.4%), and Hispanic or Latino (4 | 0.3%).
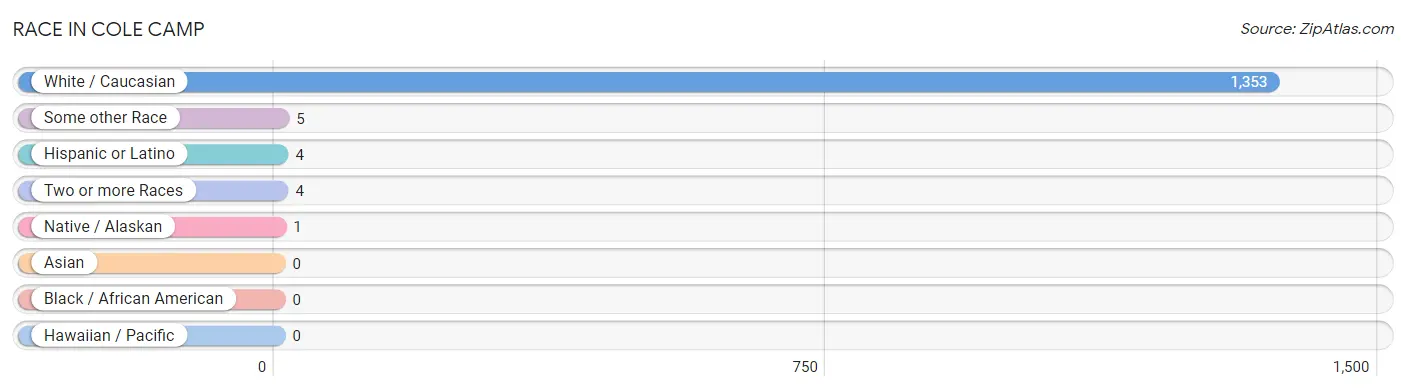
| Race | # Population | % Population |
| Asian | 0 | 0.0% |
| Black / African American | 0 | 0.0% |
| Hawaiian / Pacific | 0 | 0.0% |
| Hispanic or Latino | 4 | 0.3% |
| Native / Alaskan | 1 | 0.1% |
| White / Caucasian | 1,353 | 99.3% |
| Two or more Races | 4 | 0.3% |
| Some other Race | 5 | 0.4% |
| Total | 1,363 | 100.0% |
Ancestry in Cole Camp
The most populous ancestries reported in Cole Camp are German (633 | 46.4%), American (149 | 10.9%), Irish (137 | 10.1%), English (124 | 9.1%), and Scottish (45 | 3.3%), together accounting for 79.8% of all Cole Camp residents.
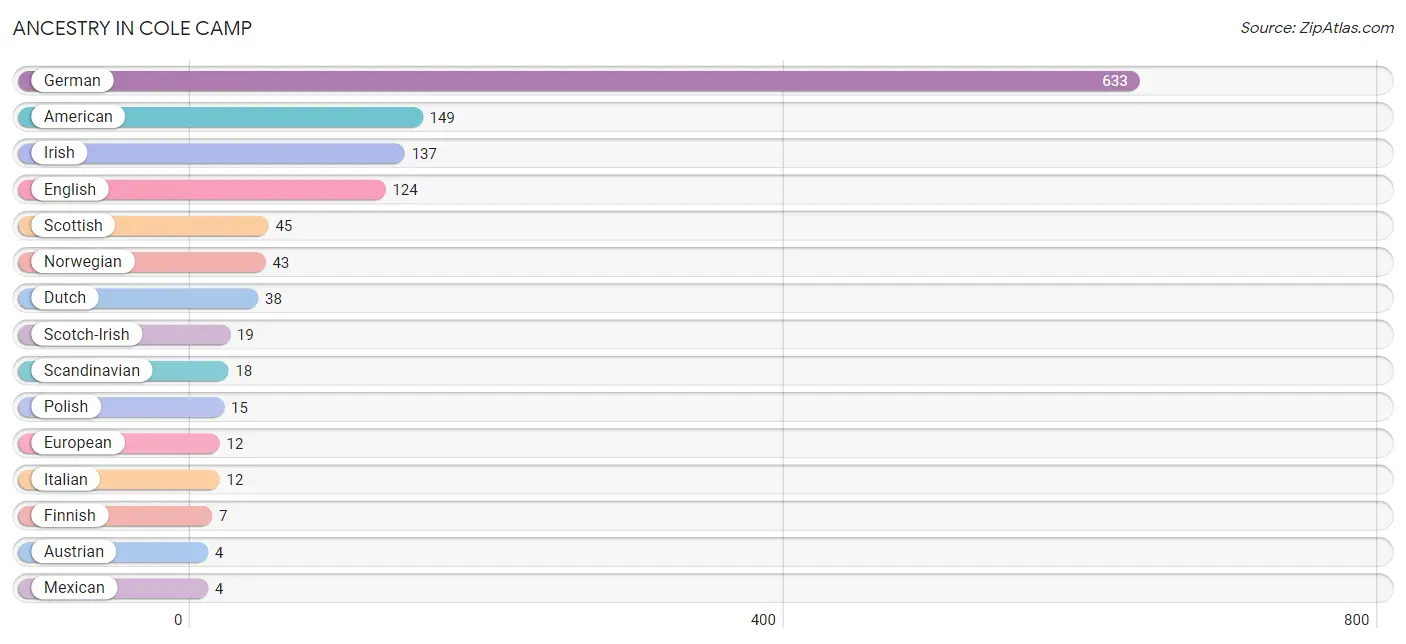
| Ancestry | # Population | % Population |
| American | 149 | 10.9% |
| Austrian | 4 | 0.3% |
| British | 1 | 0.1% |
| Cherokee | 1 | 0.1% |
| Dutch | 38 | 2.8% |
| English | 124 | 9.1% |
| European | 12 | 0.9% |
| Finnish | 7 | 0.5% |
| German | 633 | 46.4% |
| Irish | 137 | 10.1% |
| Italian | 12 | 0.9% |
| Mexican | 4 | 0.3% |
| Norwegian | 43 | 3.2% |
| Polish | 15 | 1.1% |
| Scandinavian | 18 | 1.3% |
| Scotch-Irish | 19 | 1.4% |
| Scottish | 45 | 3.3% |
| Welsh | 3 | 0.2% | View All 18 Rows |
Immigrants in Cole Camp
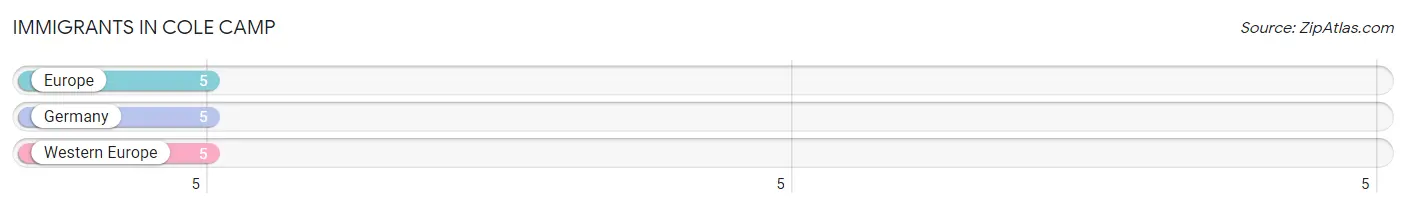
The most numerous immigrant groups reported in Cole Camp came from Europe (5 | 0.4%), Germany (5 | 0.4%), and Western Europe (5 | 0.4%), together accounting for 1.1% of all Cole Camp residents.
| Immigration Origin | # Population | % Population |
| Europe | 5 | 0.4% |
| Germany | 5 | 0.4% |
| Western Europe | 5 | 0.4% | View All 3 Rows |
Sex and Age in Cole Camp
Sex and Age in Cole Camp
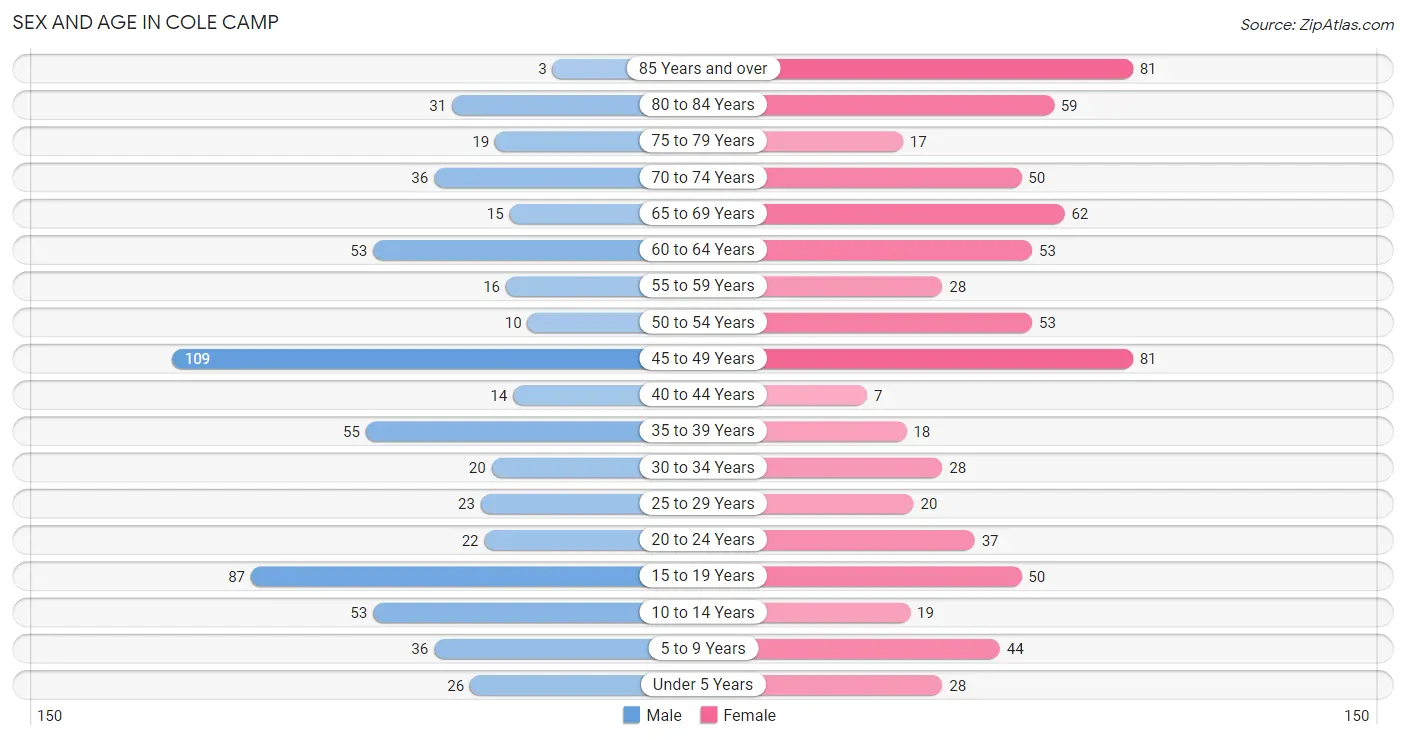
The most populous age groups in Cole Camp are 45 to 49 Years (109 | 17.4%) for men and 45 to 49 Years (81 | 11.0%) for women.
| Age Bracket | Male | Female |
| Under 5 Years | 26 (4.1%) | 28 (3.8%) |
| 5 to 9 Years | 36 (5.7%) | 44 (6.0%) |
| 10 to 14 Years | 53 (8.4%) | 19 (2.6%) |
| 15 to 19 Years | 87 (13.9%) | 50 (6.8%) |
| 20 to 24 Years | 22 (3.5%) | 37 (5.0%) |
| 25 to 29 Years | 23 (3.7%) | 20 (2.7%) |
| 30 to 34 Years | 20 (3.2%) | 28 (3.8%) |
| 35 to 39 Years | 55 (8.8%) | 18 (2.5%) |
| 40 to 44 Years | 14 (2.2%) | 7 (0.9%) |
| 45 to 49 Years | 109 (17.4%) | 81 (11.0%) |
| 50 to 54 Years | 10 (1.6%) | 53 (7.2%) |
| 55 to 59 Years | 16 (2.5%) | 28 (3.8%) |
| 60 to 64 Years | 53 (8.4%) | 53 (7.2%) |
| 65 to 69 Years | 15 (2.4%) | 62 (8.4%) |
| 70 to 74 Years | 36 (5.7%) | 50 (6.8%) |
| 75 to 79 Years | 19 (3.0%) | 17 (2.3%) |
| 80 to 84 Years | 31 (4.9%) | 59 (8.0%) |
| 85 Years and over | 3 (0.5%) | 81 (11.0%) |
| Total | 628 (100.0%) | 735 (100.0%) |
Families and Households in Cole Camp
Median Family Size in Cole Camp
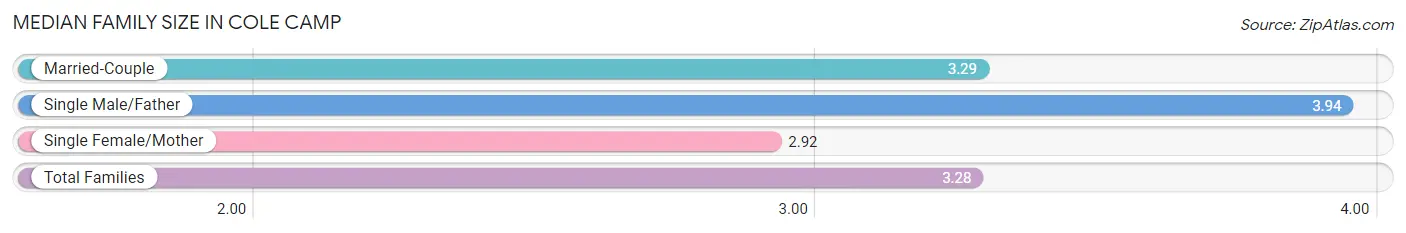
The median family size in Cole Camp is 3.28 persons per family, with single male/father families (16 | 5.1%) accounting for the largest median family size of 3.94 persons per family. On the other hand, single female/mother families (36 | 11.5%) represent the smallest median family size with 2.92 persons per family.
| Family Type | # Families | Family Size |
| Married-Couple | 262 (83.4%) | 3.29 |
| Single Male/Father | 16 (5.1%) | 3.94 |
| Single Female/Mother | 36 (11.5%) | 2.92 |
| Total Families | 314 (100.0%) | 3.28 |
Median Household Size in Cole Camp
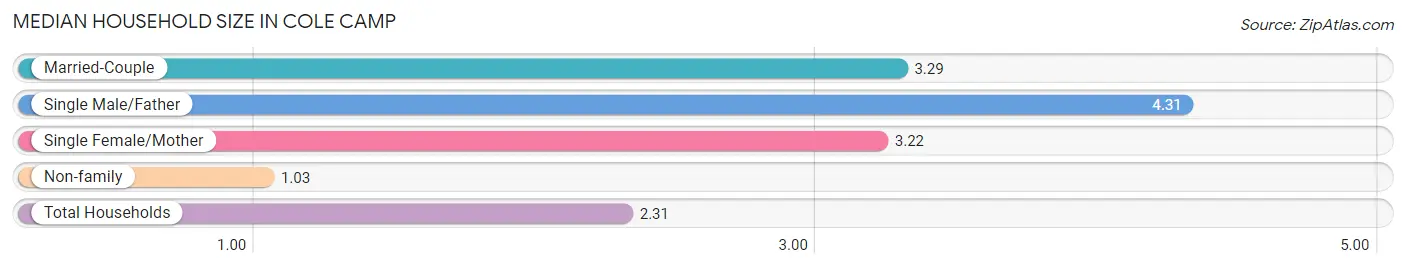
The median household size in Cole Camp is 2.31 persons per household, with single male/father households (16 | 2.8%) accounting for the largest median household size of 4.31 persons per household. non-family households (250 | 44.3%) represent the smallest median household size with 1.03 persons per household.
| Household Type | # Households | Household Size |
| Married-Couple | 262 (46.5%) | 3.29 |
| Single Male/Father | 16 (2.8%) | 4.31 |
| Single Female/Mother | 36 (6.4%) | 3.22 |
| Non-family | 250 (44.3%) | 1.03 |
| Total Households | 564 (100.0%) | 2.31 |
Household Size by Marriage Status in Cole Camp
Out of a total of 564 households in Cole Camp, 314 (55.7%) are family households, while 250 (44.3%) are nonfamily households. The most numerous type of family households are 2-person households, comprising 117, and the most common type of nonfamily households are 1-person households, comprising 243.
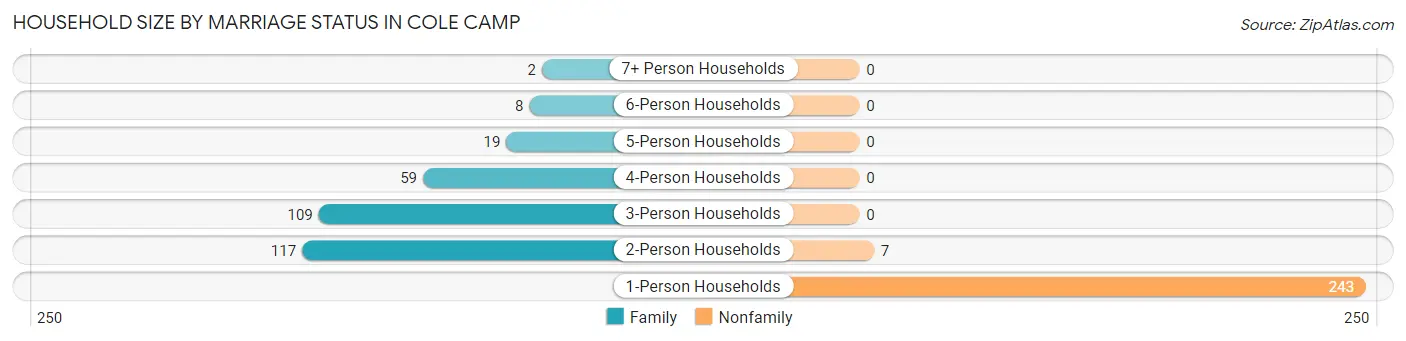
| Household Size | Family Households | Nonfamily Households |
| 1-Person Households | - | 243 (43.1%) |
| 2-Person Households | 117 (20.7%) | 7 (1.2%) |
| 3-Person Households | 109 (19.3%) | 0 (0.0%) |
| 4-Person Households | 59 (10.5%) | 0 (0.0%) |
| 5-Person Households | 19 (3.4%) | 0 (0.0%) |
| 6-Person Households | 8 (1.4%) | 0 (0.0%) |
| 7+ Person Households | 2 (0.4%) | 0 (0.0%) |
| Total | 314 (55.7%) | 250 (44.3%) |
Female Fertility in Cole Camp
Fertility by Age in Cole Camp
Average fertility rate in Cole Camp is 51.0 births per 1,000 women. Women in the age bracket of 20 to 34 years have the highest fertility rate with 106.0 births per 1,000 women. Women in the age bracket of 20 to 34 years acount for 69.2% of all women with births.
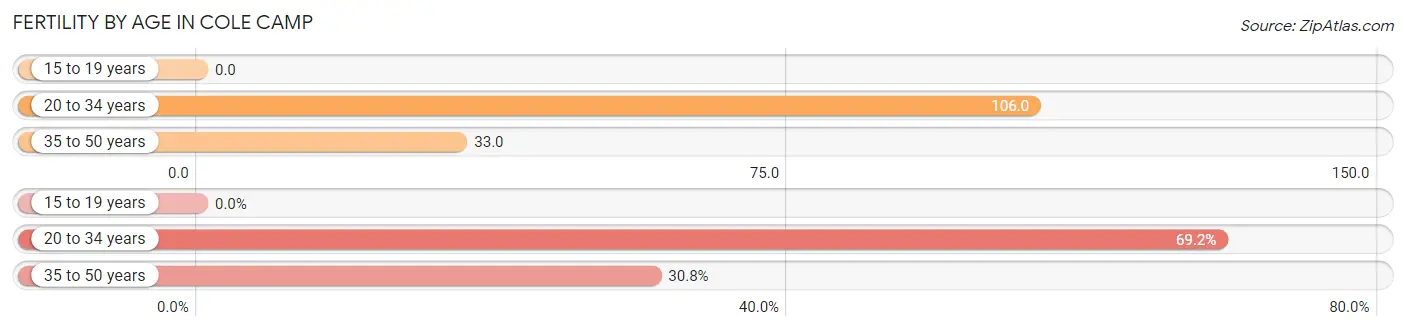
| Age Bracket | Women with Births | Births / 1,000 Women |
| 15 to 19 years | 0 (0.0%) | 0.0 |
| 20 to 34 years | 9 (69.2%) | 106.0 |
| 35 to 50 years | 4 (30.8%) | 33.0 |
| Total | 13 (100.0%) | 51.0 |
Fertility by Age by Marriage Status in Cole Camp
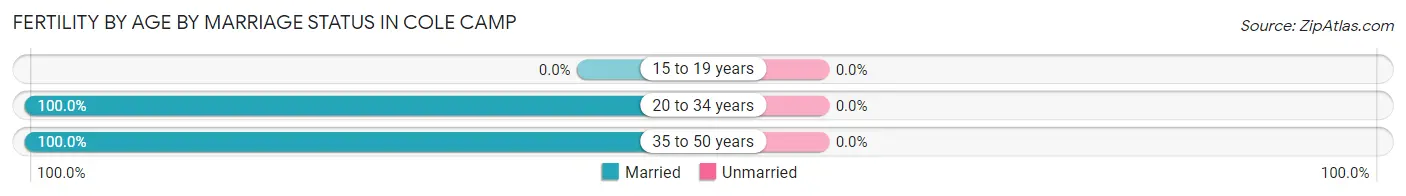
| Age Bracket | Married | Unmarried |
| 15 to 19 years | 0 (0.0%) | 0 (0.0%) |
| 20 to 34 years | 9 (100.0%) | 0 (0.0%) |
| 35 to 50 years | 4 (100.0%) | 0 (0.0%) |
| Total | 13 (100.0%) | 0 (0.0%) |
Fertility by Education in Cole Camp
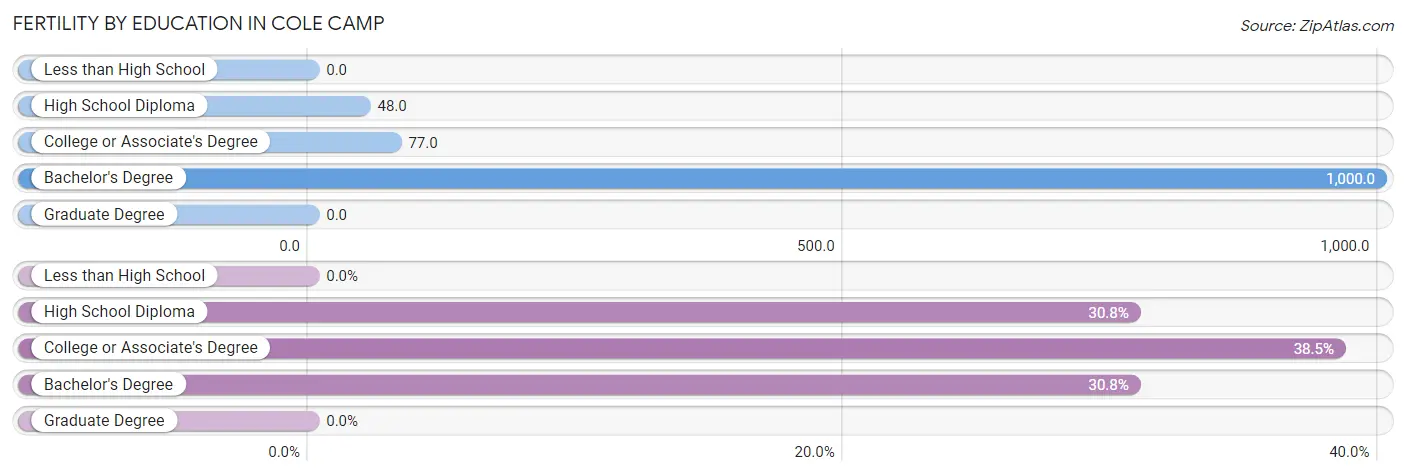
| Educational Attainment | Women with Births | Births / 1,000 Women |
| Less than High School | 0 (0.0%) | 0.0 |
| High School Diploma | 4 (30.8%) | 48.0 |
| College or Associate's Degree | 5 (38.5%) | 77.0 |
| Bachelor's Degree | 4 (30.8%) | 1,000.0 |
| Graduate Degree | 0 (0.0%) | 0.0 |
| Total | 13 (100.0%) | 51.0 |
Fertility by Education by Marriage Status in Cole Camp
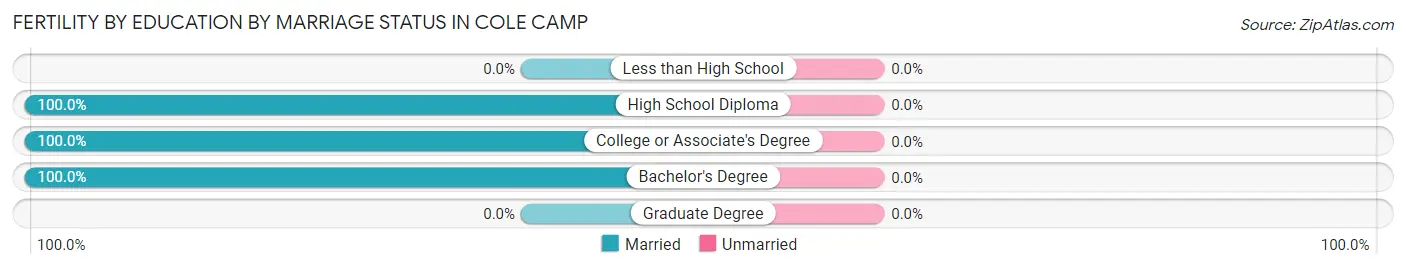
| Educational Attainment | Married | Unmarried |
| Less than High School | 0 (0.0%) | 0 (0.0%) |
| High School Diploma | 4 (100.0%) | 0 (0.0%) |
| College or Associate's Degree | 5 (100.0%) | 0 (0.0%) |
| Bachelor's Degree | 4 (100.0%) | 0 (0.0%) |
| Graduate Degree | 0 (0.0%) | 0 (0.0%) |
| Total | 13 (100.0%) | 0 (0.0%) |
Employment Characteristics in Cole Camp
Employment by Class of Employer in Cole Camp
Among the 533 employed individuals in Cole Camp, private company employees (255 | 47.8%), local government employees (122 | 22.9%), and state government employees (82 | 15.4%) make up the most common classes of employment.
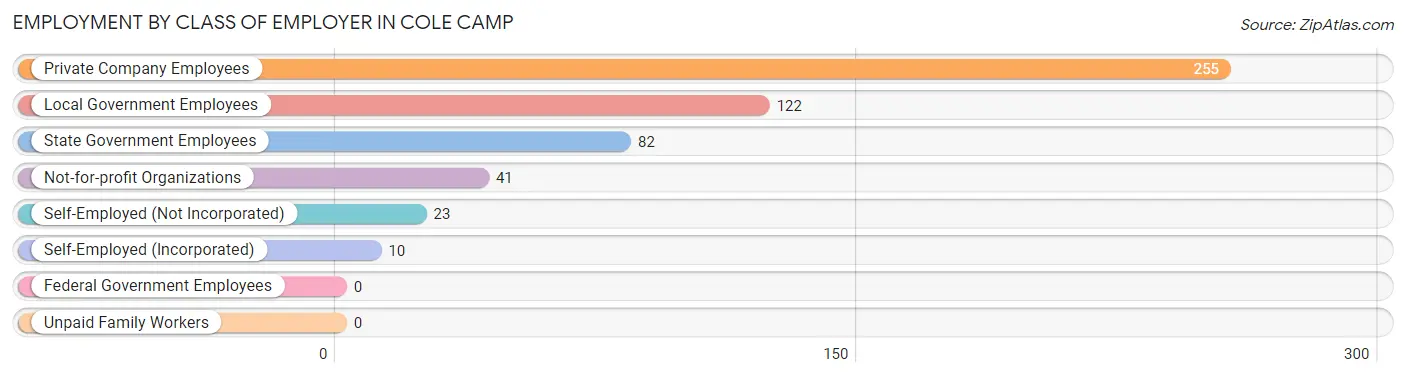
| Employer Class | # Employees | % Employees |
| Private Company Employees | 255 | 47.8% |
| Self-Employed (Incorporated) | 10 | 1.9% |
| Self-Employed (Not Incorporated) | 23 | 4.3% |
| Not-for-profit Organizations | 41 | 7.7% |
| Local Government Employees | 122 | 22.9% |
| State Government Employees | 82 | 15.4% |
| Federal Government Employees | 0 | 0.0% |
| Unpaid Family Workers | 0 | 0.0% |
| Total | 533 | 100.0% |
Employment Status by Age in Cole Camp
According to the labor force statistics for Cole Camp, out of the total population over 16 years of age (1,143), 48.0% or 549 individuals are in the labor force, with 0.5% or 3 of them unemployed. The age group with the highest labor force participation rate is 25 to 29 years, with 90.7% or 39 individuals in the labor force. Within the labor force, the 45 to 54 years age range has the highest percentage of unemployed individuals, with 1.4% or 3 of them being unemployed.
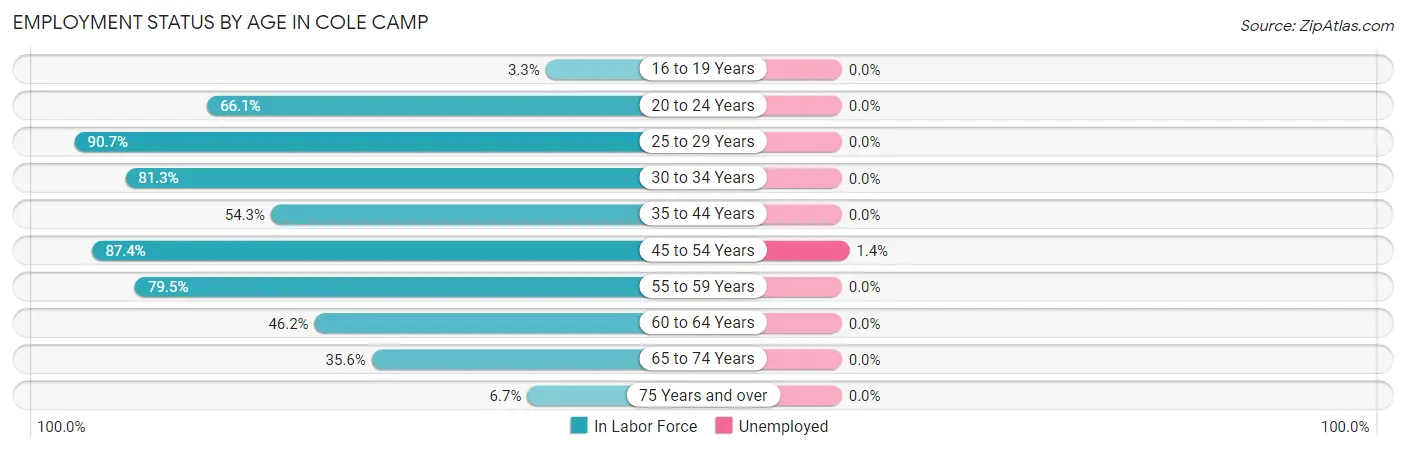
| Age Bracket | In Labor Force | Unemployed |
| 16 to 19 Years | 4 (3.3%) | 0 (0.0%) |
| 20 to 24 Years | 39 (66.1%) | 0 (0.0%) |
| 25 to 29 Years | 39 (90.7%) | 0 (0.0%) |
| 30 to 34 Years | 39 (81.3%) | 0 (0.0%) |
| 35 to 44 Years | 51 (54.3%) | 0 (0.0%) |
| 45 to 54 Years | 221 (87.4%) | 3 (1.4%) |
| 55 to 59 Years | 35 (79.5%) | 0 (0.0%) |
| 60 to 64 Years | 49 (46.2%) | 0 (0.0%) |
| 65 to 74 Years | 58 (35.6%) | 0 (0.0%) |
| 75 Years and over | 14 (6.7%) | 0 (0.0%) |
| Total | 549 (48.0%) | 3 (0.5%) |
Employment Status by Educational Attainment in Cole Camp
According to labor force statistics for Cole Camp, 73.8% of individuals (434) out of the total population between 25 and 64 years of age (588) are in the labor force, with 0.7% or 3 of them being unemployed. The group with the highest labor force participation rate are those with the educational attainment of bachelor's degree or higher, with 96.6% or 114 individuals in the labor force. Within the labor force, individuals with high school diploma education have the highest percentage of unemployment, with 2.0% or 3 of them being unemployed.
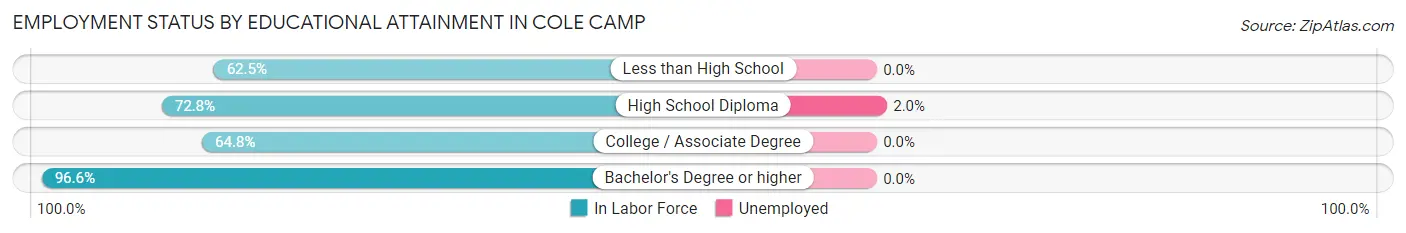
| Educational Attainment | In Labor Force | Unemployed |
| Less than High School | 15 (62.5%) | 0 (0.0%) |
| High School Diploma | 147 (72.8%) | 4 (2.0%) |
| College / Associate Degree | 158 (64.8%) | 0 (0.0%) |
| Bachelor's Degree or higher | 114 (96.6%) | 0 (0.0%) |
| Total | 434 (73.8%) | 4 (0.7%) |
Employment Occupations by Sex in Cole Camp
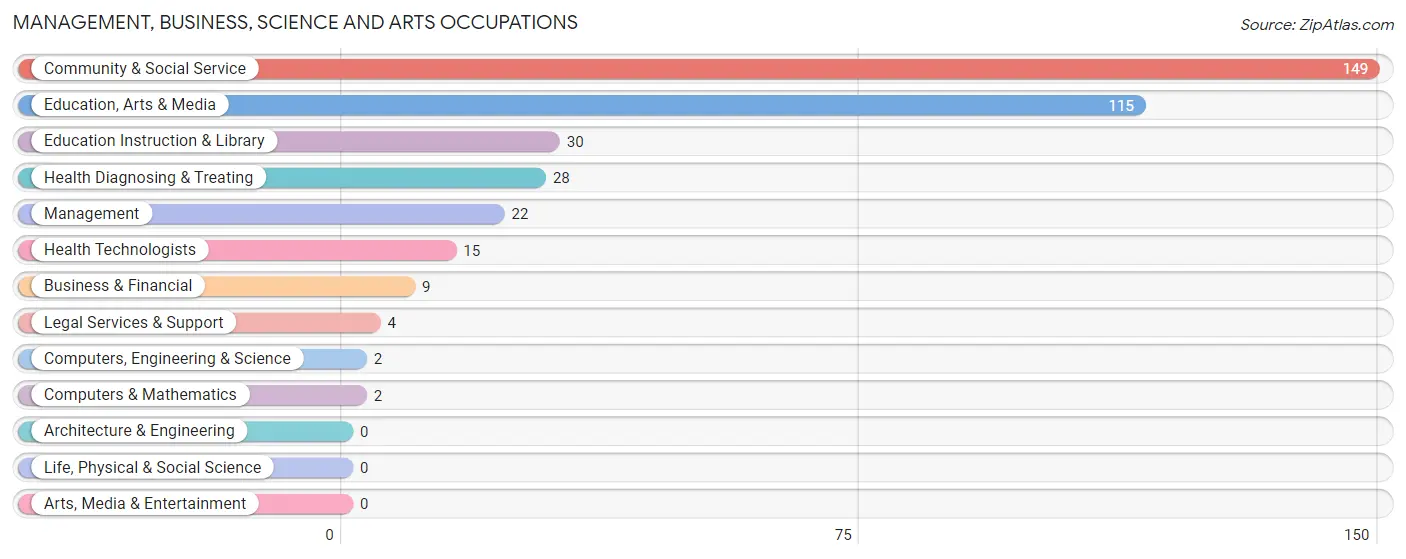
Management, Business, Science and Arts Occupations
The most common Management, Business, Science and Arts occupations in Cole Camp are Community & Social Service (149 | 27.3%), Education, Arts & Media (115 | 21.1%), Education Instruction & Library (30 | 5.5%), Health Diagnosing & Treating (28 | 5.1%), and Management (22 | 4.0%).
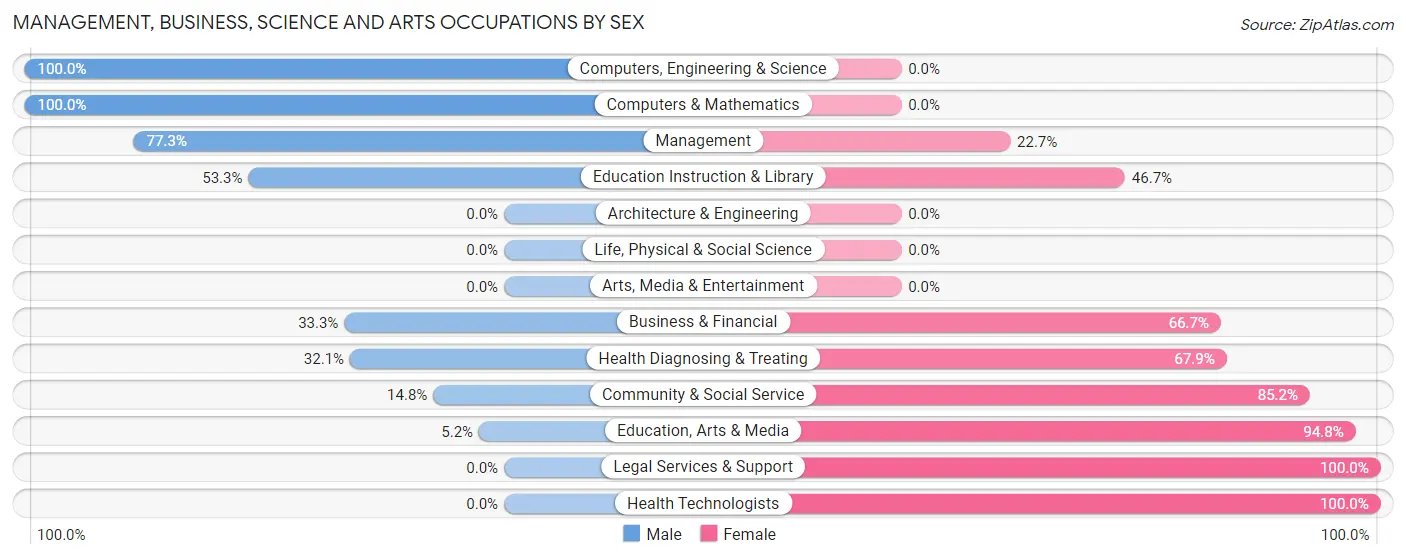
Management, Business, Science and Arts Occupations by Sex
Within the Management, Business, Science and Arts occupations in Cole Camp, the most male-oriented occupations are Computers, Engineering & Science (100.0%), Computers & Mathematics (100.0%), and Management (77.3%), while the most female-oriented occupations are Legal Services & Support (100.0%), Health Technologists (100.0%), and Education, Arts & Media (94.8%).
| Occupation | Male | Female |
| Management | 17 (77.3%) | 5 (22.7%) |
| Business & Financial | 3 (33.3%) | 6 (66.7%) |
| Computers, Engineering & Science | 2 (100.0%) | 0 (0.0%) |
| Computers & Mathematics | 2 (100.0%) | 0 (0.0%) |
| Architecture & Engineering | 0 (0.0%) | 0 (0.0%) |
| Life, Physical & Social Science | 0 (0.0%) | 0 (0.0%) |
| Community & Social Service | 22 (14.8%) | 127 (85.2%) |
| Education, Arts & Media | 6 (5.2%) | 109 (94.8%) |
| Legal Services & Support | 0 (0.0%) | 4 (100.0%) |
| Education Instruction & Library | 16 (53.3%) | 14 (46.7%) |
| Arts, Media & Entertainment | 0 (0.0%) | 0 (0.0%) |
| Health Diagnosing & Treating | 9 (32.1%) | 19 (67.9%) |
| Health Technologists | 0 (0.0%) | 15 (100.0%) |
| Total (Category) | 53 (25.2%) | 157 (74.8%) |
| Total (Overall) | 257 (47.1%) | 289 (52.9%) |
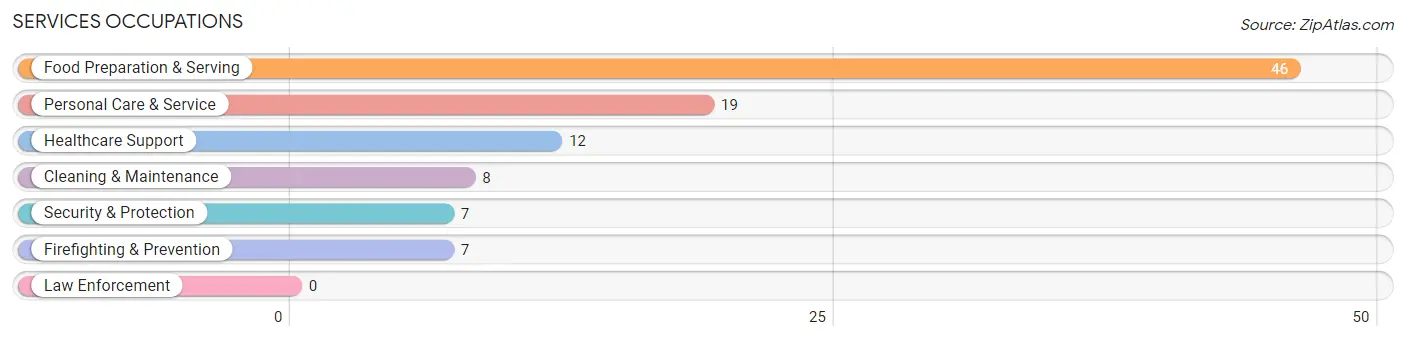
Services Occupations
The most common Services occupations in Cole Camp are Food Preparation & Serving (46 | 8.4%), Personal Care & Service (19 | 3.5%), Healthcare Support (12 | 2.2%), Cleaning & Maintenance (8 | 1.5%), and Security & Protection (7 | 1.3%).
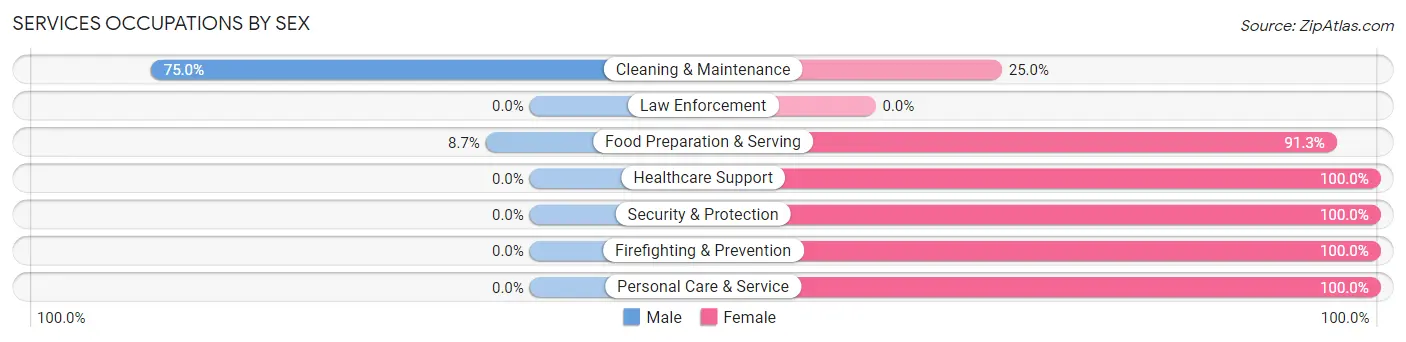
Services Occupations by Sex
Within the Services occupations in Cole Camp, the most male-oriented occupations are Cleaning & Maintenance (75.0%), and Food Preparation & Serving (8.7%), while the most female-oriented occupations are Healthcare Support (100.0%), Security & Protection (100.0%), and Firefighting & Prevention (100.0%).
| Occupation | Male | Female |
| Healthcare Support | 0 (0.0%) | 12 (100.0%) |
| Security & Protection | 0 (0.0%) | 7 (100.0%) |
| Firefighting & Prevention | 0 (0.0%) | 7 (100.0%) |
| Law Enforcement | 0 (0.0%) | 0 (0.0%) |
| Food Preparation & Serving | 4 (8.7%) | 42 (91.3%) |
| Cleaning & Maintenance | 6 (75.0%) | 2 (25.0%) |
| Personal Care & Service | 0 (0.0%) | 19 (100.0%) |
| Total (Category) | 10 (10.9%) | 82 (89.1%) |
| Total (Overall) | 257 (47.1%) | 289 (52.9%) |
Sales and Office Occupations
The most common Sales and Office occupations in Cole Camp are Office & Administration (32 | 5.9%), and Sales & Related (19 | 3.5%).
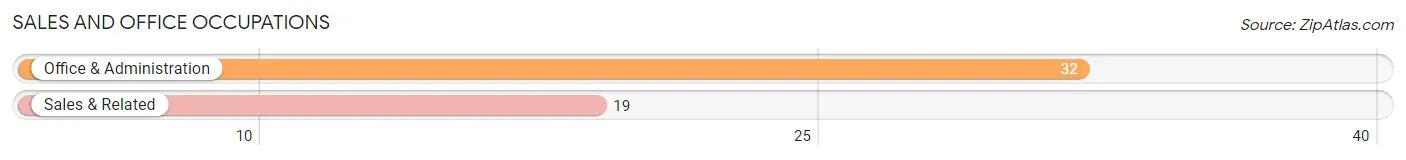
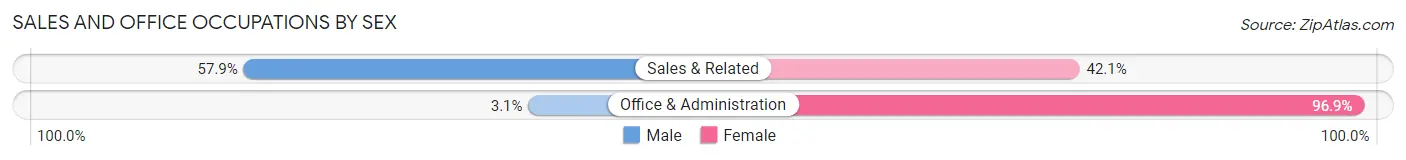
Sales and Office Occupations by Sex
| Occupation | Male | Female |
| Sales & Related | 11 (57.9%) | 8 (42.1%) |
| Office & Administration | 1 (3.1%) | 31 (96.9%) |
| Total (Category) | 12 (23.5%) | 39 (76.5%) |
| Total (Overall) | 257 (47.1%) | 289 (52.9%) |
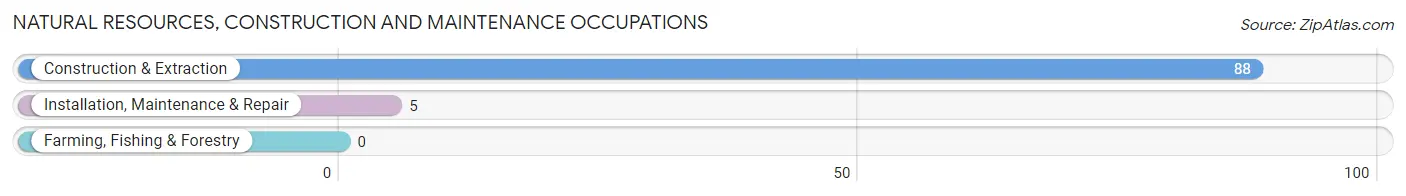
Natural Resources, Construction and Maintenance Occupations
The most common Natural Resources, Construction and Maintenance occupations in Cole Camp are Construction & Extraction (88 | 16.1%), and Installation, Maintenance & Repair (5 | 0.9%).
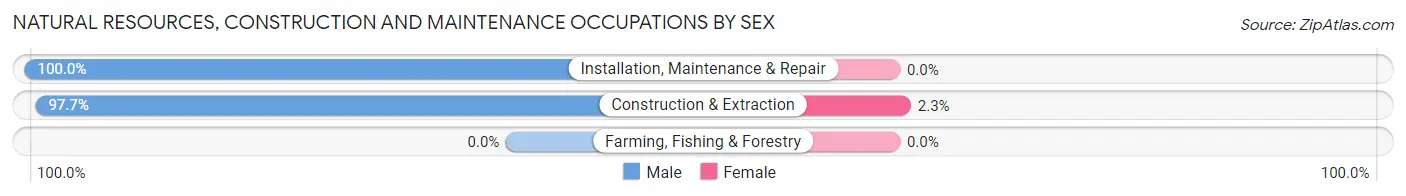
Natural Resources, Construction and Maintenance Occupations by Sex
| Occupation | Male | Female |
| Farming, Fishing & Forestry | 0 (0.0%) | 0 (0.0%) |
| Construction & Extraction | 86 (97.7%) | 2 (2.3%) |
| Installation, Maintenance & Repair | 5 (100.0%) | 0 (0.0%) |
| Total (Category) | 91 (97.9%) | 2 (2.1%) |
| Total (Overall) | 257 (47.1%) | 289 (52.9%) |
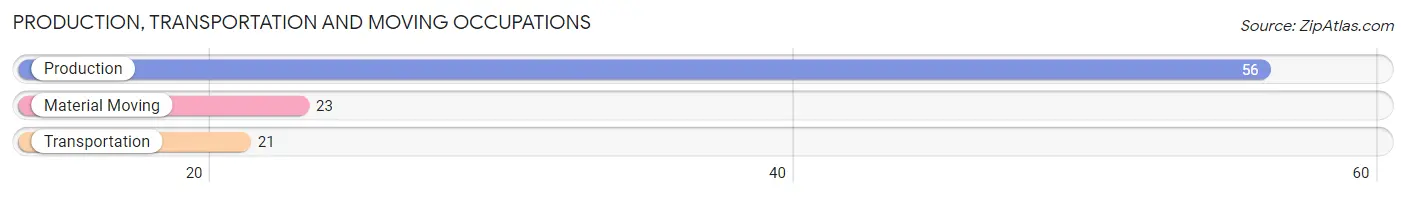
Production, Transportation and Moving Occupations
The most common Production, Transportation and Moving occupations in Cole Camp are Production (56 | 10.3%), Material Moving (23 | 4.2%), and Transportation (21 | 3.8%).
Production, Transportation and Moving Occupations by Sex
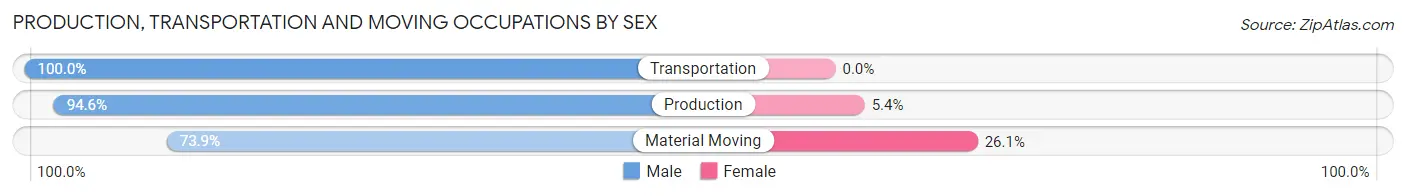
| Occupation | Male | Female |
| Production | 53 (94.6%) | 3 (5.4%) |
| Transportation | 21 (100.0%) | 0 (0.0%) |
| Material Moving | 17 (73.9%) | 6 (26.1%) |
| Total (Category) | 91 (91.0%) | 9 (9.0%) |
| Total (Overall) | 257 (47.1%) | 289 (52.9%) |
Employment Industries by Sex in Cole Camp
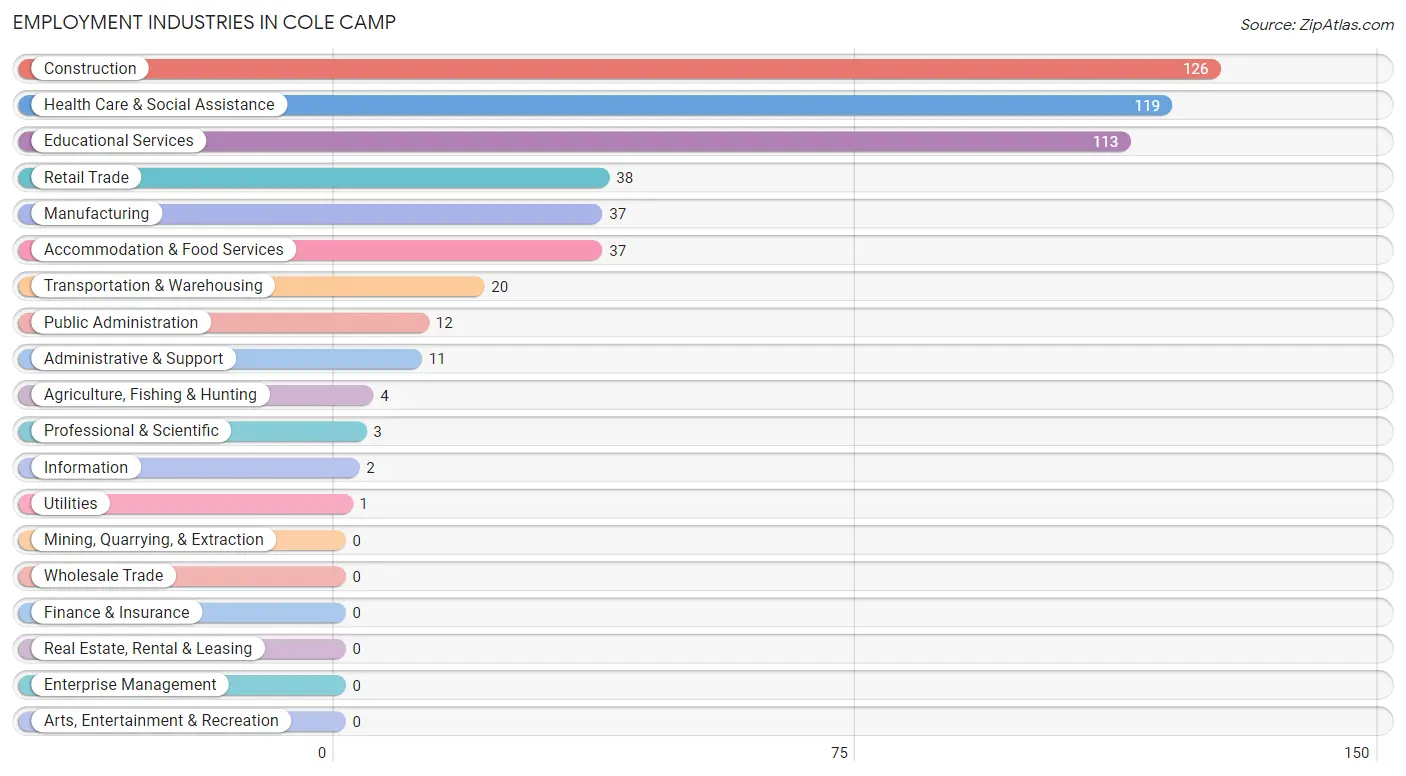
Employment Industries in Cole Camp
The major employment industries in Cole Camp include Construction (126 | 23.1%), Health Care & Social Assistance (119 | 21.8%), Educational Services (113 | 20.7%), Retail Trade (38 | 7.0%), and Manufacturing (37 | 6.8%).
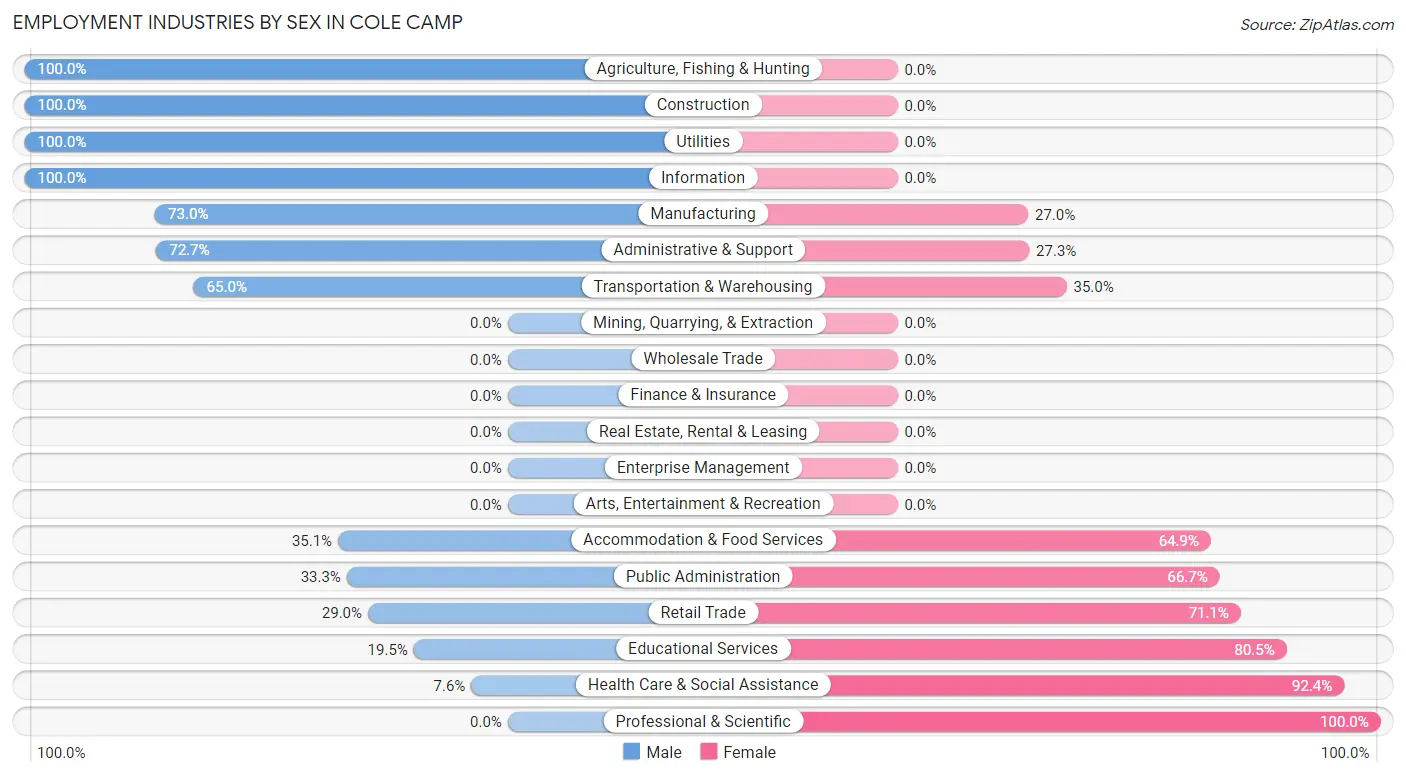
Employment Industries by Sex in Cole Camp
The Cole Camp industries that see more men than women are Agriculture, Fishing & Hunting (100.0%), Construction (100.0%), and Utilities (100.0%), whereas the industries that tend to have a higher number of women are Professional & Scientific (100.0%), Health Care & Social Assistance (92.4%), and Educational Services (80.5%).
| Industry | Male | Female |
| Agriculture, Fishing & Hunting | 4 (100.0%) | 0 (0.0%) |
| Mining, Quarrying, & Extraction | 0 (0.0%) | 0 (0.0%) |
| Construction | 126 (100.0%) | 0 (0.0%) |
| Manufacturing | 27 (73.0%) | 10 (27.0%) |
| Wholesale Trade | 0 (0.0%) | 0 (0.0%) |
| Retail Trade | 11 (28.9%) | 27 (71.1%) |
| Transportation & Warehousing | 13 (65.0%) | 7 (35.0%) |
| Utilities | 1 (100.0%) | 0 (0.0%) |
| Information | 2 (100.0%) | 0 (0.0%) |
| Finance & Insurance | 0 (0.0%) | 0 (0.0%) |
| Real Estate, Rental & Leasing | 0 (0.0%) | 0 (0.0%) |
| Professional & Scientific | 0 (0.0%) | 3 (100.0%) |
| Enterprise Management | 0 (0.0%) | 0 (0.0%) |
| Administrative & Support | 8 (72.7%) | 3 (27.3%) |
| Educational Services | 22 (19.5%) | 91 (80.5%) |
| Health Care & Social Assistance | 9 (7.6%) | 110 (92.4%) |
| Arts, Entertainment & Recreation | 0 (0.0%) | 0 (0.0%) |
| Accommodation & Food Services | 13 (35.1%) | 24 (64.9%) |
| Public Administration | 4 (33.3%) | 8 (66.7%) |
| Total | 257 (47.1%) | 289 (52.9%) |
Education in Cole Camp
School Enrollment in Cole Camp
The most common levels of schooling among the 293 students in Cole Camp are college / undergraduate (77 | 26.3%), elementary school (72 | 24.6%), and high school (63 | 21.5%).
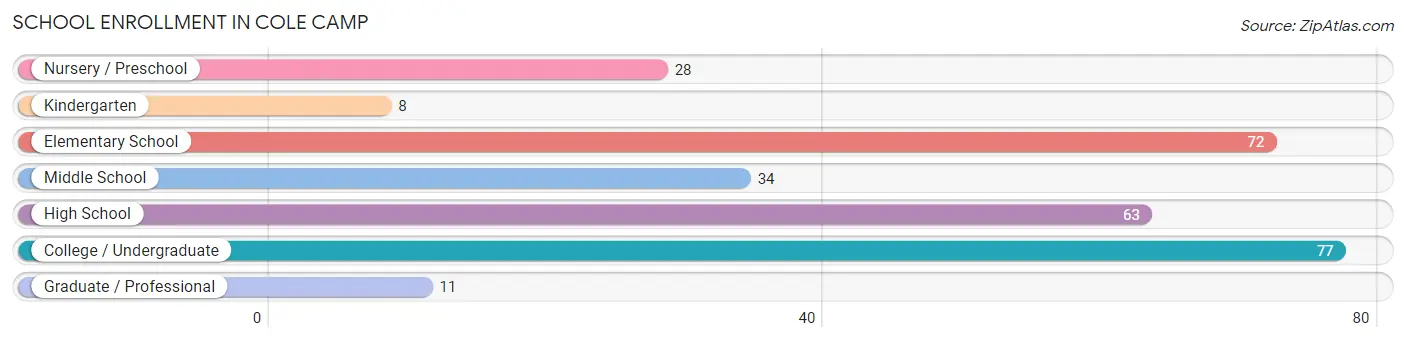
| School Level | # Students | % Students |
| Nursery / Preschool | 28 | 9.6% |
| Kindergarten | 8 | 2.7% |
| Elementary School | 72 | 24.6% |
| Middle School | 34 | 11.6% |
| High School | 63 | 21.5% |
| College / Undergraduate | 77 | 26.3% |
| Graduate / Professional | 11 | 3.7% |
| Total | 293 | 100.0% |
School Enrollment by Age by Funding Source in Cole Camp
Out of a total of 293 students who are enrolled in schools in Cole Camp, 44 (15.0%) attend a private institution, while the remaining 249 (85.0%) are enrolled in public schools. The age group of 10 to 14 year olds has the highest likelihood of being enrolled in private schools, with 22 (31.9% in the age bracket) enrolled. Conversely, the age group of 15 to 17 year olds has the lowest likelihood of being enrolled in a private school, with 50 (100.0% in the age bracket) attending a public institution.
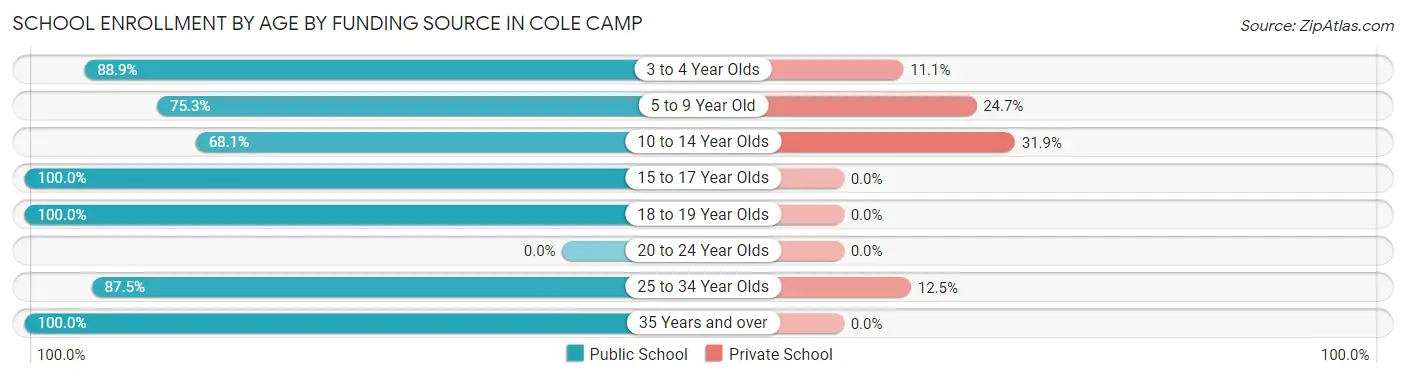
| Age Bracket | Public School | Private School |
| 3 to 4 Year Olds | 8 (88.9%) | 1 (11.1%) |
| 5 to 9 Year Old | 58 (75.3%) | 19 (24.7%) |
| 10 to 14 Year Olds | 47 (68.1%) | 22 (31.9%) |
| 15 to 17 Year Olds | 50 (100.0%) | 0 (0.0%) |
| 18 to 19 Year Olds | 67 (100.0%) | 0 (0.0%) |
| 20 to 24 Year Olds | 0 (0.0%) | 0 (0.0%) |
| 25 to 34 Year Olds | 14 (87.5%) | 2 (12.5%) |
| 35 Years and over | 5 (100.0%) | 0 (0.0%) |
| Total | 249 (85.0%) | 44 (15.0%) |
Educational Attainment by Field of Study in Cole Camp
Education (106 | 62.7%), science & technology (25 | 14.8%), liberal arts & history (11 | 6.5%), business (10 | 5.9%), and arts & humanities (8 | 4.7%) are the most common fields of study among 169 individuals in Cole Camp who have obtained a bachelor's degree or higher.
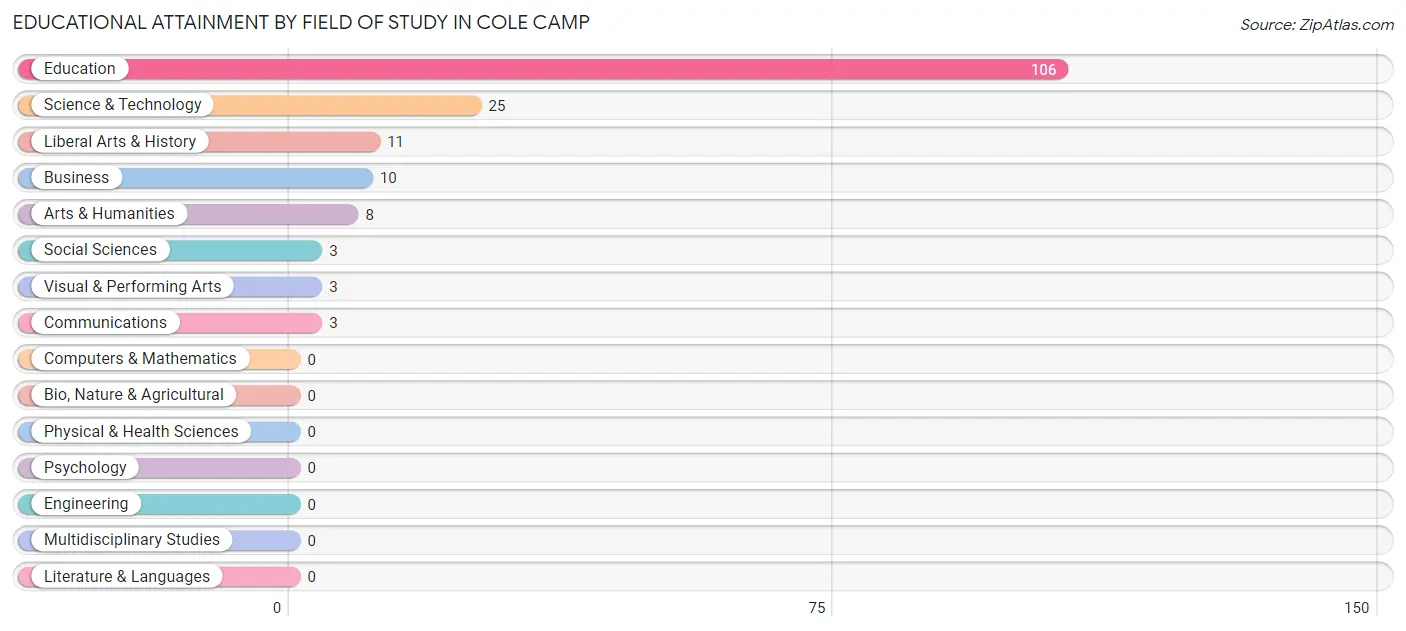
| Field of Study | # Graduates | % Graduates |
| Computers & Mathematics | 0 | 0.0% |
| Bio, Nature & Agricultural | 0 | 0.0% |
| Physical & Health Sciences | 0 | 0.0% |
| Psychology | 0 | 0.0% |
| Social Sciences | 3 | 1.8% |
| Engineering | 0 | 0.0% |
| Multidisciplinary Studies | 0 | 0.0% |
| Science & Technology | 25 | 14.8% |
| Business | 10 | 5.9% |
| Education | 106 | 62.7% |
| Literature & Languages | 0 | 0.0% |
| Liberal Arts & History | 11 | 6.5% |
| Visual & Performing Arts | 3 | 1.8% |
| Communications | 3 | 1.8% |
| Arts & Humanities | 8 | 4.7% |
| Total | 169 | 100.0% |
Transportation & Commute in Cole Camp
Vehicle Availability by Sex in Cole Camp
The most prevalent vehicle ownership categories in Cole Camp are males with 4 vehicles (97, accounting for 39.8%) and females with 4 vehicles (83, making up 33.6%).
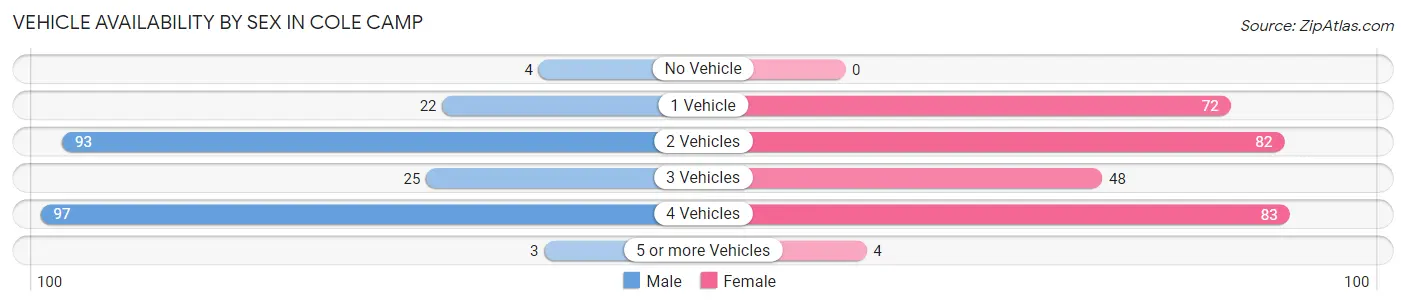
| Vehicles Available | Male | Female |
| No Vehicle | 4 (1.6%) | 0 (0.0%) |
| 1 Vehicle | 22 (9.0%) | 72 (24.9%) |
| 2 Vehicles | 93 (38.1%) | 82 (28.4%) |
| 3 Vehicles | 25 (10.2%) | 48 (16.6%) |
| 4 Vehicles | 97 (39.8%) | 83 (28.7%) |
| 5 or more Vehicles | 3 (1.2%) | 4 (1.4%) |
| Total | 244 (100.0%) | 289 (100.0%) |
Commute Time in Cole Camp
The most frequently occuring commute durations in Cole Camp are 5 to 9 minutes (170 commuters, 32.1%), less than 5 minutes (136 commuters, 25.7%), and 30 to 34 minutes (60 commuters, 11.3%).
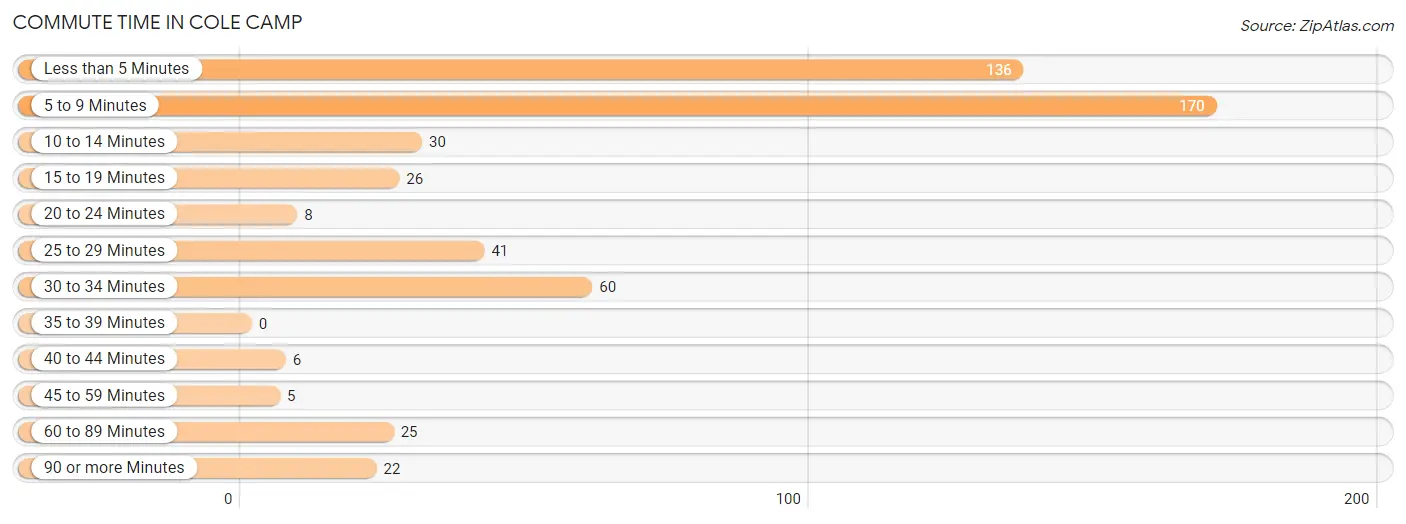
| Commute Time | # Commuters | % Commuters |
| Less than 5 Minutes | 136 | 25.7% |
| 5 to 9 Minutes | 170 | 32.1% |
| 10 to 14 Minutes | 30 | 5.7% |
| 15 to 19 Minutes | 26 | 4.9% |
| 20 to 24 Minutes | 8 | 1.5% |
| 25 to 29 Minutes | 41 | 7.7% |
| 30 to 34 Minutes | 60 | 11.3% |
| 35 to 39 Minutes | 0 | 0.0% |
| 40 to 44 Minutes | 6 | 1.1% |
| 45 to 59 Minutes | 5 | 0.9% |
| 60 to 89 Minutes | 25 | 4.7% |
| 90 or more Minutes | 22 | 4.2% |
Commute Time by Sex in Cole Camp
The most common commute times in Cole Camp are 5 to 9 minutes (97 commuters, 39.8%) for males and less than 5 minutes (104 commuters, 36.5%) for females.
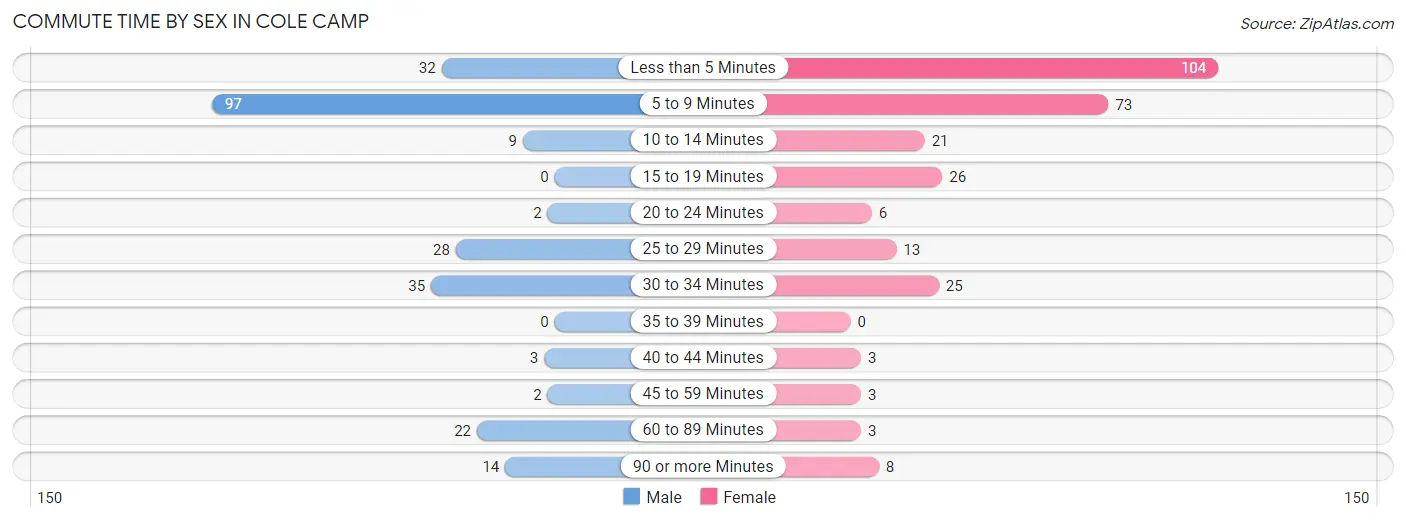
| Commute Time | Male | Female |
| Less than 5 Minutes | 32 (13.1%) | 104 (36.5%) |
| 5 to 9 Minutes | 97 (39.8%) | 73 (25.6%) |
| 10 to 14 Minutes | 9 (3.7%) | 21 (7.4%) |
| 15 to 19 Minutes | 0 (0.0%) | 26 (9.1%) |
| 20 to 24 Minutes | 2 (0.8%) | 6 (2.1%) |
| 25 to 29 Minutes | 28 (11.5%) | 13 (4.6%) |
| 30 to 34 Minutes | 35 (14.3%) | 25 (8.8%) |
| 35 to 39 Minutes | 0 (0.0%) | 0 (0.0%) |
| 40 to 44 Minutes | 3 (1.2%) | 3 (1.1%) |
| 45 to 59 Minutes | 2 (0.8%) | 3 (1.1%) |
| 60 to 89 Minutes | 22 (9.0%) | 3 (1.1%) |
| 90 or more Minutes | 14 (5.7%) | 8 (2.8%) |
Time of Departure to Work by Sex in Cole Camp
The most frequent times of departure to work in Cole Camp are 5:30 AM to 5:59 AM (93, 38.1%) for males and 7:00 AM to 7:29 AM (95, 33.3%) for females.
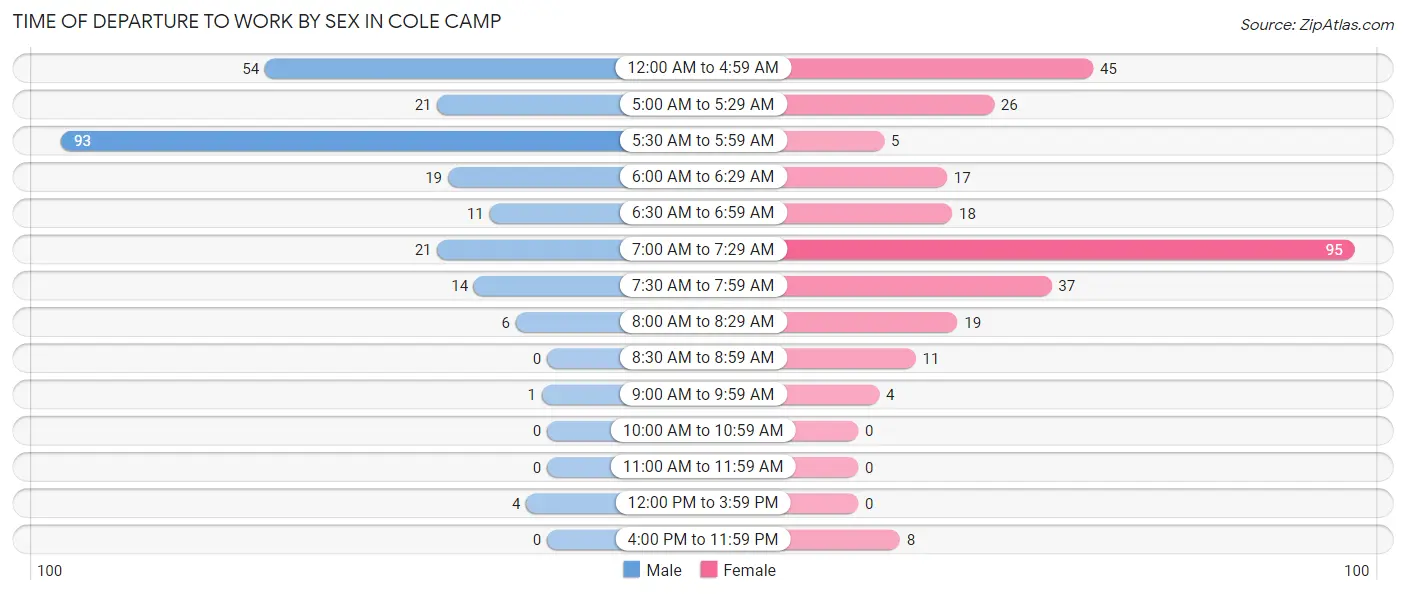
| Time of Departure | Male | Female |
| 12:00 AM to 4:59 AM | 54 (22.1%) | 45 (15.8%) |
| 5:00 AM to 5:29 AM | 21 (8.6%) | 26 (9.1%) |
| 5:30 AM to 5:59 AM | 93 (38.1%) | 5 (1.8%) |
| 6:00 AM to 6:29 AM | 19 (7.8%) | 17 (6.0%) |
| 6:30 AM to 6:59 AM | 11 (4.5%) | 18 (6.3%) |
| 7:00 AM to 7:29 AM | 21 (8.6%) | 95 (33.3%) |
| 7:30 AM to 7:59 AM | 14 (5.7%) | 37 (13.0%) |
| 8:00 AM to 8:29 AM | 6 (2.5%) | 19 (6.7%) |
| 8:30 AM to 8:59 AM | 0 (0.0%) | 11 (3.9%) |
| 9:00 AM to 9:59 AM | 1 (0.4%) | 4 (1.4%) |
| 10:00 AM to 10:59 AM | 0 (0.0%) | 0 (0.0%) |
| 11:00 AM to 11:59 AM | 0 (0.0%) | 0 (0.0%) |
| 12:00 PM to 3:59 PM | 4 (1.6%) | 0 (0.0%) |
| 4:00 PM to 11:59 PM | 0 (0.0%) | 8 (2.8%) |
| Total | 244 (100.0%) | 285 (100.0%) |
Housing Occupancy in Cole Camp
Occupancy by Ownership in Cole Camp
Of the total 564 dwellings in Cole Camp, owner-occupied units account for 344 (61.0%), while renter-occupied units make up 220 (39.0%).
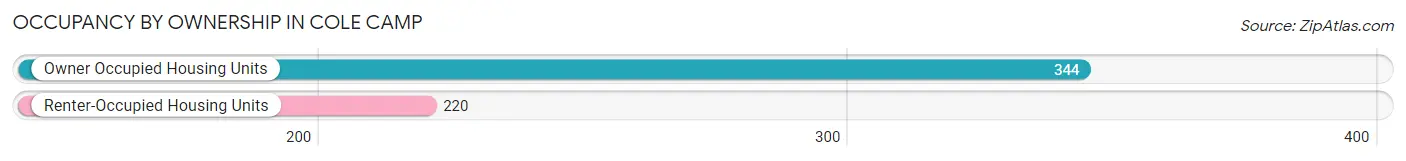
| Occupancy | # Housing Units | % Housing Units |
| Owner Occupied Housing Units | 344 | 61.0% |
| Renter-Occupied Housing Units | 220 | 39.0% |
| Total Occupied Housing Units | 564 | 100.0% |
Occupancy by Household Size in Cole Camp
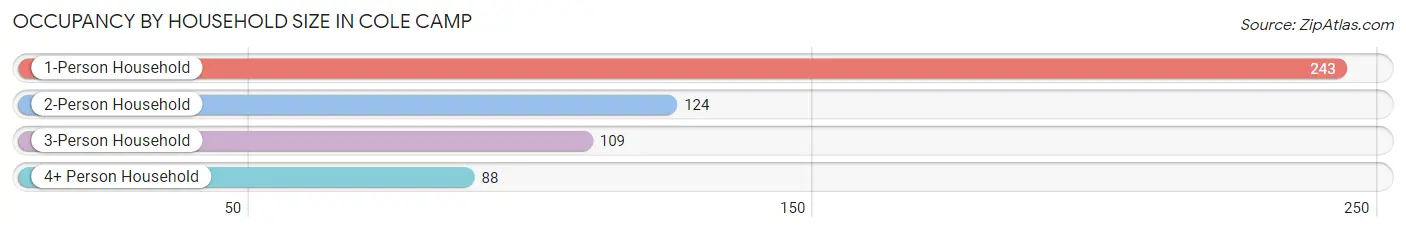
| Household Size | # Housing Units | % Housing Units |
| 1-Person Household | 243 | 43.1% |
| 2-Person Household | 124 | 22.0% |
| 3-Person Household | 109 | 19.3% |
| 4+ Person Household | 88 | 15.6% |
| Total Housing Units | 564 | 100.0% |
Occupancy by Ownership by Household Size in Cole Camp
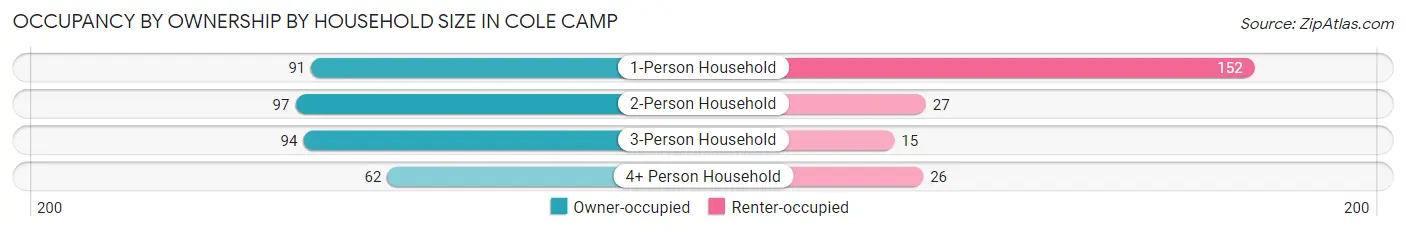
| Household Size | Owner-occupied | Renter-occupied |
| 1-Person Household | 91 (37.4%) | 152 (62.5%) |
| 2-Person Household | 97 (78.2%) | 27 (21.8%) |
| 3-Person Household | 94 (86.2%) | 15 (13.8%) |
| 4+ Person Household | 62 (70.5%) | 26 (29.5%) |
| Total Housing Units | 344 (61.0%) | 220 (39.0%) |
Occupancy by Educational Attainment in Cole Camp
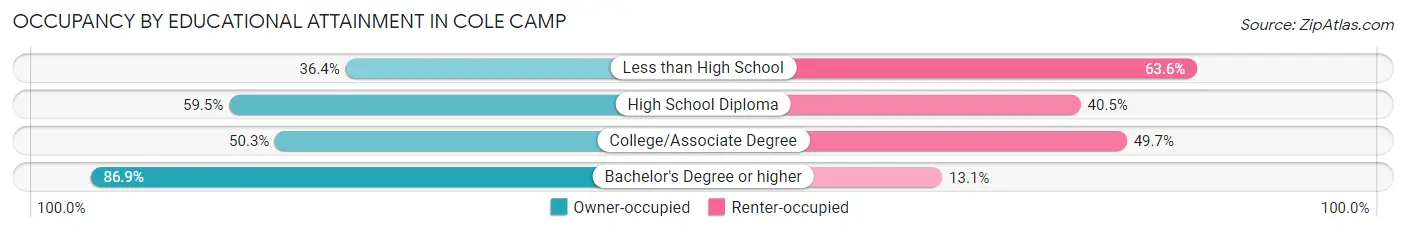
| Household Size | Owner-occupied | Renter-occupied |
| Less than High School | 20 (36.4%) | 35 (63.6%) |
| High School Diploma | 132 (59.5%) | 90 (40.5%) |
| College/Associate Degree | 79 (50.3%) | 78 (49.7%) |
| Bachelor's Degree or higher | 113 (86.9%) | 17 (13.1%) |
Occupancy by Age of Householder in Cole Camp
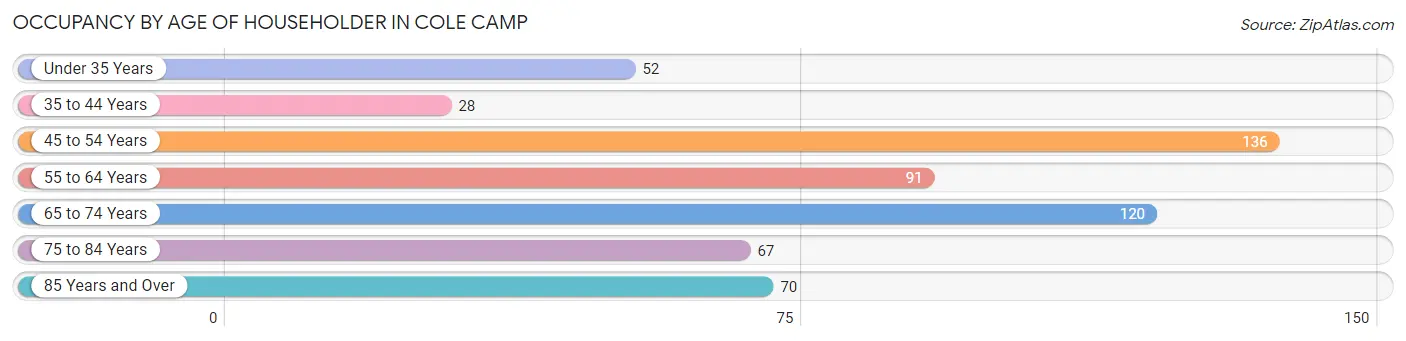
| Age Bracket | # Households | % Households |
| Under 35 Years | 52 | 9.2% |
| 35 to 44 Years | 28 | 5.0% |
| 45 to 54 Years | 136 | 24.1% |
| 55 to 64 Years | 91 | 16.1% |
| 65 to 74 Years | 120 | 21.3% |
| 75 to 84 Years | 67 | 11.9% |
| 85 Years and Over | 70 | 12.4% |
| Total | 564 | 100.0% |
Housing Finances in Cole Camp
Median Income by Occupancy in Cole Camp
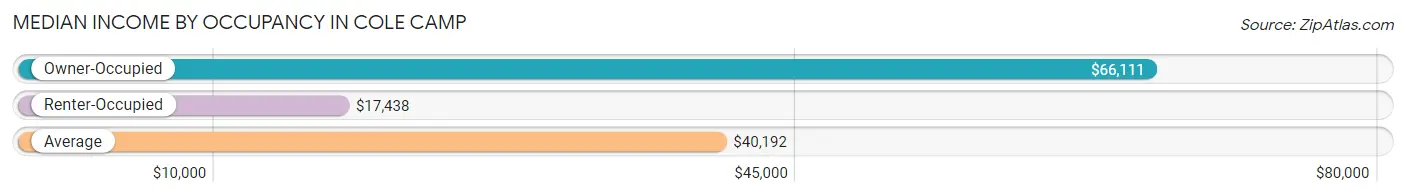
| Occupancy Type | # Households | Median Income |
| Owner-Occupied | 344 (61.0%) | $66,111 |
| Renter-Occupied | 220 (39.0%) | $17,438 |
| Average | 564 (100.0%) | $40,192 |
Occupancy by Householder Income Bracket in Cole Camp
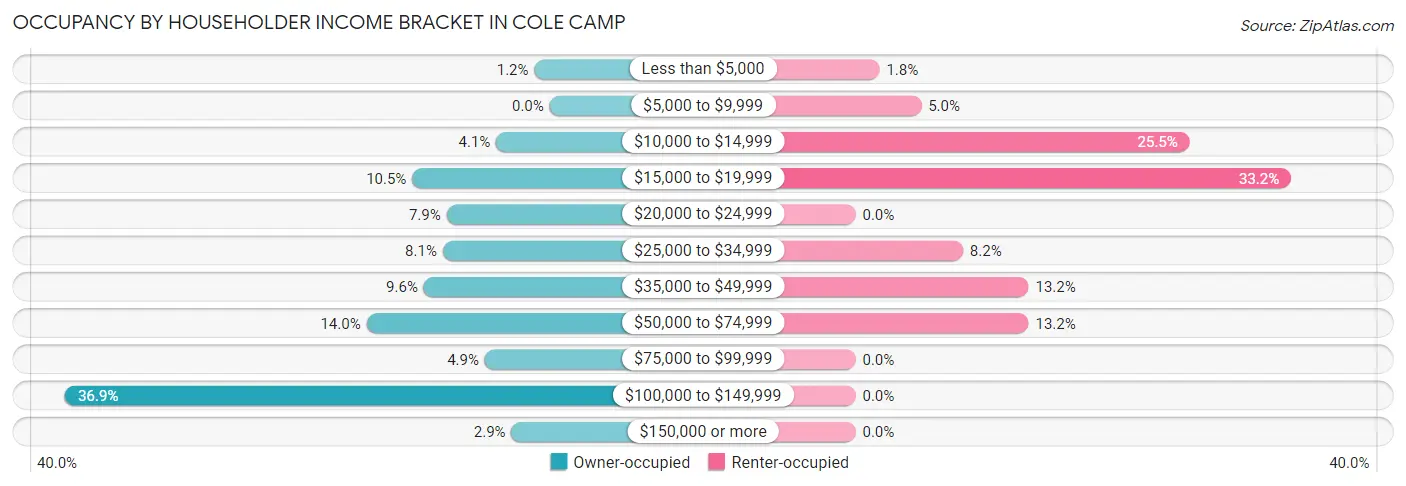
| Income Bracket | Owner-occupied | Renter-occupied |
| Less than $5,000 | 4 (1.2%) | 4 (1.8%) |
| $5,000 to $9,999 | 0 (0.0%) | 11 (5.0%) |
| $10,000 to $14,999 | 14 (4.1%) | 56 (25.5%) |
| $15,000 to $19,999 | 36 (10.5%) | 73 (33.2%) |
| $20,000 to $24,999 | 27 (7.9%) | 0 (0.0%) |
| $25,000 to $34,999 | 28 (8.1%) | 18 (8.2%) |
| $35,000 to $49,999 | 33 (9.6%) | 29 (13.2%) |
| $50,000 to $74,999 | 48 (14.0%) | 29 (13.2%) |
| $75,000 to $99,999 | 17 (4.9%) | 0 (0.0%) |
| $100,000 to $149,999 | 127 (36.9%) | 0 (0.0%) |
| $150,000 or more | 10 (2.9%) | 0 (0.0%) |
| Total | 344 (100.0%) | 220 (100.0%) |
Monthly Housing Cost Tiers in Cole Camp
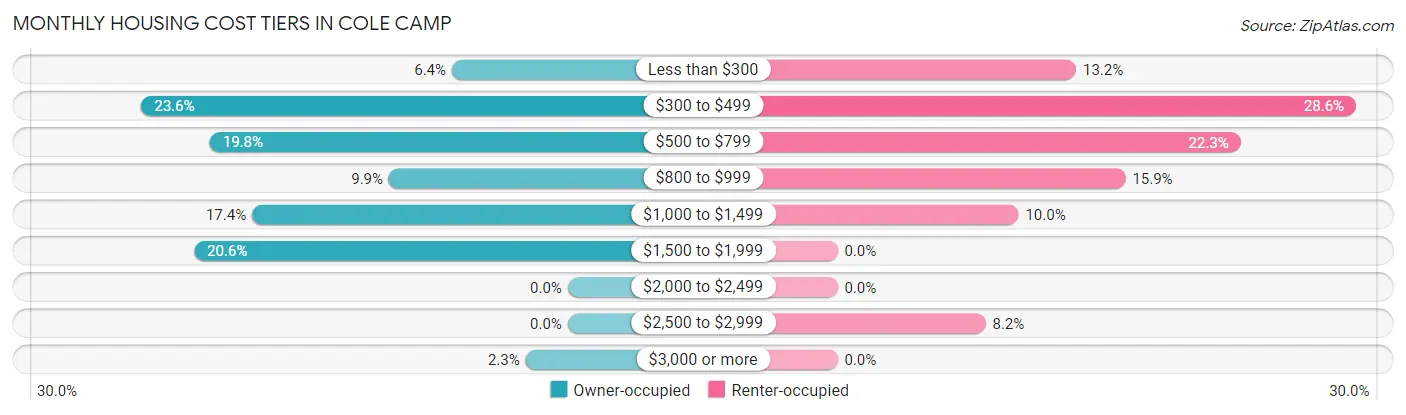
| Monthly Cost | Owner-occupied | Renter-occupied |
| Less than $300 | 22 (6.4%) | 29 (13.2%) |
| $300 to $499 | 81 (23.5%) | 63 (28.6%) |
| $500 to $799 | 68 (19.8%) | 49 (22.3%) |
| $800 to $999 | 34 (9.9%) | 35 (15.9%) |
| $1,000 to $1,499 | 60 (17.4%) | 22 (10.0%) |
| $1,500 to $1,999 | 71 (20.6%) | 0 (0.0%) |
| $2,000 to $2,499 | 0 (0.0%) | 0 (0.0%) |
| $2,500 to $2,999 | 0 (0.0%) | 18 (8.2%) |
| $3,000 or more | 8 (2.3%) | 0 (0.0%) |
| Total | 344 (100.0%) | 220 (100.0%) |
Physical Housing Characteristics in Cole Camp
Housing Structures in Cole Camp
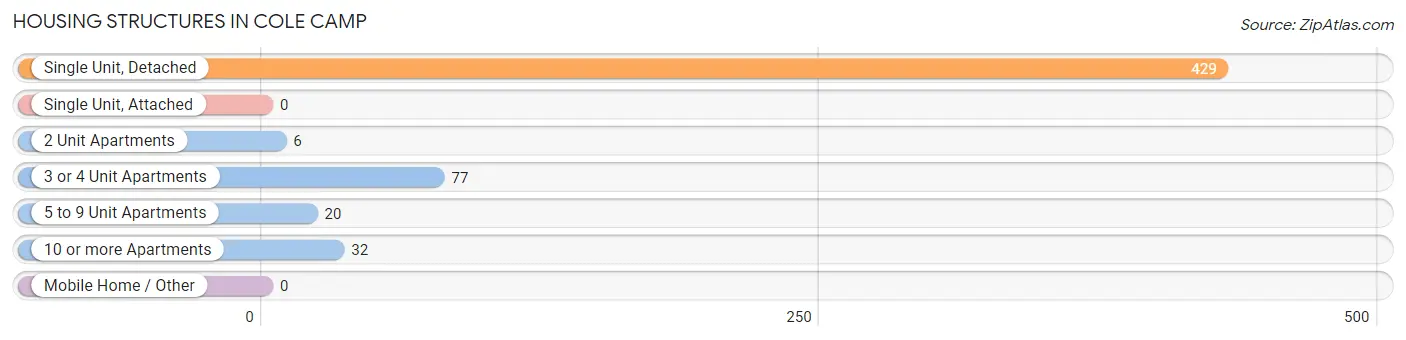
| Structure Type | # Housing Units | % Housing Units |
| Single Unit, Detached | 429 | 76.1% |
| Single Unit, Attached | 0 | 0.0% |
| 2 Unit Apartments | 6 | 1.1% |
| 3 or 4 Unit Apartments | 77 | 13.7% |
| 5 to 9 Unit Apartments | 20 | 3.5% |
| 10 or more Apartments | 32 | 5.7% |
| Mobile Home / Other | 0 | 0.0% |
| Total | 564 | 100.0% |
Housing Structures by Occupancy in Cole Camp
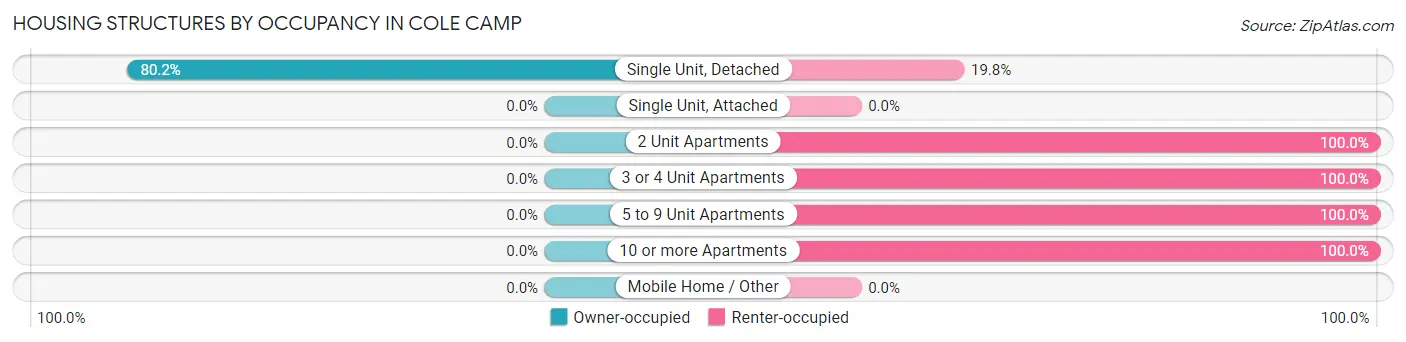
| Structure Type | Owner-occupied | Renter-occupied |
| Single Unit, Detached | 344 (80.2%) | 85 (19.8%) |
| Single Unit, Attached | 0 (0.0%) | 0 (0.0%) |
| 2 Unit Apartments | 0 (0.0%) | 6 (100.0%) |
| 3 or 4 Unit Apartments | 0 (0.0%) | 77 (100.0%) |
| 5 to 9 Unit Apartments | 0 (0.0%) | 20 (100.0%) |
| 10 or more Apartments | 0 (0.0%) | 32 (100.0%) |
| Mobile Home / Other | 0 (0.0%) | 0 (0.0%) |
| Total | 344 (61.0%) | 220 (39.0%) |
Housing Structures by Number of Rooms in Cole Camp
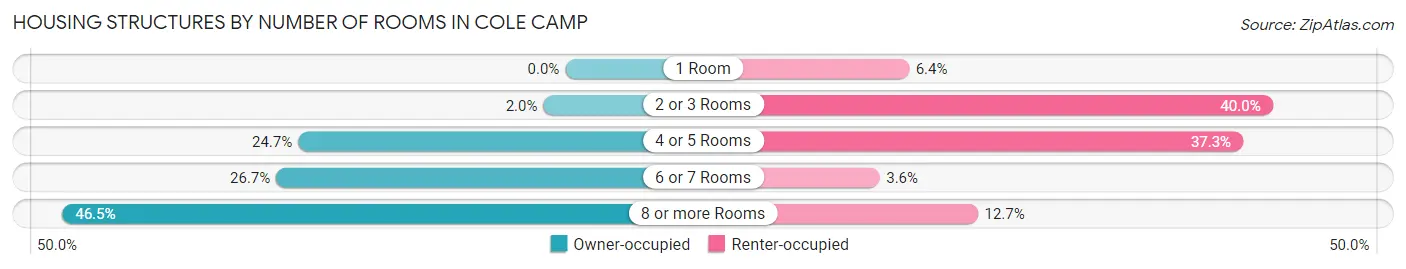
| Number of Rooms | Owner-occupied | Renter-occupied |
| 1 Room | 0 (0.0%) | 14 (6.4%) |
| 2 or 3 Rooms | 7 (2.0%) | 88 (40.0%) |
| 4 or 5 Rooms | 85 (24.7%) | 82 (37.3%) |
| 6 or 7 Rooms | 92 (26.7%) | 8 (3.6%) |
| 8 or more Rooms | 160 (46.5%) | 28 (12.7%) |
| Total | 344 (100.0%) | 220 (100.0%) |
Housing Structure by Heating Type in Cole Camp
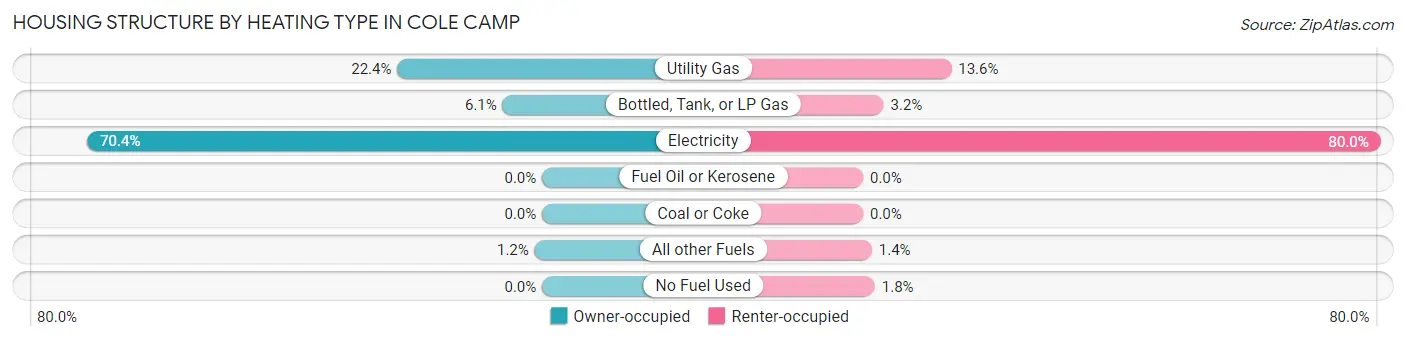
| Heating Type | Owner-occupied | Renter-occupied |
| Utility Gas | 77 (22.4%) | 30 (13.6%) |
| Bottled, Tank, or LP Gas | 21 (6.1%) | 7 (3.2%) |
| Electricity | 242 (70.4%) | 176 (80.0%) |
| Fuel Oil or Kerosene | 0 (0.0%) | 0 (0.0%) |
| Coal or Coke | 0 (0.0%) | 0 (0.0%) |
| All other Fuels | 4 (1.2%) | 3 (1.4%) |
| No Fuel Used | 0 (0.0%) | 4 (1.8%) |
| Total | 344 (100.0%) | 220 (100.0%) |
Household Vehicle Usage in Cole Camp
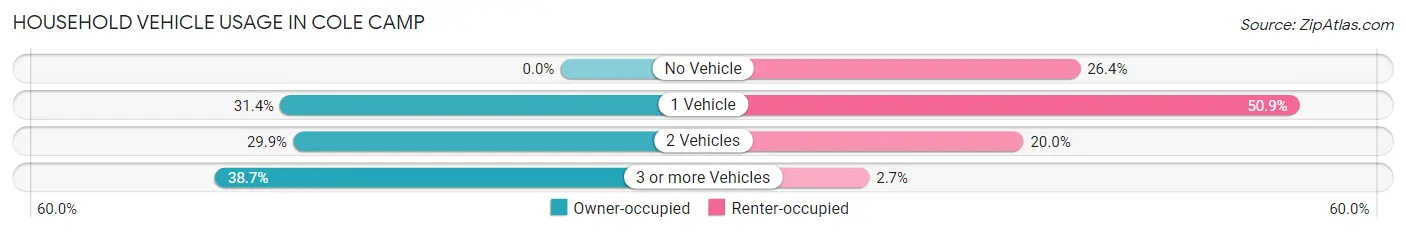
| Vehicles per Household | Owner-occupied | Renter-occupied |
| No Vehicle | 0 (0.0%) | 58 (26.4%) |
| 1 Vehicle | 108 (31.4%) | 112 (50.9%) |
| 2 Vehicles | 103 (29.9%) | 44 (20.0%) |
| 3 or more Vehicles | 133 (38.7%) | 6 (2.7%) |
| Total | 344 (100.0%) | 220 (100.0%) |
Real Estate & Mortgages in Cole Camp
Real Estate and Mortgage Overview in Cole Camp
| Characteristic | Without Mortgage | With Mortgage |
| Housing Units | 155 | 189 |
| Median Property Value | $130,700 | $0 |
| Median Household Income | $34,792 | $4 |
| Monthly Housing Costs | $407 | $8 |
| Real Estate Taxes | $807 | $4 |
Property Value by Mortgage Status in Cole Camp
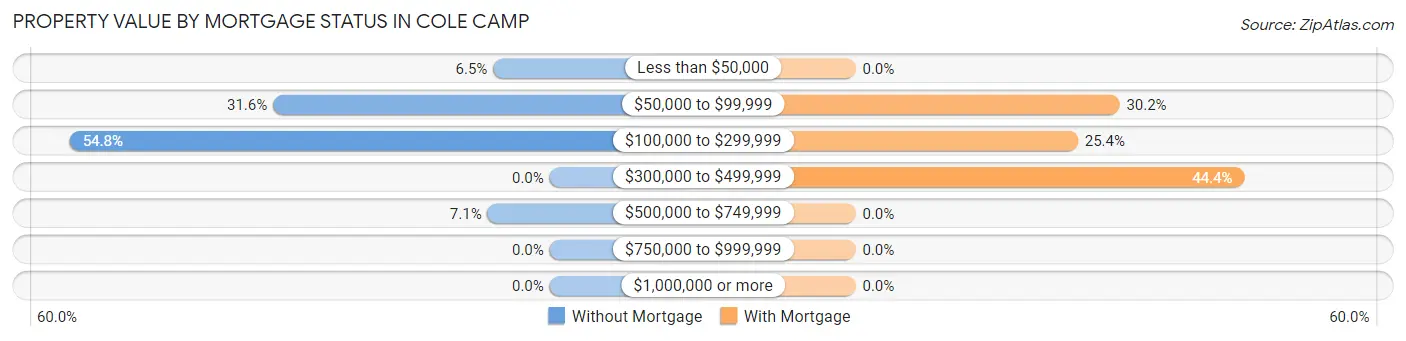
| Property Value | Without Mortgage | With Mortgage |
| Less than $50,000 | 10 (6.5%) | 0 (0.0%) |
| $50,000 to $99,999 | 49 (31.6%) | 57 (30.2%) |
| $100,000 to $299,999 | 85 (54.8%) | 48 (25.4%) |
| $300,000 to $499,999 | 0 (0.0%) | 84 (44.4%) |
| $500,000 to $749,999 | 11 (7.1%) | 0 (0.0%) |
| $750,000 to $999,999 | 0 (0.0%) | 0 (0.0%) |
| $1,000,000 or more | 0 (0.0%) | 0 (0.0%) |
| Total | 155 (100.0%) | 189 (100.0%) |
Household Income by Mortgage Status in Cole Camp
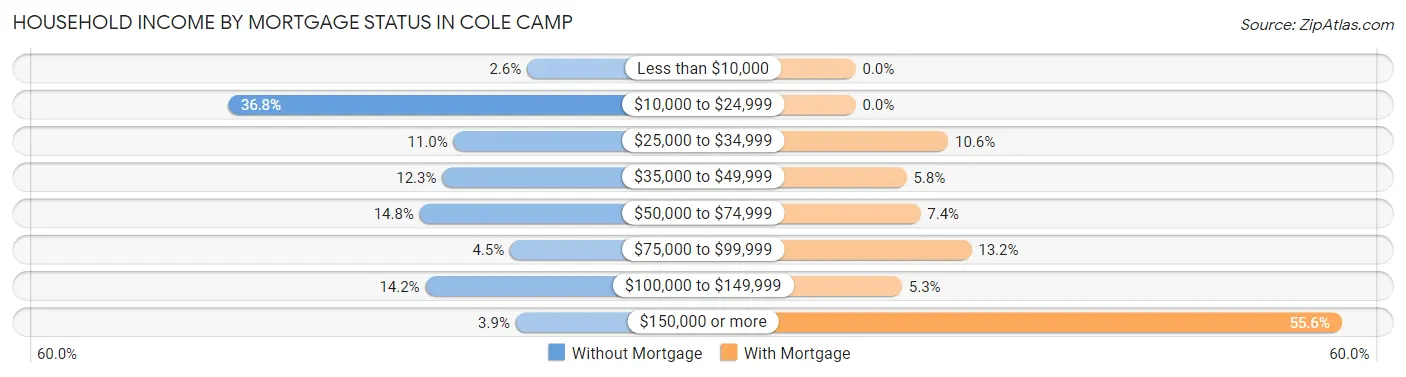
| Household Income | Without Mortgage | With Mortgage |
| Less than $10,000 | 4 (2.6%) | 0 (0.0%) |
| $10,000 to $24,999 | 57 (36.8%) | 0 (0.0%) |
| $25,000 to $34,999 | 17 (11.0%) | 20 (10.6%) |
| $35,000 to $49,999 | 19 (12.3%) | 11 (5.8%) |
| $50,000 to $74,999 | 23 (14.8%) | 14 (7.4%) |
| $75,000 to $99,999 | 7 (4.5%) | 25 (13.2%) |
| $100,000 to $149,999 | 22 (14.2%) | 10 (5.3%) |
| $150,000 or more | 6 (3.9%) | 105 (55.6%) |
| Total | 155 (100.0%) | 189 (100.0%) |
Property Value to Household Income Ratio in Cole Camp
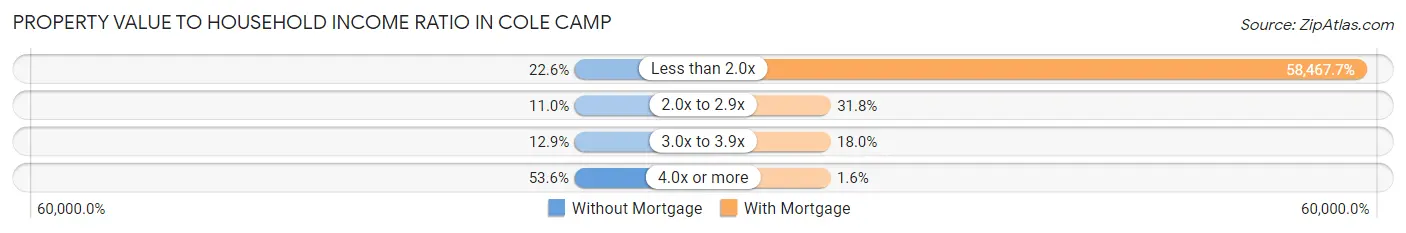
| Value-to-Income Ratio | Without Mortgage | With Mortgage |
| Less than 2.0x | 35 (22.6%) | 110,504 (58,467.7%) |
| 2.0x to 2.9x | 17 (11.0%) | 60 (31.8%) |
| 3.0x to 3.9x | 20 (12.9%) | 34 (18.0%) |
| 4.0x or more | 83 (53.5%) | 3 (1.6%) |
| Total | 155 (100.0%) | 189 (100.0%) |
Real Estate Taxes by Mortgage Status in Cole Camp
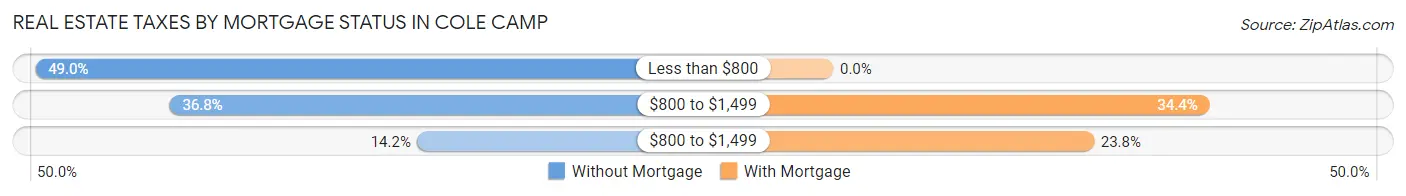
| Property Taxes | Without Mortgage | With Mortgage |
| Less than $800 | 76 (49.0%) | 0 (0.0%) |
| $800 to $1,499 | 57 (36.8%) | 65 (34.4%) |
| $800 to $1,499 | 22 (14.2%) | 45 (23.8%) |
| Total | 155 (100.0%) | 189 (100.0%) |
Health & Disability in Cole Camp
Health Insurance Coverage by Age in Cole Camp
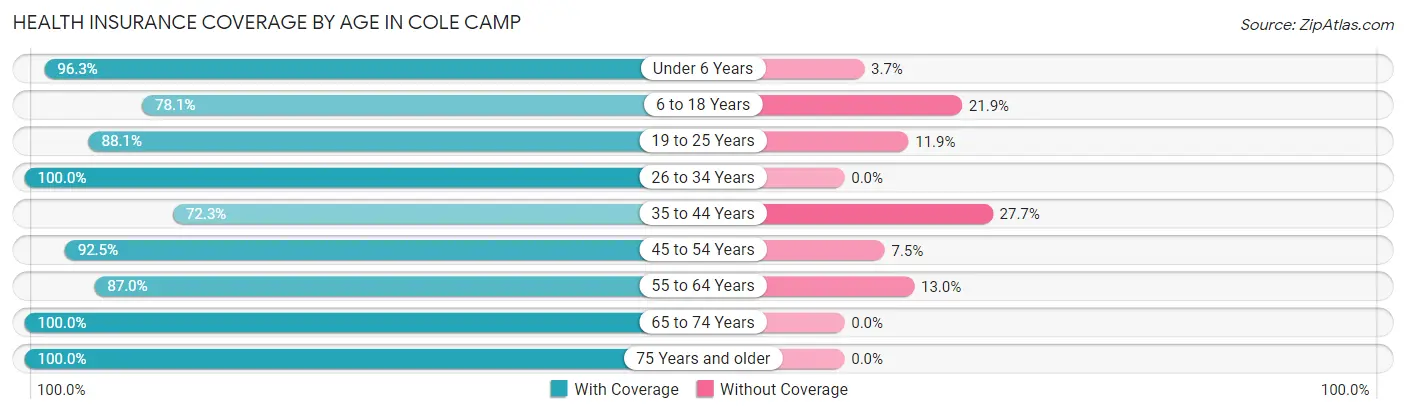
| Age Bracket | With Coverage | Without Coverage |
| Under 6 Years | 78 (96.3%) | 3 (3.7%) |
| 6 to 18 Years | 146 (78.1%) | 41 (21.9%) |
| 19 to 25 Years | 118 (88.1%) | 16 (11.9%) |
| 26 to 34 Years | 91 (100.0%) | 0 (0.0%) |
| 35 to 44 Years | 68 (72.3%) | 26 (27.7%) |
| 45 to 54 Years | 234 (92.5%) | 19 (7.5%) |
| 55 to 64 Years | 127 (87.0%) | 19 (13.0%) |
| 65 to 74 Years | 157 (100.0%) | 0 (0.0%) |
| 75 Years and older | 169 (100.0%) | 0 (0.0%) |
| Total | 1,188 (90.5%) | 124 (9.5%) |
Health Insurance Coverage by Citizenship Status in Cole Camp
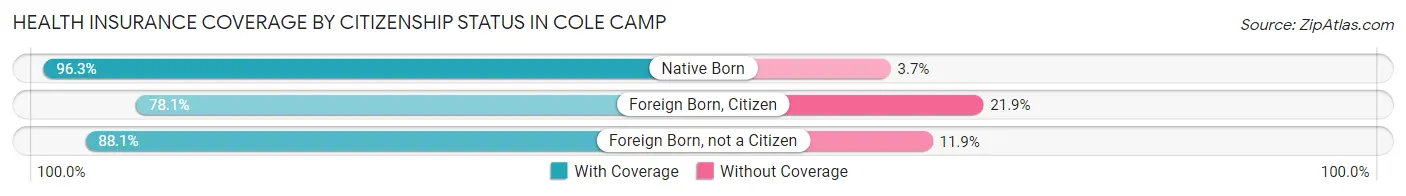
| Citizenship Status | With Coverage | Without Coverage |
| Native Born | 78 (96.3%) | 3 (3.7%) |
| Foreign Born, Citizen | 146 (78.1%) | 41 (21.9%) |
| Foreign Born, not a Citizen | 118 (88.1%) | 16 (11.9%) |
Health Insurance Coverage by Household Income in Cole Camp
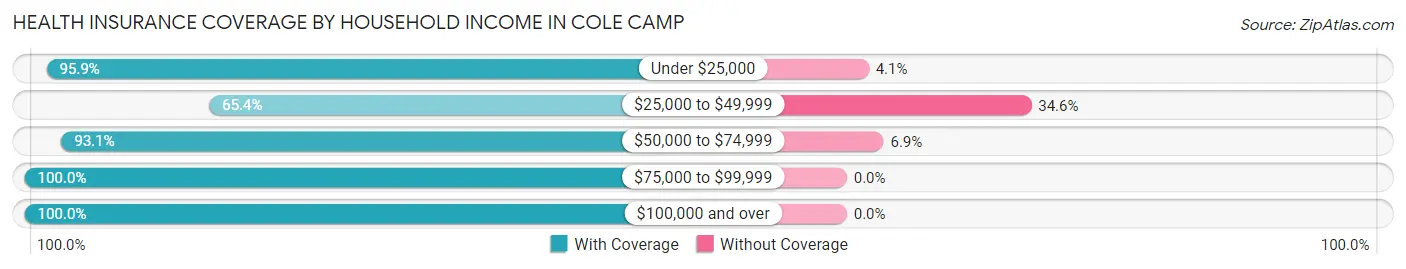
| Household Income | With Coverage | Without Coverage |
| Under $25,000 | 281 (95.9%) | 12 (4.1%) |
| $25,000 to $49,999 | 176 (65.4%) | 93 (34.6%) |
| $50,000 to $74,999 | 257 (93.1%) | 19 (6.9%) |
| $75,000 to $99,999 | 41 (100.0%) | 0 (0.0%) |
| $100,000 and over | 424 (100.0%) | 0 (0.0%) |
Public vs Private Health Insurance Coverage by Age in Cole Camp
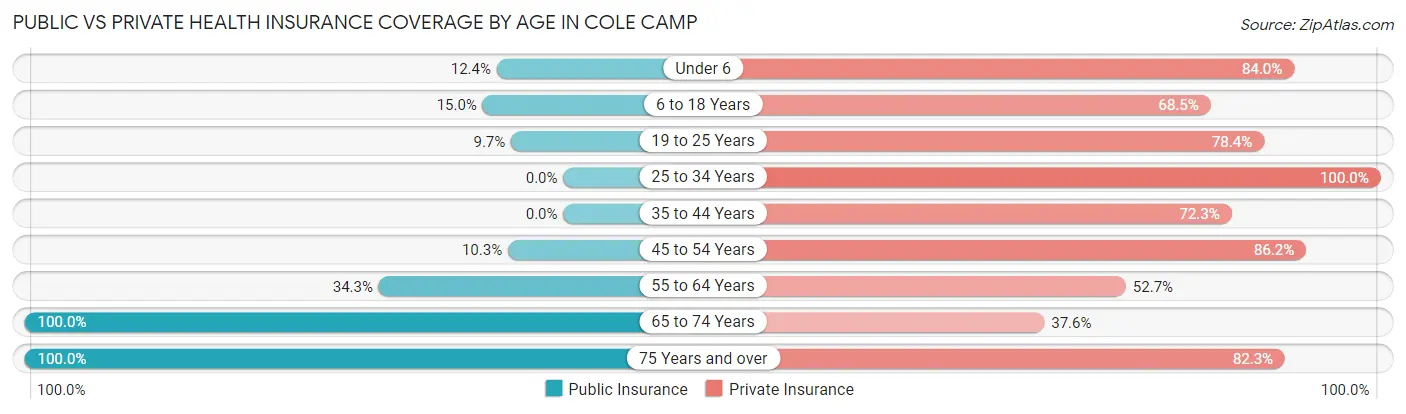
| Age Bracket | Public Insurance | Private Insurance |
| Under 6 | 10 (12.3%) | 68 (84.0%) |
| 6 to 18 Years | 28 (15.0%) | 128 (68.4%) |
| 19 to 25 Years | 13 (9.7%) | 105 (78.4%) |
| 25 to 34 Years | 0 (0.0%) | 91 (100.0%) |
| 35 to 44 Years | 0 (0.0%) | 68 (72.3%) |
| 45 to 54 Years | 26 (10.3%) | 218 (86.2%) |
| 55 to 64 Years | 50 (34.3%) | 77 (52.7%) |
| 65 to 74 Years | 157 (100.0%) | 59 (37.6%) |
| 75 Years and over | 169 (100.0%) | 139 (82.3%) |
| Total | 453 (34.5%) | 953 (72.6%) |
Disability Status by Sex by Age in Cole Camp
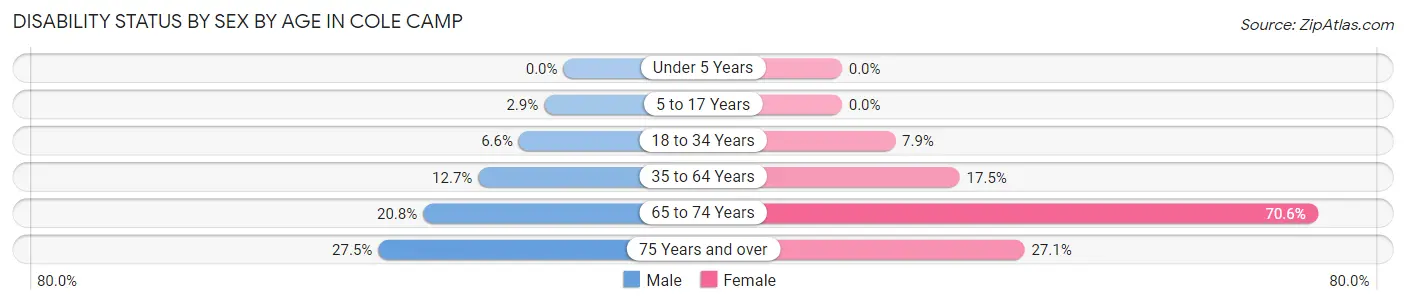
| Age Bracket | Male | Female |
| Under 5 Years | 0 (0.0%) | 0 (0.0%) |
| 5 to 17 Years | 3 (2.9%) | 0 (0.0%) |
| 18 to 34 Years | 9 (6.6%) | 8 (7.9%) |
| 35 to 64 Years | 32 (12.7%) | 42 (17.5%) |
| 65 to 74 Years | 10 (20.8%) | 77 (70.6%) |
| 75 Years and over | 11 (27.5%) | 35 (27.1%) |
Disability Class by Sex by Age in Cole Camp
Disability Class: Hearing Difficulty
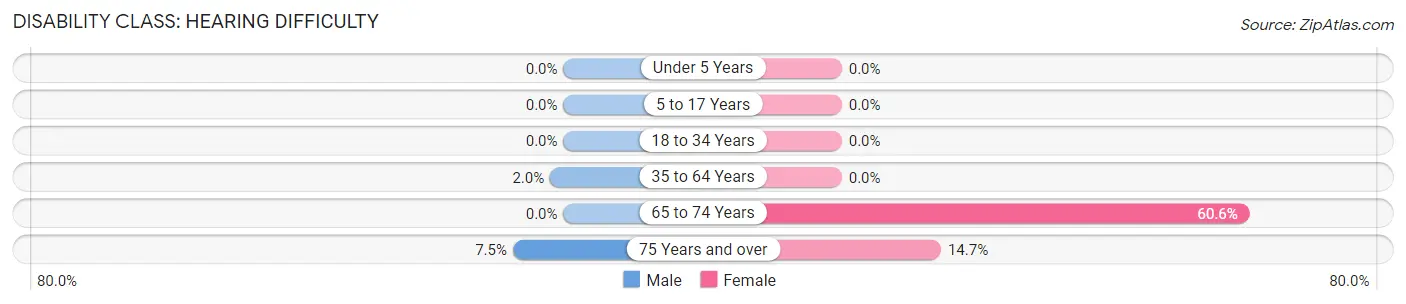
| Age Bracket | Male | Female |
| Under 5 Years | 0 (0.0%) | 0 (0.0%) |
| 5 to 17 Years | 0 (0.0%) | 0 (0.0%) |
| 18 to 34 Years | 0 (0.0%) | 0 (0.0%) |
| 35 to 64 Years | 5 (2.0%) | 0 (0.0%) |
| 65 to 74 Years | 0 (0.0%) | 66 (60.6%) |
| 75 Years and over | 3 (7.5%) | 19 (14.7%) |
Disability Class: Vision Difficulty
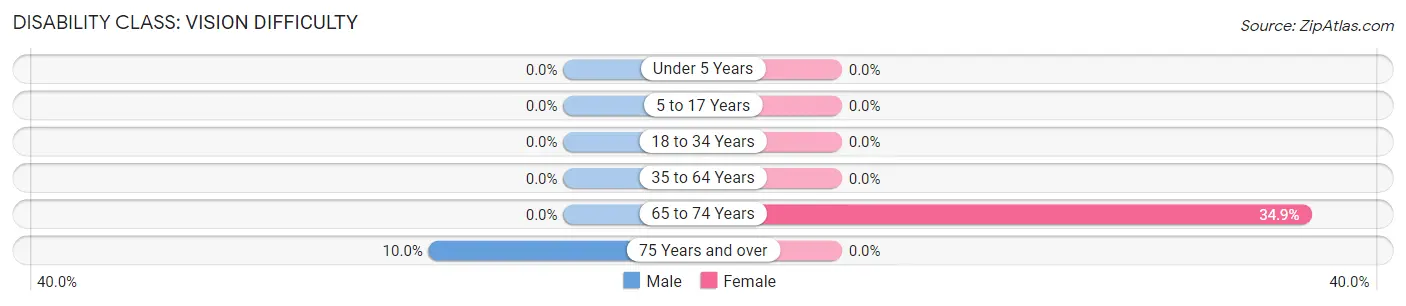
| Age Bracket | Male | Female |
| Under 5 Years | 0 (0.0%) | 0 (0.0%) |
| 5 to 17 Years | 0 (0.0%) | 0 (0.0%) |
| 18 to 34 Years | 0 (0.0%) | 0 (0.0%) |
| 35 to 64 Years | 0 (0.0%) | 0 (0.0%) |
| 65 to 74 Years | 0 (0.0%) | 38 (34.9%) |
| 75 Years and over | 4 (10.0%) | 0 (0.0%) |
Disability Class: Cognitive Difficulty
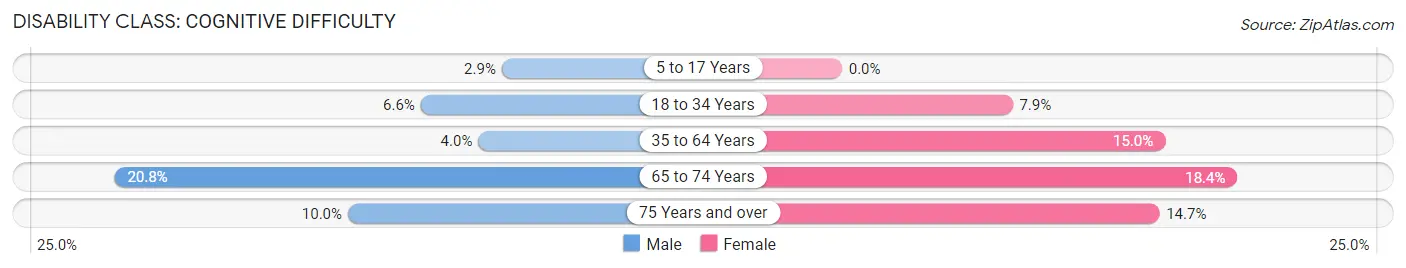
| Age Bracket | Male | Female |
| 5 to 17 Years | 3 (2.9%) | 0 (0.0%) |
| 18 to 34 Years | 9 (6.6%) | 8 (7.9%) |
| 35 to 64 Years | 10 (4.0%) | 36 (15.0%) |
| 65 to 74 Years | 10 (20.8%) | 20 (18.3%) |
| 75 Years and over | 4 (10.0%) | 19 (14.7%) |
Disability Class: Ambulatory Difficulty
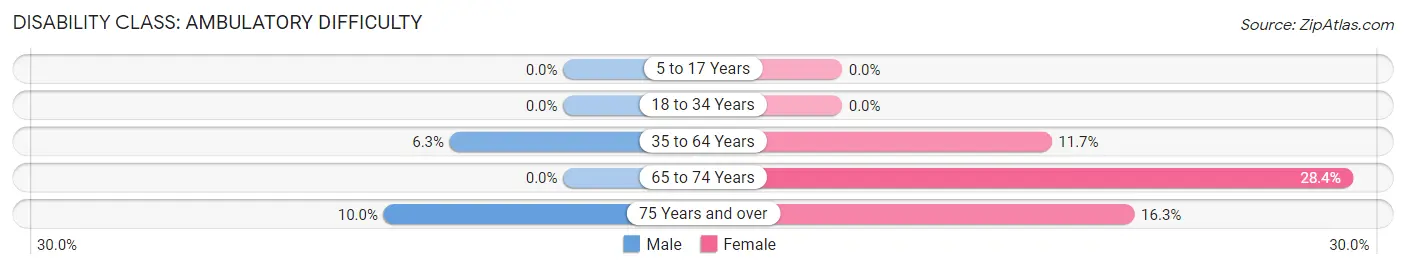
| Age Bracket | Male | Female |
| 5 to 17 Years | 0 (0.0%) | 0 (0.0%) |
| 18 to 34 Years | 0 (0.0%) | 0 (0.0%) |
| 35 to 64 Years | 16 (6.3%) | 28 (11.7%) |
| 65 to 74 Years | 0 (0.0%) | 31 (28.4%) |
| 75 Years and over | 4 (10.0%) | 21 (16.3%) |
Disability Class: Self-Care Difficulty
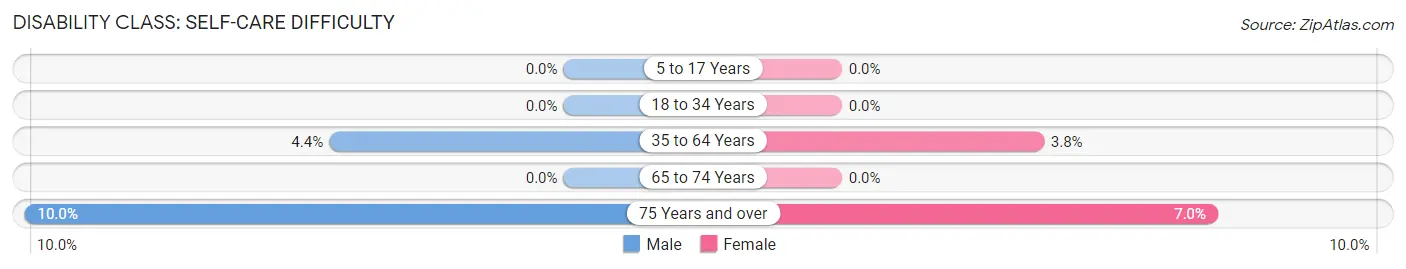
| Age Bracket | Male | Female |
| 5 to 17 Years | 0 (0.0%) | 0 (0.0%) |
| 18 to 34 Years | 0 (0.0%) | 0 (0.0%) |
| 35 to 64 Years | 11 (4.3%) | 9 (3.7%) |
| 65 to 74 Years | 0 (0.0%) | 0 (0.0%) |
| 75 Years and over | 4 (10.0%) | 9 (7.0%) |
Technology Access in Cole Camp
Computing Device Access in Cole Camp
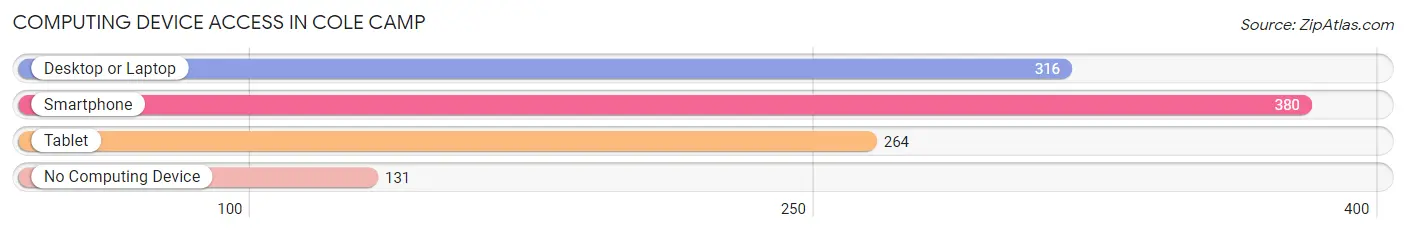
| Device Type | # Households | % Households |
| Desktop or Laptop | 316 | 56.0% |
| Smartphone | 380 | 67.4% |
| Tablet | 264 | 46.8% |
| No Computing Device | 131 | 23.2% |
| Total | 564 | 100.0% |
Internet Access in Cole Camp
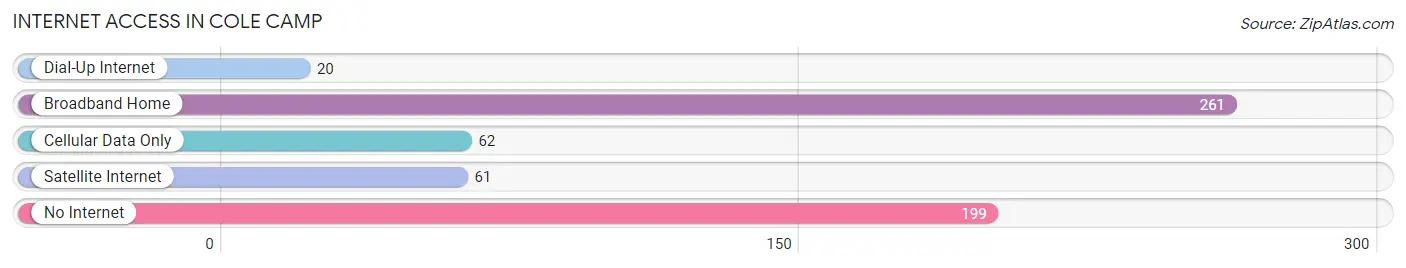
| Internet Type | # Households | % Households |
| Dial-Up Internet | 20 | 3.5% |
| Broadband Home | 261 | 46.3% |
| Cellular Data Only | 62 | 11.0% |
| Satellite Internet | 61 | 10.8% |
| No Internet | 199 | 35.3% |
| Total | 564 | 100.0% |
Cole Camp Summary
History
Cole Camp is a small city located in Benton County, Missouri. It is situated in the western part of the state, approximately 40 miles east of Kansas City. The city was founded in 1856 by a group of German immigrants led by John Cole. The city was named after Cole, who was a prominent figure in the area.
The city was originally a farming community, and the main crops grown were wheat, corn, and oats. The city also had a thriving dairy industry, and the local farmers sold their milk to the nearby towns of Sedalia and Warsaw.
In the late 19th century, the city began to grow and develop. The railroad arrived in 1887, and the city was incorporated in 1889. The city was also home to a number of businesses, including a flour mill, a brickyard, a sawmill, and a furniture factory.
In the early 20th century, the city continued to grow and develop. The population increased from 1,000 in 1900 to 1,500 in 1910. The city also had a number of churches, schools, and other businesses.
Geography
Cole Camp is located in western Missouri, approximately 40 miles east of Kansas City. The city is situated in Benton County, and is bordered by the cities of Lincoln and Warsaw. The city is located in the Osage Plains region of the state, and is situated on the banks of the Osage River.
The city has a total area of 1.2 square miles, all of which is land. The city has a humid continental climate, with hot summers and cold winters. The average annual temperature is 54 degrees Fahrenheit, and the average annual precipitation is 39 inches.
Economy
The economy of Cole Camp is largely based on agriculture. The city is home to a number of farms, and the main crops grown are wheat, corn, and oats. The city also has a thriving dairy industry, and the local farmers sell their milk to the nearby towns of Sedalia and Warsaw.
The city is also home to a number of businesses, including a flour mill, a brickyard, a sawmill, and a furniture factory. The city also has a number of retail stores, restaurants, and other businesses.
Demographics
As of the 2010 census, the population of Cole Camp was 1,717. The racial makeup of the city was 97.3% White, 0.7% African American, 0.2% Native American, 0.2% Asian, 0.1% Pacific Islander, 0.3% from other races, and 1.2% from two or more races. Hispanic or Latino of any race were 1.2% of the population.
The median household income in the city was $37,500, and the median family income was $45,000. The per capita income in the city was $18,000. About 11.3% of the population was below the poverty line.
Common Questions
What is Per Capita Income in Cole Camp?
Per Capita income in Cole Camp is $25,028.
What is the Median Family Income in Cole Camp?
Median Family Income in Cole Camp is $70,833.
What is the Median Household income in Cole Camp?
Median Household Income in Cole Camp is $40,192.
What is Income or Wage Gap in Cole Camp?
Income or Wage Gap in Cole Camp is 36.8%.
Women in Cole Camp earn 63.2 cents for every dollar earned by a man.
What is Inequality or Gini Index in Cole Camp?
Inequality or Gini Index in Cole Camp is 0.47.
What is the Total Population of Cole Camp?
Total Population of Cole Camp is 1,363.
What is the Total Male Population of Cole Camp?
Total Male Population of Cole Camp is 628.
What is the Total Female Population of Cole Camp?
Total Female Population of Cole Camp is 735.
What is the Ratio of Males per 100 Females in Cole Camp?
There are 85.44 Males per 100 Females in Cole Camp.
What is the Ratio of Females per 100 Males in Cole Camp?
There are 117.04 Females per 100 Males in Cole Camp.
What is the Median Population Age in Cole Camp?
Median Population Age in Cole Camp is 47.2 Years.
What is the Average Family Size in Cole Camp
Average Family Size in Cole Camp is 3.3 People.
What is the Average Household Size in Cole Camp
Average Household Size in Cole Camp is 2.3 People.
How Large is the Labor Force in Cole Camp?
There are 549 People in the Labor Forcein in Cole Camp.
What is the Percentage of People in the Labor Force in Cole Camp?
48.0% of People are in the Labor Force in Cole Camp.
What is the Unemployment Rate in Cole Camp?
Unemployment Rate in Cole Camp is 0.5%.