Clearmont, MO Map & Demographics
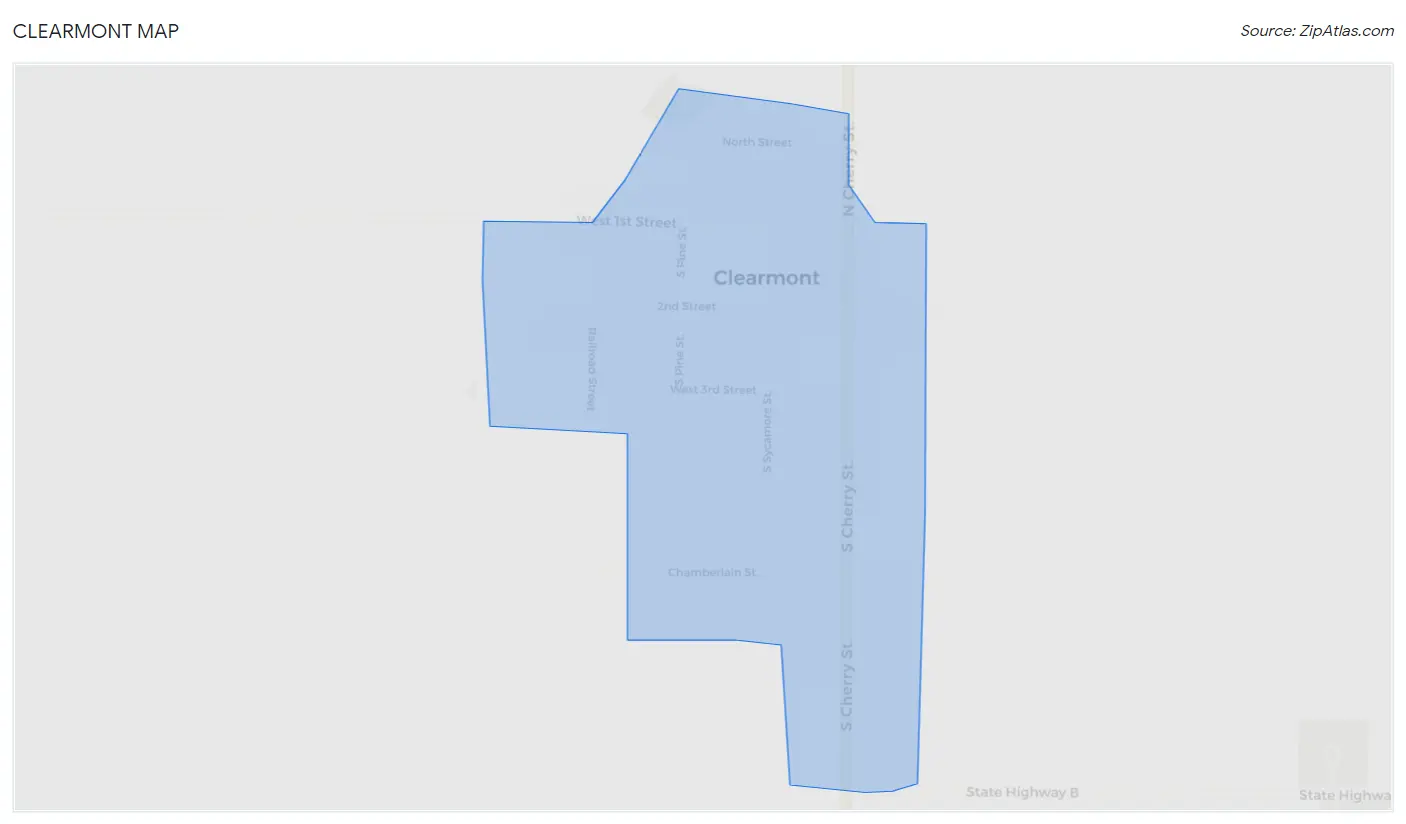
Clearmont Map
Clearmont Overview
$38,019
PER CAPITA INCOME
$45,000
AVG HOUSEHOLD INCOME
0.46
INEQUALITY / GINI INDEX
152
TOTAL POPULATION
85
MALE POPULATION
67
FEMALE POPULATION
126.87
MALES / 100 FEMALES
78.82
FEMALES / 100 MALES
56.0
MEDIAN AGE
2.3
AVG FAMILY SIZE
1.8
AVG HOUSEHOLD SIZE
73
LABOR FORCE [ PEOPLE ]
51.4%
PERCENT IN LABOR FORCE
Clearmont Zip Codes
Clearmont Area Codes
Income in Clearmont
Income Overview in Clearmont
| Characteristic | Number | Measure |
| Per Capita Income | 152 | $38,019 |
| Median Family Income | 48 | $0 |
| Mean Family Income | 48 | $90,869 |
| Median Household Income | 86 | $45,000 |
| Mean Household Income | 86 | $67,197 |
| Income Deficit | 48 | $0 |
| Wage / Income Gap (%) | 152 | 0.00% |
| Wage / Income Gap ($) | 152 | 100.00¢ per $1 |
| Gini / Inequality Index | 152 | 0.46 |
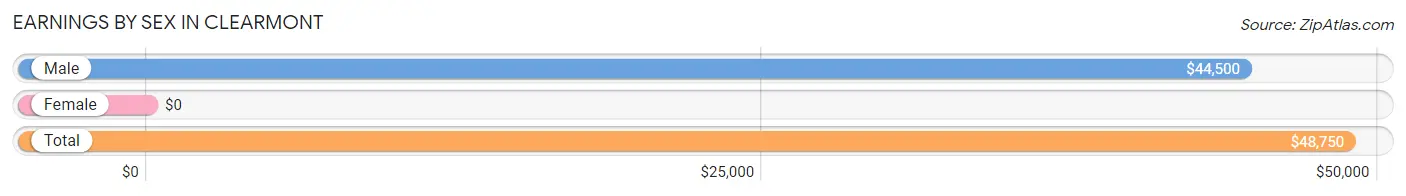
Earnings by Sex in Clearmont
| Sex | Number | Average Earnings |
| Male | 46 (59.7%) | $44,500 |
| Female | 31 (40.3%) | $0 |
| Total | 77 (100.0%) | $48,750 |
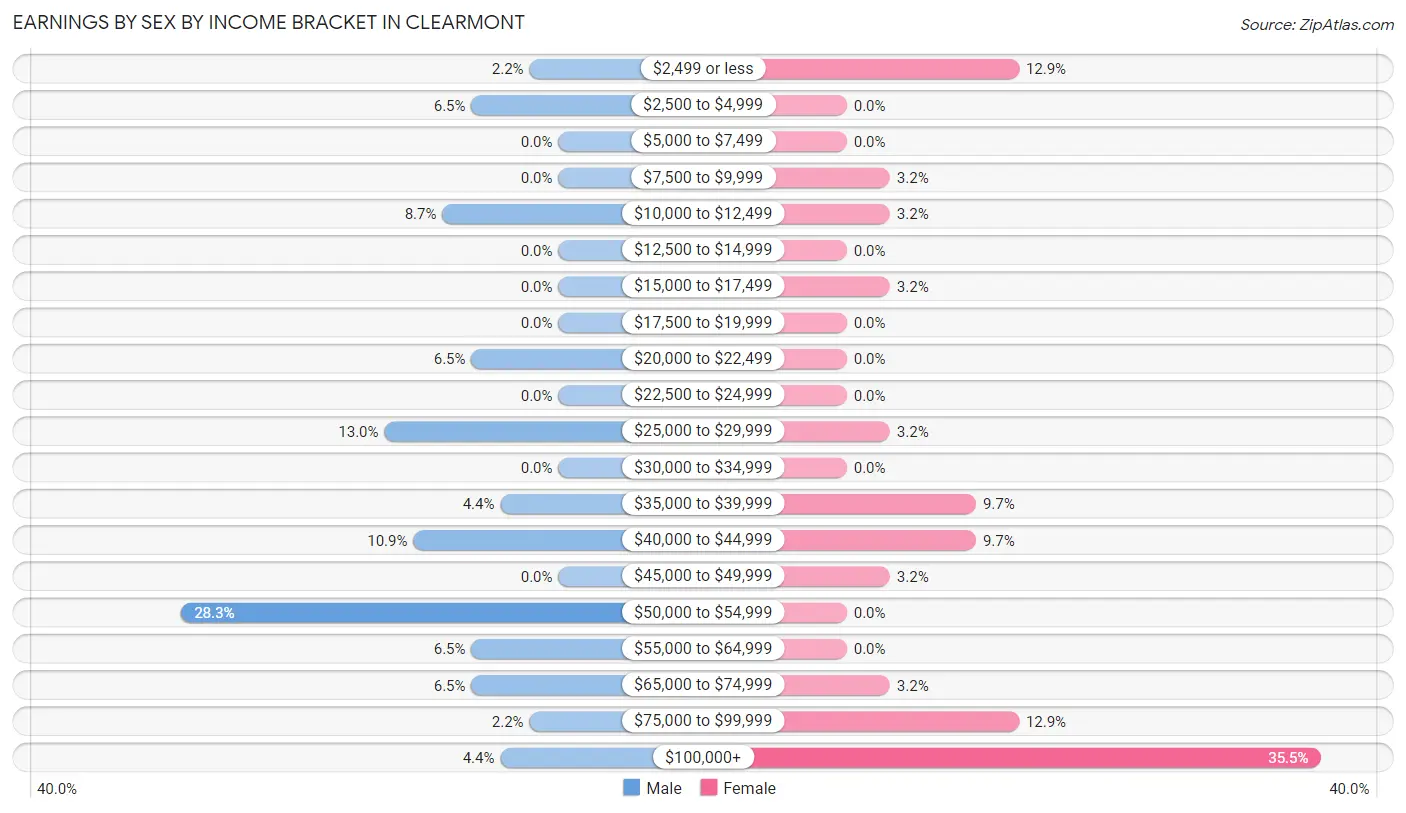
Earnings by Sex by Income Bracket in Clearmont
The most common earnings brackets in Clearmont are $50,000 to $54,999 for men (13 | 28.3%) and $100,000+ for women (11 | 35.5%).
| Income | Male | Female |
| $2,499 or less | 1 (2.2%) | 4 (12.9%) |
| $2,500 to $4,999 | 3 (6.5%) | 0 (0.0%) |
| $5,000 to $7,499 | 0 (0.0%) | 0 (0.0%) |
| $7,500 to $9,999 | 0 (0.0%) | 1 (3.2%) |
| $10,000 to $12,499 | 4 (8.7%) | 1 (3.2%) |
| $12,500 to $14,999 | 0 (0.0%) | 0 (0.0%) |
| $15,000 to $17,499 | 0 (0.0%) | 1 (3.2%) |
| $17,500 to $19,999 | 0 (0.0%) | 0 (0.0%) |
| $20,000 to $22,499 | 3 (6.5%) | 0 (0.0%) |
| $22,500 to $24,999 | 0 (0.0%) | 0 (0.0%) |
| $25,000 to $29,999 | 6 (13.0%) | 1 (3.2%) |
| $30,000 to $34,999 | 0 (0.0%) | 0 (0.0%) |
| $35,000 to $39,999 | 2 (4.3%) | 3 (9.7%) |
| $40,000 to $44,999 | 5 (10.9%) | 3 (9.7%) |
| $45,000 to $49,999 | 0 (0.0%) | 1 (3.2%) |
| $50,000 to $54,999 | 13 (28.3%) | 0 (0.0%) |
| $55,000 to $64,999 | 3 (6.5%) | 0 (0.0%) |
| $65,000 to $74,999 | 3 (6.5%) | 1 (3.2%) |
| $75,000 to $99,999 | 1 (2.2%) | 4 (12.9%) |
| $100,000+ | 2 (4.3%) | 11 (35.5%) |
| Total | 46 (100.0%) | 31 (100.0%) |
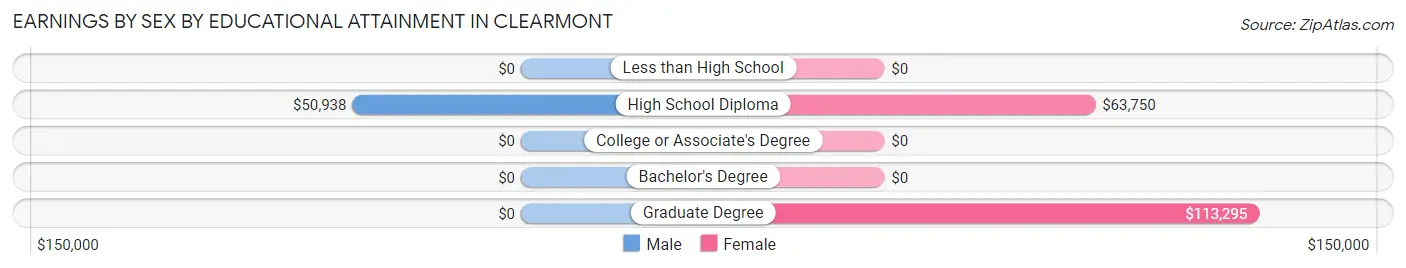
Earnings by Sex by Educational Attainment in Clearmont
| Educational Attainment | Male Income | Female Income |
| Less than High School | - | - |
| High School Diploma | $50,938 | $63,750 |
| College or Associate's Degree | - | - |
| Bachelor's Degree | - | - |
| Graduate Degree | - | - |
| Total | $50,833 | $0 |
Family Income in Clearmont
Family Income Brackets in Clearmont
According to the Clearmont family income data, there are 16 families falling into the $150,000 to $199,999 income range, which is the most common income bracket and makes up 33.3% of all families.
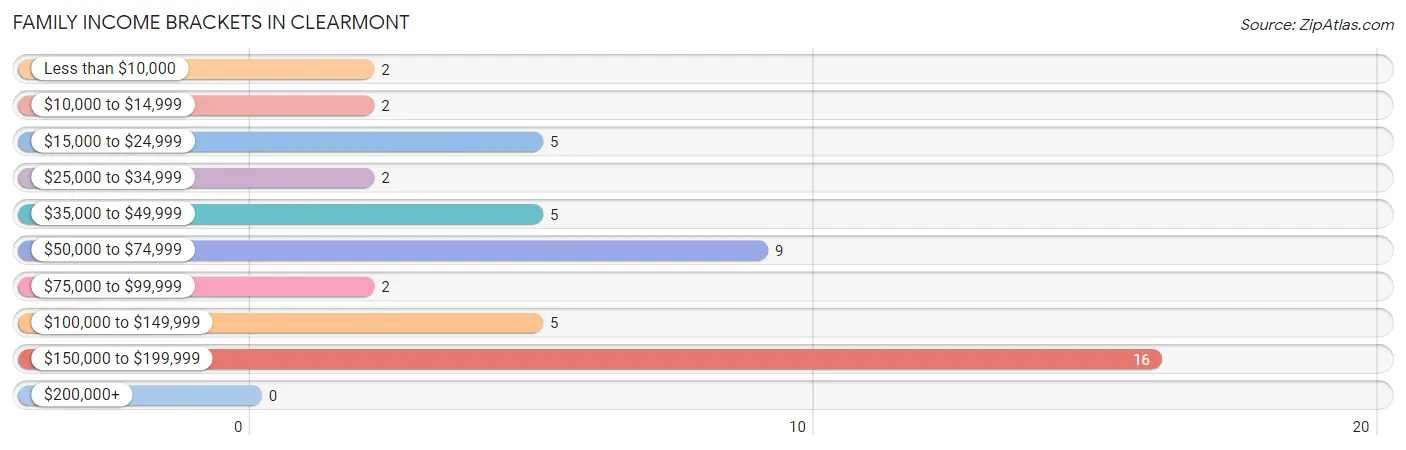
| Income Bracket | # Families | % Families |
| Less than $10,000 | 2 | 4.2% |
| $10,000 to $14,999 | 2 | 4.2% |
| $15,000 to $24,999 | 5 | 10.4% |
| $25,000 to $34,999 | 2 | 4.2% |
| $35,000 to $49,999 | 5 | 10.4% |
| $50,000 to $74,999 | 9 | 18.8% |
| $75,000 to $99,999 | 2 | 4.2% |
| $100,000 to $149,999 | 5 | 10.4% |
| $150,000 to $199,999 | 16 | 33.3% |
| $200,000+ | 0 | 0.0% |
Family Income by Famaliy Size in Clearmont
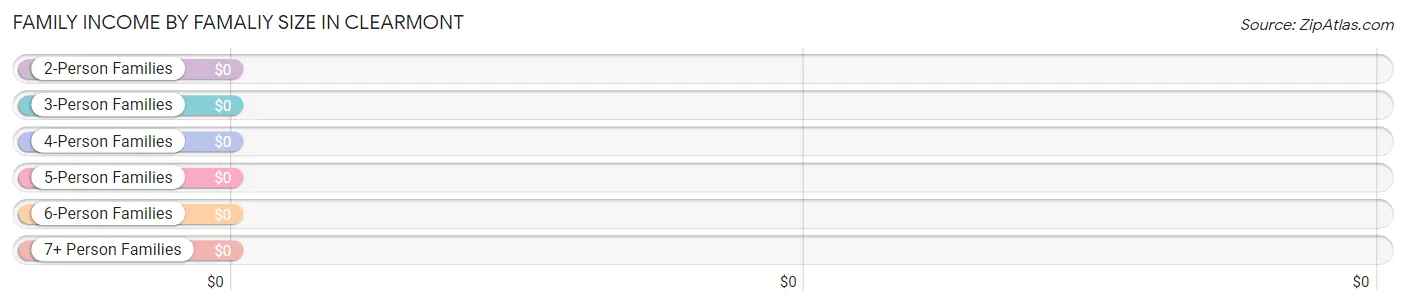
| Income Bracket | # Families | Median Income |
| 2-Person Families | 42 (87.5%) | $0 |
| 3-Person Families | 1 (2.1%) | $0 |
| 4-Person Families | 1 (2.1%) | $0 |
| 5-Person Families | 2 (4.2%) | $0 |
| 6-Person Families | 2 (4.2%) | $0 |
| 7+ Person Families | 0 (0.0%) | $0 |
| Total | 48 (100.0%) | $0 |
Family Income by Number of Earners in Clearmont
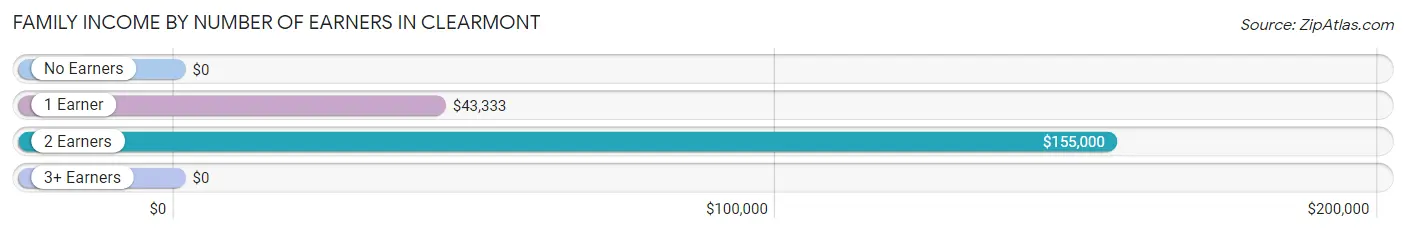
| Number of Earners | # Families | Median Income |
| No Earners | 15 (31.2%) | $0 |
| 1 Earner | 6 (12.5%) | $43,333 |
| 2 Earners | 24 (50.0%) | $155,000 |
| 3+ Earners | 3 (6.2%) | $0 |
| Total | 48 (100.0%) | $0 |
Household Income in Clearmont
Household Income Brackets in Clearmont
With 18 households falling in the category, the $150,000 to $199,999 income range is the most frequent in Clearmont, accounting for 20.9% of all households.
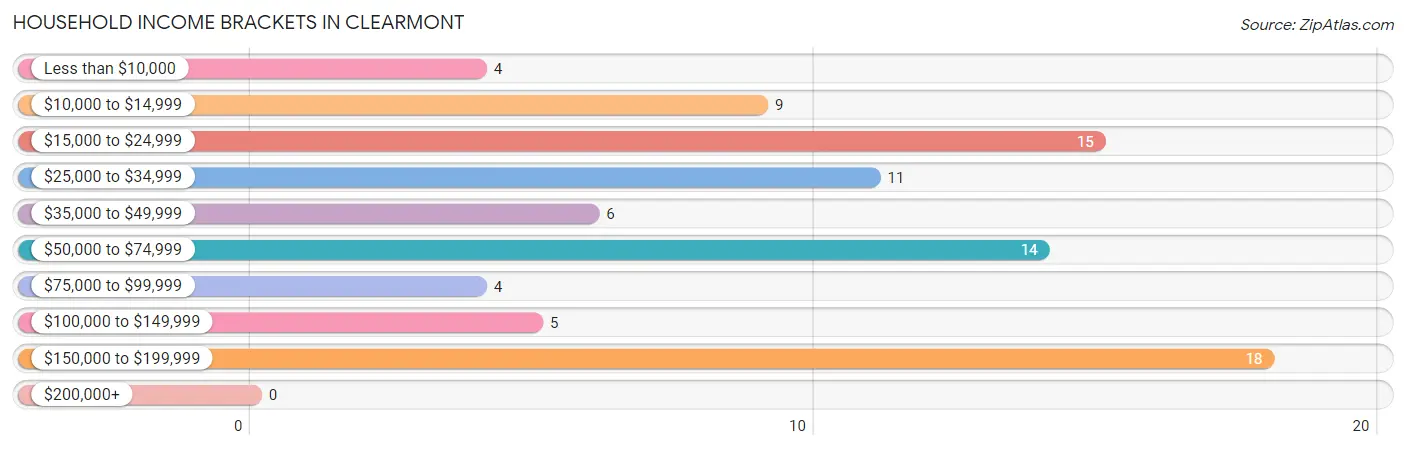
| Income Bracket | # Households | % Households |
| Less than $10,000 | 4 | 4.7% |
| $10,000 to $14,999 | 9 | 10.5% |
| $15,000 to $24,999 | 15 | 17.4% |
| $25,000 to $34,999 | 11 | 12.8% |
| $35,000 to $49,999 | 6 | 7.0% |
| $50,000 to $74,999 | 14 | 16.3% |
| $75,000 to $99,999 | 4 | 4.7% |
| $100,000 to $149,999 | 5 | 5.8% |
| $150,000 to $199,999 | 18 | 20.9% |
| $200,000+ | 0 | 0.0% |
Household Income by Householder Age in Clearmont
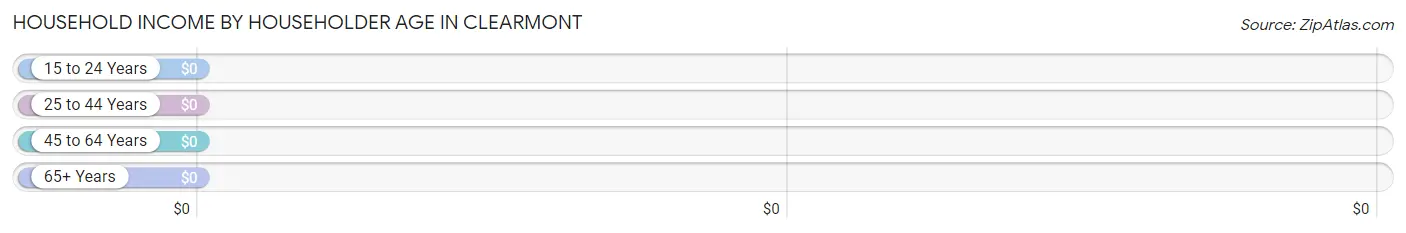
| Income Bracket | # Households | Median Income |
| 15 to 24 Years | 0 (0.0%) | $0 |
| 25 to 44 Years | 3 (3.5%) | $0 |
| 45 to 64 Years | 50 (58.1%) | $0 |
| 65+ Years | 33 (38.4%) | $0 |
| Total | 86 (100.0%) | $45,000 |
Poverty in Clearmont
Income Below Poverty by Sex and Age in Clearmont
With 12.9% poverty level for males and 15.6% for females among the residents of Clearmont, 65 to 74 year old males and 35 to 44 year old females are the most vulnerable to poverty, with 2 males (28.6%) and 3 females (75.0%) in their respective age groups living below the poverty level.
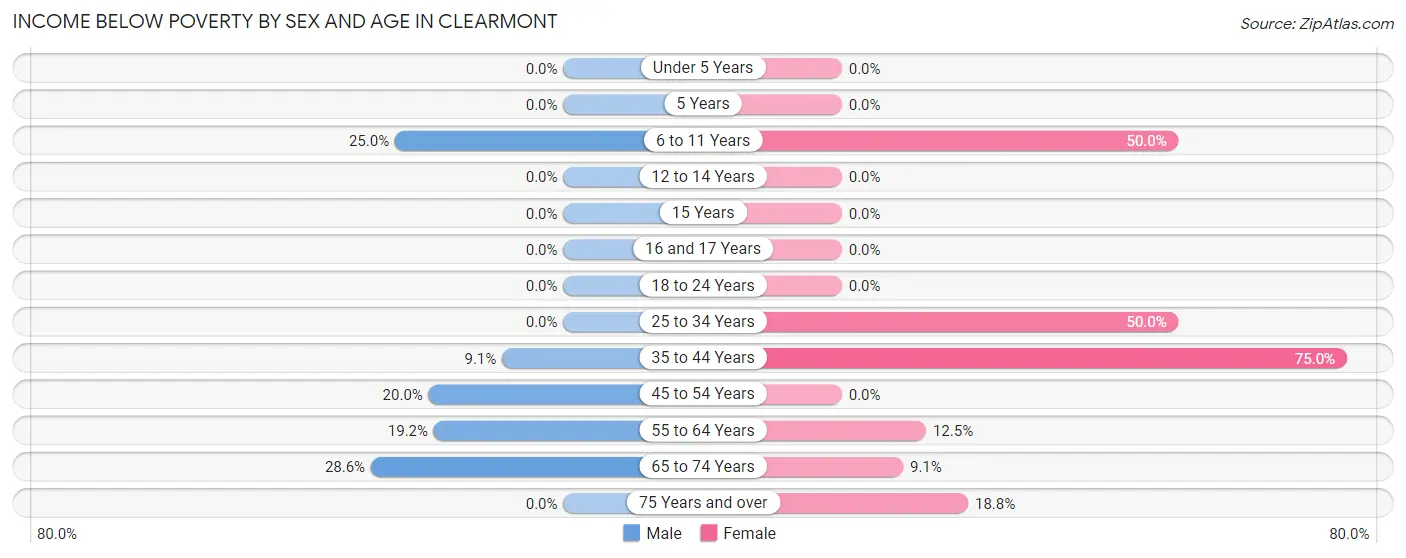
| Age Bracket | Male | Female |
| Under 5 Years | 0 (0.0%) | 0 (0.0%) |
| 5 Years | 0 (0.0%) | 0 (0.0%) |
| 6 to 11 Years | 1 (25.0%) | 1 (50.0%) |
| 12 to 14 Years | 0 (0.0%) | 0 (0.0%) |
| 15 Years | 0 (0.0%) | 0 (0.0%) |
| 16 and 17 Years | 0 (0.0%) | 0 (0.0%) |
| 18 to 24 Years | 0 (0.0%) | 0 (0.0%) |
| 25 to 34 Years | 0 (0.0%) | 1 (50.0%) |
| 35 to 44 Years | 1 (9.1%) | 3 (75.0%) |
| 45 to 54 Years | 2 (20.0%) | 0 (0.0%) |
| 55 to 64 Years | 5 (19.2%) | 1 (12.5%) |
| 65 to 74 Years | 2 (28.6%) | 1 (9.1%) |
| 75 Years and over | 0 (0.0%) | 3 (18.8%) |
| Total | 11 (12.9%) | 10 (15.6%) |
Income Above Poverty by Sex and Age in Clearmont
According to the poverty statistics in Clearmont, males aged under 5 years and females aged 45 to 54 years are the age groups that are most secure financially, with 100.0% of males and 100.0% of females in these age groups living above the poverty line.
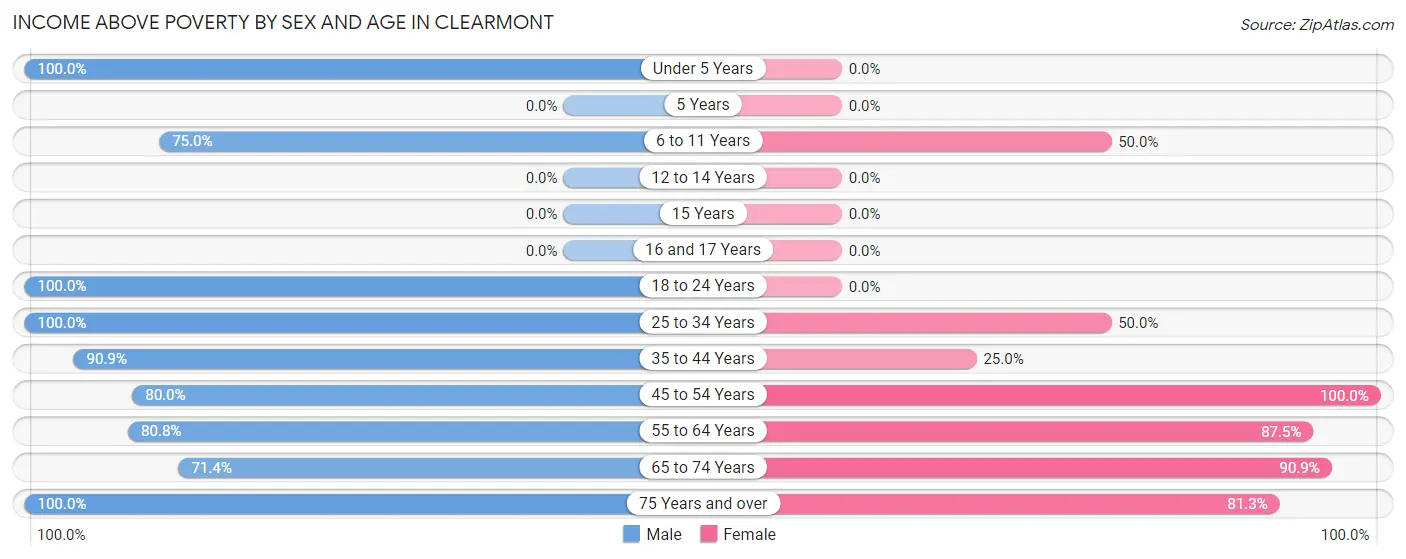
| Age Bracket | Male | Female |
| Under 5 Years | 1 (100.0%) | 0 (0.0%) |
| 5 Years | 0 (0.0%) | 0 (0.0%) |
| 6 to 11 Years | 3 (75.0%) | 1 (50.0%) |
| 12 to 14 Years | 0 (0.0%) | 0 (0.0%) |
| 15 Years | 0 (0.0%) | 0 (0.0%) |
| 16 and 17 Years | 0 (0.0%) | 0 (0.0%) |
| 18 to 24 Years | 10 (100.0%) | 0 (0.0%) |
| 25 to 34 Years | 1 (100.0%) | 1 (50.0%) |
| 35 to 44 Years | 10 (90.9%) | 1 (25.0%) |
| 45 to 54 Years | 8 (80.0%) | 21 (100.0%) |
| 55 to 64 Years | 21 (80.8%) | 7 (87.5%) |
| 65 to 74 Years | 5 (71.4%) | 10 (90.9%) |
| 75 Years and over | 15 (100.0%) | 13 (81.2%) |
| Total | 74 (87.1%) | 54 (84.4%) |
Income Below Poverty Among Married-Couple Families in Clearmont
The poverty statistics for married-couple families in Clearmont show that 4.6% or 2 of the total 43 families live below the poverty line. Families with no children have the highest poverty rate of 5.1%, comprising of 2 families. On the other hand, families with 1 or 2 children have the lowest poverty rate of 0.0%, which includes 0 families.
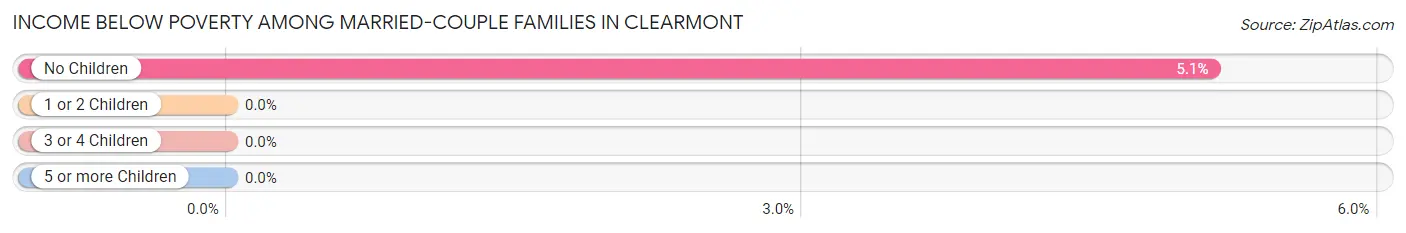
| Children | Above Poverty | Below Poverty |
| No Children | 37 (94.9%) | 2 (5.1%) |
| 1 or 2 Children | 4 (100.0%) | 0 (0.0%) |
| 3 or 4 Children | 0 (0.0%) | 0 (0.0%) |
| 5 or more Children | 0 (0.0%) | 0 (0.0%) |
| Total | 41 (95.4%) | 2 (4.6%) |
Income Below Poverty Among Single-Parent Households in Clearmont
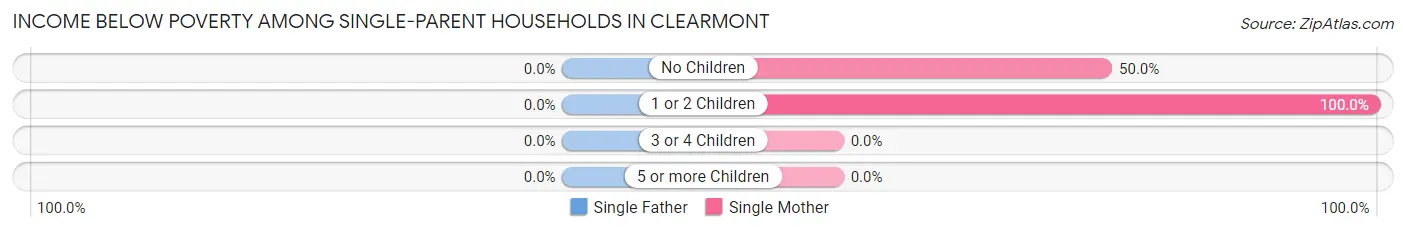
| Children | Single Father | Single Mother |
| No Children | 0 (0.0%) | 1 (50.0%) |
| 1 or 2 Children | 0 (0.0%) | 3 (100.0%) |
| 3 or 4 Children | 0 (0.0%) | 0 (0.0%) |
| 5 or more Children | 0 (0.0%) | 0 (0.0%) |
| Total | 0 (0.0%) | 4 (80.0%) |
Income Below Poverty Among Married-Couple vs Single-Parent Households in Clearmont
The poverty data for Clearmont shows that 2 of the married-couple family households (4.6%) and 4 of the single-parent households (80.0%) are living below the poverty level. Within the married-couple family households, those with no children have the highest poverty rate, with 2 households (5.1%) falling below the poverty line. Among the single-parent households, those with 1 or 2 children have the highest poverty rate, with 3 household (100.0%) living below poverty.
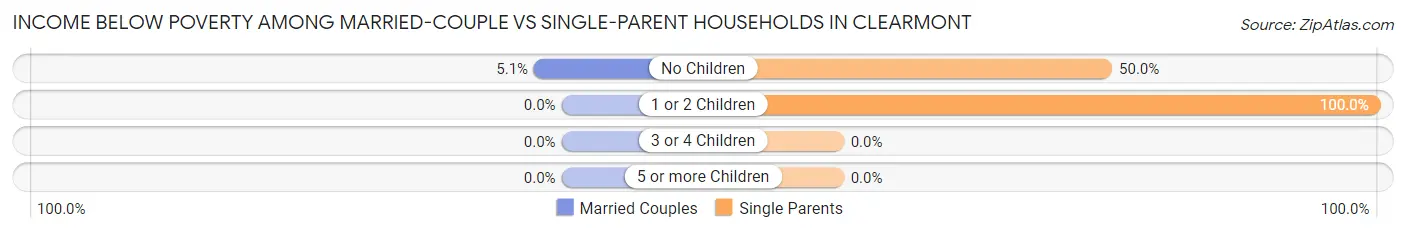
| Children | Married-Couple Families | Single-Parent Households |
| No Children | 2 (5.1%) | 1 (50.0%) |
| 1 or 2 Children | 0 (0.0%) | 3 (100.0%) |
| 3 or 4 Children | 0 (0.0%) | 0 (0.0%) |
| 5 or more Children | 0 (0.0%) | 0 (0.0%) |
| Total | 2 (4.6%) | 4 (80.0%) |
Race in Clearmont
The most populous races in Clearmont are White / Caucasian (144 | 94.7%), Two or more Races (8 | 5.3%), and Hispanic or Latino (2 | 1.3%).
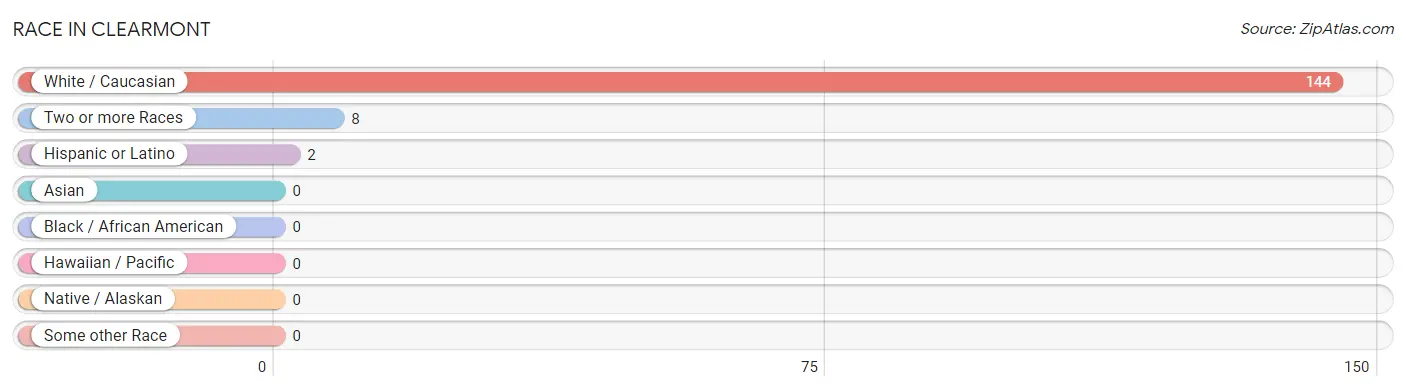
| Race | # Population | % Population |
| Asian | 0 | 0.0% |
| Black / African American | 0 | 0.0% |
| Hawaiian / Pacific | 0 | 0.0% |
| Hispanic or Latino | 2 | 1.3% |
| Native / Alaskan | 0 | 0.0% |
| White / Caucasian | 144 | 94.7% |
| Two or more Races | 8 | 5.3% |
| Some other Race | 0 | 0.0% |
| Total | 152 | 100.0% |
Ancestry in Clearmont
The most populous ancestries reported in Clearmont are German (47 | 30.9%), American (37 | 24.3%), English (19 | 12.5%), Irish (18 | 11.8%), and Czech (3 | 2.0%), together accounting for 81.6% of all Clearmont residents.
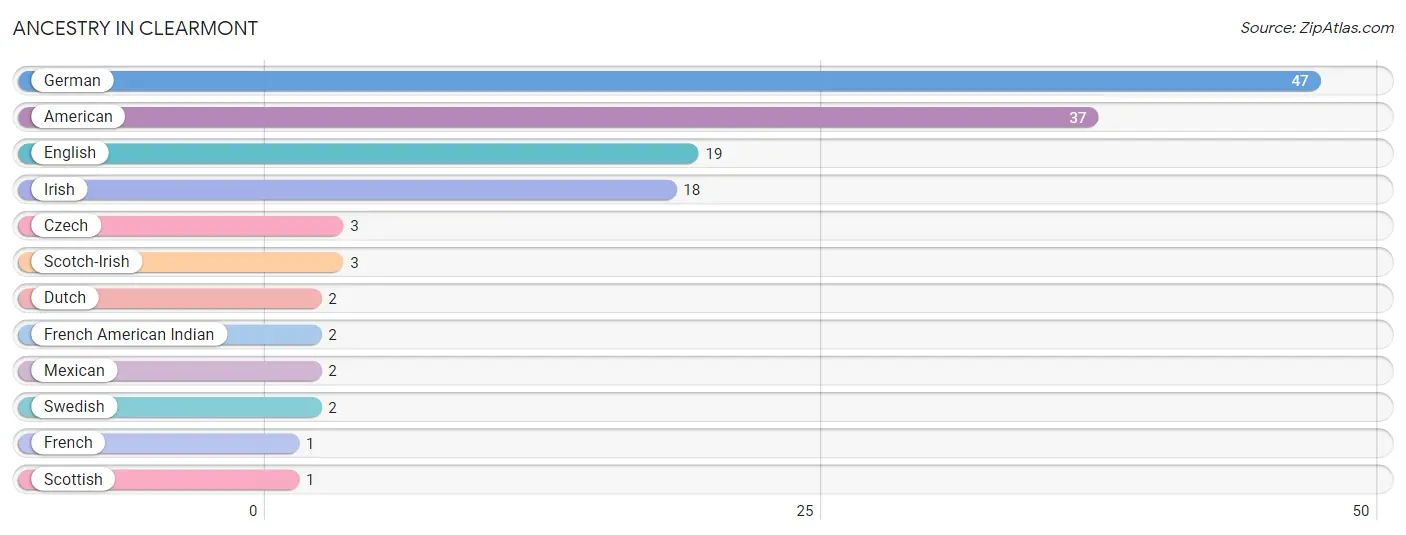
| Ancestry | # Population | % Population |
| American | 37 | 24.3% |
| Czech | 3 | 2.0% |
| Dutch | 2 | 1.3% |
| English | 19 | 12.5% |
| French | 1 | 0.7% |
| French American Indian | 2 | 1.3% |
| German | 47 | 30.9% |
| Irish | 18 | 11.8% |
| Mexican | 2 | 1.3% |
| Scotch-Irish | 3 | 2.0% |
| Scottish | 1 | 0.7% |
| Swedish | 2 | 1.3% | View All 12 Rows |
Immigrants in Clearmont
The most numerous immigrant groups reported in Clearmont came from Central America (1 | 0.7%), Latin America (1 | 0.7%), and Mexico (1 | 0.7%), together accounting for 2.0% of all Clearmont residents.
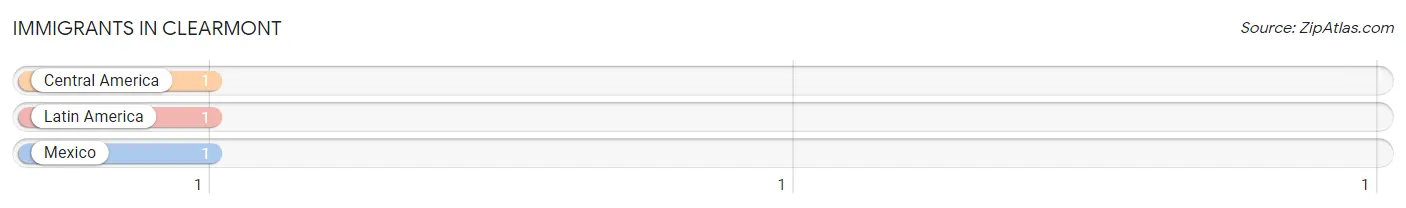
| Immigration Origin | # Population | % Population |
| Central America | 1 | 0.7% |
| Latin America | 1 | 0.7% |
| Mexico | 1 | 0.7% | View All 3 Rows |
Sex and Age in Clearmont
Sex and Age in Clearmont
The most populous age groups in Clearmont are 55 to 59 Years (14 | 16.5%) for men and 45 to 49 Years (15 | 22.4%) for women.
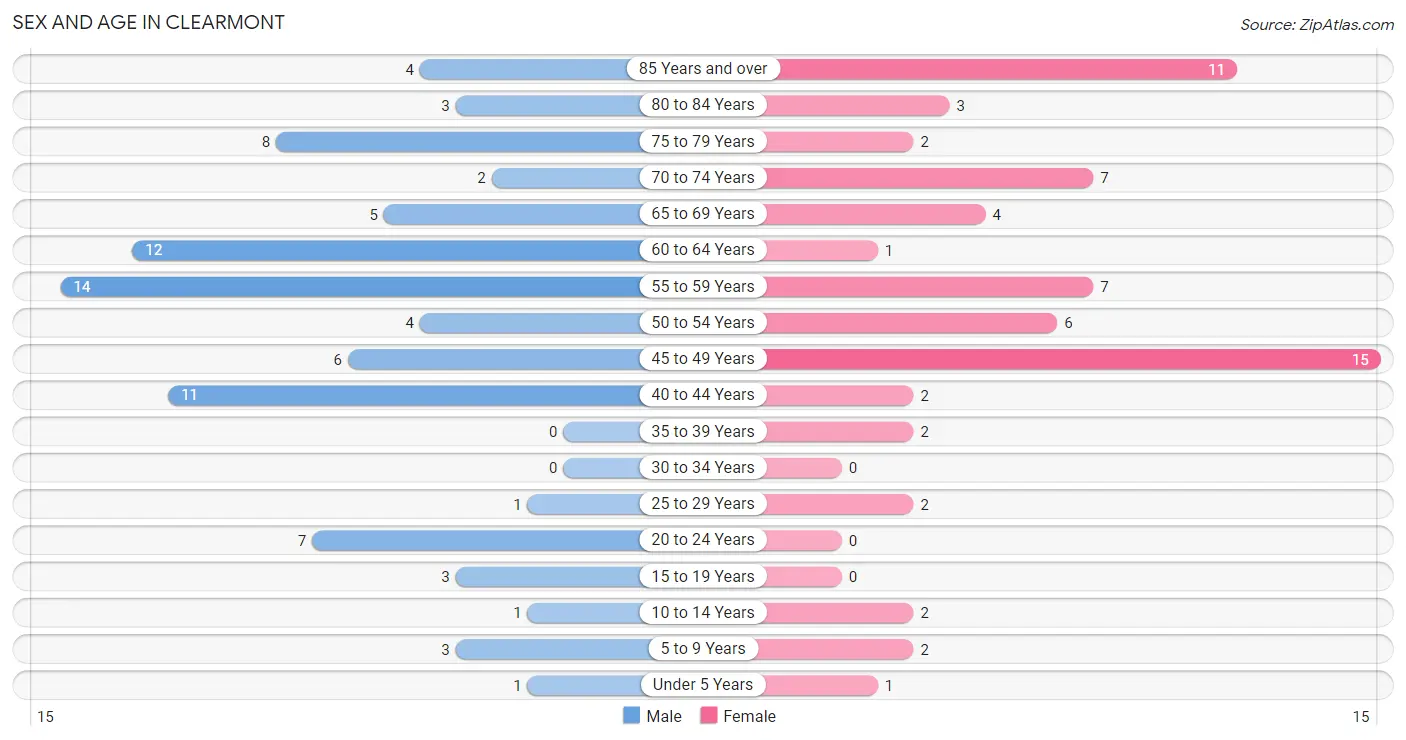
| Age Bracket | Male | Female |
| Under 5 Years | 1 (1.2%) | 1 (1.5%) |
| 5 to 9 Years | 3 (3.5%) | 2 (3.0%) |
| 10 to 14 Years | 1 (1.2%) | 2 (3.0%) |
| 15 to 19 Years | 3 (3.5%) | 0 (0.0%) |
| 20 to 24 Years | 7 (8.2%) | 0 (0.0%) |
| 25 to 29 Years | 1 (1.2%) | 2 (3.0%) |
| 30 to 34 Years | 0 (0.0%) | 0 (0.0%) |
| 35 to 39 Years | 0 (0.0%) | 2 (3.0%) |
| 40 to 44 Years | 11 (12.9%) | 2 (3.0%) |
| 45 to 49 Years | 6 (7.1%) | 15 (22.4%) |
| 50 to 54 Years | 4 (4.7%) | 6 (9.0%) |
| 55 to 59 Years | 14 (16.5%) | 7 (10.4%) |
| 60 to 64 Years | 12 (14.1%) | 1 (1.5%) |
| 65 to 69 Years | 5 (5.9%) | 4 (6.0%) |
| 70 to 74 Years | 2 (2.4%) | 7 (10.4%) |
| 75 to 79 Years | 8 (9.4%) | 2 (3.0%) |
| 80 to 84 Years | 3 (3.5%) | 3 (4.5%) |
| 85 Years and over | 4 (4.7%) | 11 (16.4%) |
| Total | 85 (100.0%) | 67 (100.0%) |
Families and Households in Clearmont
Median Family Size in Clearmont
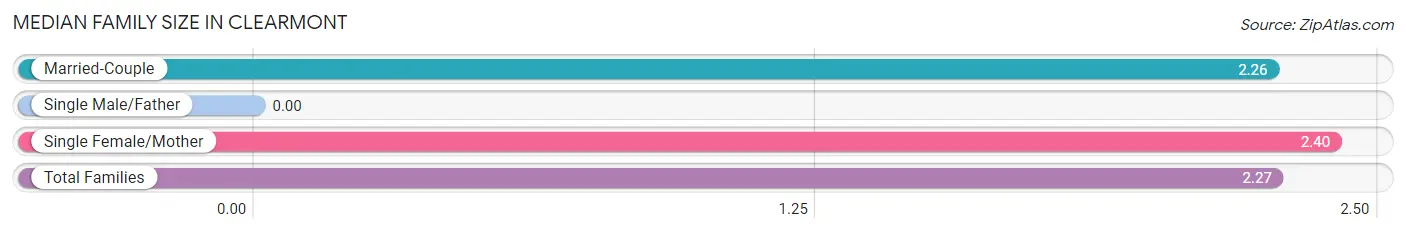
| Family Type | # Families | Family Size |
| Married-Couple | 43 (89.6%) | 2.26 |
| Single Male/Father | 0 (0.0%) | - |
| Single Female/Mother | 5 (10.4%) | 2.40 |
| Total Families | 48 (100.0%) | 2.27 |
Median Household Size in Clearmont
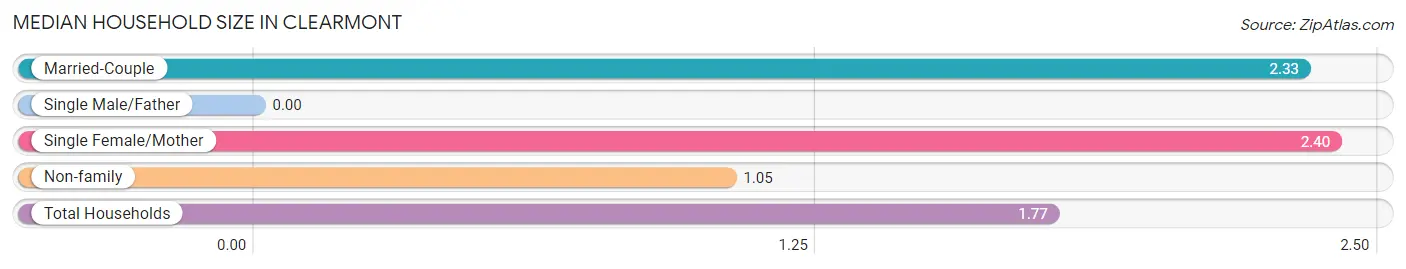
| Household Type | # Households | Household Size |
| Married-Couple | 43 (50.0%) | 2.33 |
| Single Male/Father | 0 (0.0%) | - |
| Single Female/Mother | 5 (5.8%) | 2.40 |
| Non-family | 38 (44.2%) | 1.05 |
| Total Households | 86 (100.0%) | 1.77 |
Household Size by Marriage Status in Clearmont
Out of a total of 86 households in Clearmont, 48 (55.8%) are family households, while 38 (44.2%) are nonfamily households. The most numerous type of family households are 2-person households, comprising 41, and the most common type of nonfamily households are 1-person households, comprising 37.
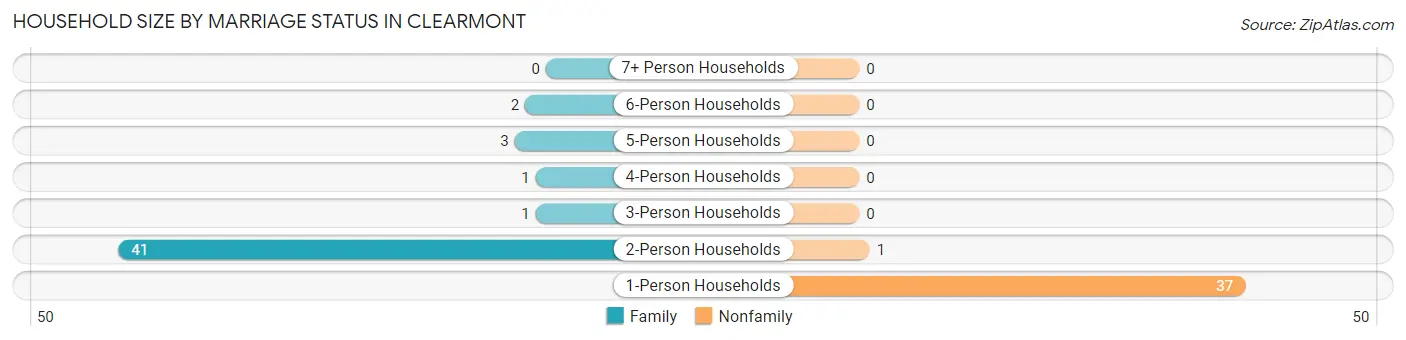
| Household Size | Family Households | Nonfamily Households |
| 1-Person Households | - | 37 (43.0%) |
| 2-Person Households | 41 (47.7%) | 1 (1.2%) |
| 3-Person Households | 1 (1.2%) | 0 (0.0%) |
| 4-Person Households | 1 (1.2%) | 0 (0.0%) |
| 5-Person Households | 3 (3.5%) | 0 (0.0%) |
| 6-Person Households | 2 (2.3%) | 0 (0.0%) |
| 7+ Person Households | 0 (0.0%) | 0 (0.0%) |
| Total | 48 (55.8%) | 38 (44.2%) |
Female Fertility in Clearmont
Fertility by Age in Clearmont
| Age Bracket | Women with Births | Births / 1,000 Women |
| 15 to 19 years | 0 (0.0%) | 0.0 |
| 20 to 34 years | 0 (0.0%) | 0.0 |
| 35 to 50 years | 0 (0.0%) | 0.0 |
| Total | 0 (0.0%) | 0.0 |
Fertility by Age by Marriage Status in Clearmont
| Age Bracket | Married | Unmarried |
| 15 to 19 years | 0 (0.0%) | 0 (0.0%) |
| 20 to 34 years | 0 (0.0%) | 0 (0.0%) |
| 35 to 50 years | 0 (0.0%) | 0 (0.0%) |
| Total | 0 (0.0%) | 0 (0.0%) |
Fertility by Education in Clearmont
| Educational Attainment | Women with Births | Births / 1,000 Women |
| Less than High School | 0 (0.0%) | 0.0 |
| High School Diploma | 0 (0.0%) | 0.0 |
| College or Associate's Degree | 0 (0.0%) | 0.0 |
| Bachelor's Degree | 0 (0.0%) | 0.0 |
| Graduate Degree | 0 (0.0%) | 0.0 |
| Total | 0 (0.0%) | 0.0 |
Fertility by Education by Marriage Status in Clearmont
| Educational Attainment | Married | Unmarried |
| Less than High School | 0 (0.0%) | 0 (0.0%) |
| High School Diploma | 0 (0.0%) | 0 (0.0%) |
| College or Associate's Degree | 0 (0.0%) | 0 (0.0%) |
| Bachelor's Degree | 0 (0.0%) | 0 (0.0%) |
| Graduate Degree | 0 (0.0%) | 0 (0.0%) |
| Total | 0 (0.0%) | 0 (0.0%) |
Employment Characteristics in Clearmont
Employment by Class of Employer in Clearmont
Among the 69 employed individuals in Clearmont, private company employees (46 | 66.7%), not-for-profit organizations (13 | 18.8%), and self-employed (not incorporated) (4 | 5.8%) make up the most common classes of employment.
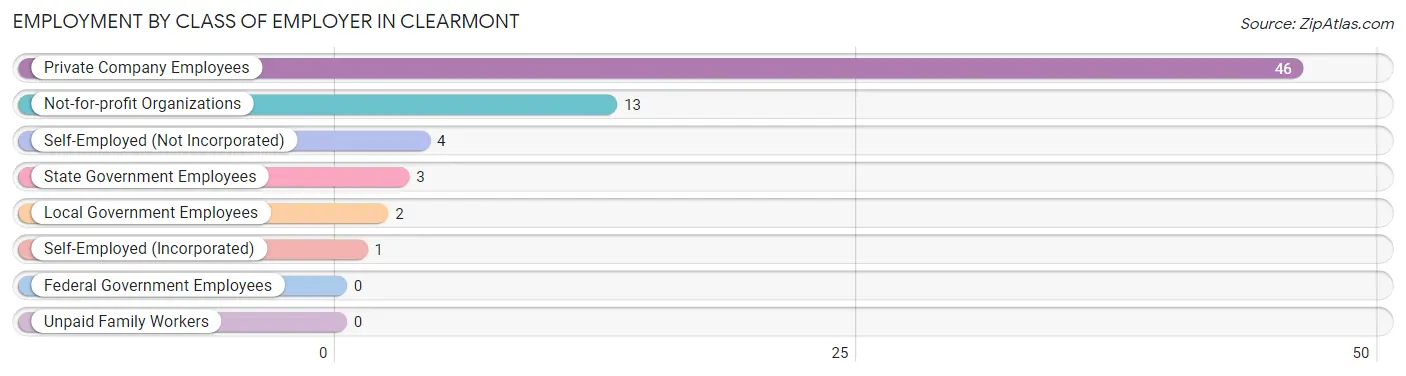
| Employer Class | # Employees | % Employees |
| Private Company Employees | 46 | 66.7% |
| Self-Employed (Incorporated) | 1 | 1.5% |
| Self-Employed (Not Incorporated) | 4 | 5.8% |
| Not-for-profit Organizations | 13 | 18.8% |
| Local Government Employees | 2 | 2.9% |
| State Government Employees | 3 | 4.3% |
| Federal Government Employees | 0 | 0.0% |
| Unpaid Family Workers | 0 | 0.0% |
| Total | 69 | 100.0% |
Employment Status by Age in Clearmont
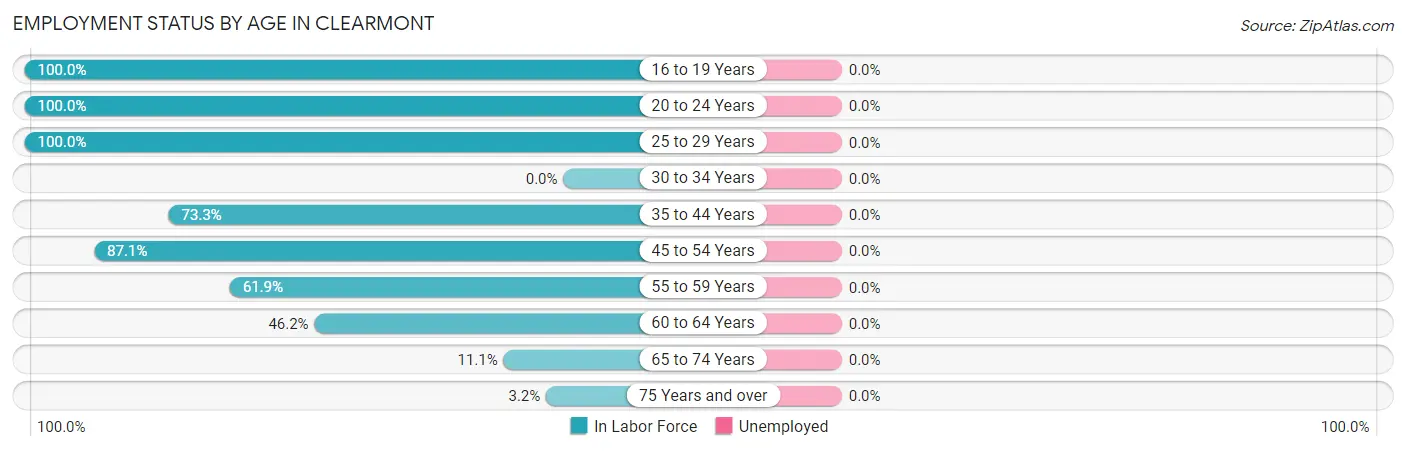
| Age Bracket | In Labor Force | Unemployed |
| 16 to 19 Years | 3 (100.0%) | 0 (0.0%) |
| 20 to 24 Years | 7 (100.0%) | 0 (0.0%) |
| 25 to 29 Years | 3 (100.0%) | 0 (0.0%) |
| 30 to 34 Years | 0 (0.0%) | 0 (0.0%) |
| 35 to 44 Years | 11 (73.3%) | 0 (0.0%) |
| 45 to 54 Years | 27 (87.1%) | 0 (0.0%) |
| 55 to 59 Years | 13 (61.9%) | 0 (0.0%) |
| 60 to 64 Years | 6 (46.2%) | 0 (0.0%) |
| 65 to 74 Years | 2 (11.1%) | 0 (0.0%) |
| 75 Years and over | 1 (3.2%) | 0 (0.0%) |
| Total | 73 (51.4%) | 0 (0.0%) |
Employment Status by Educational Attainment in Clearmont
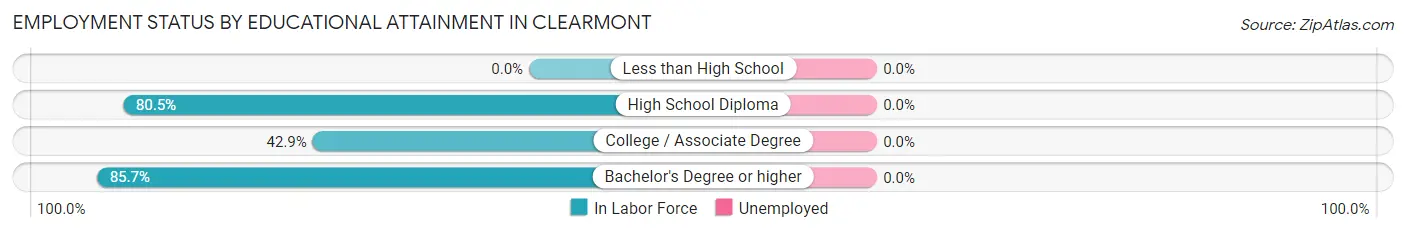
| Educational Attainment | In Labor Force | Unemployed |
| Less than High School | 0 (0.0%) | 0 (0.0%) |
| High School Diploma | 33 (80.5%) | 0 (0.0%) |
| College / Associate Degree | 9 (42.9%) | 0 (0.0%) |
| Bachelor's Degree or higher | 18 (85.7%) | 0 (0.0%) |
| Total | 60 (72.3%) | 0 (0.0%) |
Employment Occupations by Sex in Clearmont
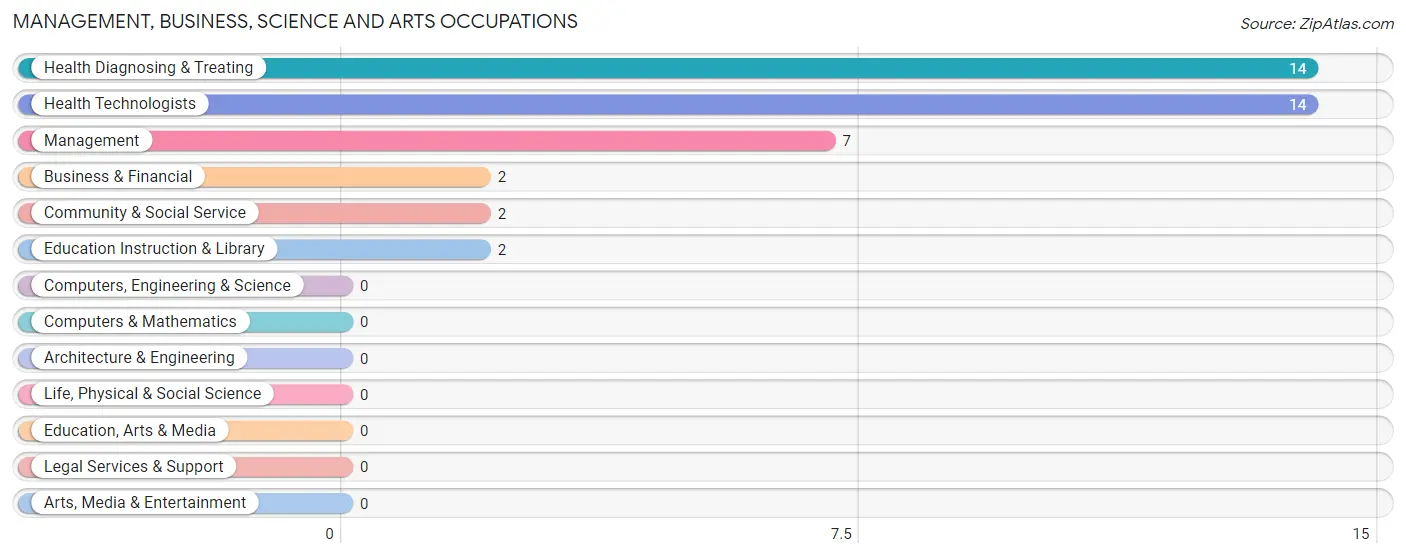
Management, Business, Science and Arts Occupations
The most common Management, Business, Science and Arts occupations in Clearmont are Health Diagnosing & Treating (14 | 19.2%), Health Technologists (14 | 19.2%), Management (7 | 9.6%), Business & Financial (2 | 2.7%), and Community & Social Service (2 | 2.7%).
Management, Business, Science and Arts Occupations by Sex
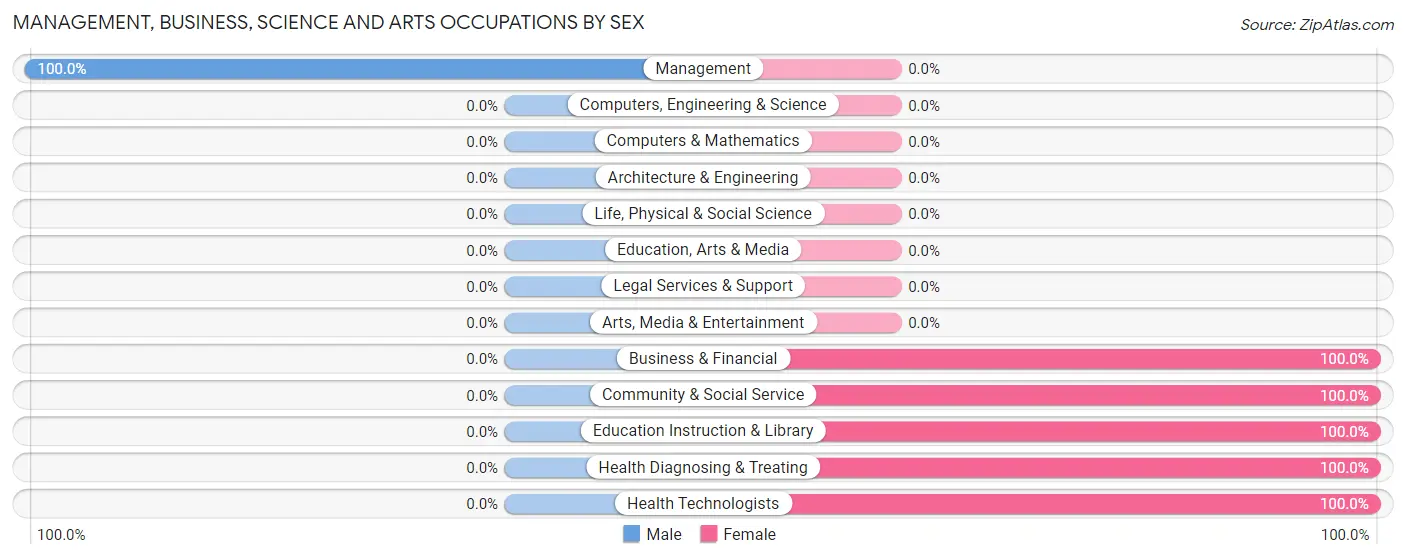
| Occupation | Male | Female |
| Management | 7 (100.0%) | 0 (0.0%) |
| Business & Financial | 0 (0.0%) | 2 (100.0%) |
| Computers, Engineering & Science | 0 (0.0%) | 0 (0.0%) |
| Computers & Mathematics | 0 (0.0%) | 0 (0.0%) |
| Architecture & Engineering | 0 (0.0%) | 0 (0.0%) |
| Life, Physical & Social Science | 0 (0.0%) | 0 (0.0%) |
| Community & Social Service | 0 (0.0%) | 2 (100.0%) |
| Education, Arts & Media | 0 (0.0%) | 0 (0.0%) |
| Legal Services & Support | 0 (0.0%) | 0 (0.0%) |
| Education Instruction & Library | 0 (0.0%) | 2 (100.0%) |
| Arts, Media & Entertainment | 0 (0.0%) | 0 (0.0%) |
| Health Diagnosing & Treating | 0 (0.0%) | 14 (100.0%) |
| Health Technologists | 0 (0.0%) | 14 (100.0%) |
| Total (Category) | 7 (28.0%) | 18 (72.0%) |
| Total (Overall) | 43 (58.9%) | 30 (41.1%) |
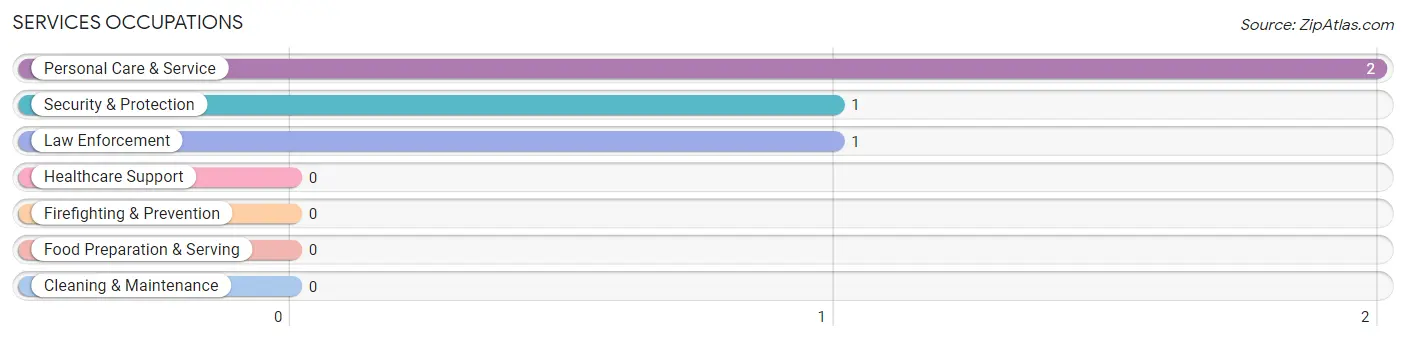
Services Occupations
The most common Services occupations in Clearmont are Personal Care & Service (2 | 2.7%), Security & Protection (1 | 1.4%), and Law Enforcement (1 | 1.4%).
Services Occupations by Sex
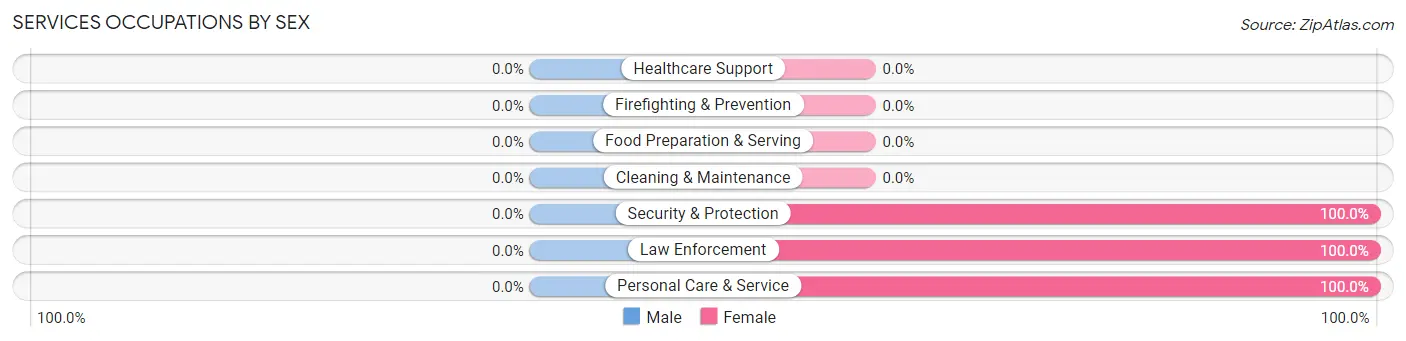
| Occupation | Male | Female |
| Healthcare Support | 0 (0.0%) | 0 (0.0%) |
| Security & Protection | 0 (0.0%) | 1 (100.0%) |
| Firefighting & Prevention | 0 (0.0%) | 0 (0.0%) |
| Law Enforcement | 0 (0.0%) | 1 (100.0%) |
| Food Preparation & Serving | 0 (0.0%) | 0 (0.0%) |
| Cleaning & Maintenance | 0 (0.0%) | 0 (0.0%) |
| Personal Care & Service | 0 (0.0%) | 2 (100.0%) |
| Total (Category) | 0 (0.0%) | 3 (100.0%) |
| Total (Overall) | 43 (58.9%) | 30 (41.1%) |
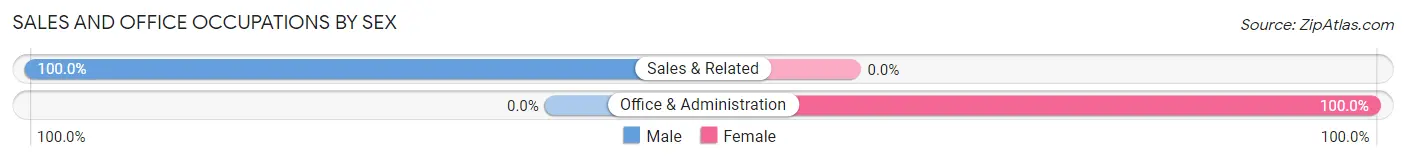
Sales and Office Occupations
The most common Sales and Office occupations in Clearmont are Office & Administration (5 | 6.9%), and Sales & Related (1 | 1.4%).
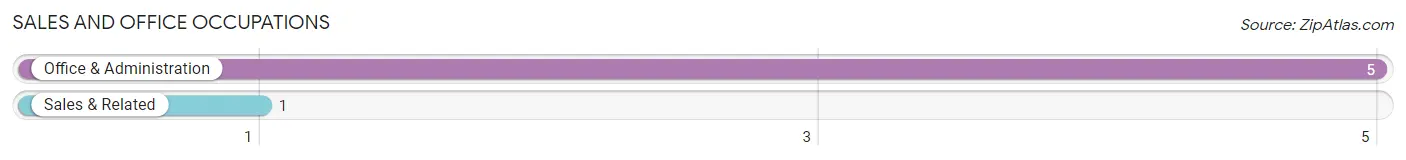
Sales and Office Occupations by Sex
| Occupation | Male | Female |
| Sales & Related | 1 (100.0%) | 0 (0.0%) |
| Office & Administration | 0 (0.0%) | 5 (100.0%) |
| Total (Category) | 1 (16.7%) | 5 (83.3%) |
| Total (Overall) | 43 (58.9%) | 30 (41.1%) |
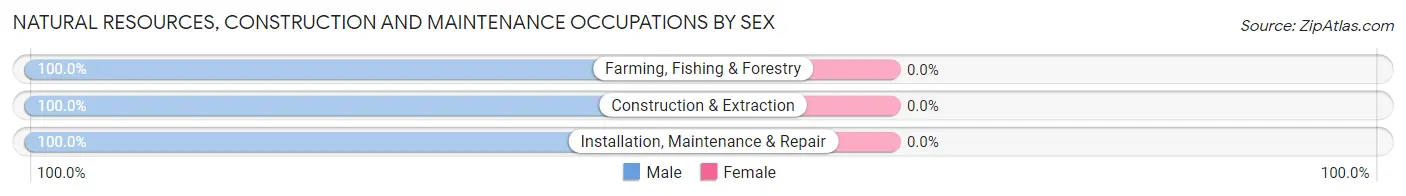
Natural Resources, Construction and Maintenance Occupations
The most common Natural Resources, Construction and Maintenance occupations in Clearmont are Installation, Maintenance & Repair (10 | 13.7%), Farming, Fishing & Forestry (3 | 4.1%), and Construction & Extraction (1 | 1.4%).
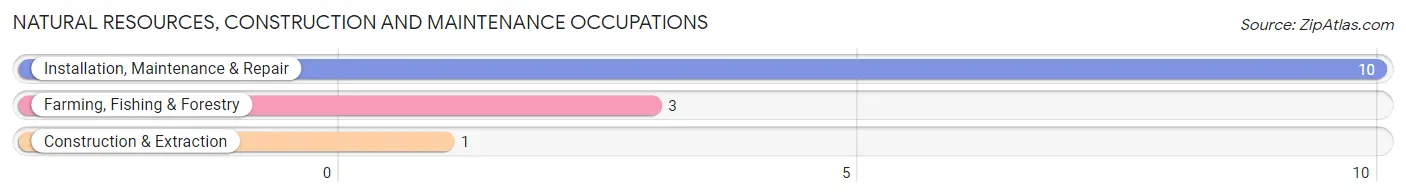
Natural Resources, Construction and Maintenance Occupations by Sex
| Occupation | Male | Female |
| Farming, Fishing & Forestry | 3 (100.0%) | 0 (0.0%) |
| Construction & Extraction | 1 (100.0%) | 0 (0.0%) |
| Installation, Maintenance & Repair | 10 (100.0%) | 0 (0.0%) |
| Total (Category) | 14 (100.0%) | 0 (0.0%) |
| Total (Overall) | 43 (58.9%) | 30 (41.1%) |
Production, Transportation and Moving Occupations
The most common Production, Transportation and Moving occupations in Clearmont are Production (9 | 12.3%), Transportation (8 | 11.0%), and Material Moving (8 | 11.0%).
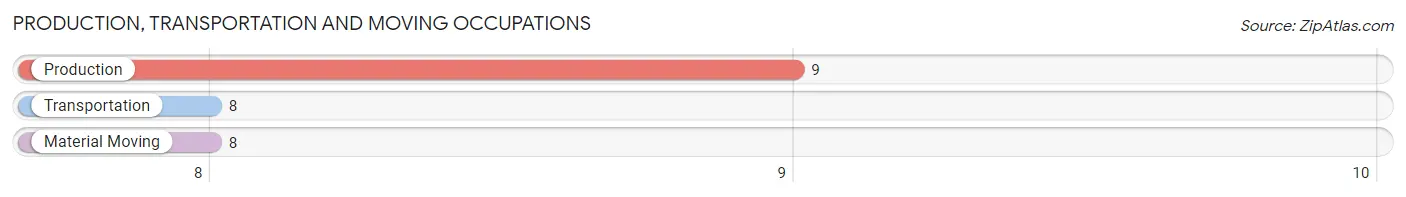
Production, Transportation and Moving Occupations by Sex
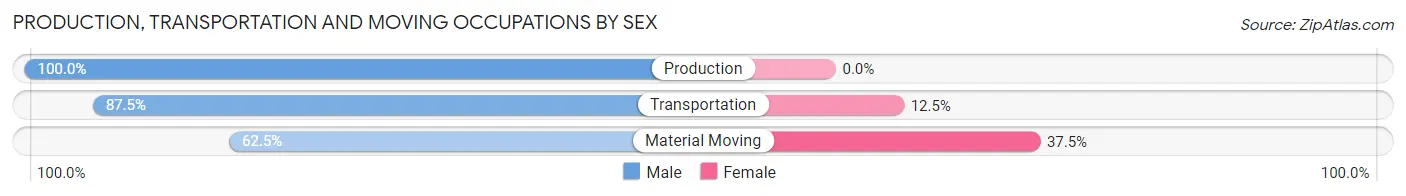
| Occupation | Male | Female |
| Production | 9 (100.0%) | 0 (0.0%) |
| Transportation | 7 (87.5%) | 1 (12.5%) |
| Material Moving | 5 (62.5%) | 3 (37.5%) |
| Total (Category) | 21 (84.0%) | 4 (16.0%) |
| Total (Overall) | 43 (58.9%) | 30 (41.1%) |
Employment Industries by Sex in Clearmont
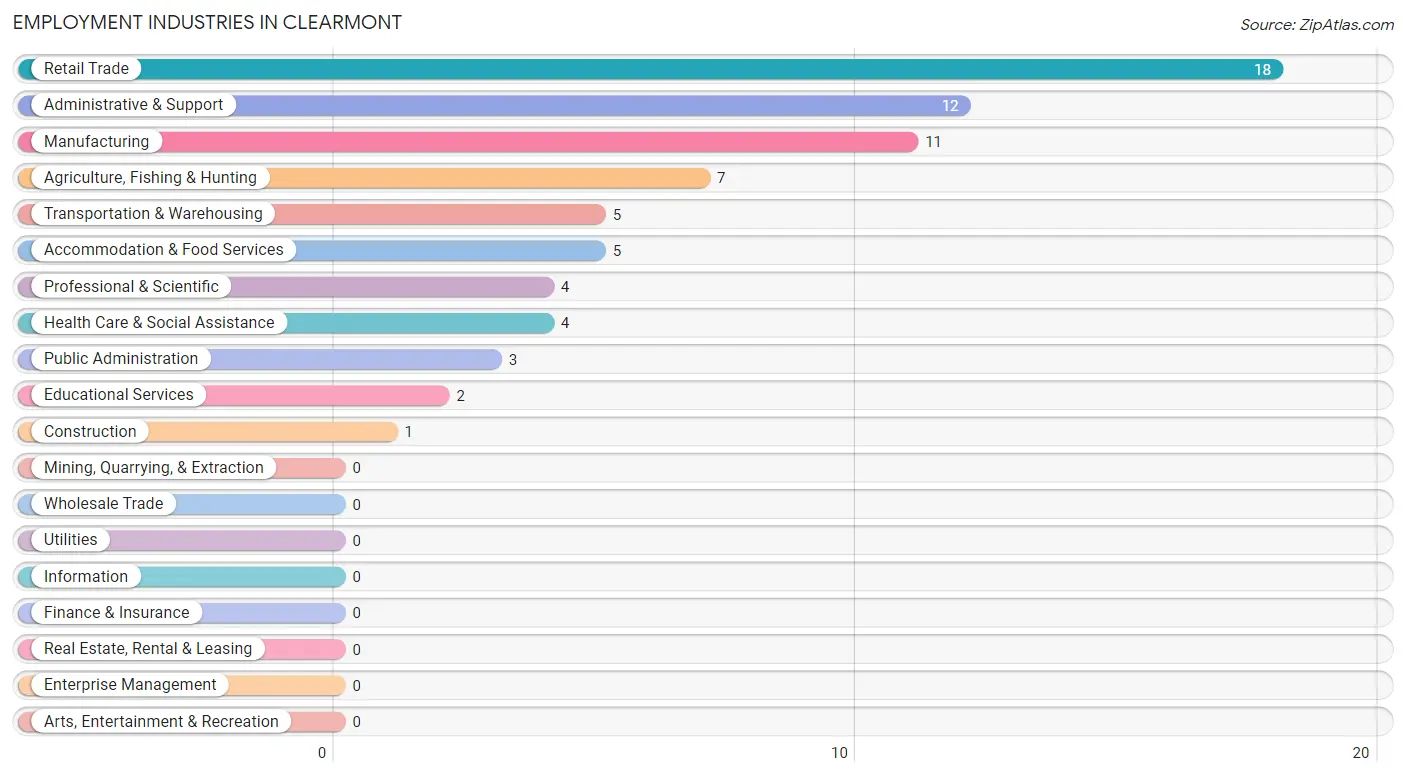
Employment Industries in Clearmont
The major employment industries in Clearmont include Retail Trade (18 | 24.7%), Administrative & Support (12 | 16.4%), Manufacturing (11 | 15.1%), Agriculture, Fishing & Hunting (7 | 9.6%), and Transportation & Warehousing (5 | 6.9%).
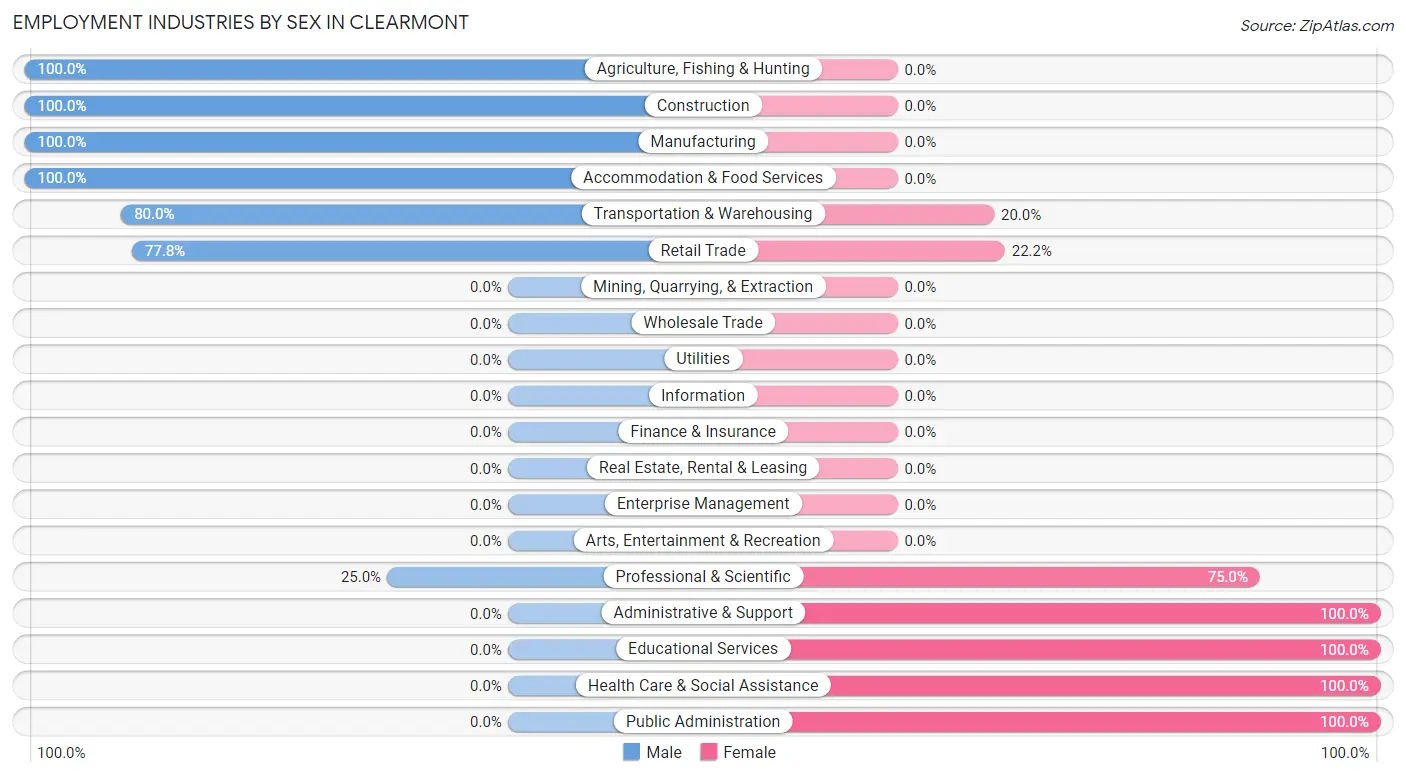
Employment Industries by Sex in Clearmont
The Clearmont industries that see more men than women are Agriculture, Fishing & Hunting (100.0%), Construction (100.0%), and Manufacturing (100.0%), whereas the industries that tend to have a higher number of women are Administrative & Support (100.0%), Educational Services (100.0%), and Health Care & Social Assistance (100.0%).
| Industry | Male | Female |
| Agriculture, Fishing & Hunting | 7 (100.0%) | 0 (0.0%) |
| Mining, Quarrying, & Extraction | 0 (0.0%) | 0 (0.0%) |
| Construction | 1 (100.0%) | 0 (0.0%) |
| Manufacturing | 11 (100.0%) | 0 (0.0%) |
| Wholesale Trade | 0 (0.0%) | 0 (0.0%) |
| Retail Trade | 14 (77.8%) | 4 (22.2%) |
| Transportation & Warehousing | 4 (80.0%) | 1 (20.0%) |
| Utilities | 0 (0.0%) | 0 (0.0%) |
| Information | 0 (0.0%) | 0 (0.0%) |
| Finance & Insurance | 0 (0.0%) | 0 (0.0%) |
| Real Estate, Rental & Leasing | 0 (0.0%) | 0 (0.0%) |
| Professional & Scientific | 1 (25.0%) | 3 (75.0%) |
| Enterprise Management | 0 (0.0%) | 0 (0.0%) |
| Administrative & Support | 0 (0.0%) | 12 (100.0%) |
| Educational Services | 0 (0.0%) | 2 (100.0%) |
| Health Care & Social Assistance | 0 (0.0%) | 4 (100.0%) |
| Arts, Entertainment & Recreation | 0 (0.0%) | 0 (0.0%) |
| Accommodation & Food Services | 5 (100.0%) | 0 (0.0%) |
| Public Administration | 0 (0.0%) | 3 (100.0%) |
| Total | 43 (58.9%) | 30 (41.1%) |
Education in Clearmont
School Enrollment in Clearmont
The most common levels of schooling among the 28 students in Clearmont are graduate / professional (14 | 50.0%), college / undergraduate (7 | 25.0%), and kindergarten (4 | 14.3%).
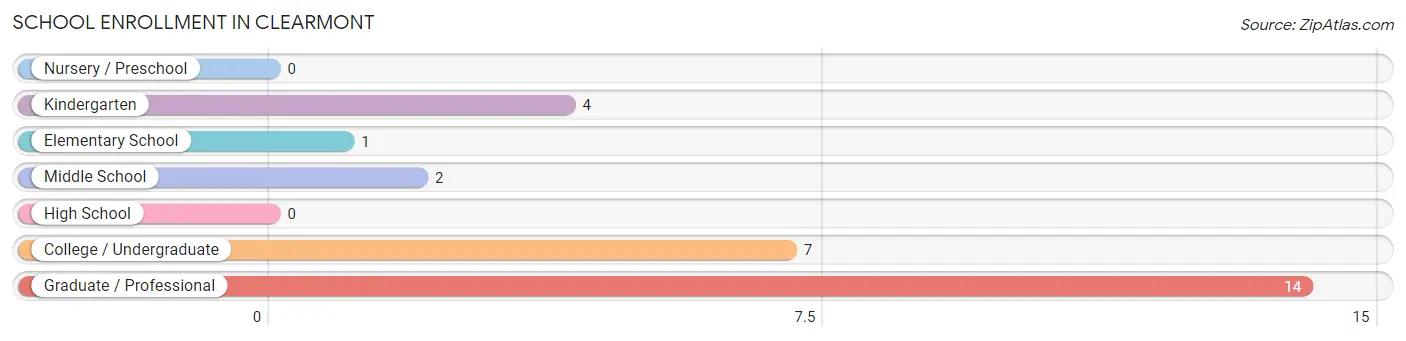
| School Level | # Students | % Students |
| Nursery / Preschool | 0 | 0.0% |
| Kindergarten | 4 | 14.3% |
| Elementary School | 1 | 3.6% |
| Middle School | 2 | 7.1% |
| High School | 0 | 0.0% |
| College / Undergraduate | 7 | 25.0% |
| Graduate / Professional | 14 | 50.0% |
| Total | 28 | 100.0% |
School Enrollment by Age by Funding Source in Clearmont
Out of a total of 28 students who are enrolled in schools in Clearmont, 14 (50.0%) attend a private institution, while the remaining 14 (50.0%) are enrolled in public schools. The age group of 35 years and over has the highest likelihood of being enrolled in private schools, with 13 (65.0% in the age bracket) enrolled. Conversely, the age group of 5 to 9 year old has the lowest likelihood of being enrolled in a private school, with 5 (100.0% in the age bracket) attending a public institution.
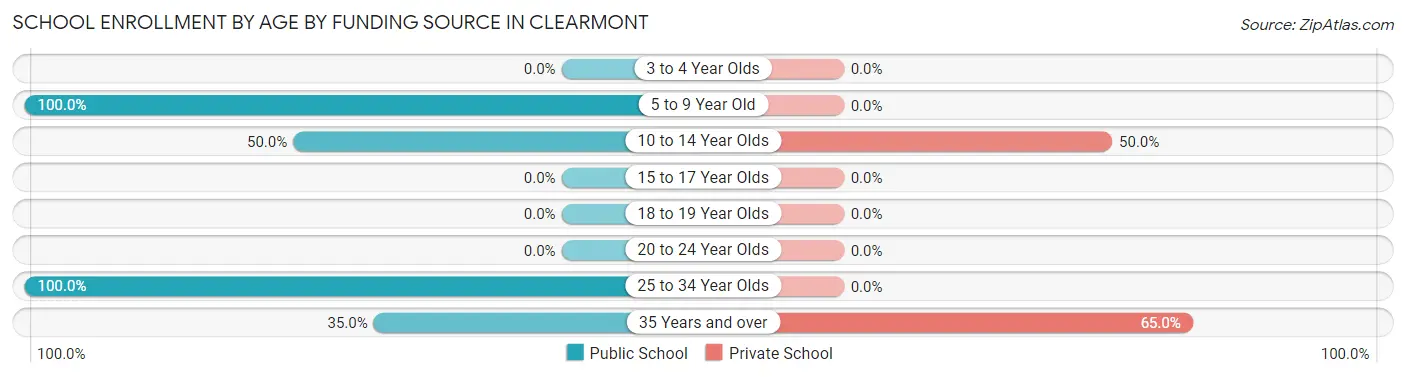
| Age Bracket | Public School | Private School |
| 3 to 4 Year Olds | 0 (0.0%) | 0 (0.0%) |
| 5 to 9 Year Old | 5 (100.0%) | 0 (0.0%) |
| 10 to 14 Year Olds | 1 (50.0%) | 1 (50.0%) |
| 15 to 17 Year Olds | 0 (0.0%) | 0 (0.0%) |
| 18 to 19 Year Olds | 0 (0.0%) | 0 (0.0%) |
| 20 to 24 Year Olds | 0 (0.0%) | 0 (0.0%) |
| 25 to 34 Year Olds | 1 (100.0%) | 0 (0.0%) |
| 35 Years and over | 7 (35.0%) | 13 (65.0%) |
| Total | 14 (50.0%) | 14 (50.0%) |
Educational Attainment by Field of Study in Clearmont
Science & technology (14 | 48.3%), education (6 | 20.7%), business (4 | 13.8%), social sciences (2 | 6.9%), and liberal arts & history (1 | 3.5%) are the most common fields of study among 29 individuals in Clearmont who have obtained a bachelor's degree or higher.
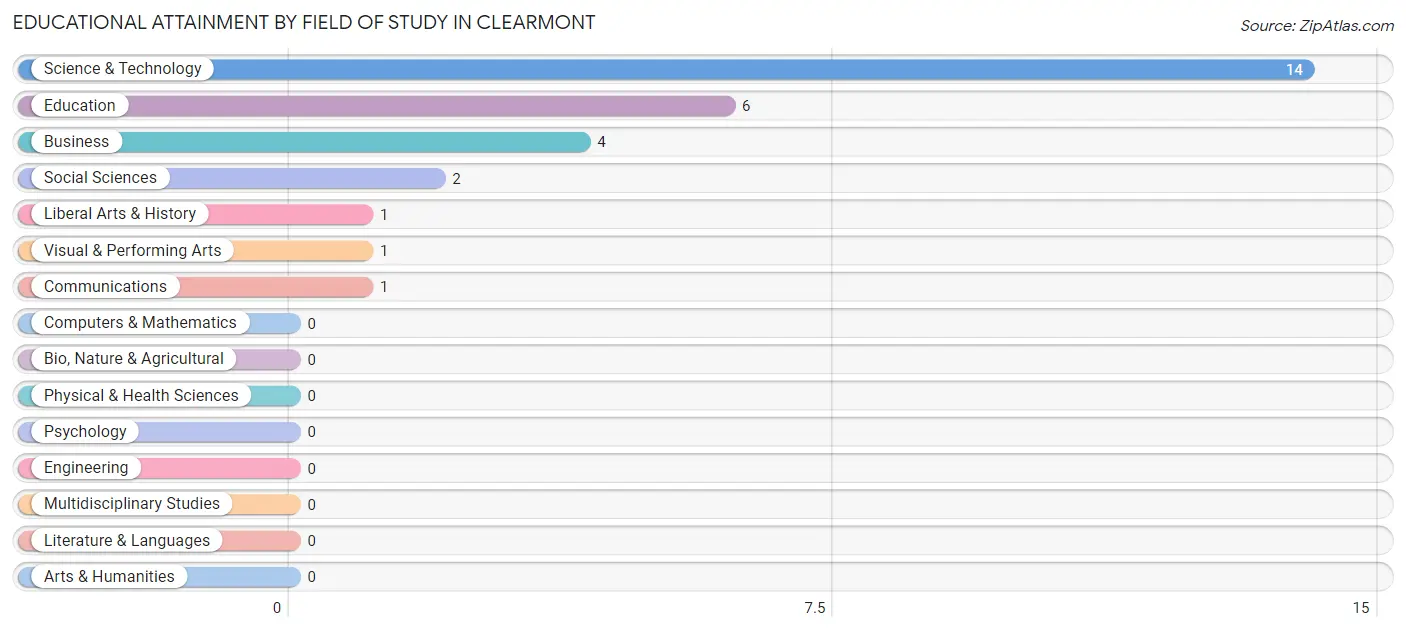
| Field of Study | # Graduates | % Graduates |
| Computers & Mathematics | 0 | 0.0% |
| Bio, Nature & Agricultural | 0 | 0.0% |
| Physical & Health Sciences | 0 | 0.0% |
| Psychology | 0 | 0.0% |
| Social Sciences | 2 | 6.9% |
| Engineering | 0 | 0.0% |
| Multidisciplinary Studies | 0 | 0.0% |
| Science & Technology | 14 | 48.3% |
| Business | 4 | 13.8% |
| Education | 6 | 20.7% |
| Literature & Languages | 0 | 0.0% |
| Liberal Arts & History | 1 | 3.5% |
| Visual & Performing Arts | 1 | 3.5% |
| Communications | 1 | 3.5% |
| Arts & Humanities | 0 | 0.0% |
| Total | 29 | 100.0% |
Transportation & Commute in Clearmont
Vehicle Availability by Sex in Clearmont
The most prevalent vehicle ownership categories in Clearmont are males with 2 vehicles (15, accounting for 37.5%) and females with 2 vehicles (11, making up 51.7%).
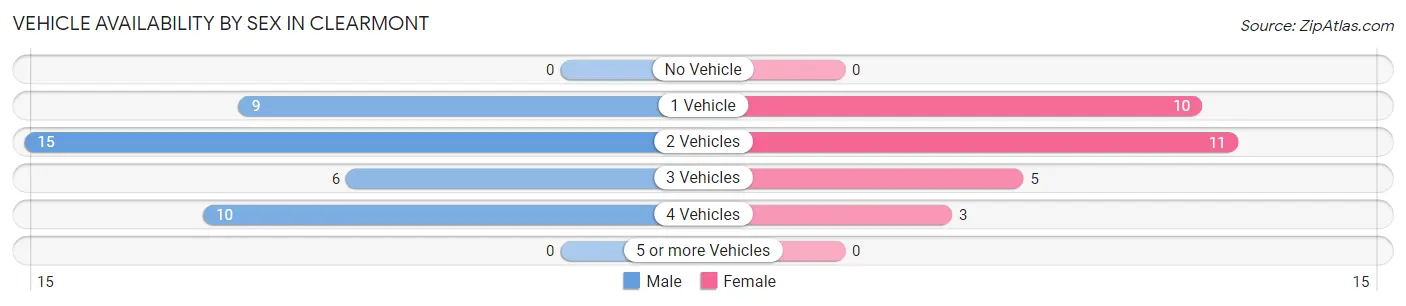
| Vehicles Available | Male | Female |
| No Vehicle | 0 (0.0%) | 0 (0.0%) |
| 1 Vehicle | 9 (22.5%) | 10 (34.5%) |
| 2 Vehicles | 15 (37.5%) | 11 (37.9%) |
| 3 Vehicles | 6 (15.0%) | 5 (17.2%) |
| 4 Vehicles | 10 (25.0%) | 3 (10.3%) |
| 5 or more Vehicles | 0 (0.0%) | 0 (0.0%) |
| Total | 40 (100.0%) | 29 (100.0%) |
Commute Time in Clearmont
The most frequently occuring commute durations in Clearmont are 10 to 14 minutes (15 commuters, 23.1%), 20 to 24 minutes (15 commuters, 23.1%), and 60 to 89 minutes (15 commuters, 23.1%).
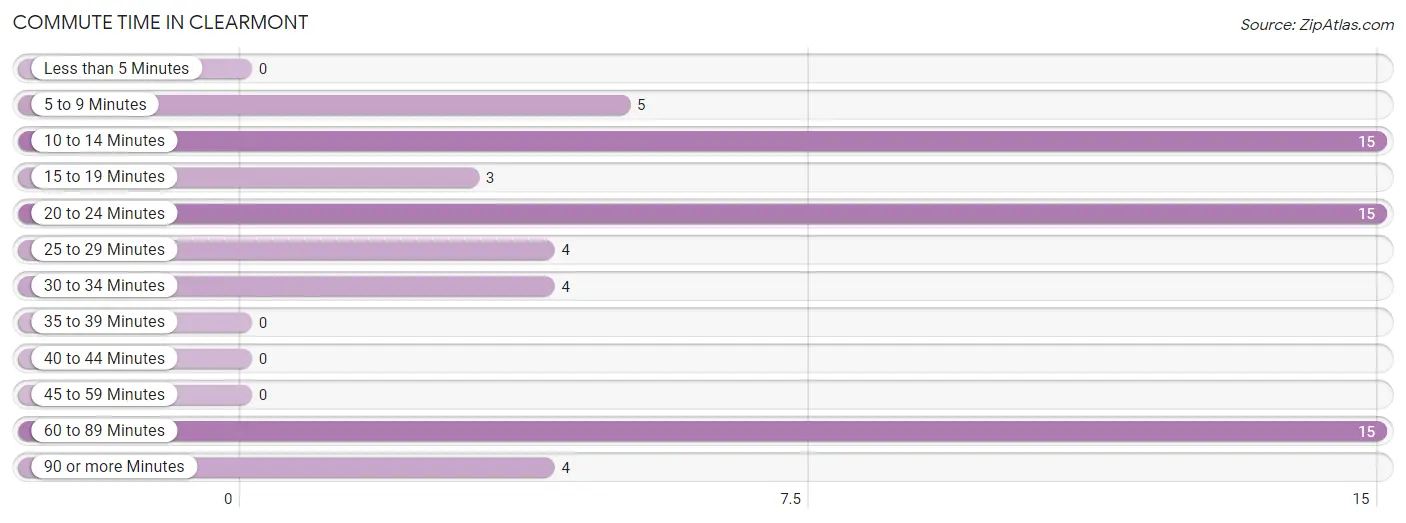
| Commute Time | # Commuters | % Commuters |
| Less than 5 Minutes | 0 | 0.0% |
| 5 to 9 Minutes | 5 | 7.7% |
| 10 to 14 Minutes | 15 | 23.1% |
| 15 to 19 Minutes | 3 | 4.6% |
| 20 to 24 Minutes | 15 | 23.1% |
| 25 to 29 Minutes | 4 | 6.1% |
| 30 to 34 Minutes | 4 | 6.1% |
| 35 to 39 Minutes | 0 | 0.0% |
| 40 to 44 Minutes | 0 | 0.0% |
| 45 to 59 Minutes | 0 | 0.0% |
| 60 to 89 Minutes | 15 | 23.1% |
| 90 or more Minutes | 4 | 6.1% |
Commute Time by Sex in Clearmont
The most common commute times in Clearmont are 10 to 14 minutes (15 commuters, 39.5%) for males and 60 to 89 minutes (14 commuters, 51.8%) for females.
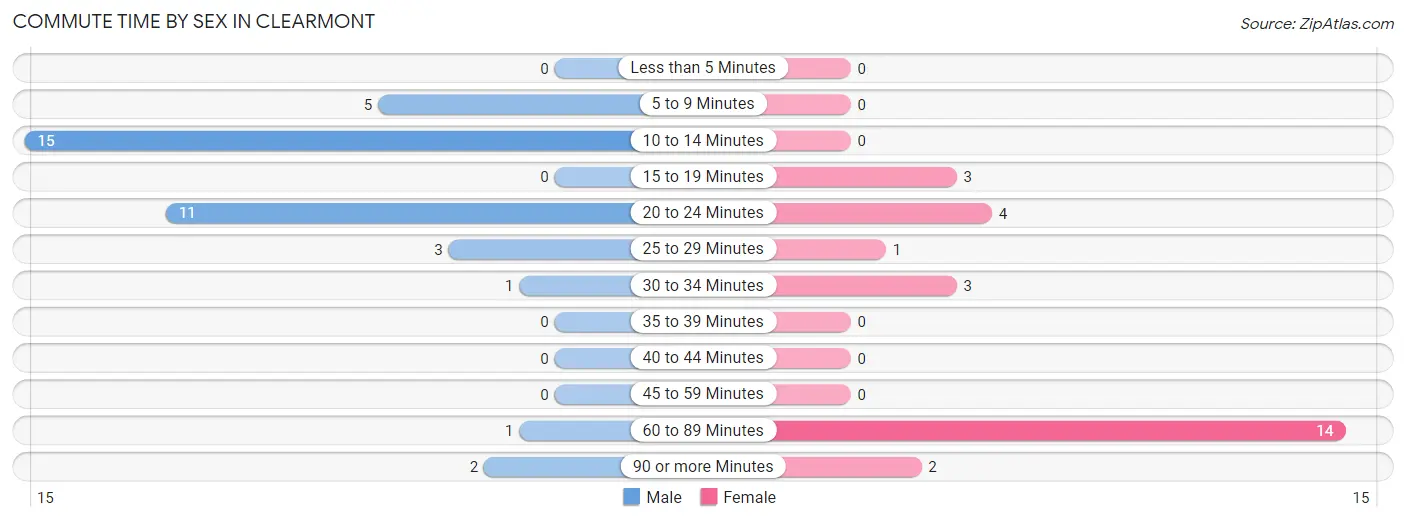
| Commute Time | Male | Female |
| Less than 5 Minutes | 0 (0.0%) | 0 (0.0%) |
| 5 to 9 Minutes | 5 (13.2%) | 0 (0.0%) |
| 10 to 14 Minutes | 15 (39.5%) | 0 (0.0%) |
| 15 to 19 Minutes | 0 (0.0%) | 3 (11.1%) |
| 20 to 24 Minutes | 11 (28.9%) | 4 (14.8%) |
| 25 to 29 Minutes | 3 (7.9%) | 1 (3.7%) |
| 30 to 34 Minutes | 1 (2.6%) | 3 (11.1%) |
| 35 to 39 Minutes | 0 (0.0%) | 0 (0.0%) |
| 40 to 44 Minutes | 0 (0.0%) | 0 (0.0%) |
| 45 to 59 Minutes | 0 (0.0%) | 0 (0.0%) |
| 60 to 89 Minutes | 1 (2.6%) | 14 (51.8%) |
| 90 or more Minutes | 2 (5.3%) | 2 (7.4%) |
Time of Departure to Work by Sex in Clearmont
The most frequent times of departure to work in Clearmont are 7:30 AM to 7:59 AM (11, 28.9%) for males and 12:00 PM to 3:59 PM (12, 44.4%) for females.
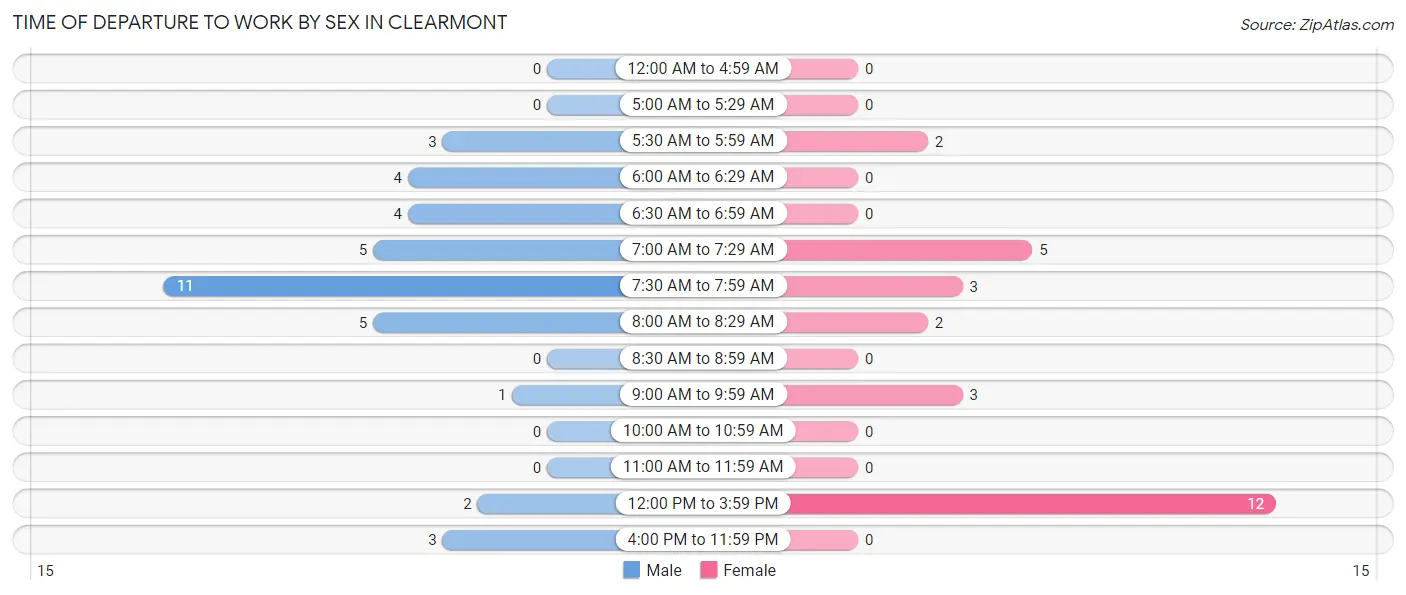
| Time of Departure | Male | Female |
| 12:00 AM to 4:59 AM | 0 (0.0%) | 0 (0.0%) |
| 5:00 AM to 5:29 AM | 0 (0.0%) | 0 (0.0%) |
| 5:30 AM to 5:59 AM | 3 (7.9%) | 2 (7.4%) |
| 6:00 AM to 6:29 AM | 4 (10.5%) | 0 (0.0%) |
| 6:30 AM to 6:59 AM | 4 (10.5%) | 0 (0.0%) |
| 7:00 AM to 7:29 AM | 5 (13.2%) | 5 (18.5%) |
| 7:30 AM to 7:59 AM | 11 (28.9%) | 3 (11.1%) |
| 8:00 AM to 8:29 AM | 5 (13.2%) | 2 (7.4%) |
| 8:30 AM to 8:59 AM | 0 (0.0%) | 0 (0.0%) |
| 9:00 AM to 9:59 AM | 1 (2.6%) | 3 (11.1%) |
| 10:00 AM to 10:59 AM | 0 (0.0%) | 0 (0.0%) |
| 11:00 AM to 11:59 AM | 0 (0.0%) | 0 (0.0%) |
| 12:00 PM to 3:59 PM | 2 (5.3%) | 12 (44.4%) |
| 4:00 PM to 11:59 PM | 3 (7.9%) | 0 (0.0%) |
| Total | 38 (100.0%) | 27 (100.0%) |
Housing Occupancy in Clearmont
Occupancy by Ownership in Clearmont
Of the total 86 dwellings in Clearmont, owner-occupied units account for 59 (68.6%), while renter-occupied units make up 27 (31.4%).
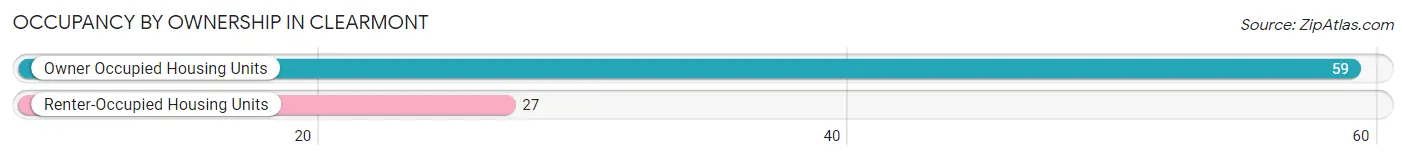
| Occupancy | # Housing Units | % Housing Units |
| Owner Occupied Housing Units | 59 | 68.6% |
| Renter-Occupied Housing Units | 27 | 31.4% |
| Total Occupied Housing Units | 86 | 100.0% |
Occupancy by Household Size in Clearmont
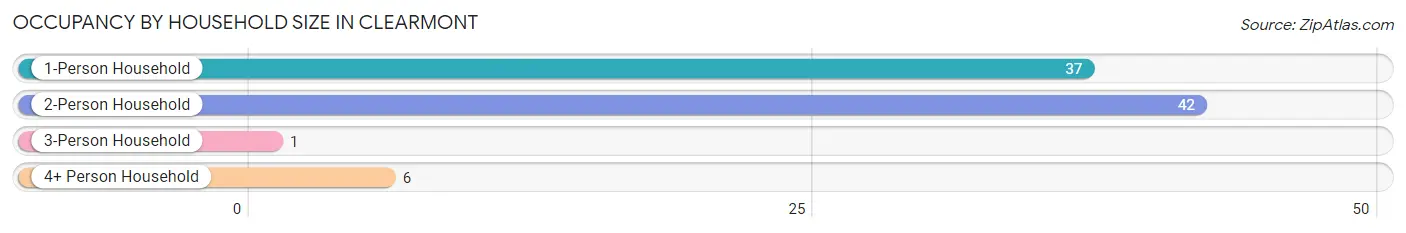
| Household Size | # Housing Units | % Housing Units |
| 1-Person Household | 37 | 43.0% |
| 2-Person Household | 42 | 48.8% |
| 3-Person Household | 1 | 1.2% |
| 4+ Person Household | 6 | 7.0% |
| Total Housing Units | 86 | 100.0% |
Occupancy by Ownership by Household Size in Clearmont
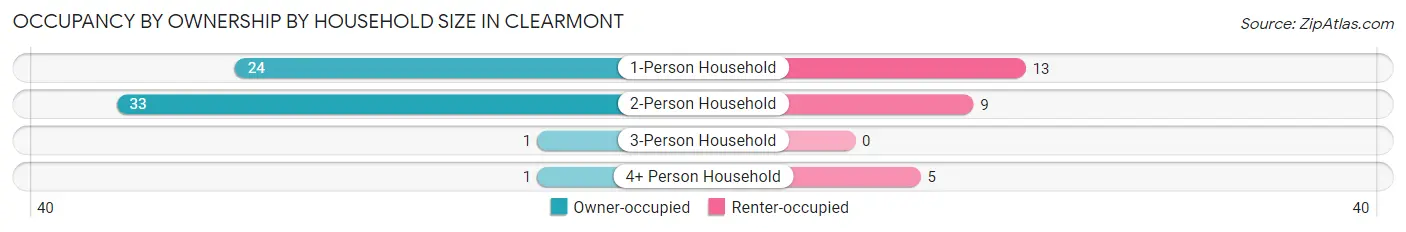
| Household Size | Owner-occupied | Renter-occupied |
| 1-Person Household | 24 (64.9%) | 13 (35.1%) |
| 2-Person Household | 33 (78.6%) | 9 (21.4%) |
| 3-Person Household | 1 (100.0%) | 0 (0.0%) |
| 4+ Person Household | 1 (16.7%) | 5 (83.3%) |
| Total Housing Units | 59 (68.6%) | 27 (31.4%) |
Occupancy by Educational Attainment in Clearmont
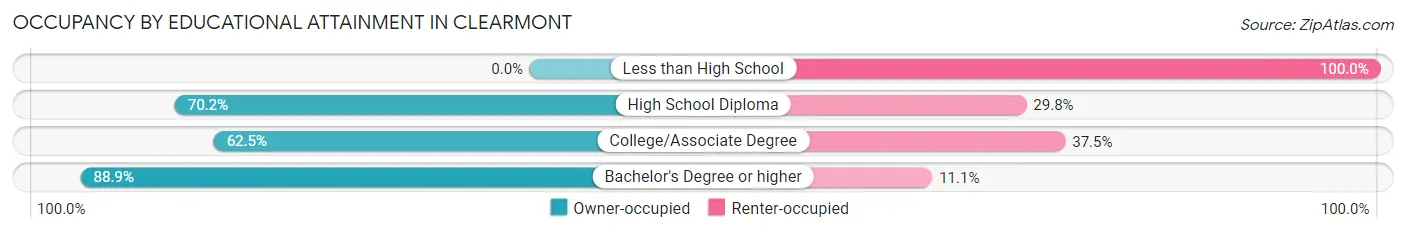
| Household Size | Owner-occupied | Renter-occupied |
| Less than High School | 0 (0.0%) | 5 (100.0%) |
| High School Diploma | 33 (70.2%) | 14 (29.8%) |
| College/Associate Degree | 10 (62.5%) | 6 (37.5%) |
| Bachelor's Degree or higher | 16 (88.9%) | 2 (11.1%) |
Occupancy by Age of Householder in Clearmont
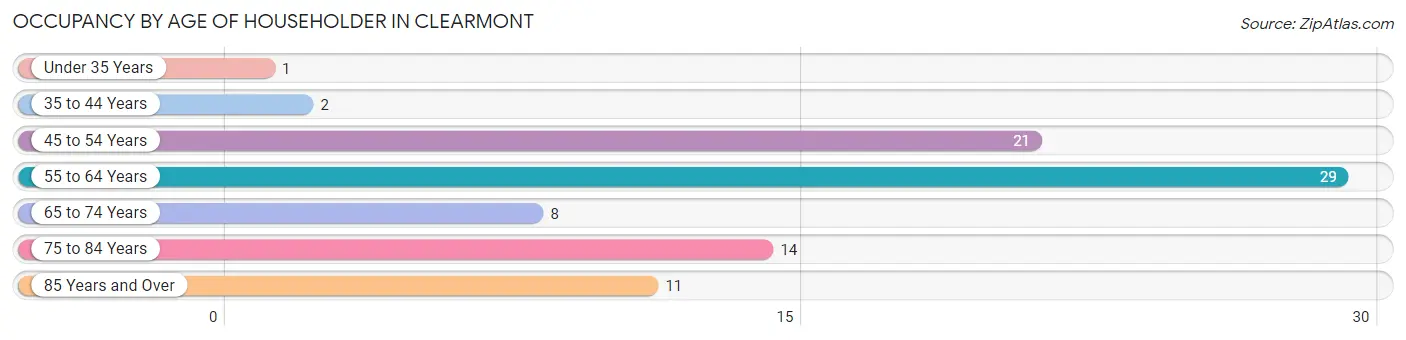
| Age Bracket | # Households | % Households |
| Under 35 Years | 1 | 1.2% |
| 35 to 44 Years | 2 | 2.3% |
| 45 to 54 Years | 21 | 24.4% |
| 55 to 64 Years | 29 | 33.7% |
| 65 to 74 Years | 8 | 9.3% |
| 75 to 84 Years | 14 | 16.3% |
| 85 Years and Over | 11 | 12.8% |
| Total | 86 | 100.0% |
Housing Finances in Clearmont
Median Income by Occupancy in Clearmont
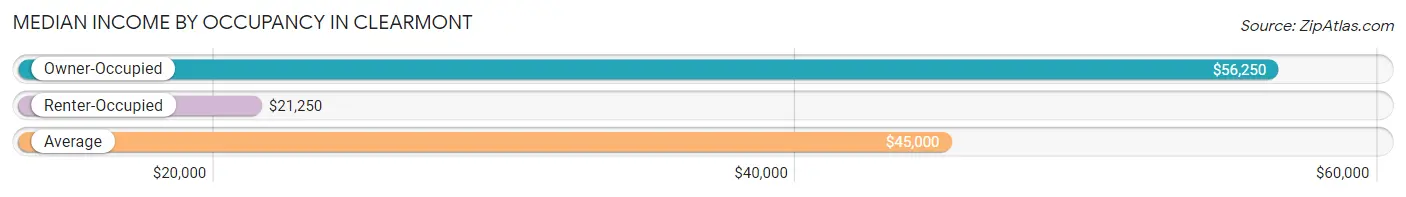
| Occupancy Type | # Households | Median Income |
| Owner-Occupied | 59 (68.6%) | $56,250 |
| Renter-Occupied | 27 (31.4%) | $21,250 |
| Average | 86 (100.0%) | $45,000 |
Occupancy by Householder Income Bracket in Clearmont
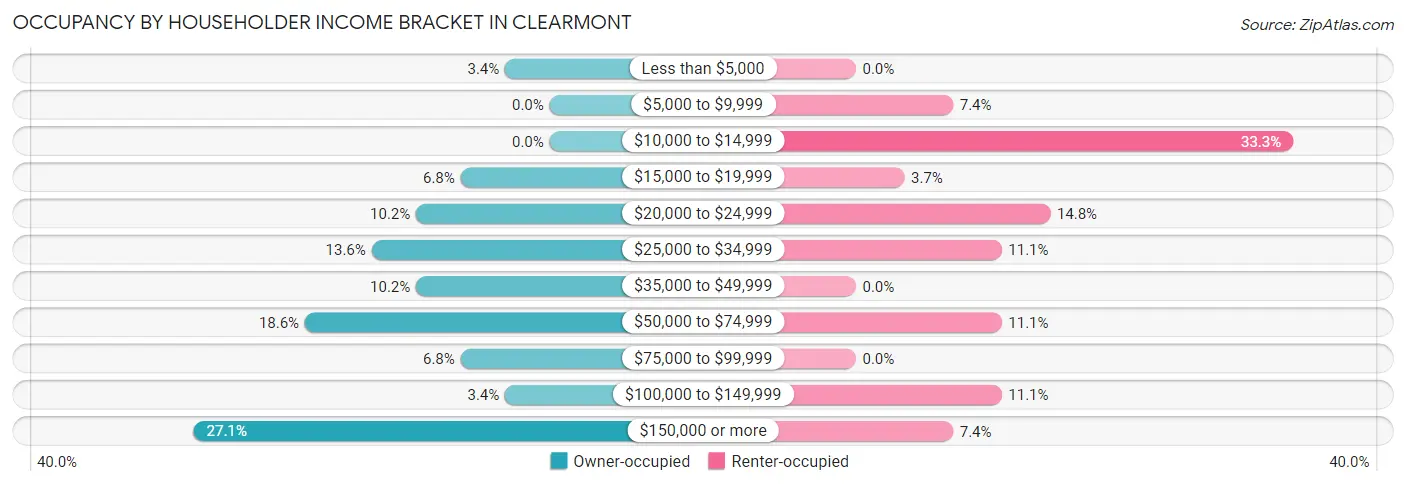
| Income Bracket | Owner-occupied | Renter-occupied |
| Less than $5,000 | 2 (3.4%) | 0 (0.0%) |
| $5,000 to $9,999 | 0 (0.0%) | 2 (7.4%) |
| $10,000 to $14,999 | 0 (0.0%) | 9 (33.3%) |
| $15,000 to $19,999 | 4 (6.8%) | 1 (3.7%) |
| $20,000 to $24,999 | 6 (10.2%) | 4 (14.8%) |
| $25,000 to $34,999 | 8 (13.6%) | 3 (11.1%) |
| $35,000 to $49,999 | 6 (10.2%) | 0 (0.0%) |
| $50,000 to $74,999 | 11 (18.6%) | 3 (11.1%) |
| $75,000 to $99,999 | 4 (6.8%) | 0 (0.0%) |
| $100,000 to $149,999 | 2 (3.4%) | 3 (11.1%) |
| $150,000 or more | 16 (27.1%) | 2 (7.4%) |
| Total | 59 (100.0%) | 27 (100.0%) |
Monthly Housing Cost Tiers in Clearmont
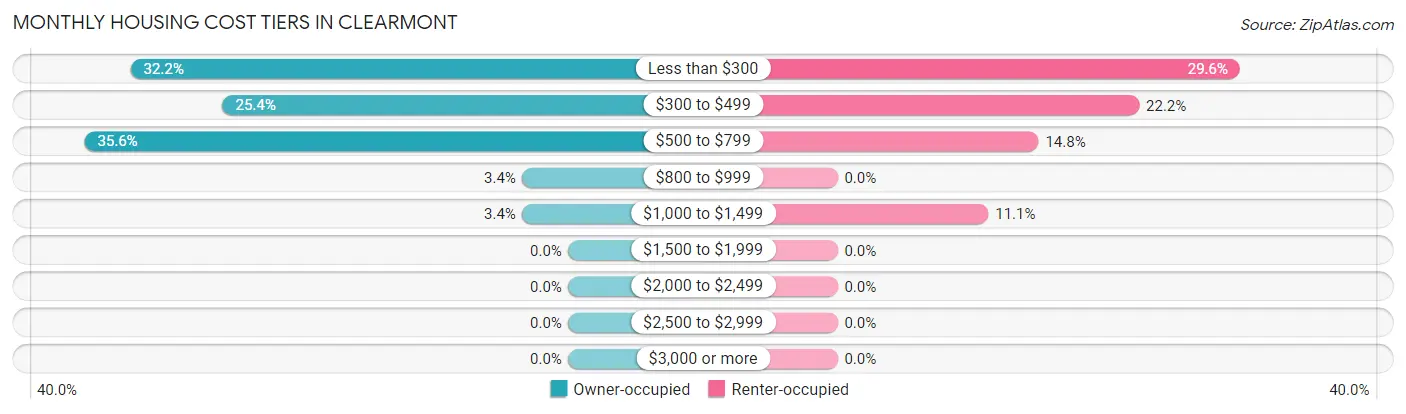
| Monthly Cost | Owner-occupied | Renter-occupied |
| Less than $300 | 19 (32.2%) | 8 (29.6%) |
| $300 to $499 | 15 (25.4%) | 6 (22.2%) |
| $500 to $799 | 21 (35.6%) | 4 (14.8%) |
| $800 to $999 | 2 (3.4%) | 0 (0.0%) |
| $1,000 to $1,499 | 2 (3.4%) | 3 (11.1%) |
| $1,500 to $1,999 | 0 (0.0%) | 0 (0.0%) |
| $2,000 to $2,499 | 0 (0.0%) | 0 (0.0%) |
| $2,500 to $2,999 | 0 (0.0%) | 0 (0.0%) |
| $3,000 or more | 0 (0.0%) | 0 (0.0%) |
| Total | 59 (100.0%) | 27 (100.0%) |
Physical Housing Characteristics in Clearmont
Housing Structures in Clearmont
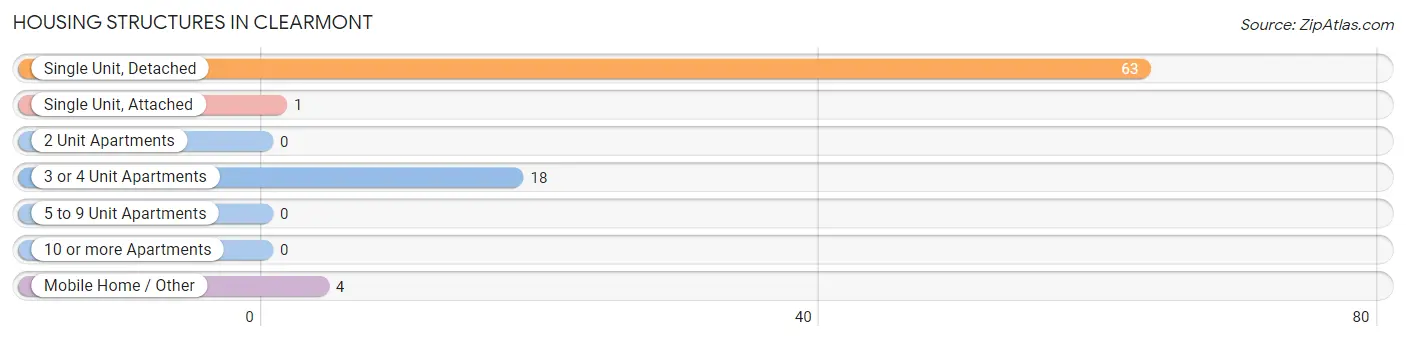
| Structure Type | # Housing Units | % Housing Units |
| Single Unit, Detached | 63 | 73.3% |
| Single Unit, Attached | 1 | 1.2% |
| 2 Unit Apartments | 0 | 0.0% |
| 3 or 4 Unit Apartments | 18 | 20.9% |
| 5 to 9 Unit Apartments | 0 | 0.0% |
| 10 or more Apartments | 0 | 0.0% |
| Mobile Home / Other | 4 | 4.6% |
| Total | 86 | 100.0% |
Housing Structures by Occupancy in Clearmont
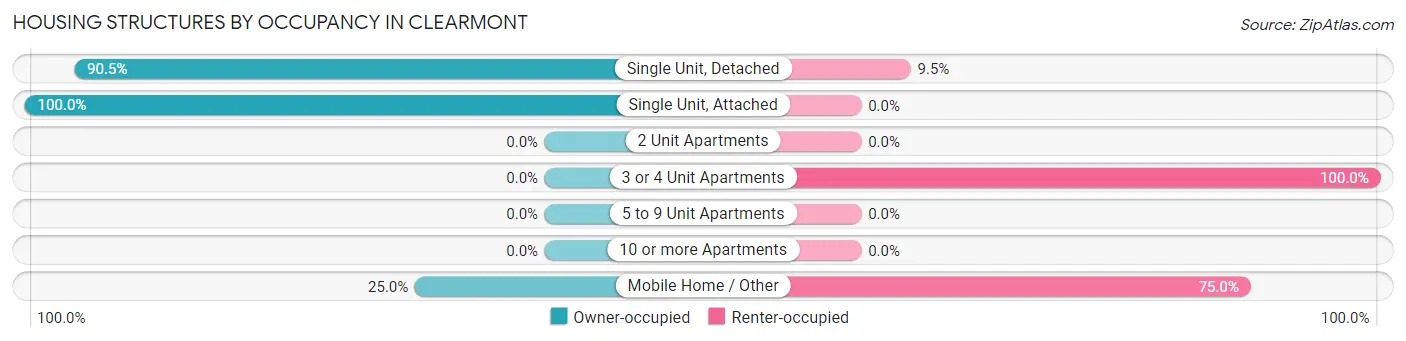
| Structure Type | Owner-occupied | Renter-occupied |
| Single Unit, Detached | 57 (90.5%) | 6 (9.5%) |
| Single Unit, Attached | 1 (100.0%) | 0 (0.0%) |
| 2 Unit Apartments | 0 (0.0%) | 0 (0.0%) |
| 3 or 4 Unit Apartments | 0 (0.0%) | 18 (100.0%) |
| 5 to 9 Unit Apartments | 0 (0.0%) | 0 (0.0%) |
| 10 or more Apartments | 0 (0.0%) | 0 (0.0%) |
| Mobile Home / Other | 1 (25.0%) | 3 (75.0%) |
| Total | 59 (68.6%) | 27 (31.4%) |
Housing Structures by Number of Rooms in Clearmont
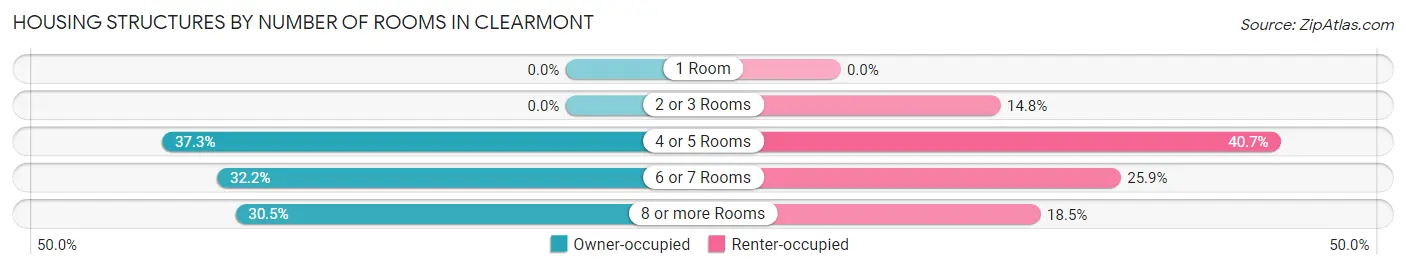
| Number of Rooms | Owner-occupied | Renter-occupied |
| 1 Room | 0 (0.0%) | 0 (0.0%) |
| 2 or 3 Rooms | 0 (0.0%) | 4 (14.8%) |
| 4 or 5 Rooms | 22 (37.3%) | 11 (40.7%) |
| 6 or 7 Rooms | 19 (32.2%) | 7 (25.9%) |
| 8 or more Rooms | 18 (30.5%) | 5 (18.5%) |
| Total | 59 (100.0%) | 27 (100.0%) |
Housing Structure by Heating Type in Clearmont
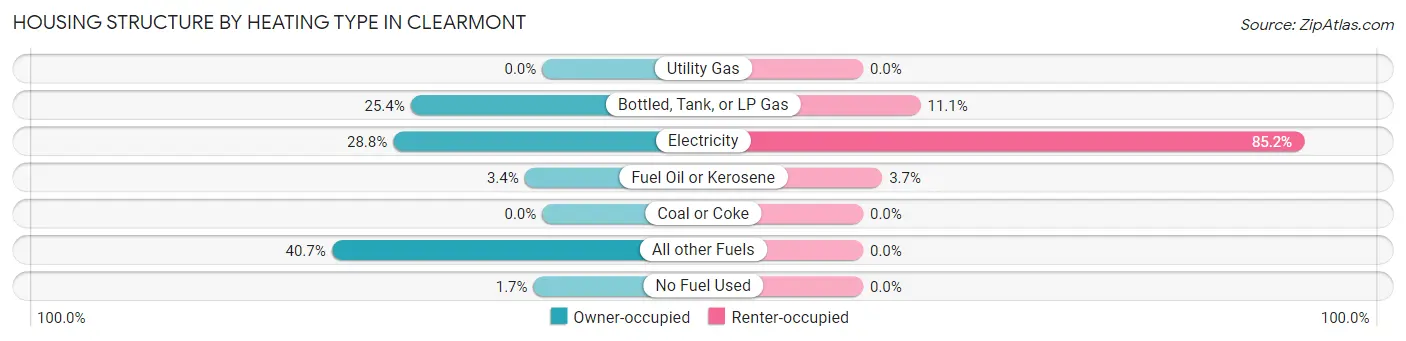
| Heating Type | Owner-occupied | Renter-occupied |
| Utility Gas | 0 (0.0%) | 0 (0.0%) |
| Bottled, Tank, or LP Gas | 15 (25.4%) | 3 (11.1%) |
| Electricity | 17 (28.8%) | 23 (85.2%) |
| Fuel Oil or Kerosene | 2 (3.4%) | 1 (3.7%) |
| Coal or Coke | 0 (0.0%) | 0 (0.0%) |
| All other Fuels | 24 (40.7%) | 0 (0.0%) |
| No Fuel Used | 1 (1.7%) | 0 (0.0%) |
| Total | 59 (100.0%) | 27 (100.0%) |
Household Vehicle Usage in Clearmont
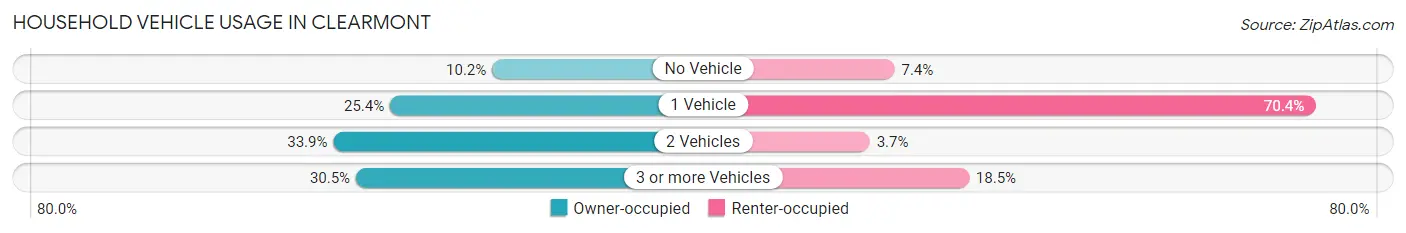
| Vehicles per Household | Owner-occupied | Renter-occupied |
| No Vehicle | 6 (10.2%) | 2 (7.4%) |
| 1 Vehicle | 15 (25.4%) | 19 (70.4%) |
| 2 Vehicles | 20 (33.9%) | 1 (3.7%) |
| 3 or more Vehicles | 18 (30.5%) | 5 (18.5%) |
| Total | 59 (100.0%) | 27 (100.0%) |
Real Estate & Mortgages in Clearmont
Real Estate and Mortgage Overview in Clearmont
| Characteristic | Without Mortgage | With Mortgage |
| Housing Units | 49 | 10 |
| Median Property Value | - | - |
| Median Household Income | - | - |
| Monthly Housing Costs | $372 | $0 |
| Real Estate Taxes | $660 | $0 |
Property Value by Mortgage Status in Clearmont
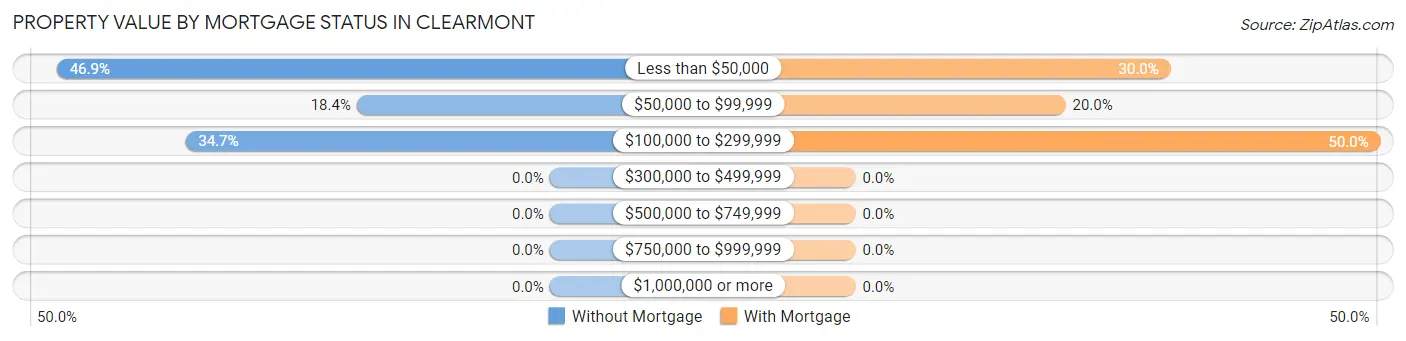
| Property Value | Without Mortgage | With Mortgage |
| Less than $50,000 | 23 (46.9%) | 3 (30.0%) |
| $50,000 to $99,999 | 9 (18.4%) | 2 (20.0%) |
| $100,000 to $299,999 | 17 (34.7%) | 5 (50.0%) |
| $300,000 to $499,999 | 0 (0.0%) | 0 (0.0%) |
| $500,000 to $749,999 | 0 (0.0%) | 0 (0.0%) |
| $750,000 to $999,999 | 0 (0.0%) | 0 (0.0%) |
| $1,000,000 or more | 0 (0.0%) | 0 (0.0%) |
| Total | 49 (100.0%) | 10 (100.0%) |
Household Income by Mortgage Status in Clearmont
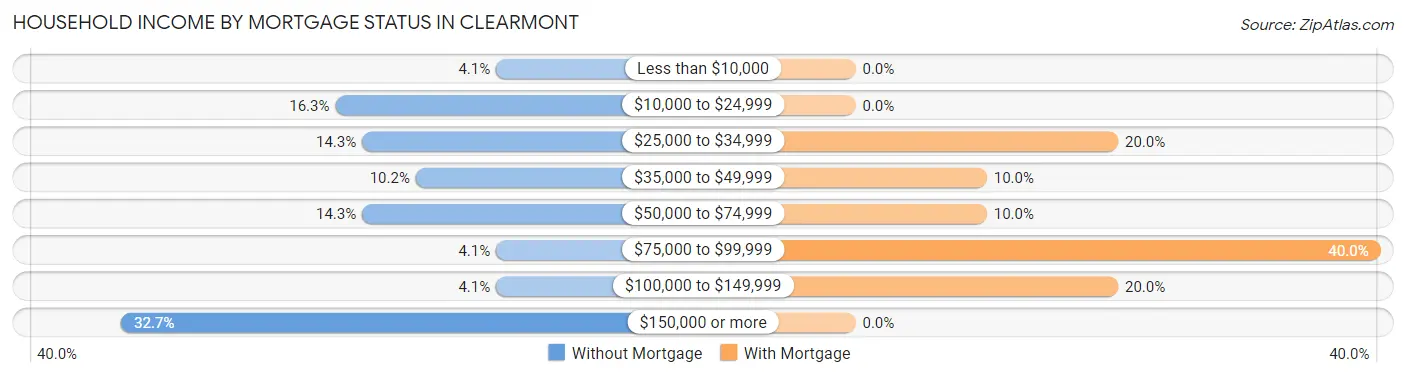
| Household Income | Without Mortgage | With Mortgage |
| Less than $10,000 | 2 (4.1%) | 0 (0.0%) |
| $10,000 to $24,999 | 8 (16.3%) | 0 (0.0%) |
| $25,000 to $34,999 | 7 (14.3%) | 2 (20.0%) |
| $35,000 to $49,999 | 5 (10.2%) | 1 (10.0%) |
| $50,000 to $74,999 | 7 (14.3%) | 1 (10.0%) |
| $75,000 to $99,999 | 2 (4.1%) | 4 (40.0%) |
| $100,000 to $149,999 | 2 (4.1%) | 2 (20.0%) |
| $150,000 or more | 16 (32.7%) | 0 (0.0%) |
| Total | 49 (100.0%) | 10 (100.0%) |
Property Value to Household Income Ratio in Clearmont
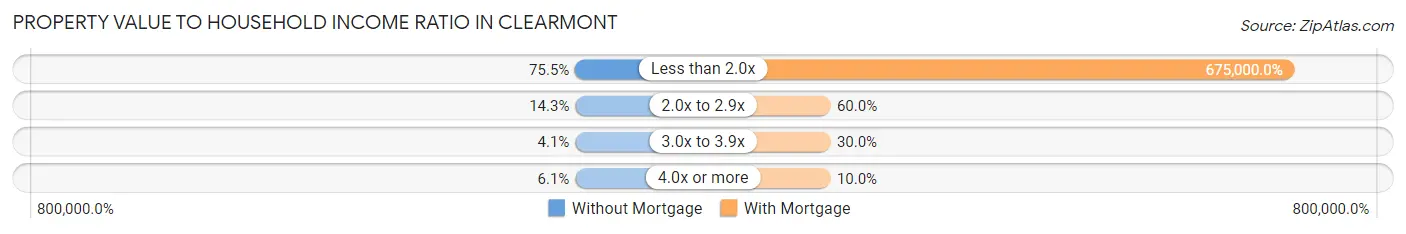
| Value-to-Income Ratio | Without Mortgage | With Mortgage |
| Less than 2.0x | 37 (75.5%) | 67,500 (675,000.0%) |
| 2.0x to 2.9x | 7 (14.3%) | 6 (60.0%) |
| 3.0x to 3.9x | 2 (4.1%) | 3 (30.0%) |
| 4.0x or more | 3 (6.1%) | 1 (10.0%) |
| Total | 49 (100.0%) | 10 (100.0%) |
Real Estate Taxes by Mortgage Status in Clearmont
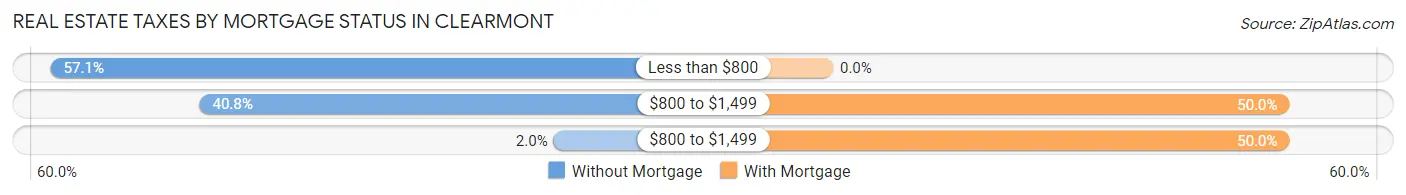
| Property Taxes | Without Mortgage | With Mortgage |
| Less than $800 | 28 (57.1%) | 0 (0.0%) |
| $800 to $1,499 | 20 (40.8%) | 5 (50.0%) |
| $800 to $1,499 | 1 (2.0%) | 5 (50.0%) |
| Total | 49 (100.0%) | 10 (100.0%) |
Health & Disability in Clearmont
Health Insurance Coverage by Age in Clearmont
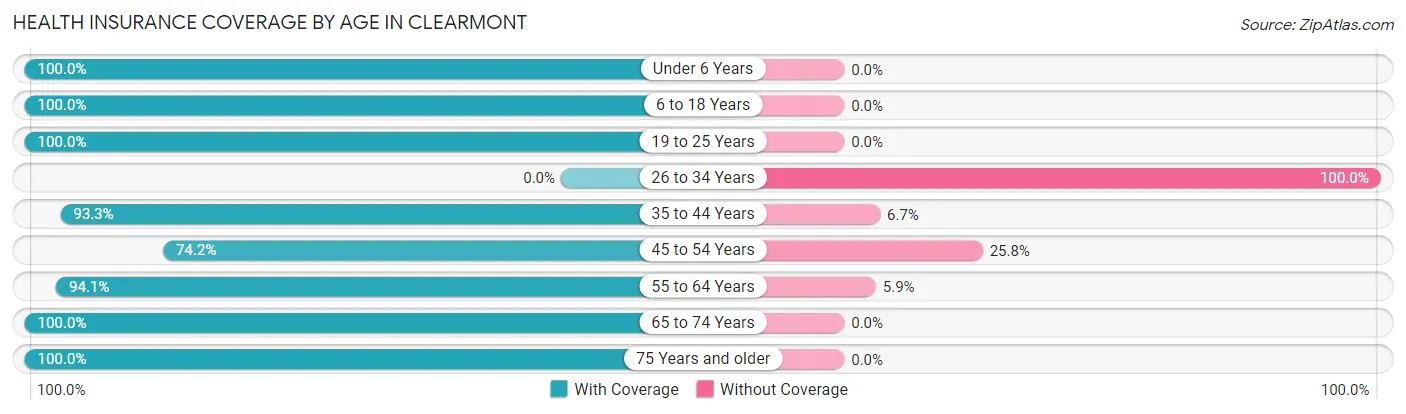
| Age Bracket | With Coverage | Without Coverage |
| Under 6 Years | 2 (100.0%) | 0 (0.0%) |
| 6 to 18 Years | 8 (100.0%) | 0 (0.0%) |
| 19 to 25 Years | 12 (100.0%) | 0 (0.0%) |
| 26 to 34 Years | 0 (0.0%) | 1 (100.0%) |
| 35 to 44 Years | 14 (93.3%) | 1 (6.7%) |
| 45 to 54 Years | 23 (74.2%) | 8 (25.8%) |
| 55 to 64 Years | 32 (94.1%) | 2 (5.9%) |
| 65 to 74 Years | 18 (100.0%) | 0 (0.0%) |
| 75 Years and older | 31 (100.0%) | 0 (0.0%) |
| Total | 140 (92.1%) | 12 (7.9%) |
Health Insurance Coverage by Citizenship Status in Clearmont
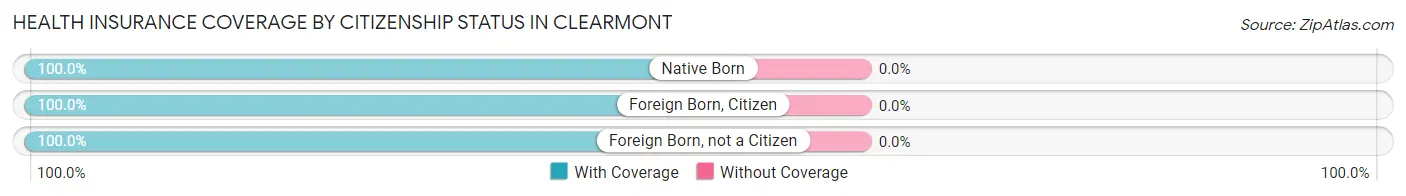
| Citizenship Status | With Coverage | Without Coverage |
| Native Born | 2 (100.0%) | 0 (0.0%) |
| Foreign Born, Citizen | 8 (100.0%) | 0 (0.0%) |
| Foreign Born, not a Citizen | 12 (100.0%) | 0 (0.0%) |
Health Insurance Coverage by Household Income in Clearmont
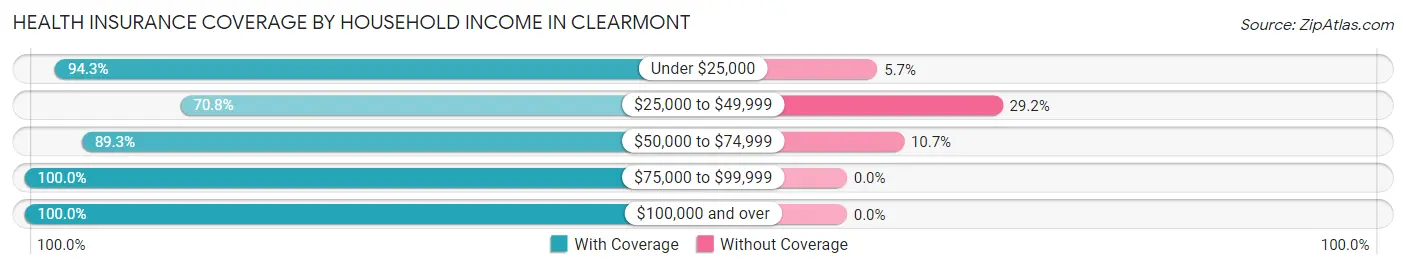
| Household Income | With Coverage | Without Coverage |
| Under $25,000 | 33 (94.3%) | 2 (5.7%) |
| $25,000 to $49,999 | 17 (70.8%) | 7 (29.2%) |
| $50,000 to $74,999 | 25 (89.3%) | 3 (10.7%) |
| $75,000 to $99,999 | 6 (100.0%) | 0 (0.0%) |
| $100,000 and over | 59 (100.0%) | 0 (0.0%) |
Public vs Private Health Insurance Coverage by Age in Clearmont
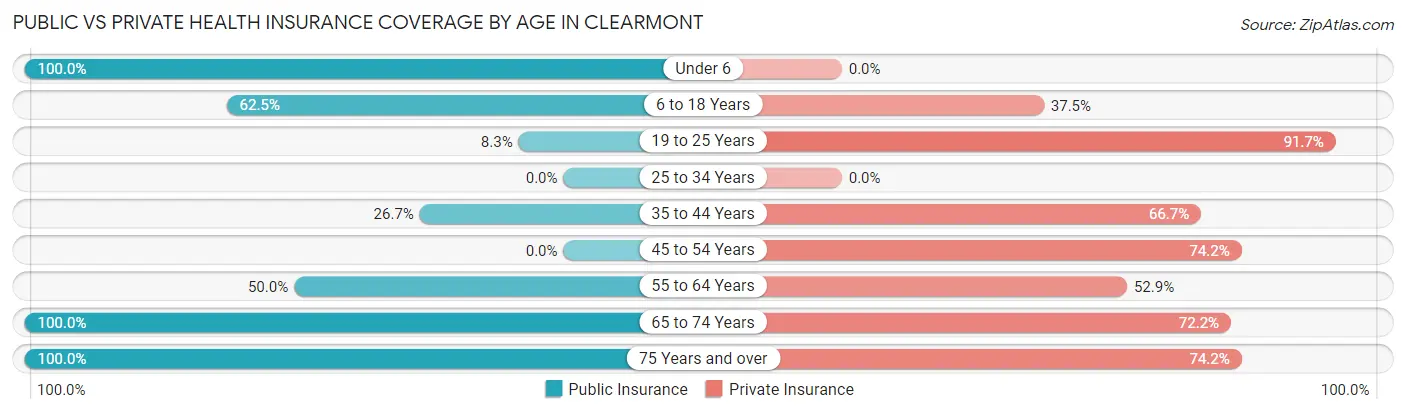
| Age Bracket | Public Insurance | Private Insurance |
| Under 6 | 2 (100.0%) | 0 (0.0%) |
| 6 to 18 Years | 5 (62.5%) | 3 (37.5%) |
| 19 to 25 Years | 1 (8.3%) | 11 (91.7%) |
| 25 to 34 Years | 0 (0.0%) | 0 (0.0%) |
| 35 to 44 Years | 4 (26.7%) | 10 (66.7%) |
| 45 to 54 Years | 0 (0.0%) | 23 (74.2%) |
| 55 to 64 Years | 17 (50.0%) | 18 (52.9%) |
| 65 to 74 Years | 18 (100.0%) | 13 (72.2%) |
| 75 Years and over | 31 (100.0%) | 23 (74.2%) |
| Total | 78 (51.3%) | 101 (66.4%) |
Disability Status by Sex by Age in Clearmont
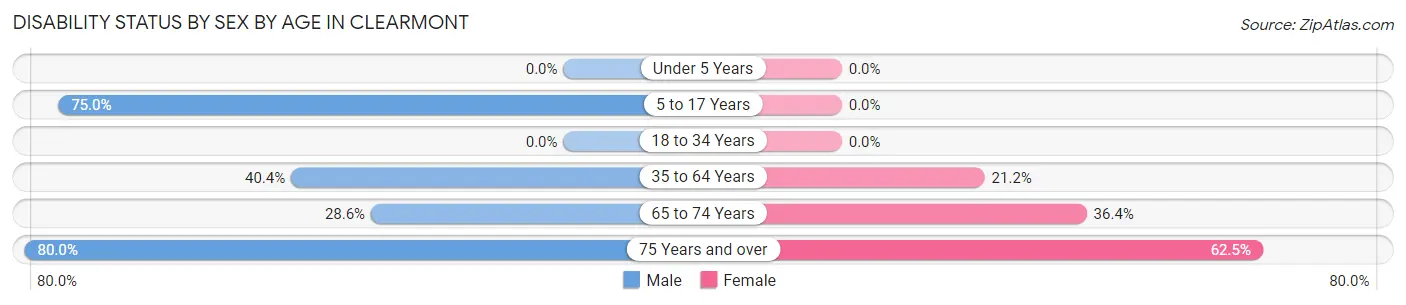
| Age Bracket | Male | Female |
| Under 5 Years | 0 (0.0%) | 0 (0.0%) |
| 5 to 17 Years | 3 (75.0%) | 0 (0.0%) |
| 18 to 34 Years | 0 (0.0%) | 0 (0.0%) |
| 35 to 64 Years | 19 (40.4%) | 7 (21.2%) |
| 65 to 74 Years | 2 (28.6%) | 4 (36.4%) |
| 75 Years and over | 12 (80.0%) | 10 (62.5%) |
Disability Class by Sex by Age in Clearmont
Disability Class: Hearing Difficulty
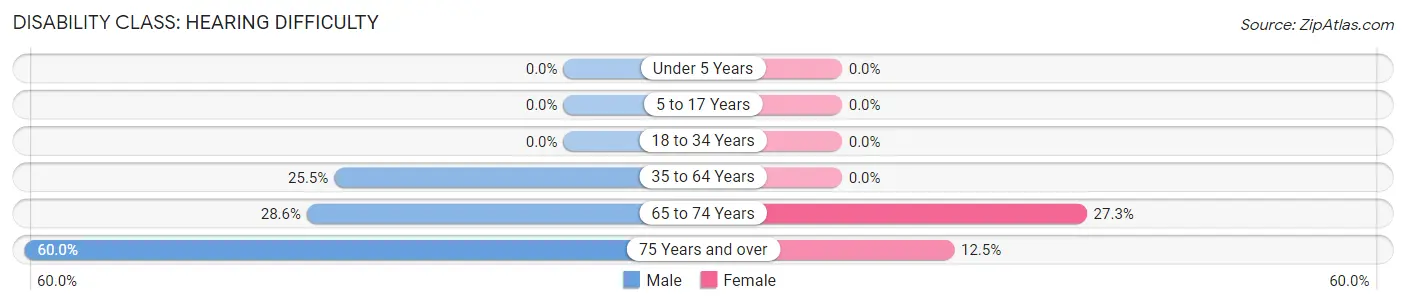
| Age Bracket | Male | Female |
| Under 5 Years | 0 (0.0%) | 0 (0.0%) |
| 5 to 17 Years | 0 (0.0%) | 0 (0.0%) |
| 18 to 34 Years | 0 (0.0%) | 0 (0.0%) |
| 35 to 64 Years | 12 (25.5%) | 0 (0.0%) |
| 65 to 74 Years | 2 (28.6%) | 3 (27.3%) |
| 75 Years and over | 9 (60.0%) | 2 (12.5%) |
Disability Class: Vision Difficulty
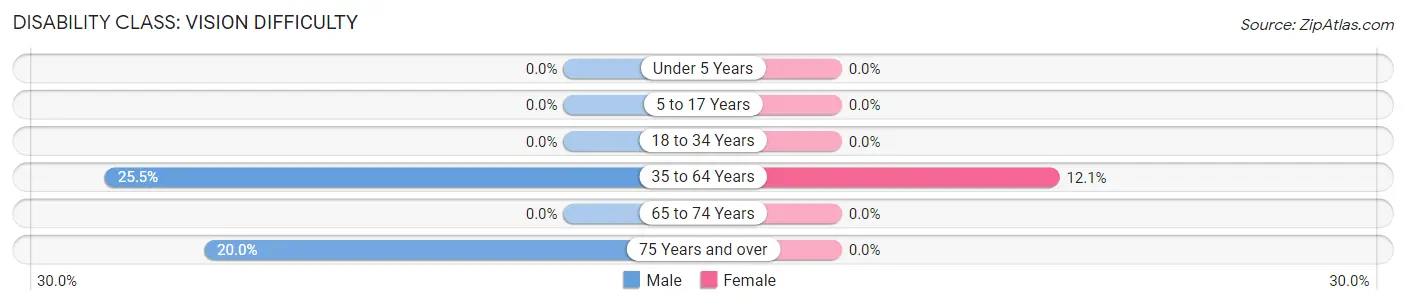
| Age Bracket | Male | Female |
| Under 5 Years | 0 (0.0%) | 0 (0.0%) |
| 5 to 17 Years | 0 (0.0%) | 0 (0.0%) |
| 18 to 34 Years | 0 (0.0%) | 0 (0.0%) |
| 35 to 64 Years | 12 (25.5%) | 4 (12.1%) |
| 65 to 74 Years | 0 (0.0%) | 0 (0.0%) |
| 75 Years and over | 3 (20.0%) | 0 (0.0%) |
Disability Class: Cognitive Difficulty
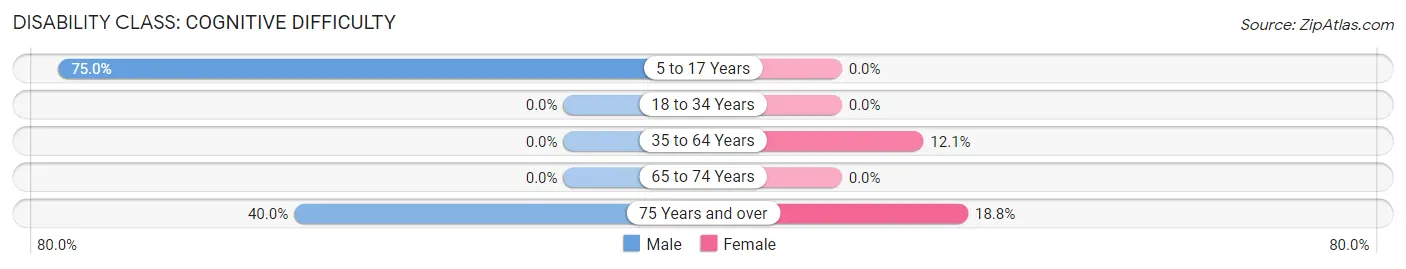
| Age Bracket | Male | Female |
| 5 to 17 Years | 3 (75.0%) | 0 (0.0%) |
| 18 to 34 Years | 0 (0.0%) | 0 (0.0%) |
| 35 to 64 Years | 0 (0.0%) | 4 (12.1%) |
| 65 to 74 Years | 0 (0.0%) | 0 (0.0%) |
| 75 Years and over | 6 (40.0%) | 3 (18.8%) |
Disability Class: Ambulatory Difficulty
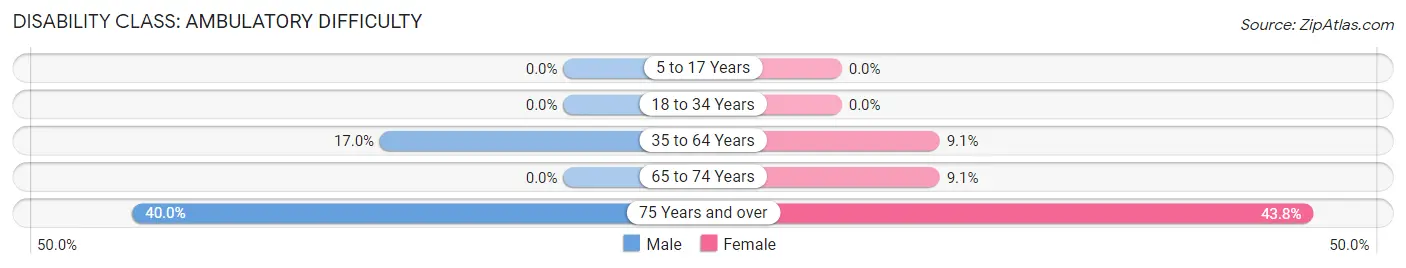
| Age Bracket | Male | Female |
| 5 to 17 Years | 0 (0.0%) | 0 (0.0%) |
| 18 to 34 Years | 0 (0.0%) | 0 (0.0%) |
| 35 to 64 Years | 8 (17.0%) | 3 (9.1%) |
| 65 to 74 Years | 0 (0.0%) | 1 (9.1%) |
| 75 Years and over | 6 (40.0%) | 7 (43.8%) |
Disability Class: Self-Care Difficulty
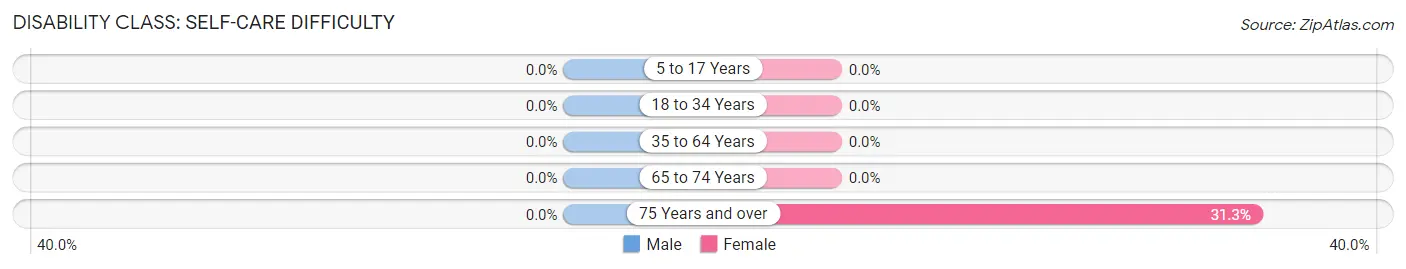
| Age Bracket | Male | Female |
| 5 to 17 Years | 0 (0.0%) | 0 (0.0%) |
| 18 to 34 Years | 0 (0.0%) | 0 (0.0%) |
| 35 to 64 Years | 0 (0.0%) | 0 (0.0%) |
| 65 to 74 Years | 0 (0.0%) | 0 (0.0%) |
| 75 Years and over | 0 (0.0%) | 5 (31.2%) |
Technology Access in Clearmont
Computing Device Access in Clearmont
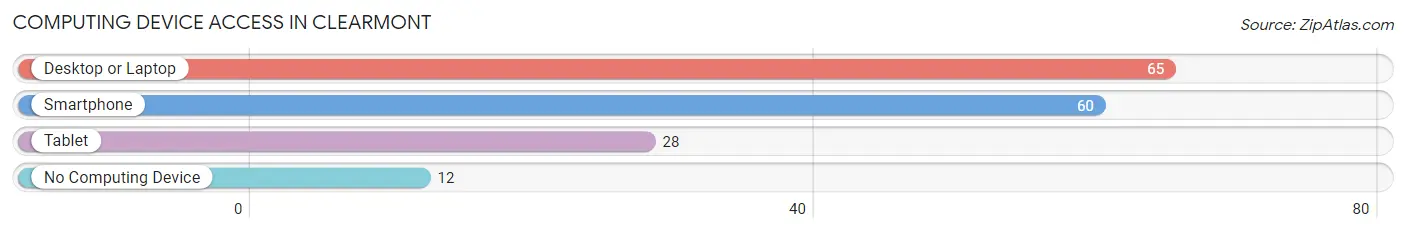
| Device Type | # Households | % Households |
| Desktop or Laptop | 65 | 75.6% |
| Smartphone | 60 | 69.8% |
| Tablet | 28 | 32.6% |
| No Computing Device | 12 | 14.0% |
| Total | 86 | 100.0% |
Internet Access in Clearmont
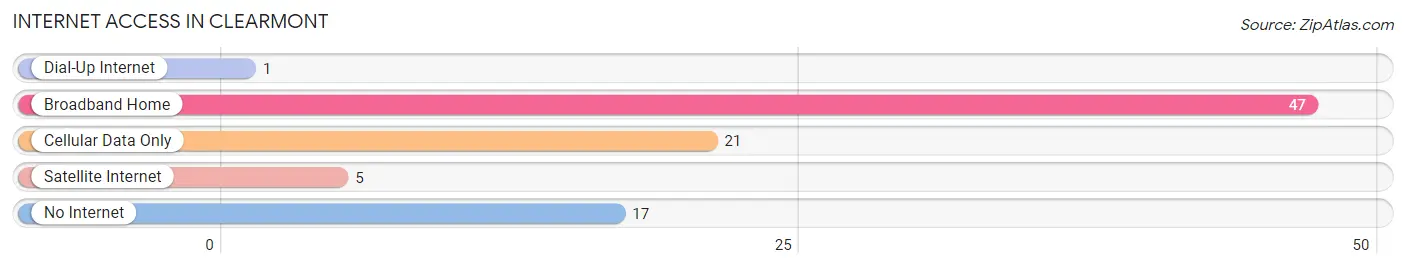
| Internet Type | # Households | % Households |
| Dial-Up Internet | 1 | 1.2% |
| Broadband Home | 47 | 54.6% |
| Cellular Data Only | 21 | 24.4% |
| Satellite Internet | 5 | 5.8% |
| No Internet | 17 | 19.8% |
| Total | 86 | 100.0% |
Clearmont Summary
Clearmont is a small town located in the northwest corner of Missouri, in Nodaway County. It is situated on the banks of the Nodaway River, and is surrounded by rolling hills and farmland. The town was founded in 1872, and has a population of approximately 500 people.
History
Clearmont was founded in 1872 by a group of settlers from the nearby town of Maryville. The settlers were looking for a place to settle and start a new life, and they chose the area around the Nodaway River. The town was named after the clear waters of the river, and the settlers began to build homes and businesses.
The town grew slowly, but steadily, and by the early 1900s it had become a thriving community. The town was home to a variety of businesses, including a general store, a blacksmith, a livery stable, a hotel, and a bank. The town also had a school, a post office, and a newspaper.
In the early 1900s, the town was also home to a number of churches, including the Methodist Episcopal Church, the Presbyterian Church, and the Baptist Church. The town also had a number of fraternal organizations, such as the Masonic Lodge and the Odd Fellows.
The town continued to grow and prosper throughout the 20th century, and by the year 2000 it had a population of approximately 500 people.
Geography
Clearmont is located in the northwest corner of Missouri, in Nodaway County. It is situated on the banks of the Nodaway River, and is surrounded by rolling hills and farmland. The town is located approximately 30 miles from the city of Maryville, and is about an hour and a half drive from the state capital of Jefferson City.
The town is located in a temperate climate, with hot summers and cold winters. The average temperature in the summer is around 80 degrees Fahrenheit, and the average temperature in the winter is around 30 degrees Fahrenheit.
Economy
The economy of Clearmont is largely based on agriculture. The town is surrounded by farmland, and many of the residents are involved in farming and ranching. The town also has a number of small businesses, including a general store, a hardware store, a restaurant, and a gas station.
The town also has a number of manufacturing businesses, including a furniture factory and a woodworking shop. The town is also home to a number of service businesses, such as a barber shop, a beauty salon, and a car repair shop.
Demographics
As of the year 2000, the population of Clearmont was approximately 500 people. The town is predominantly white, with a small minority population. The median household income is around $30,000, and the median home value is around $80,000.
The town is served by the Nodaway County School District, and the town has one elementary school and one high school. The town also has a public library, and a number of churches.
Conclusion
Clearmont is a small town located in the northwest corner of Missouri, in Nodaway County. It was founded in 1872, and has a population of approximately 500 people. The town is largely based on agriculture, and is home to a number of small businesses. The town is predominantly white, with a small minority population, and the median household income is around $30,000. The town is served by the Nodaway County School District, and has a public library and a number of churches.
Common Questions
What is Per Capita Income in Clearmont?
Per Capita income in Clearmont is $38,019.
What is the Median Household income in Clearmont?
Median Household Income in Clearmont is $45,000.
What is Inequality or Gini Index in Clearmont?
Inequality or Gini Index in Clearmont is 0.46.
What is the Total Population of Clearmont?
Total Population of Clearmont is 152.
What is the Total Male Population of Clearmont?
Total Male Population of Clearmont is 85.
What is the Total Female Population of Clearmont?
Total Female Population of Clearmont is 67.
What is the Ratio of Males per 100 Females in Clearmont?
There are 126.87 Males per 100 Females in Clearmont.
What is the Ratio of Females per 100 Males in Clearmont?
There are 78.82 Females per 100 Males in Clearmont.
What is the Median Population Age in Clearmont?
Median Population Age in Clearmont is 56.0 Years.
What is the Average Family Size in Clearmont
Average Family Size in Clearmont is 2.3 People.
What is the Average Household Size in Clearmont
Average Household Size in Clearmont is 1.8 People.
How Large is the Labor Force in Clearmont?
There are 73 People in the Labor Forcein in Clearmont.
What is the Percentage of People in the Labor Force in Clearmont?
51.4% of People are in the Labor Force in Clearmont.