Clarkton, MO Map & Demographics
Clarkton Map
Clarkton Overview
$16,756
PER CAPITA INCOME
$46,875
AVG FAMILY INCOME
$39,219
AVG HOUSEHOLD INCOME
32.1%
WAGE / INCOME GAP [ % ]
67.9¢/ $1
WAGE / INCOME GAP [ $ ]
0.40
INEQUALITY / GINI INDEX
1,094
TOTAL POPULATION
542
MALE POPULATION
552
FEMALE POPULATION
98.19
MALES / 100 FEMALES
101.85
FEMALES / 100 MALES
29.4
MEDIAN AGE
3.2
AVG FAMILY SIZE
2.6
AVG HOUSEHOLD SIZE
419
LABOR FORCE [ PEOPLE ]
51.9%
PERCENT IN LABOR FORCE
2.6%
UNEMPLOYMENT RATE
Clarkton Zip Codes
Clarkton Area Codes
Income in Clarkton
Income Overview in Clarkton
Per Capita Income in Clarkton is $16,756, while median incomes of families and households are $46,875 and $39,219 respectively.
| Characteristic | Number | Measure |
| Per Capita Income | 1,094 | $16,756 |
| Median Family Income | 268 | $46,875 |
| Mean Family Income | 268 | $47,818 |
| Median Household Income | 425 | $39,219 |
| Mean Household Income | 425 | $42,812 |
| Income Deficit | 268 | $0 |
| Wage / Income Gap (%) | 1,094 | 32.06% |
| Wage / Income Gap ($) | 1,094 | 67.94¢ per $1 |
| Gini / Inequality Index | 1,094 | 0.40 |
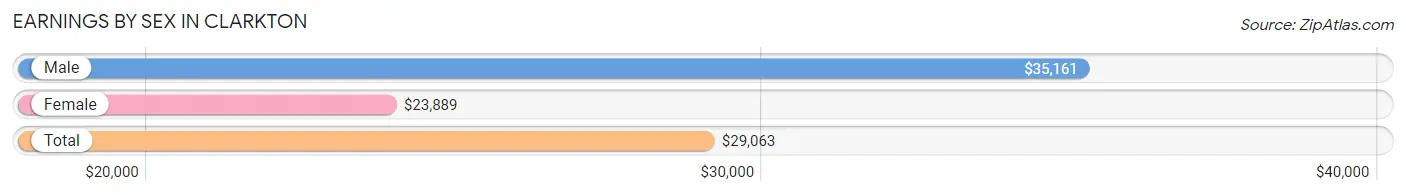
Earnings by Sex in Clarkton
Average Earnings in Clarkton are $29,063, $35,161 for men and $23,889 for women, a difference of 32.1%.
| Sex | Number | Average Earnings |
| Male | 216 (47.8%) | $35,161 |
| Female | 236 (52.2%) | $23,889 |
| Total | 452 (100.0%) | $29,063 |
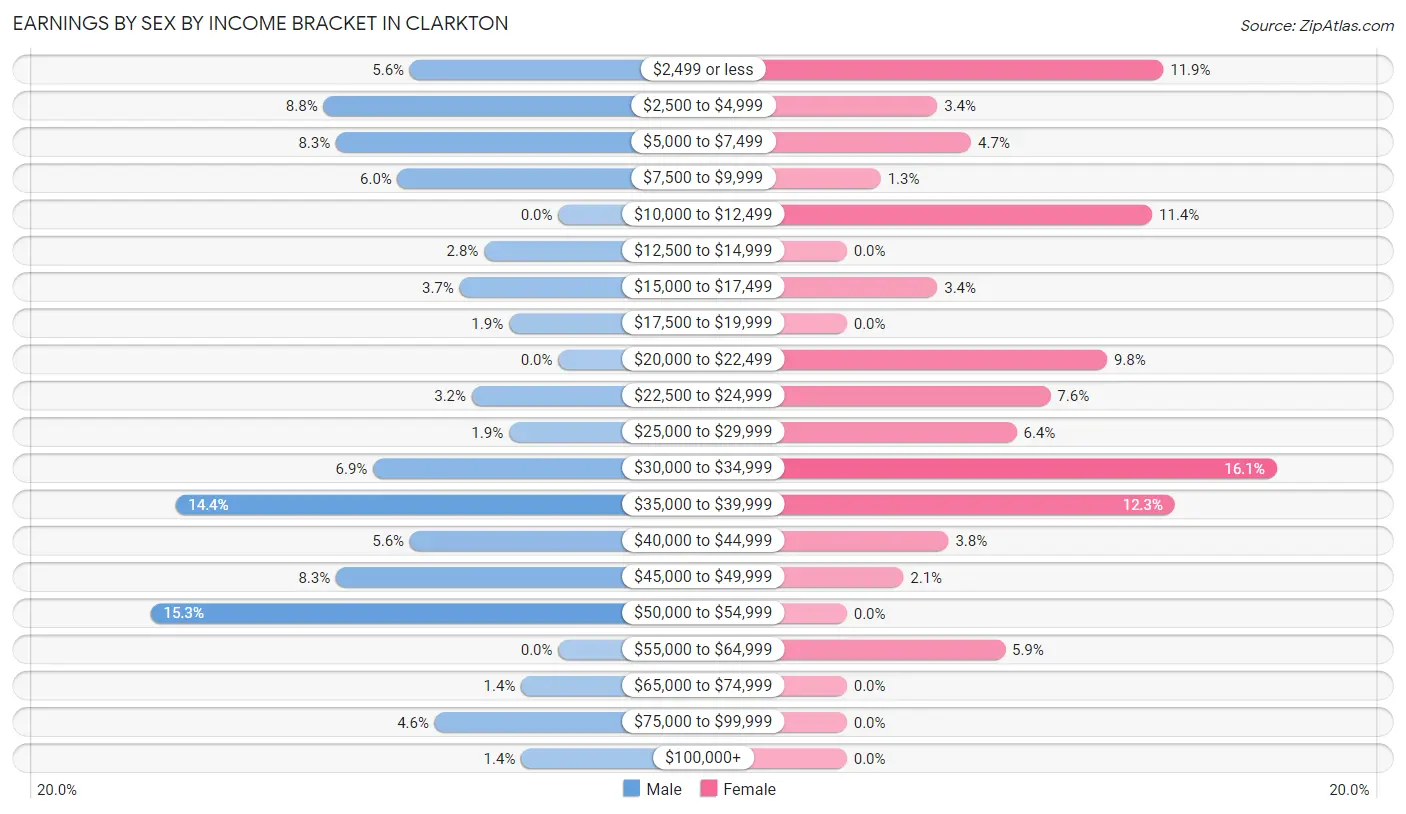
Earnings by Sex by Income Bracket in Clarkton
The most common earnings brackets in Clarkton are $50,000 to $54,999 for men (33 | 15.3%) and $30,000 to $34,999 for women (38 | 16.1%).
| Income | Male | Female |
| $2,499 or less | 12 (5.6%) | 28 (11.9%) |
| $2,500 to $4,999 | 19 (8.8%) | 8 (3.4%) |
| $5,000 to $7,499 | 18 (8.3%) | 11 (4.7%) |
| $7,500 to $9,999 | 13 (6.0%) | 3 (1.3%) |
| $10,000 to $12,499 | 0 (0.0%) | 27 (11.4%) |
| $12,500 to $14,999 | 6 (2.8%) | 0 (0.0%) |
| $15,000 to $17,499 | 8 (3.7%) | 8 (3.4%) |
| $17,500 to $19,999 | 4 (1.8%) | 0 (0.0%) |
| $20,000 to $22,499 | 0 (0.0%) | 23 (9.8%) |
| $22,500 to $24,999 | 7 (3.2%) | 18 (7.6%) |
| $25,000 to $29,999 | 4 (1.8%) | 15 (6.4%) |
| $30,000 to $34,999 | 15 (6.9%) | 38 (16.1%) |
| $35,000 to $39,999 | 31 (14.3%) | 29 (12.3%) |
| $40,000 to $44,999 | 12 (5.6%) | 9 (3.8%) |
| $45,000 to $49,999 | 18 (8.3%) | 5 (2.1%) |
| $50,000 to $54,999 | 33 (15.3%) | 0 (0.0%) |
| $55,000 to $64,999 | 0 (0.0%) | 14 (5.9%) |
| $65,000 to $74,999 | 3 (1.4%) | 0 (0.0%) |
| $75,000 to $99,999 | 10 (4.6%) | 0 (0.0%) |
| $100,000+ | 3 (1.4%) | 0 (0.0%) |
| Total | 216 (100.0%) | 236 (100.0%) |
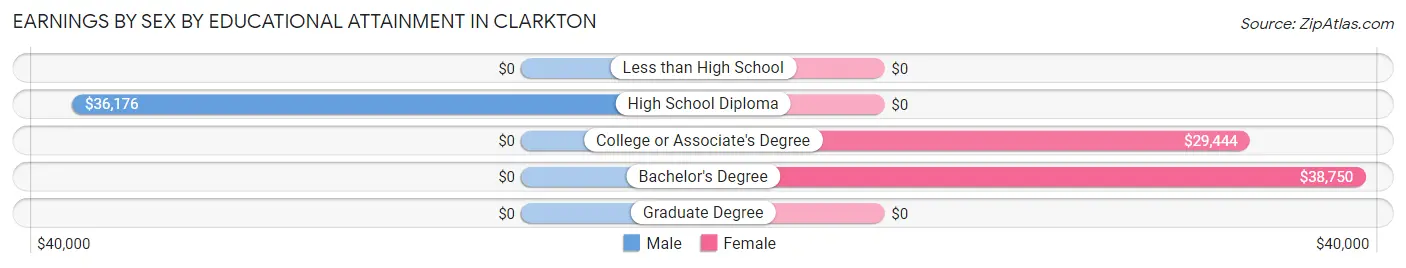
Earnings by Sex by Educational Attainment in Clarkton
Average earnings in Clarkton are $35,588 for men and $29,722 for women, a difference of 16.5%. Men with an educational attainment of high school diploma enjoy the highest average annual earnings of $36,176, while those with high school diploma education earn the least with $36,176. Women with an educational attainment of bachelor's degree earn the most with the average annual earnings of $38,750, while those with college or associate's degree education have the smallest earnings of $29,444.
| Educational Attainment | Male Income | Female Income |
| Less than High School | - | - |
| High School Diploma | $36,176 | $0 |
| College or Associate's Degree | - | - |
| Bachelor's Degree | - | - |
| Graduate Degree | - | - |
| Total | $35,588 | $29,722 |
Family Income in Clarkton
Family Income Brackets in Clarkton
According to the Clarkton family income data, there are 90 families falling into the $50,000 to $74,999 income range, which is the most common income bracket and makes up 33.6% of all families.
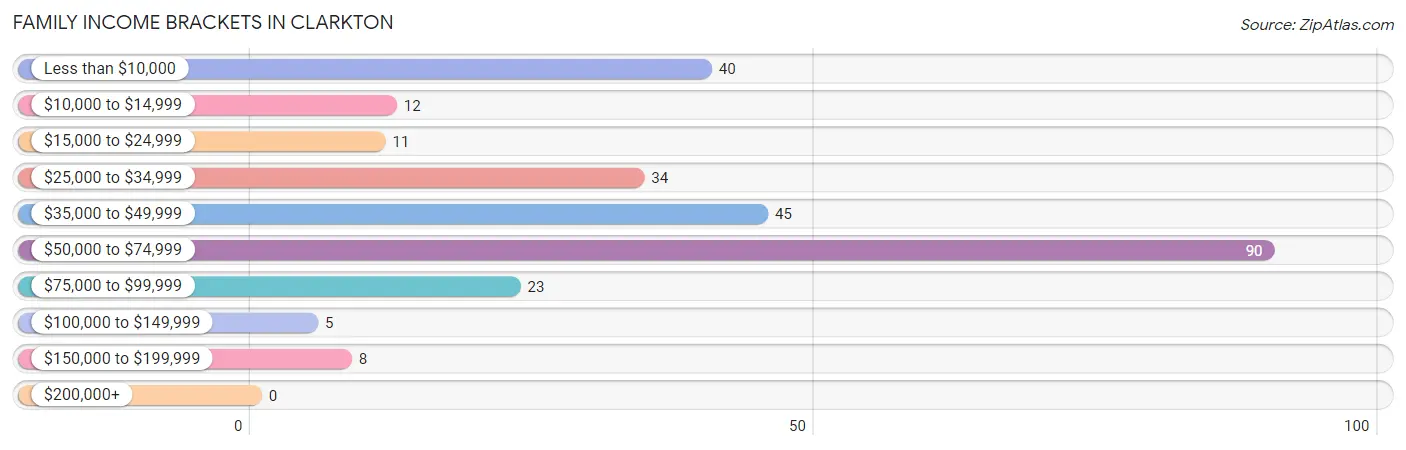
| Income Bracket | # Families | % Families |
| Less than $10,000 | 40 | 14.9% |
| $10,000 to $14,999 | 12 | 4.5% |
| $15,000 to $24,999 | 11 | 4.1% |
| $25,000 to $34,999 | 34 | 12.7% |
| $35,000 to $49,999 | 45 | 16.8% |
| $50,000 to $74,999 | 90 | 33.6% |
| $75,000 to $99,999 | 23 | 8.6% |
| $100,000 to $149,999 | 5 | 1.9% |
| $150,000 to $199,999 | 8 | 3.0% |
| $200,000+ | 0 | 0.0% |
Family Income by Famaliy Size in Clarkton
4-person families (50 | 18.7%) account for the highest median family income in Clarkton with $75,227 per family, while 2-person families (117 | 43.7%) have the highest median income of $25,301 per family member.
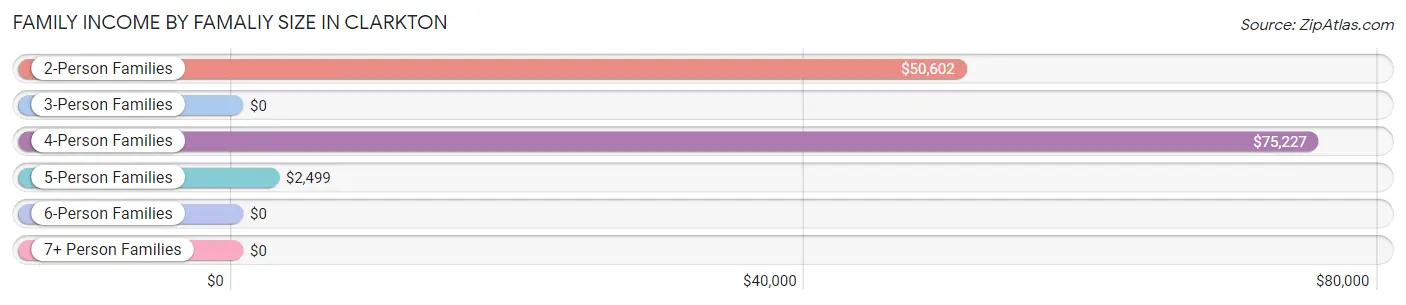
| Income Bracket | # Families | Median Income |
| 2-Person Families | 117 (43.7%) | $50,602 |
| 3-Person Families | 49 (18.3%) | $0 |
| 4-Person Families | 50 (18.7%) | $75,227 |
| 5-Person Families | 39 (14.5%) | $2,499 |
| 6-Person Families | 13 (4.9%) | $0 |
| 7+ Person Families | 0 (0.0%) | $0 |
| Total | 268 (100.0%) | $46,875 |
Family Income by Number of Earners in Clarkton
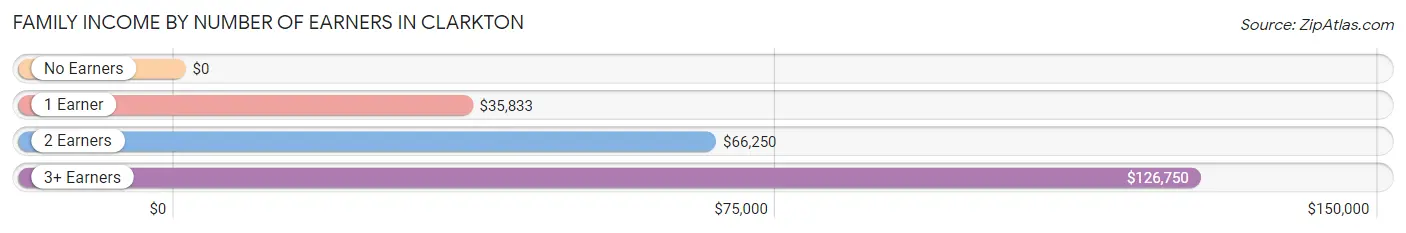
| Number of Earners | # Families | Median Income |
| No Earners | 72 (26.9%) | $0 |
| 1 Earner | 86 (32.1%) | $35,833 |
| 2 Earners | 97 (36.2%) | $66,250 |
| 3+ Earners | 13 (4.9%) | $126,750 |
| Total | 268 (100.0%) | $46,875 |
Household Income in Clarkton
Household Income Brackets in Clarkton
With 109 households falling in the category, the $50,000 to $74,999 income range is the most frequent in Clarkton, accounting for 25.7% of all households.
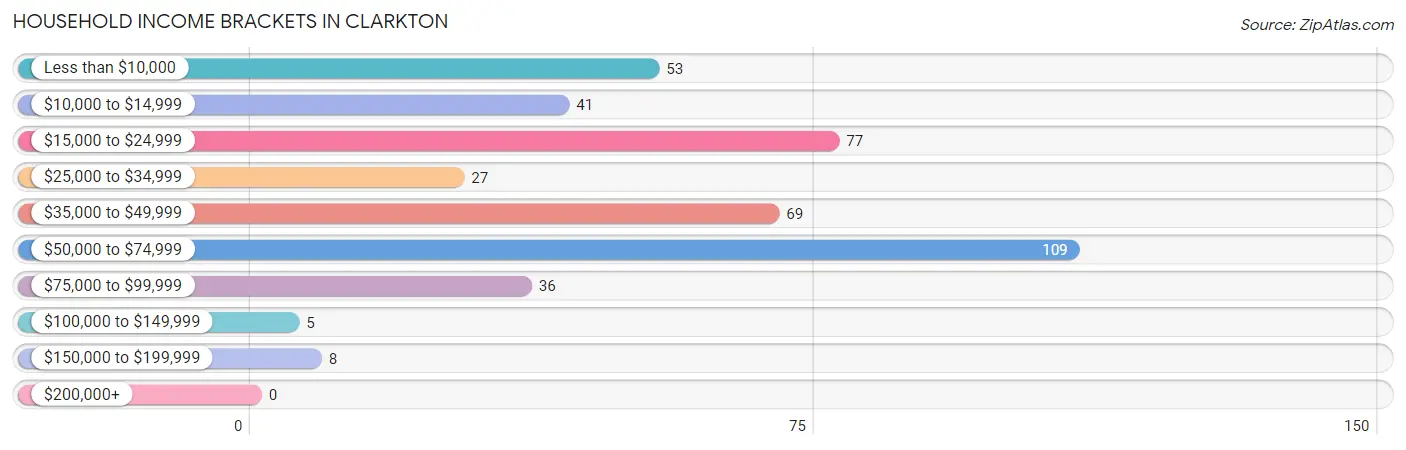
| Income Bracket | # Households | % Households |
| Less than $10,000 | 53 | 12.5% |
| $10,000 to $14,999 | 41 | 9.6% |
| $15,000 to $24,999 | 77 | 18.1% |
| $25,000 to $34,999 | 27 | 6.4% |
| $35,000 to $49,999 | 69 | 16.2% |
| $50,000 to $74,999 | 109 | 25.6% |
| $75,000 to $99,999 | 36 | 8.5% |
| $100,000 to $149,999 | 5 | 1.2% |
| $150,000 to $199,999 | 8 | 1.9% |
| $200,000+ | 0 | 0.0% |
Household Income by Householder Age in Clarkton
The median household income in Clarkton is $39,219, with the highest median household income of $46,000 found in the 25 to 44 years age bracket for the primary householder. A total of 160 households (37.7%) fall into this category. Meanwhile, the 15 to 24 years age bracket for the primary householder has the lowest median household income of $0, with 9 households (2.1%) in this group.
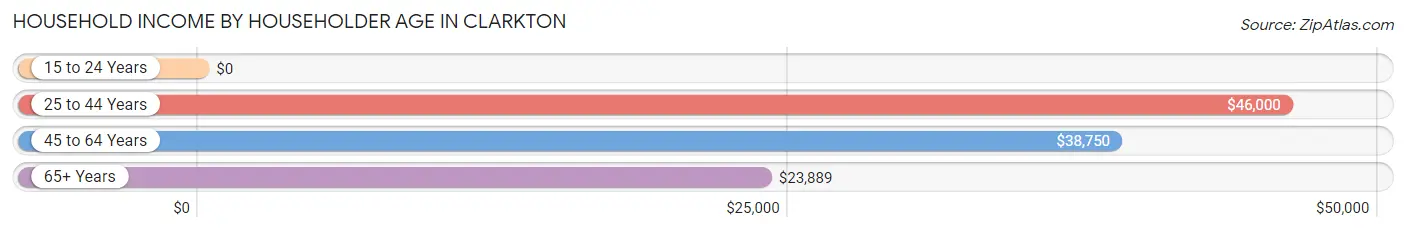
| Income Bracket | # Households | Median Income |
| 15 to 24 Years | 9 (2.1%) | $0 |
| 25 to 44 Years | 160 (37.7%) | $46,000 |
| 45 to 64 Years | 170 (40.0%) | $38,750 |
| 65+ Years | 86 (20.2%) | $23,889 |
| Total | 425 (100.0%) | $39,219 |
Poverty in Clarkton
Income Below Poverty by Sex and Age in Clarkton
With 33.8% poverty level for males and 29.6% for females among the residents of Clarkton, 16 and 17 year old males and 75 year old and over females are the most vulnerable to poverty, with 18 males (81.8%) and 11 females (45.8%) in their respective age groups living below the poverty level.
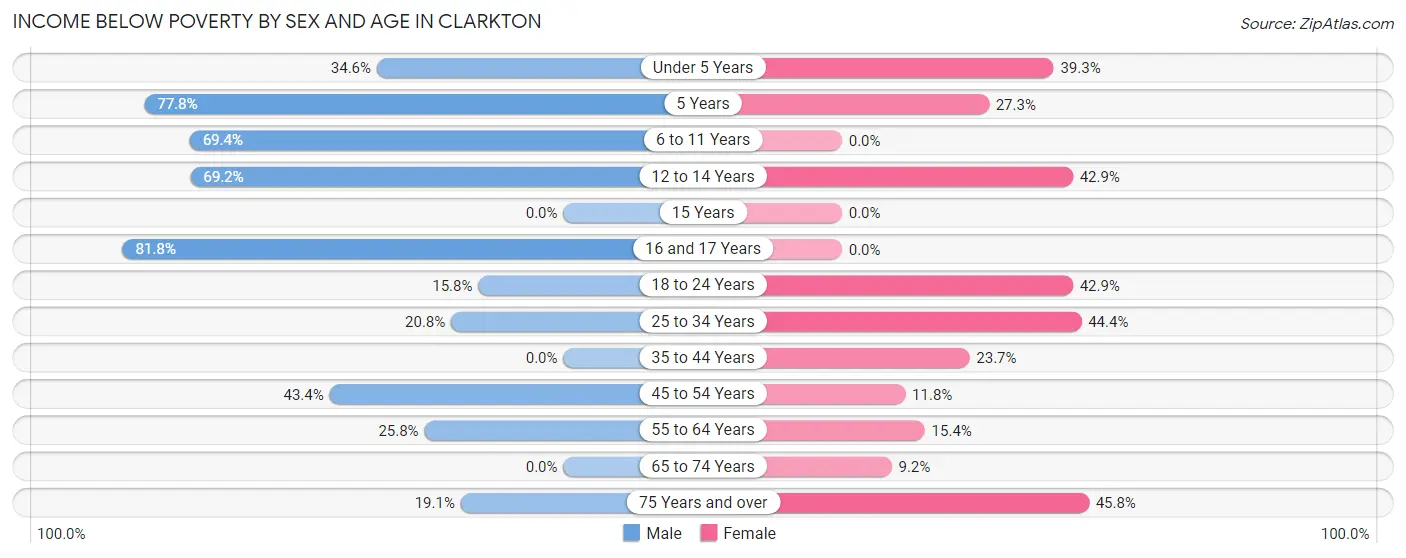
| Age Bracket | Male | Female |
| Under 5 Years | 9 (34.6%) | 22 (39.3%) |
| 5 Years | 14 (77.8%) | 3 (27.3%) |
| 6 to 11 Years | 43 (69.4%) | 0 (0.0%) |
| 12 to 14 Years | 9 (69.2%) | 15 (42.9%) |
| 15 Years | 0 (0.0%) | 0 (0.0%) |
| 16 and 17 Years | 18 (81.8%) | 0 (0.0%) |
| 18 to 24 Years | 9 (15.8%) | 27 (42.9%) |
| 25 to 34 Years | 15 (20.8%) | 56 (44.4%) |
| 35 to 44 Years | 0 (0.0%) | 9 (23.7%) |
| 45 to 54 Years | 23 (43.4%) | 4 (11.8%) |
| 55 to 64 Years | 33 (25.8%) | 8 (15.4%) |
| 65 to 74 Years | 0 (0.0%) | 6 (9.2%) |
| 75 Years and over | 4 (19.1%) | 11 (45.8%) |
| Total | 177 (33.8%) | 161 (29.6%) |
Income Above Poverty by Sex and Age in Clarkton
According to the poverty statistics in Clarkton, males aged 15 years and females aged 6 to 11 years are the age groups that are most secure financially, with 100.0% of males and 100.0% of females in these age groups living above the poverty line.
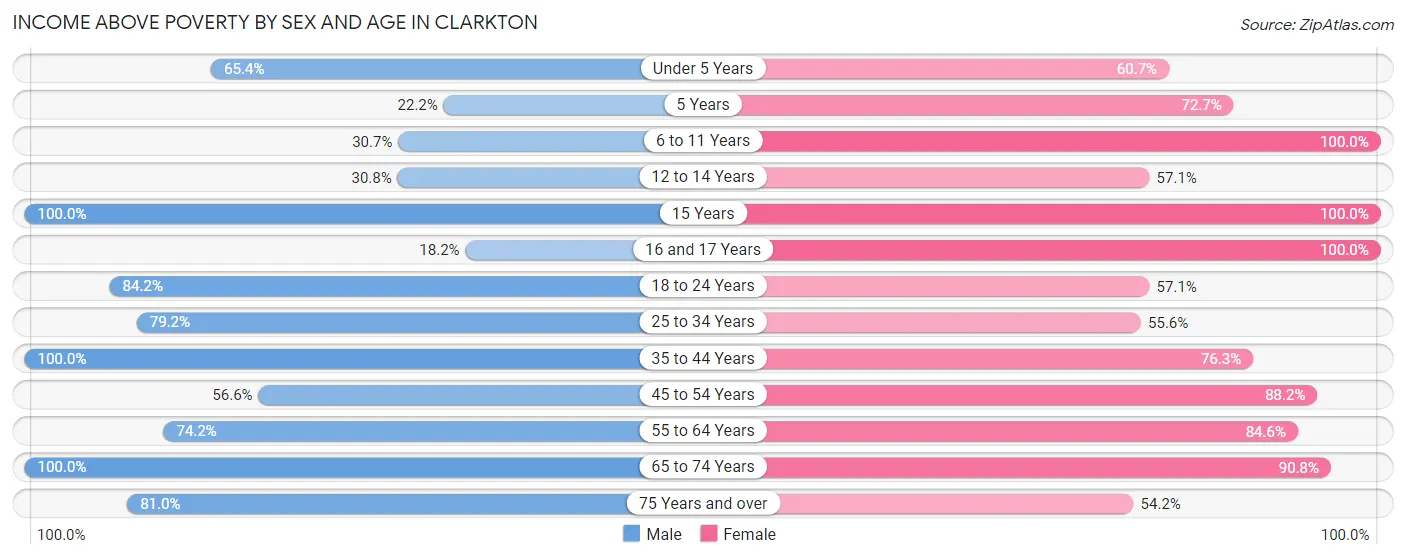
| Age Bracket | Male | Female |
| Under 5 Years | 17 (65.4%) | 34 (60.7%) |
| 5 Years | 4 (22.2%) | 8 (72.7%) |
| 6 to 11 Years | 19 (30.6%) | 25 (100.0%) |
| 12 to 14 Years | 4 (30.8%) | 20 (57.1%) |
| 15 Years | 5 (100.0%) | 8 (100.0%) |
| 16 and 17 Years | 4 (18.2%) | 7 (100.0%) |
| 18 to 24 Years | 48 (84.2%) | 36 (57.1%) |
| 25 to 34 Years | 57 (79.2%) | 70 (55.6%) |
| 35 to 44 Years | 30 (100.0%) | 29 (76.3%) |
| 45 to 54 Years | 30 (56.6%) | 30 (88.2%) |
| 55 to 64 Years | 95 (74.2%) | 44 (84.6%) |
| 65 to 74 Years | 16 (100.0%) | 59 (90.8%) |
| 75 Years and over | 17 (80.9%) | 13 (54.2%) |
| Total | 346 (66.2%) | 383 (70.4%) |
Income Below Poverty Among Married-Couple Families in Clarkton
The poverty statistics for married-couple families in Clarkton show that 8.2% or 12 of the total 147 families live below the poverty line. Families with 3 or 4 children have the highest poverty rate of 69.2%, comprising of 9 families. On the other hand, families with no children have the lowest poverty rate of 0.0%, which includes 0 families.
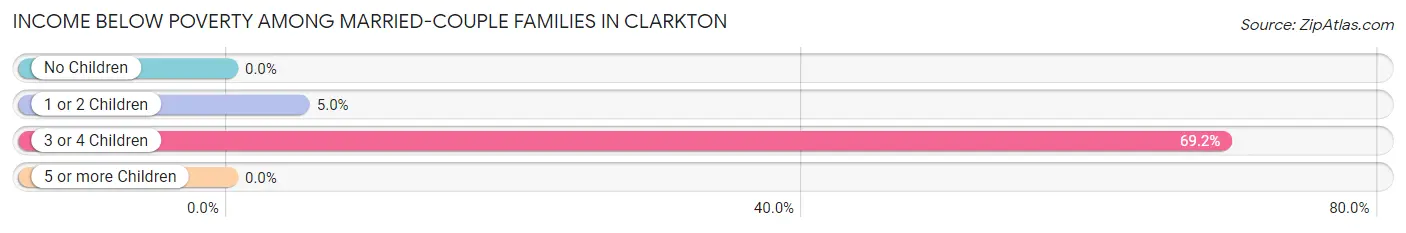
| Children | Above Poverty | Below Poverty |
| No Children | 74 (100.0%) | 0 (0.0%) |
| 1 or 2 Children | 57 (95.0%) | 3 (5.0%) |
| 3 or 4 Children | 4 (30.8%) | 9 (69.2%) |
| 5 or more Children | 0 (0.0%) | 0 (0.0%) |
| Total | 135 (91.8%) | 12 (8.2%) |
Income Below Poverty Among Single-Parent Households in Clarkton
According to the poverty data in Clarkton, 8.0% or 2 single-father households and 58.3% or 56 single-mother households are living below the poverty line. Among single-father households, those with 1 or 2 children have the highest poverty rate, with 2 households (16.7%) experiencing poverty. Likewise, among single-mother households, those with 3 or 4 children have the highest poverty rate, with 30 households (100.0%) falling below the poverty line.
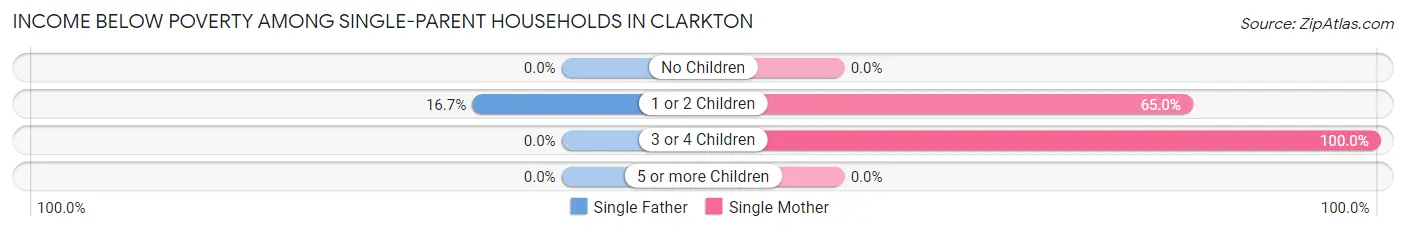
| Children | Single Father | Single Mother |
| No Children | 0 (0.0%) | 0 (0.0%) |
| 1 or 2 Children | 2 (16.7%) | 26 (65.0%) |
| 3 or 4 Children | 0 (0.0%) | 30 (100.0%) |
| 5 or more Children | 0 (0.0%) | 0 (0.0%) |
| Total | 2 (8.0%) | 56 (58.3%) |
Income Below Poverty Among Married-Couple vs Single-Parent Households in Clarkton
The poverty data for Clarkton shows that 12 of the married-couple family households (8.2%) and 58 of the single-parent households (47.9%) are living below the poverty level. Within the married-couple family households, those with 3 or 4 children have the highest poverty rate, with 9 households (69.2%) falling below the poverty line. Among the single-parent households, those with 3 or 4 children have the highest poverty rate, with 30 household (100.0%) living below poverty.
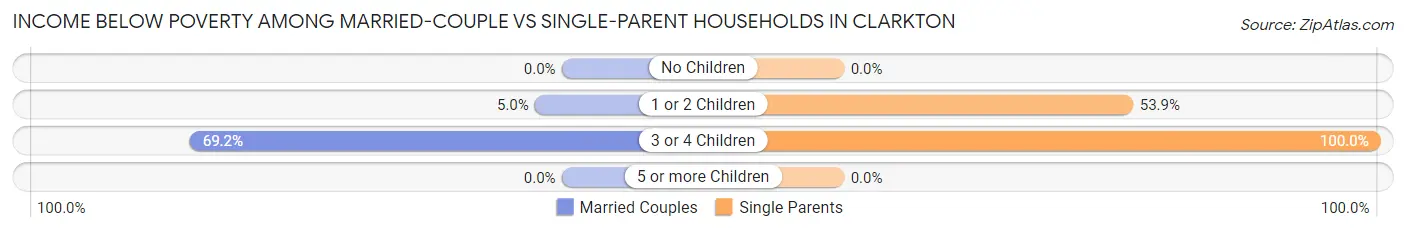
| Children | Married-Couple Families | Single-Parent Households |
| No Children | 0 (0.0%) | 0 (0.0%) |
| 1 or 2 Children | 3 (5.0%) | 28 (53.8%) |
| 3 or 4 Children | 9 (69.2%) | 30 (100.0%) |
| 5 or more Children | 0 (0.0%) | 0 (0.0%) |
| Total | 12 (8.2%) | 58 (47.9%) |
Race in Clarkton
The most populous races in Clarkton are White / Caucasian (875 | 80.0%), Hispanic or Latino (238 | 21.8%), and Two or more Races (183 | 16.7%).
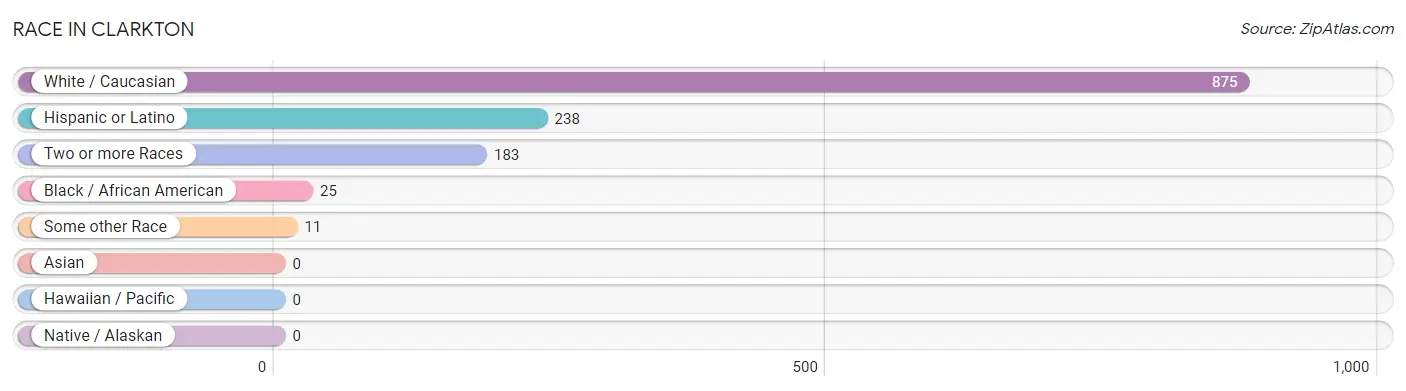
| Race | # Population | % Population |
| Asian | 0 | 0.0% |
| Black / African American | 25 | 2.3% |
| Hawaiian / Pacific | 0 | 0.0% |
| Hispanic or Latino | 238 | 21.8% |
| Native / Alaskan | 0 | 0.0% |
| White / Caucasian | 875 | 80.0% |
| Two or more Races | 183 | 16.7% |
| Some other Race | 11 | 1.0% |
| Total | 1,094 | 100.0% |
Ancestry in Clarkton
The most populous ancestries reported in Clarkton are Mexican (215 | 19.7%), Irish (193 | 17.6%), German (89 | 8.1%), Cherokee (67 | 6.1%), and American (59 | 5.4%), together accounting for 56.9% of all Clarkton residents.
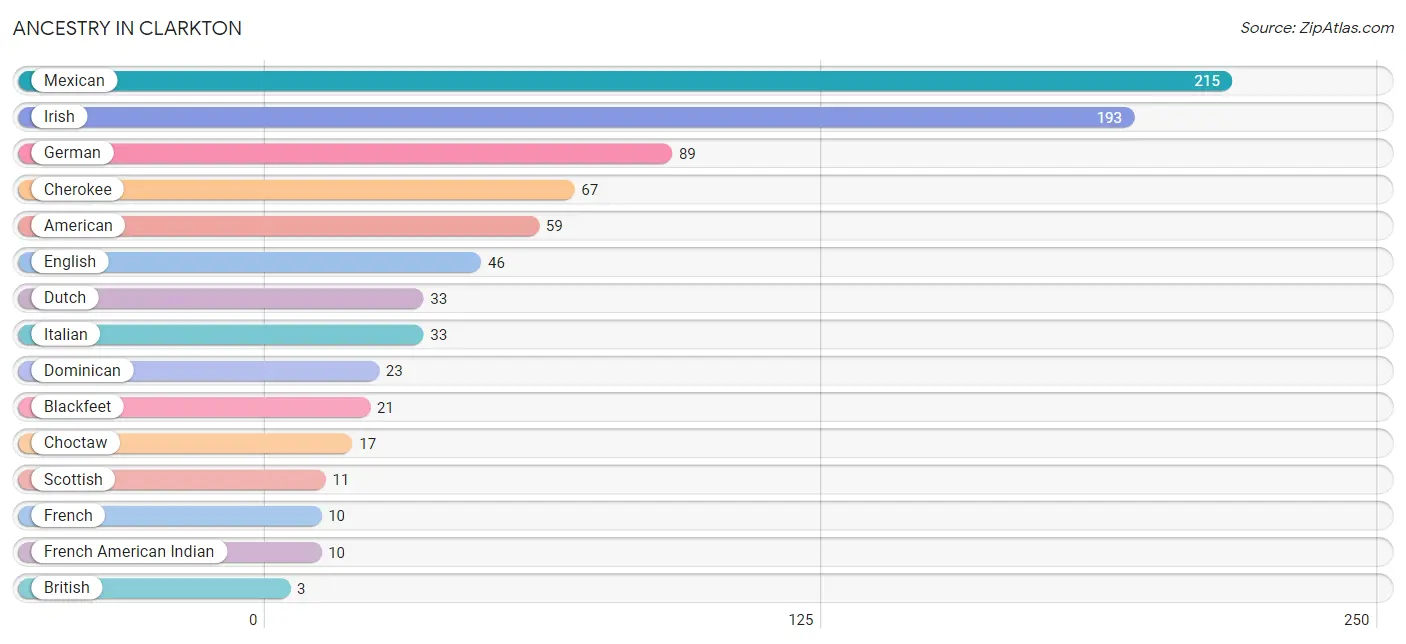
| Ancestry | # Population | % Population |
| American | 59 | 5.4% |
| Blackfeet | 21 | 1.9% |
| British | 3 | 0.3% |
| Cherokee | 67 | 6.1% |
| Choctaw | 17 | 1.5% |
| Dominican | 23 | 2.1% |
| Dutch | 33 | 3.0% |
| English | 46 | 4.2% |
| French | 10 | 0.9% |
| French American Indian | 10 | 0.9% |
| German | 89 | 8.1% |
| Irish | 193 | 17.6% |
| Italian | 33 | 3.0% |
| Mexican | 215 | 19.7% |
| Scottish | 11 | 1.0% |
| Welsh | 3 | 0.3% | View All 16 Rows |
Immigrants in Clarkton
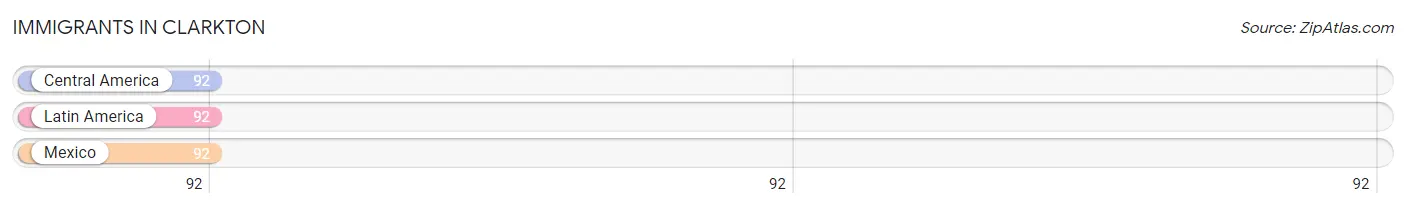
The most numerous immigrant groups reported in Clarkton came from Central America (92 | 8.4%), Latin America (92 | 8.4%), and Mexico (92 | 8.4%), together accounting for 25.2% of all Clarkton residents.
| Immigration Origin | # Population | % Population |
| Central America | 92 | 8.4% |
| Latin America | 92 | 8.4% |
| Mexico | 92 | 8.4% | View All 3 Rows |
Sex and Age in Clarkton
Sex and Age in Clarkton
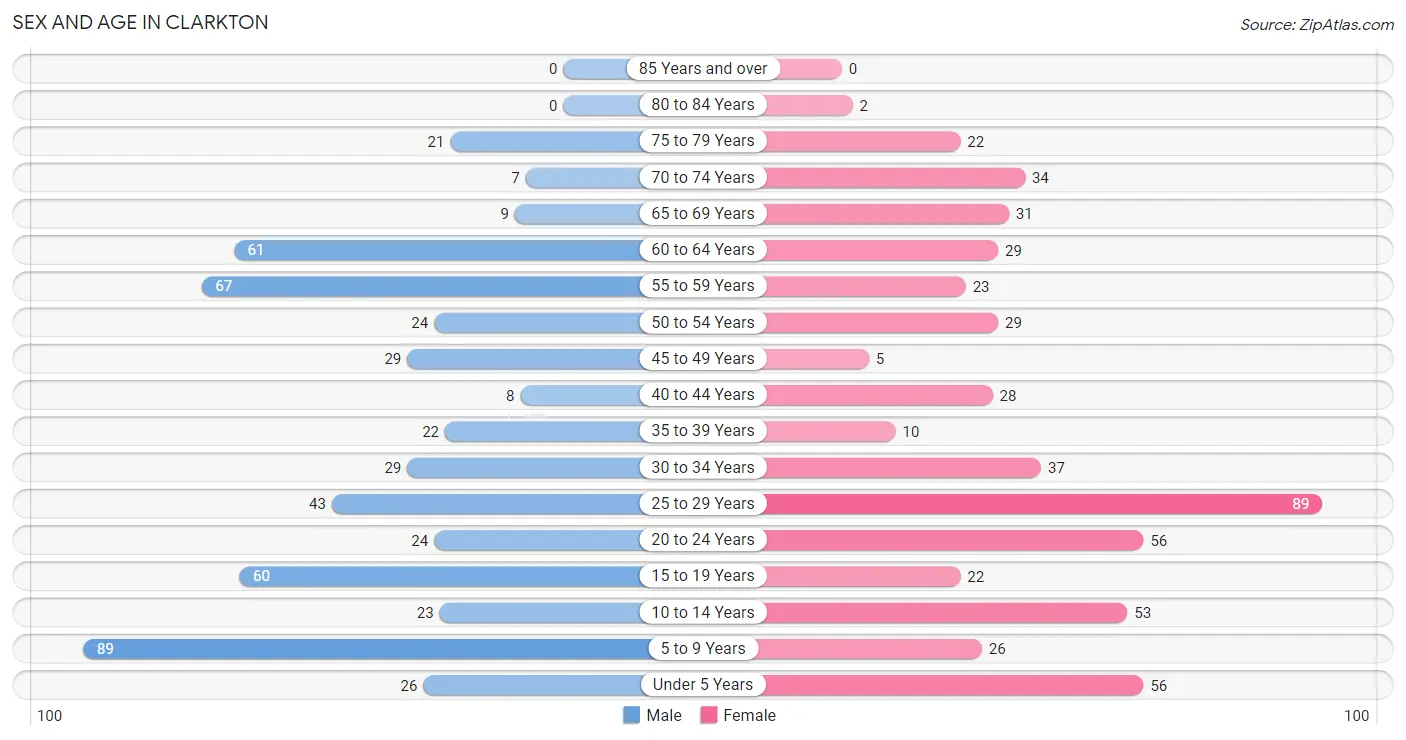
The most populous age groups in Clarkton are 5 to 9 Years (89 | 16.4%) for men and 25 to 29 Years (89 | 16.1%) for women.
| Age Bracket | Male | Female |
| Under 5 Years | 26 (4.8%) | 56 (10.1%) |
| 5 to 9 Years | 89 (16.4%) | 26 (4.7%) |
| 10 to 14 Years | 23 (4.2%) | 53 (9.6%) |
| 15 to 19 Years | 60 (11.1%) | 22 (4.0%) |
| 20 to 24 Years | 24 (4.4%) | 56 (10.1%) |
| 25 to 29 Years | 43 (7.9%) | 89 (16.1%) |
| 30 to 34 Years | 29 (5.3%) | 37 (6.7%) |
| 35 to 39 Years | 22 (4.1%) | 10 (1.8%) |
| 40 to 44 Years | 8 (1.5%) | 28 (5.1%) |
| 45 to 49 Years | 29 (5.3%) | 5 (0.9%) |
| 50 to 54 Years | 24 (4.4%) | 29 (5.2%) |
| 55 to 59 Years | 67 (12.4%) | 23 (4.2%) |
| 60 to 64 Years | 61 (11.3%) | 29 (5.2%) |
| 65 to 69 Years | 9 (1.7%) | 31 (5.6%) |
| 70 to 74 Years | 7 (1.3%) | 34 (6.2%) |
| 75 to 79 Years | 21 (3.9%) | 22 (4.0%) |
| 80 to 84 Years | 0 (0.0%) | 2 (0.4%) |
| 85 Years and over | 0 (0.0%) | 0 (0.0%) |
| Total | 542 (100.0%) | 552 (100.0%) |
Families and Households in Clarkton
Median Family Size in Clarkton
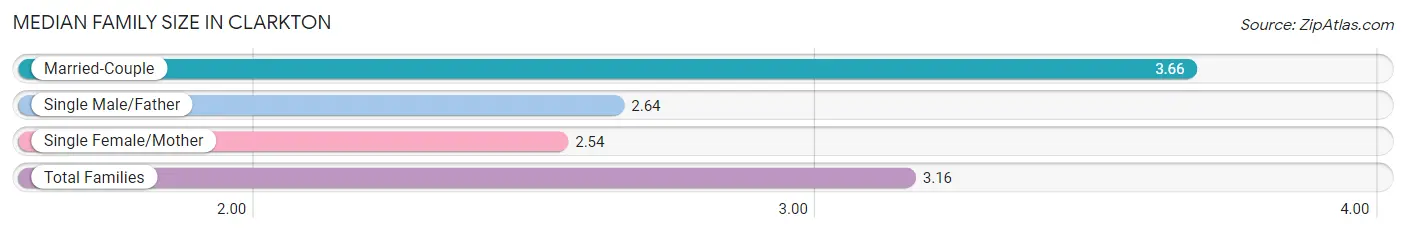
The median family size in Clarkton is 3.16 persons per family, with married-couple families (147 | 54.8%) accounting for the largest median family size of 3.66 persons per family. On the other hand, single female/mother families (96 | 35.8%) represent the smallest median family size with 2.54 persons per family.
| Family Type | # Families | Family Size |
| Married-Couple | 147 (54.8%) | 3.66 |
| Single Male/Father | 25 (9.3%) | 2.64 |
| Single Female/Mother | 96 (35.8%) | 2.54 |
| Total Families | 268 (100.0%) | 3.16 |
Median Household Size in Clarkton
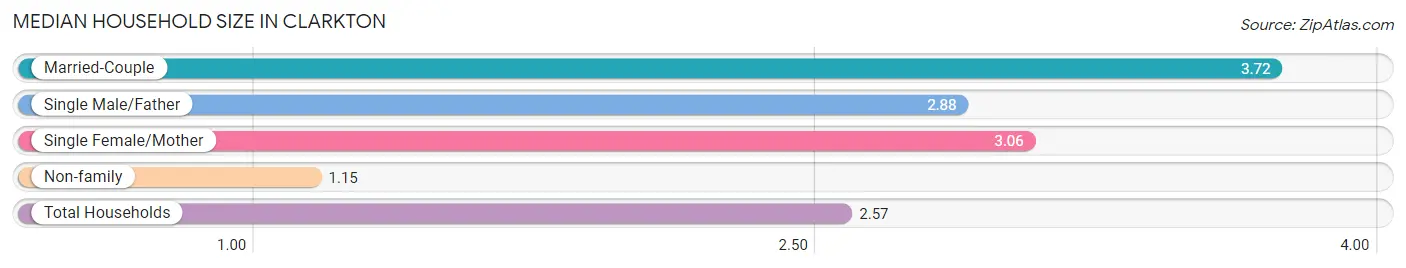
The median household size in Clarkton is 2.57 persons per household, with married-couple households (147 | 34.6%) accounting for the largest median household size of 3.72 persons per household. non-family households (157 | 36.9%) represent the smallest median household size with 1.15 persons per household.
| Household Type | # Households | Household Size |
| Married-Couple | 147 (34.6%) | 3.72 |
| Single Male/Father | 25 (5.9%) | 2.88 |
| Single Female/Mother | 96 (22.6%) | 3.06 |
| Non-family | 157 (36.9%) | 1.15 |
| Total Households | 425 (100.0%) | 2.57 |
Household Size by Marriage Status in Clarkton
Out of a total of 425 households in Clarkton, 268 (63.1%) are family households, while 157 (36.9%) are nonfamily households. The most numerous type of family households are 2-person households, comprising 107, and the most common type of nonfamily households are 1-person households, comprising 134.
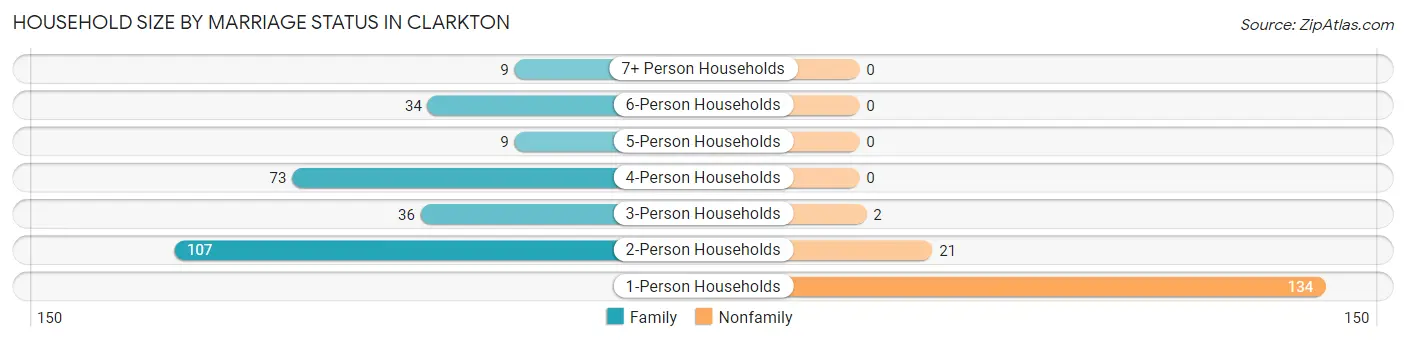
| Household Size | Family Households | Nonfamily Households |
| 1-Person Households | - | 134 (31.5%) |
| 2-Person Households | 107 (25.2%) | 21 (4.9%) |
| 3-Person Households | 36 (8.5%) | 2 (0.5%) |
| 4-Person Households | 73 (17.2%) | 0 (0.0%) |
| 5-Person Households | 9 (2.1%) | 0 (0.0%) |
| 6-Person Households | 34 (8.0%) | 0 (0.0%) |
| 7+ Person Households | 9 (2.1%) | 0 (0.0%) |
| Total | 268 (63.1%) | 157 (36.9%) |
Female Fertility in Clarkton
Fertility by Age in Clarkton
Average fertility rate in Clarkton is 84.0 births per 1,000 women. Women in the age bracket of 20 to 34 years have the highest fertility rate with 115.0 births per 1,000 women. Women in the age bracket of 20 to 34 years acount for 100.0% of all women with births.
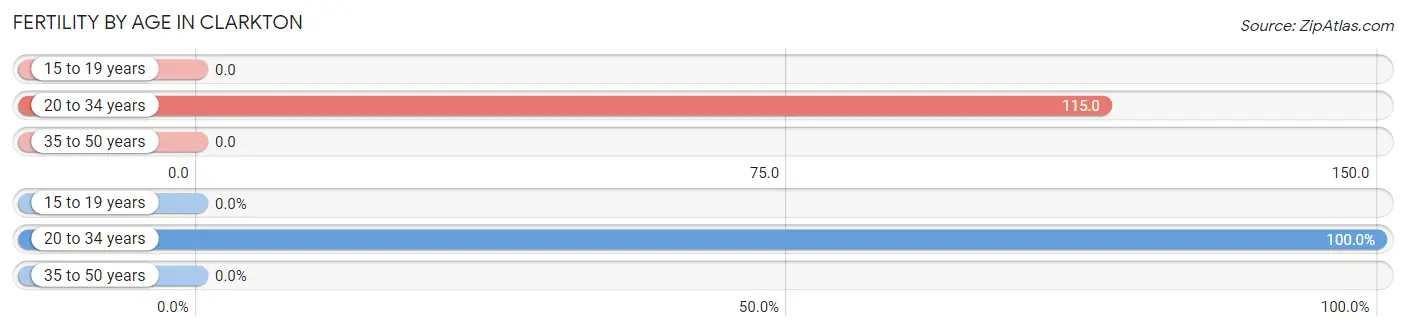
| Age Bracket | Women with Births | Births / 1,000 Women |
| 15 to 19 years | 0 (0.0%) | 0.0 |
| 20 to 34 years | 21 (100.0%) | 115.0 |
| 35 to 50 years | 0 (0.0%) | 0.0 |
| Total | 21 (100.0%) | 84.0 |
Fertility by Age by Marriage Status in Clarkton
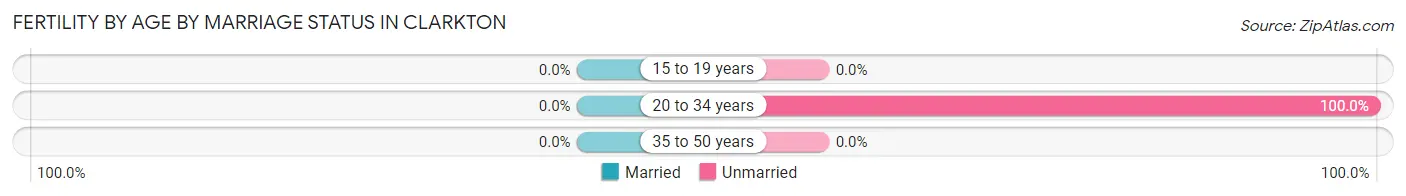
| Age Bracket | Married | Unmarried |
| 15 to 19 years | 0 (0.0%) | 0 (0.0%) |
| 20 to 34 years | 0 (0.0%) | 21 (100.0%) |
| 35 to 50 years | 0 (0.0%) | 0 (0.0%) |
| Total | 0 (0.0%) | 21 (100.0%) |
Fertility by Education in Clarkton
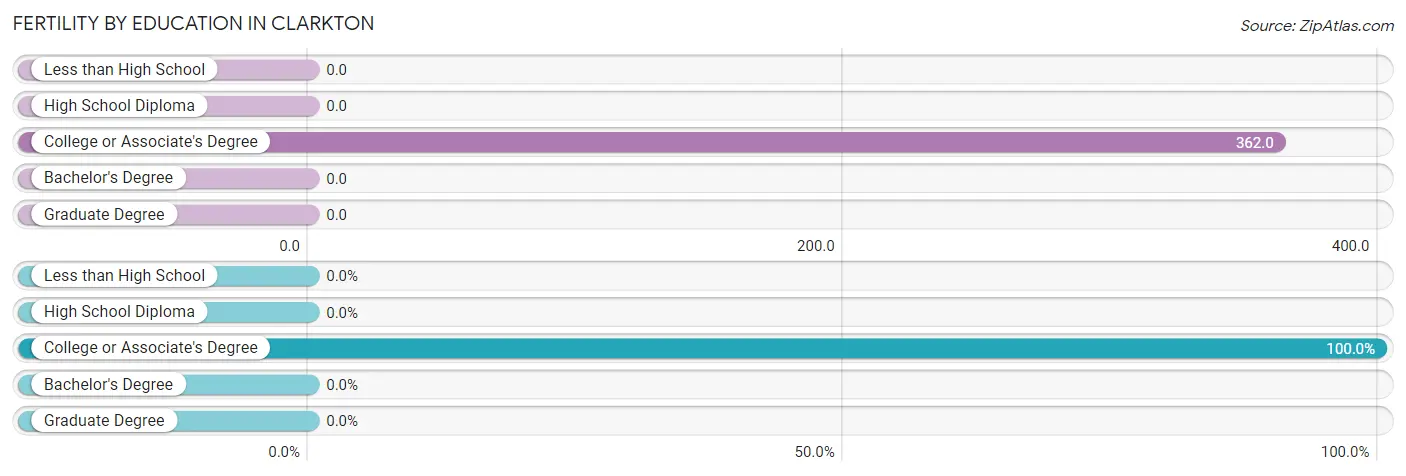
| Educational Attainment | Women with Births | Births / 1,000 Women |
| Less than High School | 0 (0.0%) | 0.0 |
| High School Diploma | 0 (0.0%) | 0.0 |
| College or Associate's Degree | 21 (100.0%) | 362.0 |
| Bachelor's Degree | 0 (0.0%) | 0.0 |
| Graduate Degree | 0 (0.0%) | 0.0 |
| Total | 21 (100.0%) | 84.0 |
Fertility by Education by Marriage Status in Clarkton
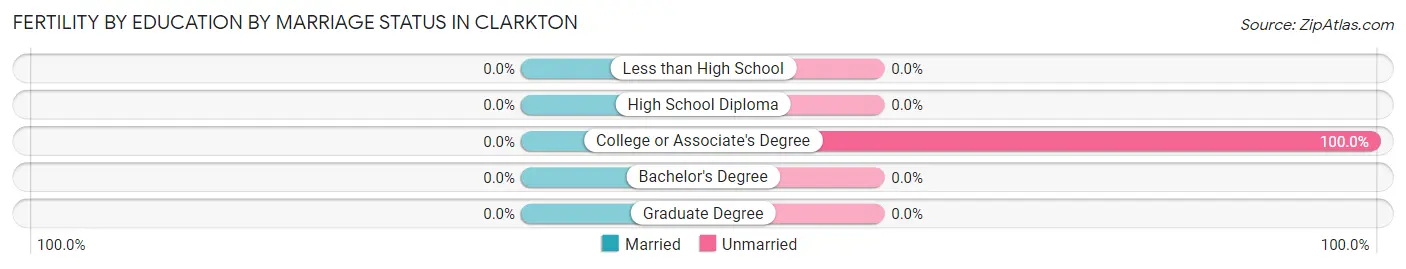
| Educational Attainment | Married | Unmarried |
| Less than High School | 0 (0.0%) | 0 (0.0%) |
| High School Diploma | 0 (0.0%) | 0 (0.0%) |
| College or Associate's Degree | 0 (0.0%) | 21 (100.0%) |
| Bachelor's Degree | 0 (0.0%) | 0 (0.0%) |
| Graduate Degree | 0 (0.0%) | 0 (0.0%) |
| Total | 0 (0.0%) | 21 (100.0%) |
Employment Characteristics in Clarkton
Employment by Class of Employer in Clarkton
Among the 399 employed individuals in Clarkton, private company employees (248 | 62.2%), not-for-profit organizations (56 | 14.0%), and self-employed (not incorporated) (34 | 8.5%) make up the most common classes of employment.
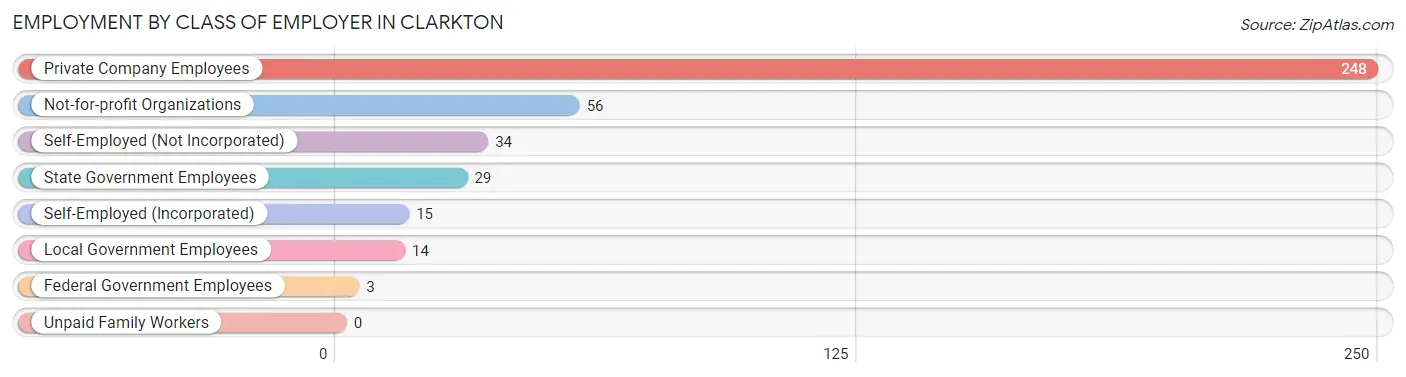
| Employer Class | # Employees | % Employees |
| Private Company Employees | 248 | 62.2% |
| Self-Employed (Incorporated) | 15 | 3.8% |
| Self-Employed (Not Incorporated) | 34 | 8.5% |
| Not-for-profit Organizations | 56 | 14.0% |
| Local Government Employees | 14 | 3.5% |
| State Government Employees | 29 | 7.3% |
| Federal Government Employees | 3 | 0.7% |
| Unpaid Family Workers | 0 | 0.0% |
| Total | 399 | 100.0% |
Employment Status by Age in Clarkton
According to the labor force statistics for Clarkton, out of the total population over 16 years of age (808), 51.9% or 419 individuals are in the labor force, with 2.6% or 11 of them unemployed. The age group with the highest labor force participation rate is 30 to 34 years, with 100.0% or 66 individuals in the labor force. Within the labor force, the 25 to 29 years age range has the highest percentage of unemployed individuals, with 16.7% or 11 of them being unemployed.
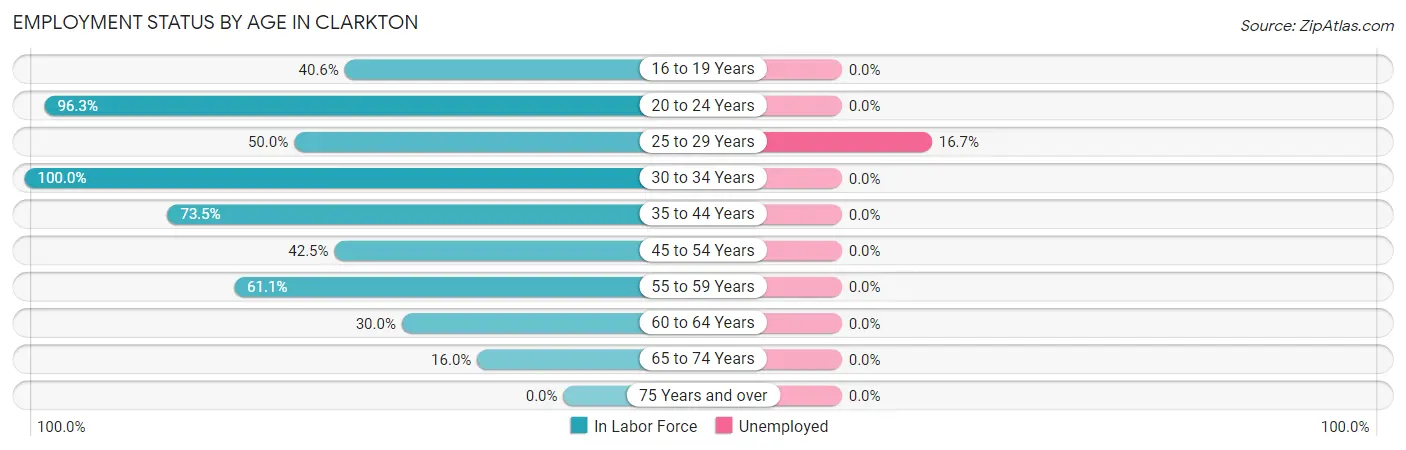
| Age Bracket | In Labor Force | Unemployed |
| 16 to 19 Years | 28 (40.6%) | 0 (0.0%) |
| 20 to 24 Years | 77 (96.3%) | 0 (0.0%) |
| 25 to 29 Years | 66 (50.0%) | 11 (16.7%) |
| 30 to 34 Years | 66 (100.0%) | 0 (0.0%) |
| 35 to 44 Years | 50 (73.5%) | 0 (0.0%) |
| 45 to 54 Years | 37 (42.5%) | 0 (0.0%) |
| 55 to 59 Years | 55 (61.1%) | 0 (0.0%) |
| 60 to 64 Years | 27 (30.0%) | 0 (0.0%) |
| 65 to 74 Years | 13 (16.0%) | 0 (0.0%) |
| 75 Years and over | 0 (0.0%) | 0 (0.0%) |
| Total | 419 (51.9%) | 11 (2.6%) |
Employment Status by Educational Attainment in Clarkton
According to labor force statistics for Clarkton, 56.5% of individuals (301) out of the total population between 25 and 64 years of age (533) are in the labor force, with 3.7% or 11 of them being unemployed. The group with the highest labor force participation rate are those with the educational attainment of bachelor's degree or higher, with 94.0% or 47 individuals in the labor force. Within the labor force, individuals with high school diploma education have the highest percentage of unemployment, with 7.0% or 11 of them being unemployed.
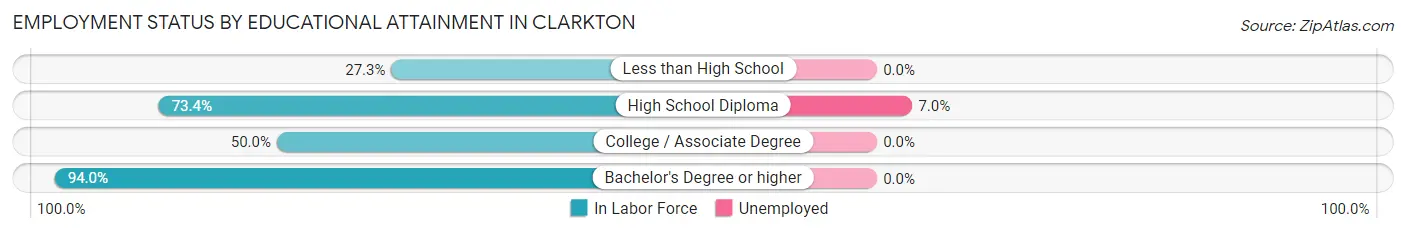
| Educational Attainment | In Labor Force | Unemployed |
| Less than High School | 45 (27.3%) | 0 (0.0%) |
| High School Diploma | 157 (73.4%) | 15 (7.0%) |
| College / Associate Degree | 52 (50.0%) | 0 (0.0%) |
| Bachelor's Degree or higher | 47 (94.0%) | 0 (0.0%) |
| Total | 301 (56.5%) | 20 (3.7%) |
Employment Occupations by Sex in Clarkton
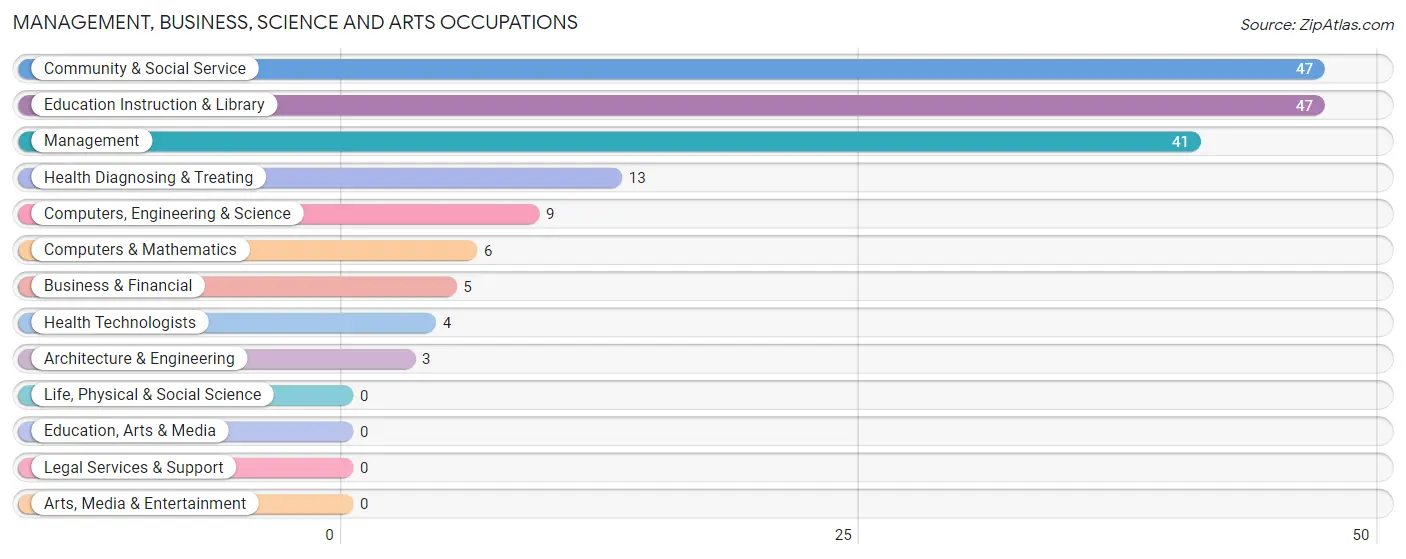
Management, Business, Science and Arts Occupations
The most common Management, Business, Science and Arts occupations in Clarkton are Community & Social Service (47 | 11.5%), Education Instruction & Library (47 | 11.5%), Management (41 | 10.1%), Health Diagnosing & Treating (13 | 3.2%), and Computers, Engineering & Science (9 | 2.2%).
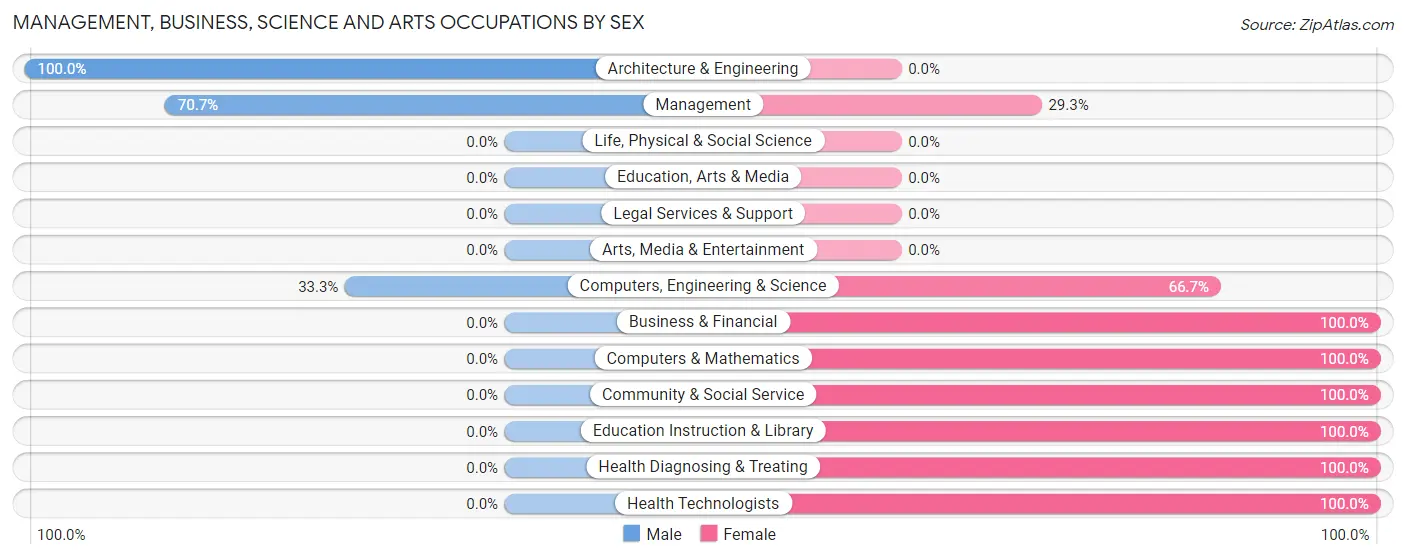
Management, Business, Science and Arts Occupations by Sex
Within the Management, Business, Science and Arts occupations in Clarkton, the most male-oriented occupations are Architecture & Engineering (100.0%), Management (70.7%), and Computers, Engineering & Science (33.3%), while the most female-oriented occupations are Business & Financial (100.0%), Computers & Mathematics (100.0%), and Community & Social Service (100.0%).
| Occupation | Male | Female |
| Management | 29 (70.7%) | 12 (29.3%) |
| Business & Financial | 0 (0.0%) | 5 (100.0%) |
| Computers, Engineering & Science | 3 (33.3%) | 6 (66.7%) |
| Computers & Mathematics | 0 (0.0%) | 6 (100.0%) |
| Architecture & Engineering | 3 (100.0%) | 0 (0.0%) |
| Life, Physical & Social Science | 0 (0.0%) | 0 (0.0%) |
| Community & Social Service | 0 (0.0%) | 47 (100.0%) |
| Education, Arts & Media | 0 (0.0%) | 0 (0.0%) |
| Legal Services & Support | 0 (0.0%) | 0 (0.0%) |
| Education Instruction & Library | 0 (0.0%) | 47 (100.0%) |
| Arts, Media & Entertainment | 0 (0.0%) | 0 (0.0%) |
| Health Diagnosing & Treating | 0 (0.0%) | 13 (100.0%) |
| Health Technologists | 0 (0.0%) | 4 (100.0%) |
| Total (Category) | 32 (27.8%) | 83 (72.2%) |
| Total (Overall) | 205 (50.2%) | 203 (49.7%) |
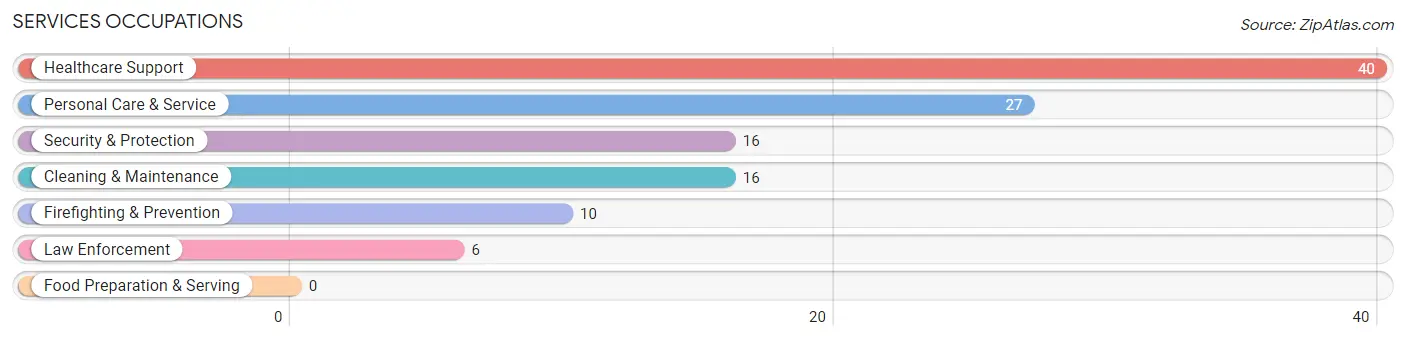
Services Occupations
The most common Services occupations in Clarkton are Healthcare Support (40 | 9.8%), Personal Care & Service (27 | 6.6%), Security & Protection (16 | 3.9%), Cleaning & Maintenance (16 | 3.9%), and Firefighting & Prevention (10 | 2.5%).
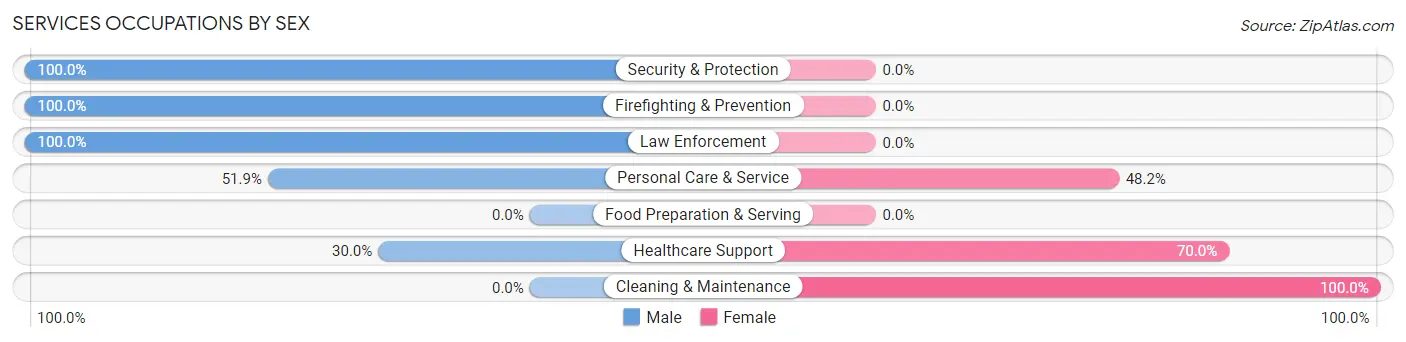
Services Occupations by Sex
Within the Services occupations in Clarkton, the most male-oriented occupations are Security & Protection (100.0%), Firefighting & Prevention (100.0%), and Law Enforcement (100.0%), while the most female-oriented occupations are Cleaning & Maintenance (100.0%), Healthcare Support (70.0%), and Personal Care & Service (48.1%).
| Occupation | Male | Female |
| Healthcare Support | 12 (30.0%) | 28 (70.0%) |
| Security & Protection | 16 (100.0%) | 0 (0.0%) |
| Firefighting & Prevention | 10 (100.0%) | 0 (0.0%) |
| Law Enforcement | 6 (100.0%) | 0 (0.0%) |
| Food Preparation & Serving | 0 (0.0%) | 0 (0.0%) |
| Cleaning & Maintenance | 0 (0.0%) | 16 (100.0%) |
| Personal Care & Service | 14 (51.8%) | 13 (48.1%) |
| Total (Category) | 42 (42.4%) | 57 (57.6%) |
| Total (Overall) | 205 (50.2%) | 203 (49.7%) |
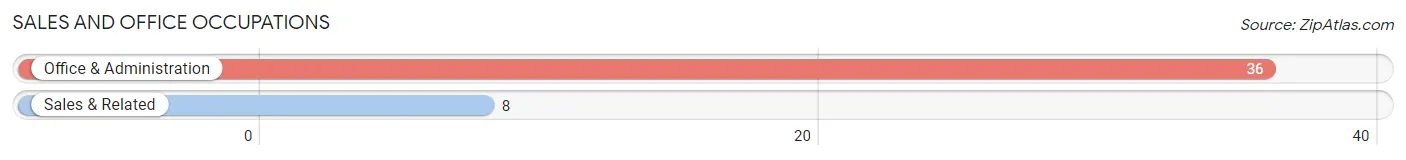
Sales and Office Occupations
The most common Sales and Office occupations in Clarkton are Office & Administration (36 | 8.8%), and Sales & Related (8 | 2.0%).
Sales and Office Occupations by Sex
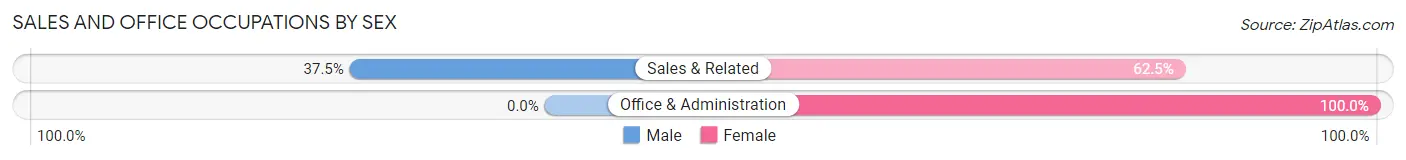
| Occupation | Male | Female |
| Sales & Related | 3 (37.5%) | 5 (62.5%) |
| Office & Administration | 0 (0.0%) | 36 (100.0%) |
| Total (Category) | 3 (6.8%) | 41 (93.2%) |
| Total (Overall) | 205 (50.2%) | 203 (49.7%) |
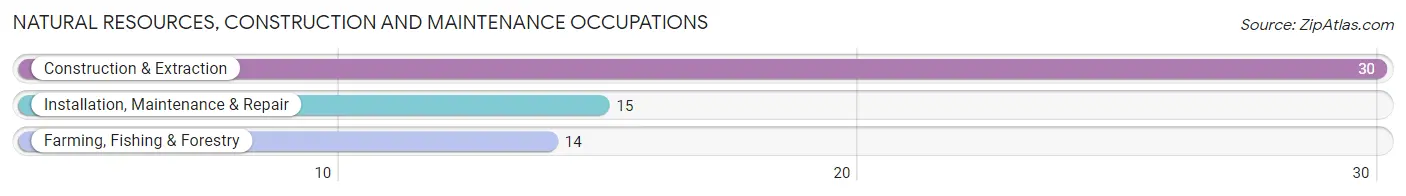
Natural Resources, Construction and Maintenance Occupations
The most common Natural Resources, Construction and Maintenance occupations in Clarkton are Construction & Extraction (30 | 7.3%), Installation, Maintenance & Repair (15 | 3.7%), and Farming, Fishing & Forestry (14 | 3.4%).
Natural Resources, Construction and Maintenance Occupations by Sex
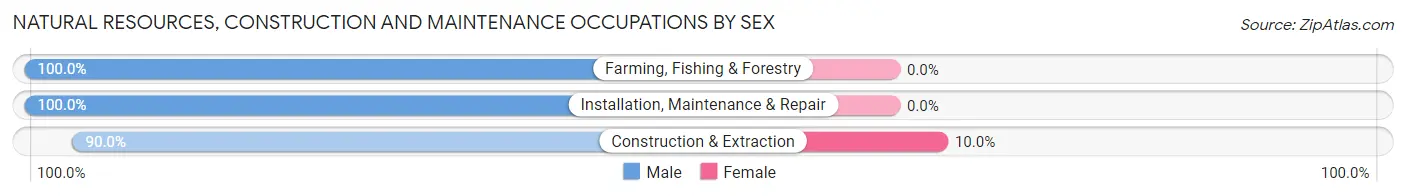
| Occupation | Male | Female |
| Farming, Fishing & Forestry | 14 (100.0%) | 0 (0.0%) |
| Construction & Extraction | 27 (90.0%) | 3 (10.0%) |
| Installation, Maintenance & Repair | 15 (100.0%) | 0 (0.0%) |
| Total (Category) | 56 (94.9%) | 3 (5.1%) |
| Total (Overall) | 205 (50.2%) | 203 (49.7%) |
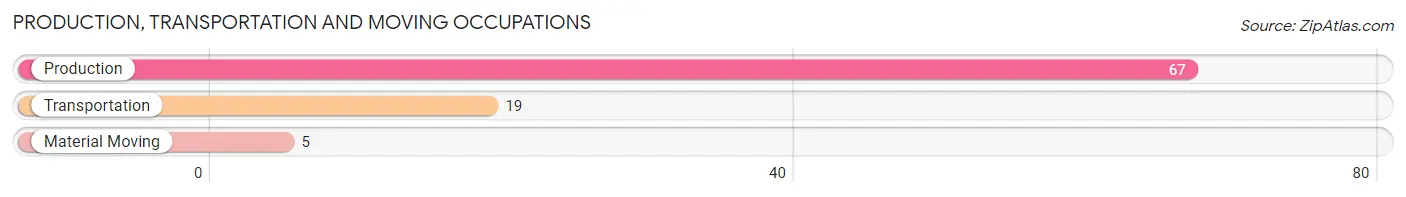
Production, Transportation and Moving Occupations
The most common Production, Transportation and Moving occupations in Clarkton are Production (67 | 16.4%), Transportation (19 | 4.7%), and Material Moving (5 | 1.2%).
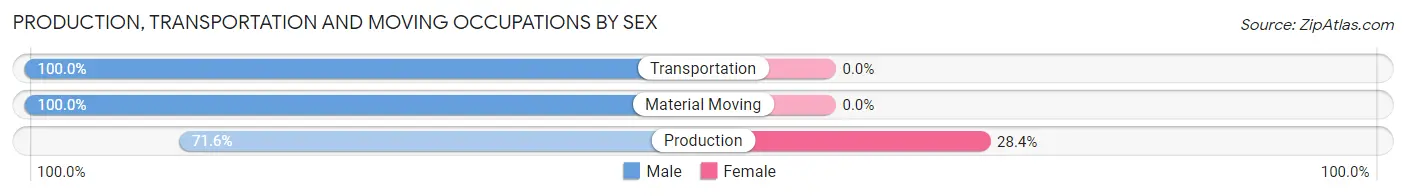
Production, Transportation and Moving Occupations by Sex
| Occupation | Male | Female |
| Production | 48 (71.6%) | 19 (28.4%) |
| Transportation | 19 (100.0%) | 0 (0.0%) |
| Material Moving | 5 (100.0%) | 0 (0.0%) |
| Total (Category) | 72 (79.1%) | 19 (20.9%) |
| Total (Overall) | 205 (50.2%) | 203 (49.7%) |
Employment Industries by Sex in Clarkton
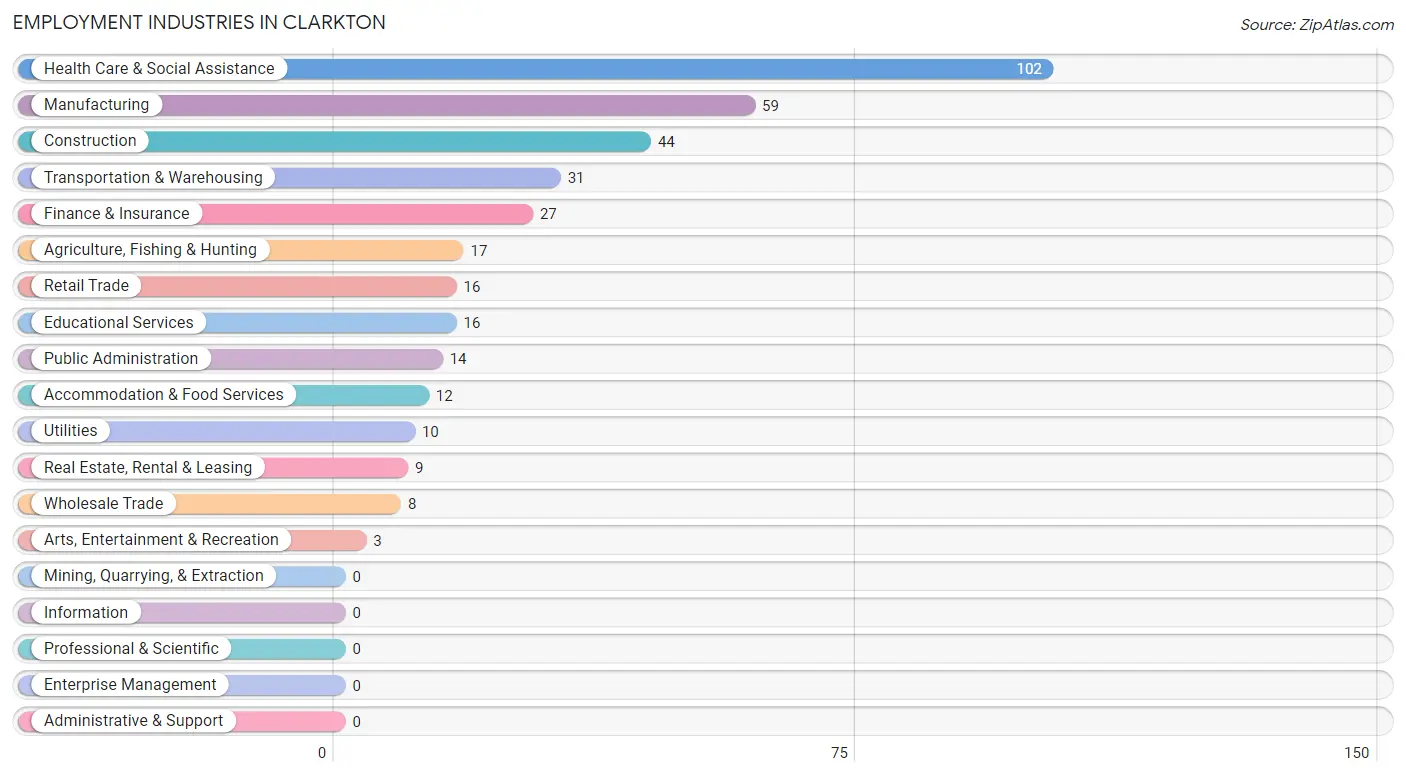
Employment Industries in Clarkton
The major employment industries in Clarkton include Health Care & Social Assistance (102 | 25.0%), Manufacturing (59 | 14.5%), Construction (44 | 10.8%), Transportation & Warehousing (31 | 7.6%), and Finance & Insurance (27 | 6.6%).
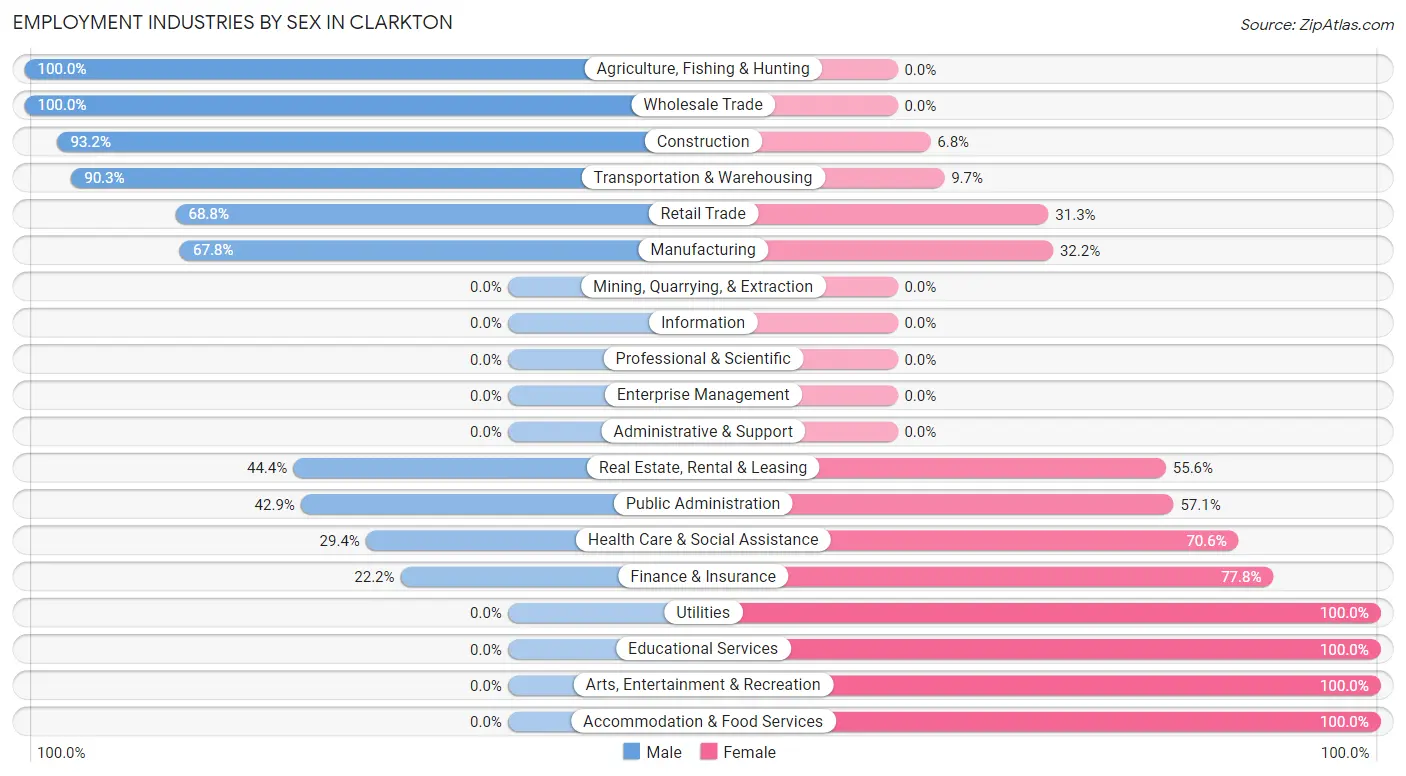
Employment Industries by Sex in Clarkton
The Clarkton industries that see more men than women are Agriculture, Fishing & Hunting (100.0%), Wholesale Trade (100.0%), and Construction (93.2%), whereas the industries that tend to have a higher number of women are Utilities (100.0%), Educational Services (100.0%), and Arts, Entertainment & Recreation (100.0%).
| Industry | Male | Female |
| Agriculture, Fishing & Hunting | 17 (100.0%) | 0 (0.0%) |
| Mining, Quarrying, & Extraction | 0 (0.0%) | 0 (0.0%) |
| Construction | 41 (93.2%) | 3 (6.8%) |
| Manufacturing | 40 (67.8%) | 19 (32.2%) |
| Wholesale Trade | 8 (100.0%) | 0 (0.0%) |
| Retail Trade | 11 (68.8%) | 5 (31.2%) |
| Transportation & Warehousing | 28 (90.3%) | 3 (9.7%) |
| Utilities | 0 (0.0%) | 10 (100.0%) |
| Information | 0 (0.0%) | 0 (0.0%) |
| Finance & Insurance | 6 (22.2%) | 21 (77.8%) |
| Real Estate, Rental & Leasing | 4 (44.4%) | 5 (55.6%) |
| Professional & Scientific | 0 (0.0%) | 0 (0.0%) |
| Enterprise Management | 0 (0.0%) | 0 (0.0%) |
| Administrative & Support | 0 (0.0%) | 0 (0.0%) |
| Educational Services | 0 (0.0%) | 16 (100.0%) |
| Health Care & Social Assistance | 30 (29.4%) | 72 (70.6%) |
| Arts, Entertainment & Recreation | 0 (0.0%) | 3 (100.0%) |
| Accommodation & Food Services | 0 (0.0%) | 12 (100.0%) |
| Public Administration | 6 (42.9%) | 8 (57.1%) |
| Total | 205 (50.2%) | 203 (49.7%) |
Education in Clarkton
School Enrollment in Clarkton
The most common levels of schooling among the 260 students in Clarkton are elementary school (86 | 33.1%), middle school (49 | 18.9%), and college / undergraduate (40 | 15.4%).
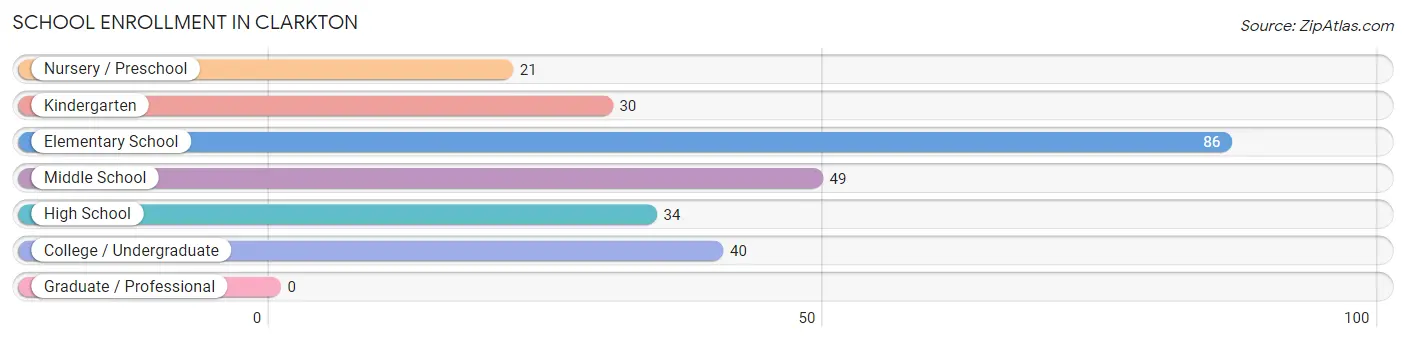
| School Level | # Students | % Students |
| Nursery / Preschool | 21 | 8.1% |
| Kindergarten | 30 | 11.5% |
| Elementary School | 86 | 33.1% |
| Middle School | 49 | 18.9% |
| High School | 34 | 13.1% |
| College / Undergraduate | 40 | 15.4% |
| Graduate / Professional | 0 | 0.0% |
| Total | 260 | 100.0% |
School Enrollment by Age by Funding Source in Clarkton
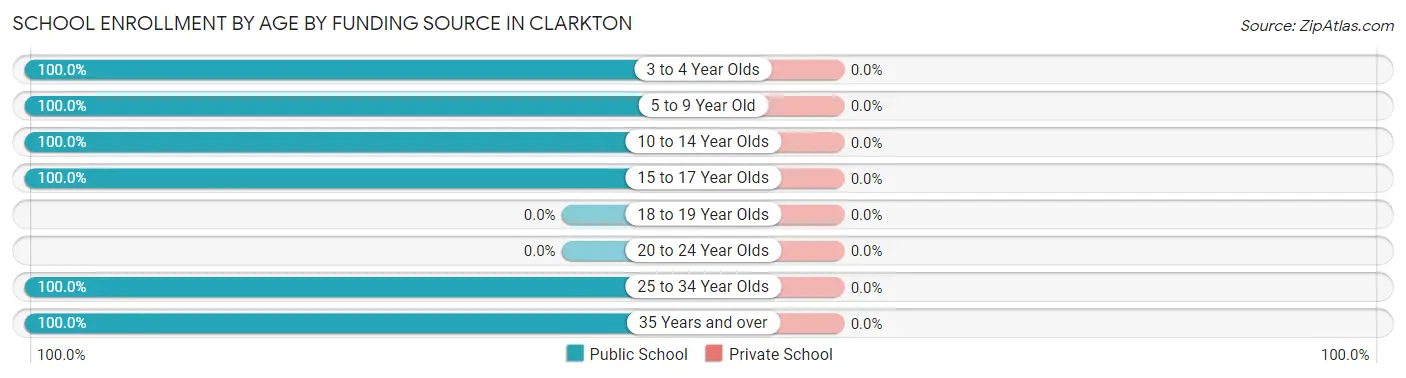
| Age Bracket | Public School | Private School |
| 3 to 4 Year Olds | 16 (100.0%) | 0 (0.0%) |
| 5 to 9 Year Old | 103 (100.0%) | 0 (0.0%) |
| 10 to 14 Year Olds | 62 (100.0%) | 0 (0.0%) |
| 15 to 17 Year Olds | 39 (100.0%) | 0 (0.0%) |
| 18 to 19 Year Olds | 0 (0.0%) | 0 (0.0%) |
| 20 to 24 Year Olds | 0 (0.0%) | 0 (0.0%) |
| 25 to 34 Year Olds | 36 (100.0%) | 0 (0.0%) |
| 35 Years and over | 4 (100.0%) | 0 (0.0%) |
| Total | 260 (100.0%) | 0 (0.0%) |
Educational Attainment by Field of Study in Clarkton
Education (21 | 38.2%), liberal arts & history (18 | 32.7%), arts & humanities (8 | 14.5%), business (5 | 9.1%), and bio, nature & agricultural (3 | 5.4%) are the most common fields of study among 55 individuals in Clarkton who have obtained a bachelor's degree or higher.
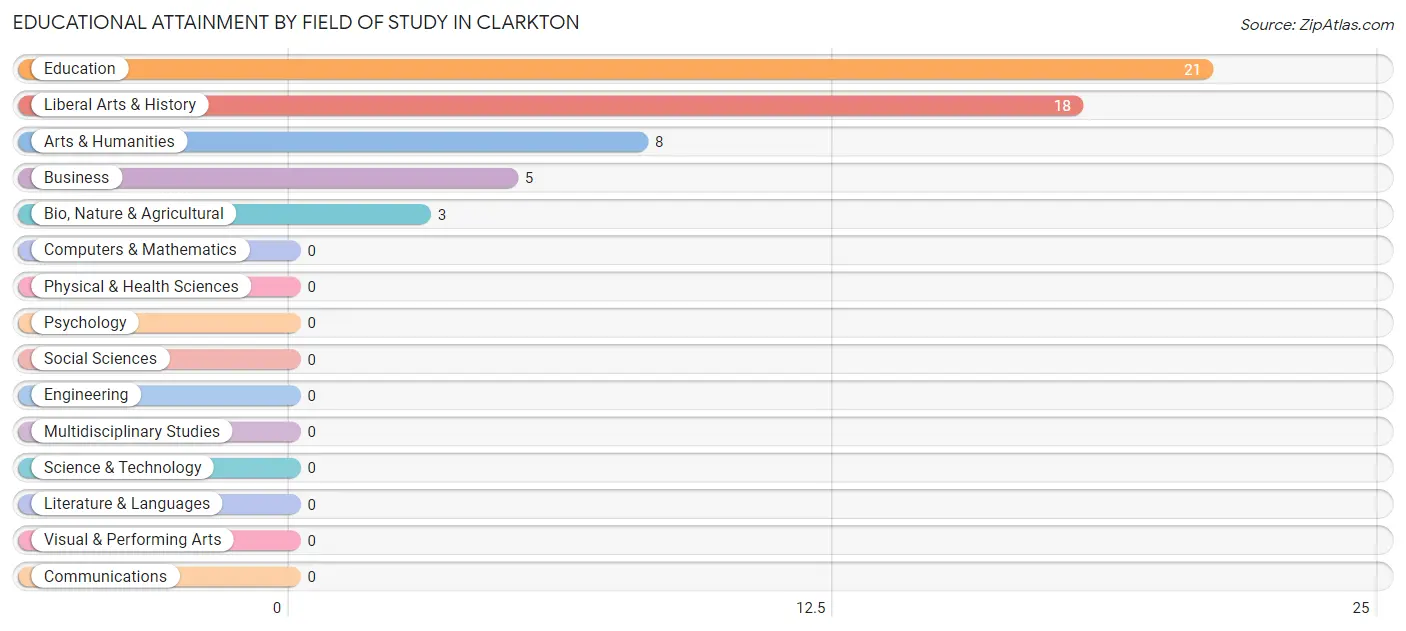
| Field of Study | # Graduates | % Graduates |
| Computers & Mathematics | 0 | 0.0% |
| Bio, Nature & Agricultural | 3 | 5.4% |
| Physical & Health Sciences | 0 | 0.0% |
| Psychology | 0 | 0.0% |
| Social Sciences | 0 | 0.0% |
| Engineering | 0 | 0.0% |
| Multidisciplinary Studies | 0 | 0.0% |
| Science & Technology | 0 | 0.0% |
| Business | 5 | 9.1% |
| Education | 21 | 38.2% |
| Literature & Languages | 0 | 0.0% |
| Liberal Arts & History | 18 | 32.7% |
| Visual & Performing Arts | 0 | 0.0% |
| Communications | 0 | 0.0% |
| Arts & Humanities | 8 | 14.5% |
| Total | 55 | 100.0% |
Transportation & Commute in Clarkton
Vehicle Availability by Sex in Clarkton
The most prevalent vehicle ownership categories in Clarkton are males with 3 vehicles (70, accounting for 34.2%) and females with 3 vehicles (68, making up 36.1%).
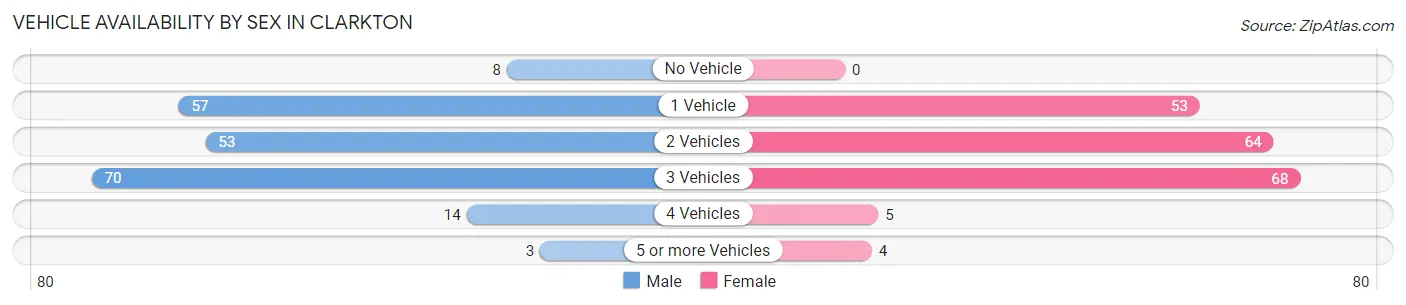
| Vehicles Available | Male | Female |
| No Vehicle | 8 (3.9%) | 0 (0.0%) |
| 1 Vehicle | 57 (27.8%) | 53 (27.3%) |
| 2 Vehicles | 53 (25.9%) | 64 (33.0%) |
| 3 Vehicles | 70 (34.2%) | 68 (35.0%) |
| 4 Vehicles | 14 (6.8%) | 5 (2.6%) |
| 5 or more Vehicles | 3 (1.5%) | 4 (2.1%) |
| Total | 205 (100.0%) | 194 (100.0%) |
Commute Time in Clarkton
The most frequently occuring commute durations in Clarkton are 5 to 9 minutes (72 commuters, 19.0%), 30 to 34 minutes (64 commuters, 16.8%), and less than 5 minutes (43 commuters, 11.3%).
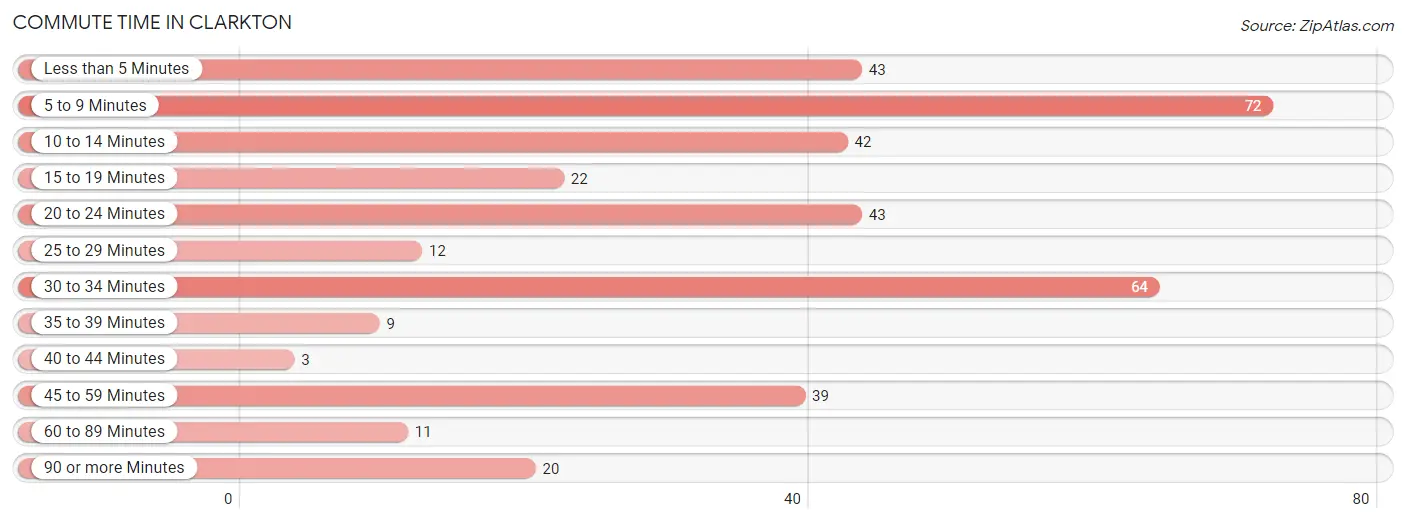
| Commute Time | # Commuters | % Commuters |
| Less than 5 Minutes | 43 | 11.3% |
| 5 to 9 Minutes | 72 | 19.0% |
| 10 to 14 Minutes | 42 | 11.1% |
| 15 to 19 Minutes | 22 | 5.8% |
| 20 to 24 Minutes | 43 | 11.3% |
| 25 to 29 Minutes | 12 | 3.2% |
| 30 to 34 Minutes | 64 | 16.8% |
| 35 to 39 Minutes | 9 | 2.4% |
| 40 to 44 Minutes | 3 | 0.8% |
| 45 to 59 Minutes | 39 | 10.3% |
| 60 to 89 Minutes | 11 | 2.9% |
| 90 or more Minutes | 20 | 5.3% |
Commute Time by Sex in Clarkton
The most common commute times in Clarkton are 5 to 9 minutes (34 commuters, 17.8%) for males and 5 to 9 minutes (38 commuters, 20.1%) for females.
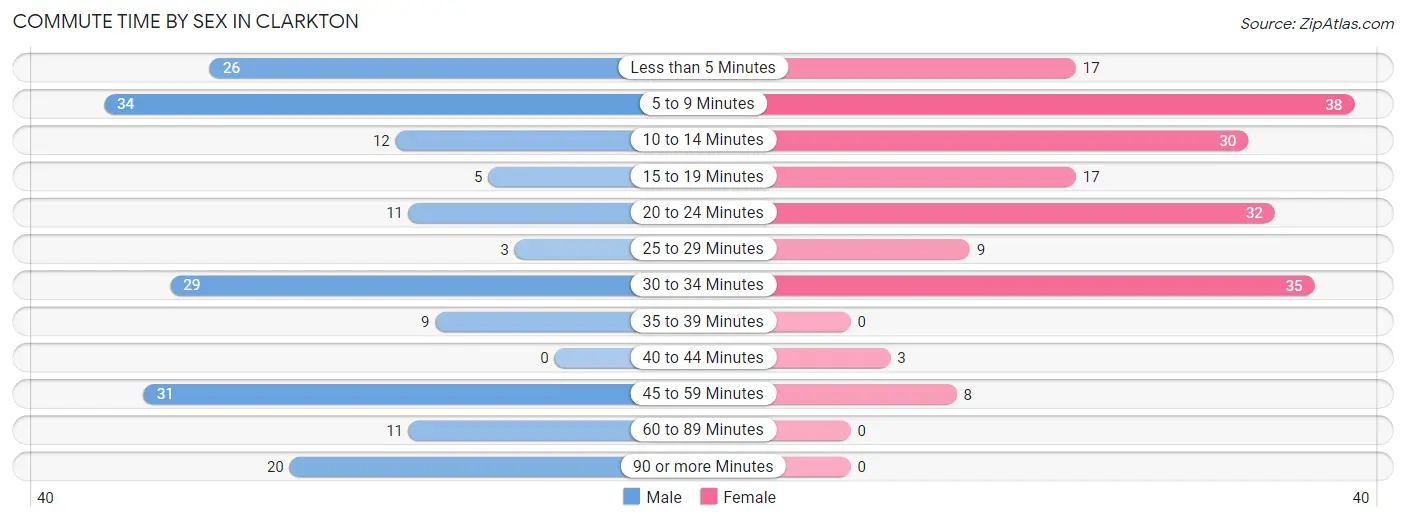
| Commute Time | Male | Female |
| Less than 5 Minutes | 26 (13.6%) | 17 (9.0%) |
| 5 to 9 Minutes | 34 (17.8%) | 38 (20.1%) |
| 10 to 14 Minutes | 12 (6.3%) | 30 (15.9%) |
| 15 to 19 Minutes | 5 (2.6%) | 17 (9.0%) |
| 20 to 24 Minutes | 11 (5.8%) | 32 (16.9%) |
| 25 to 29 Minutes | 3 (1.6%) | 9 (4.8%) |
| 30 to 34 Minutes | 29 (15.2%) | 35 (18.5%) |
| 35 to 39 Minutes | 9 (4.7%) | 0 (0.0%) |
| 40 to 44 Minutes | 0 (0.0%) | 3 (1.6%) |
| 45 to 59 Minutes | 31 (16.2%) | 8 (4.2%) |
| 60 to 89 Minutes | 11 (5.8%) | 0 (0.0%) |
| 90 or more Minutes | 20 (10.5%) | 0 (0.0%) |
Time of Departure to Work by Sex in Clarkton
The most frequent times of departure to work in Clarkton are 4:00 PM to 11:59 PM (41, 21.5%) for males and 7:30 AM to 7:59 AM (64, 33.9%) for females.
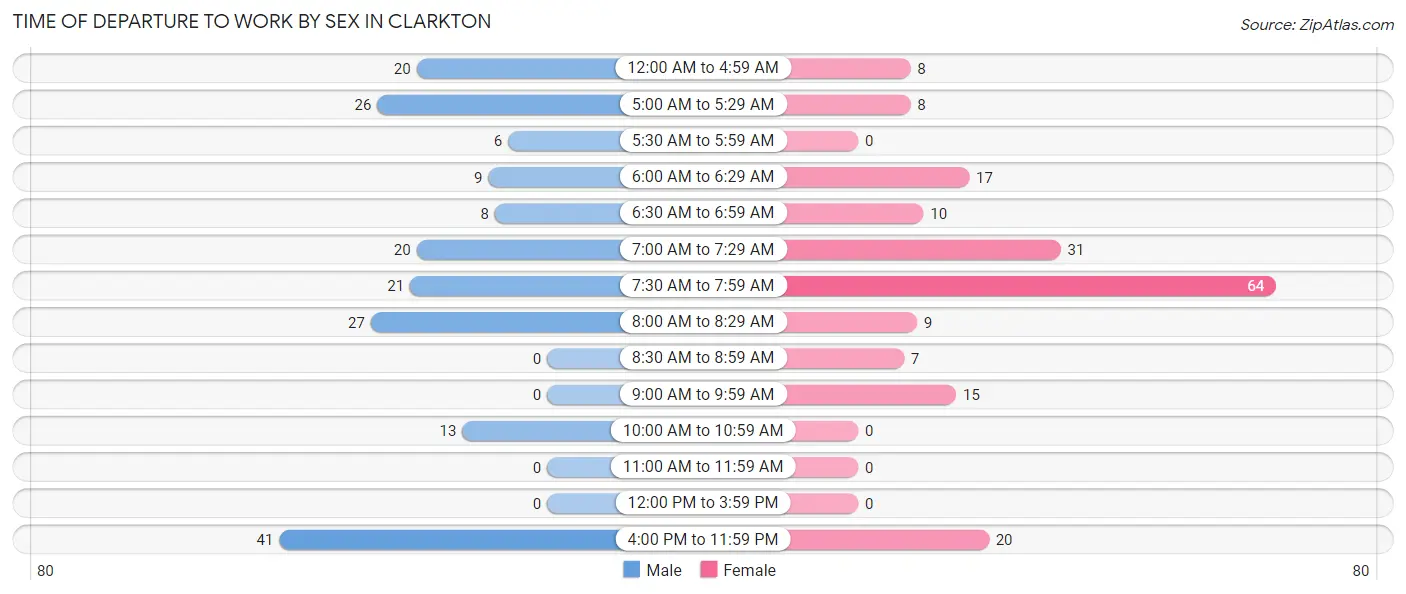
| Time of Departure | Male | Female |
| 12:00 AM to 4:59 AM | 20 (10.5%) | 8 (4.2%) |
| 5:00 AM to 5:29 AM | 26 (13.6%) | 8 (4.2%) |
| 5:30 AM to 5:59 AM | 6 (3.1%) | 0 (0.0%) |
| 6:00 AM to 6:29 AM | 9 (4.7%) | 17 (9.0%) |
| 6:30 AM to 6:59 AM | 8 (4.2%) | 10 (5.3%) |
| 7:00 AM to 7:29 AM | 20 (10.5%) | 31 (16.4%) |
| 7:30 AM to 7:59 AM | 21 (11.0%) | 64 (33.9%) |
| 8:00 AM to 8:29 AM | 27 (14.1%) | 9 (4.8%) |
| 8:30 AM to 8:59 AM | 0 (0.0%) | 7 (3.7%) |
| 9:00 AM to 9:59 AM | 0 (0.0%) | 15 (7.9%) |
| 10:00 AM to 10:59 AM | 13 (6.8%) | 0 (0.0%) |
| 11:00 AM to 11:59 AM | 0 (0.0%) | 0 (0.0%) |
| 12:00 PM to 3:59 PM | 0 (0.0%) | 0 (0.0%) |
| 4:00 PM to 11:59 PM | 41 (21.5%) | 20 (10.6%) |
| Total | 191 (100.0%) | 189 (100.0%) |
Housing Occupancy in Clarkton
Occupancy by Ownership in Clarkton
Of the total 425 dwellings in Clarkton, owner-occupied units account for 250 (58.8%), while renter-occupied units make up 175 (41.2%).
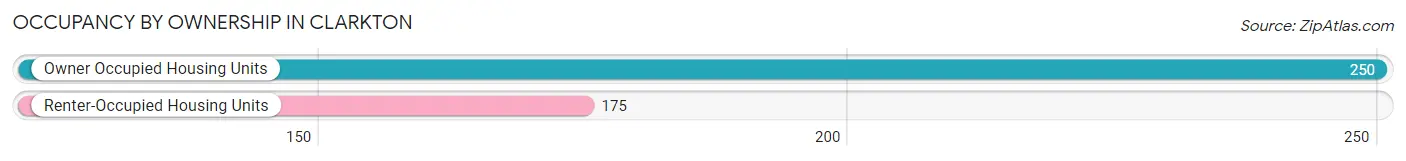
| Occupancy | # Housing Units | % Housing Units |
| Owner Occupied Housing Units | 250 | 58.8% |
| Renter-Occupied Housing Units | 175 | 41.2% |
| Total Occupied Housing Units | 425 | 100.0% |
Occupancy by Household Size in Clarkton
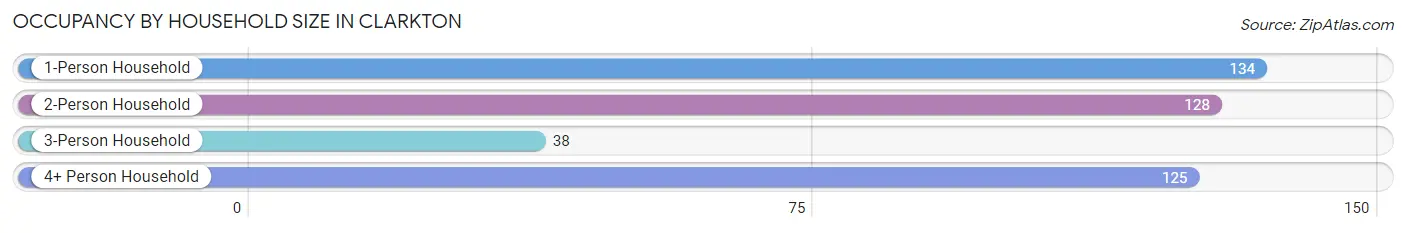
| Household Size | # Housing Units | % Housing Units |
| 1-Person Household | 134 | 31.5% |
| 2-Person Household | 128 | 30.1% |
| 3-Person Household | 38 | 8.9% |
| 4+ Person Household | 125 | 29.4% |
| Total Housing Units | 425 | 100.0% |
Occupancy by Ownership by Household Size in Clarkton
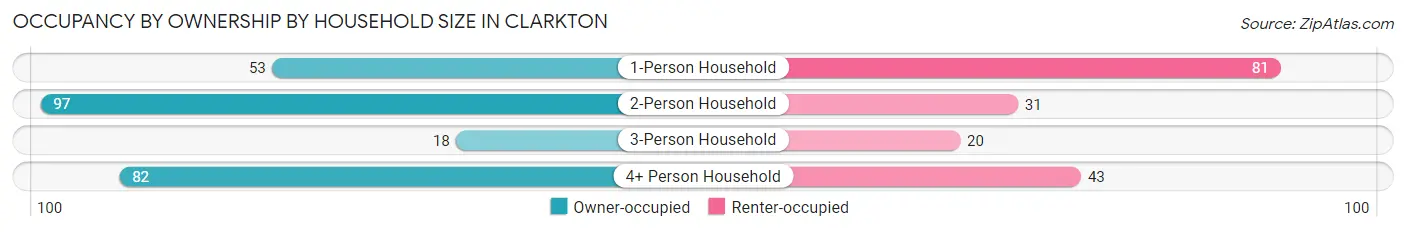
| Household Size | Owner-occupied | Renter-occupied |
| 1-Person Household | 53 (39.6%) | 81 (60.5%) |
| 2-Person Household | 97 (75.8%) | 31 (24.2%) |
| 3-Person Household | 18 (47.4%) | 20 (52.6%) |
| 4+ Person Household | 82 (65.6%) | 43 (34.4%) |
| Total Housing Units | 250 (58.8%) | 175 (41.2%) |
Occupancy by Educational Attainment in Clarkton
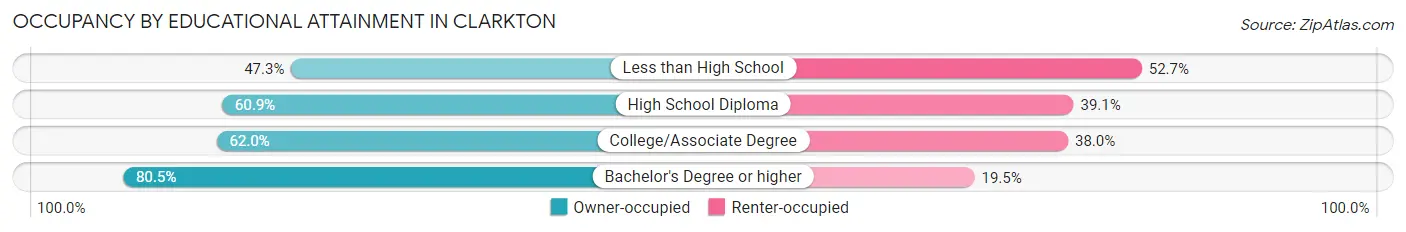
| Household Size | Owner-occupied | Renter-occupied |
| Less than High School | 62 (47.3%) | 69 (52.7%) |
| High School Diploma | 98 (60.9%) | 63 (39.1%) |
| College/Associate Degree | 57 (62.0%) | 35 (38.0%) |
| Bachelor's Degree or higher | 33 (80.5%) | 8 (19.5%) |
Occupancy by Age of Householder in Clarkton
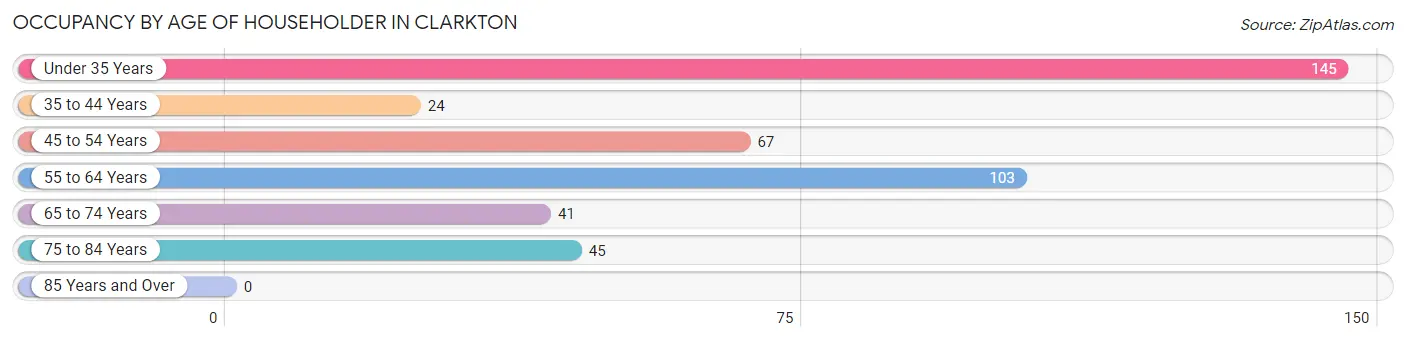
| Age Bracket | # Households | % Households |
| Under 35 Years | 145 | 34.1% |
| 35 to 44 Years | 24 | 5.7% |
| 45 to 54 Years | 67 | 15.8% |
| 55 to 64 Years | 103 | 24.2% |
| 65 to 74 Years | 41 | 9.7% |
| 75 to 84 Years | 45 | 10.6% |
| 85 Years and Over | 0 | 0.0% |
| Total | 425 | 100.0% |
Housing Finances in Clarkton
Median Income by Occupancy in Clarkton
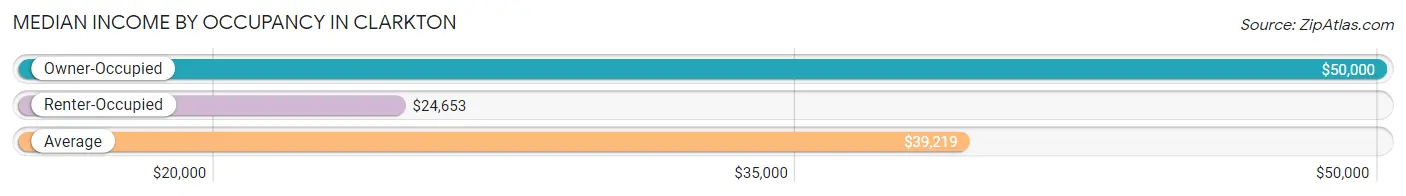
| Occupancy Type | # Households | Median Income |
| Owner-Occupied | 250 (58.8%) | $50,000 |
| Renter-Occupied | 175 (41.2%) | $24,653 |
| Average | 425 (100.0%) | $39,219 |
Occupancy by Householder Income Bracket in Clarkton
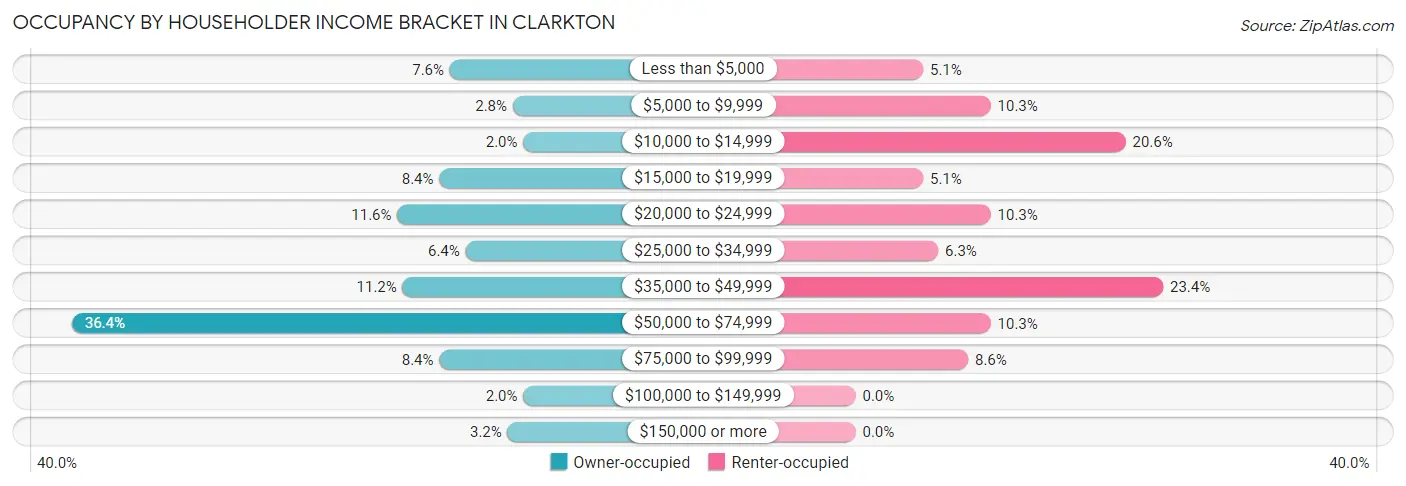
| Income Bracket | Owner-occupied | Renter-occupied |
| Less than $5,000 | 19 (7.6%) | 9 (5.1%) |
| $5,000 to $9,999 | 7 (2.8%) | 18 (10.3%) |
| $10,000 to $14,999 | 5 (2.0%) | 36 (20.6%) |
| $15,000 to $19,999 | 21 (8.4%) | 9 (5.1%) |
| $20,000 to $24,999 | 29 (11.6%) | 18 (10.3%) |
| $25,000 to $34,999 | 16 (6.4%) | 11 (6.3%) |
| $35,000 to $49,999 | 28 (11.2%) | 41 (23.4%) |
| $50,000 to $74,999 | 91 (36.4%) | 18 (10.3%) |
| $75,000 to $99,999 | 21 (8.4%) | 15 (8.6%) |
| $100,000 to $149,999 | 5 (2.0%) | 0 (0.0%) |
| $150,000 or more | 8 (3.2%) | 0 (0.0%) |
| Total | 250 (100.0%) | 175 (100.0%) |
Monthly Housing Cost Tiers in Clarkton
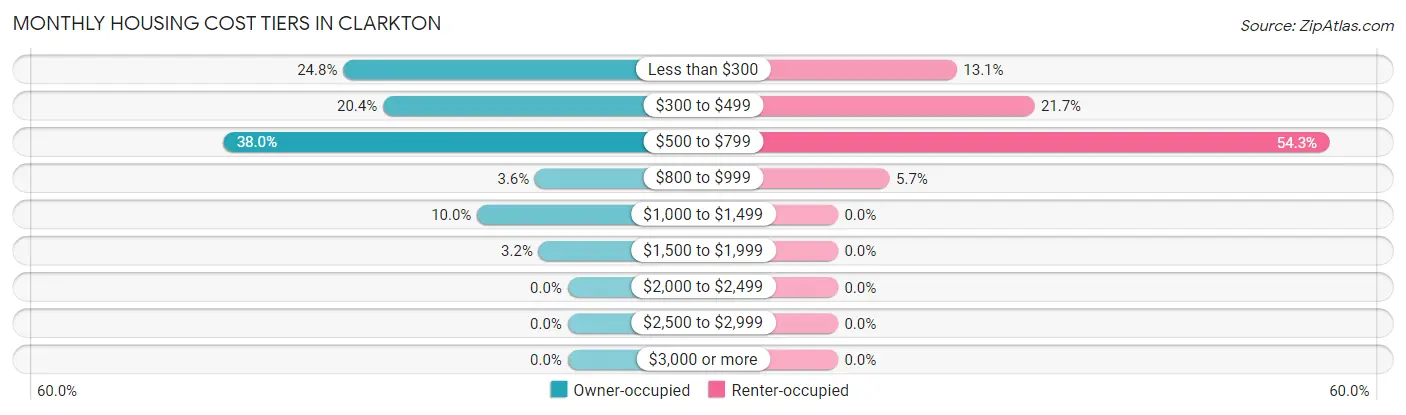
| Monthly Cost | Owner-occupied | Renter-occupied |
| Less than $300 | 62 (24.8%) | 23 (13.1%) |
| $300 to $499 | 51 (20.4%) | 38 (21.7%) |
| $500 to $799 | 95 (38.0%) | 95 (54.3%) |
| $800 to $999 | 9 (3.6%) | 10 (5.7%) |
| $1,000 to $1,499 | 25 (10.0%) | 0 (0.0%) |
| $1,500 to $1,999 | 8 (3.2%) | 0 (0.0%) |
| $2,000 to $2,499 | 0 (0.0%) | 0 (0.0%) |
| $2,500 to $2,999 | 0 (0.0%) | 0 (0.0%) |
| $3,000 or more | 0 (0.0%) | 0 (0.0%) |
| Total | 250 (100.0%) | 175 (100.0%) |
Physical Housing Characteristics in Clarkton
Housing Structures in Clarkton
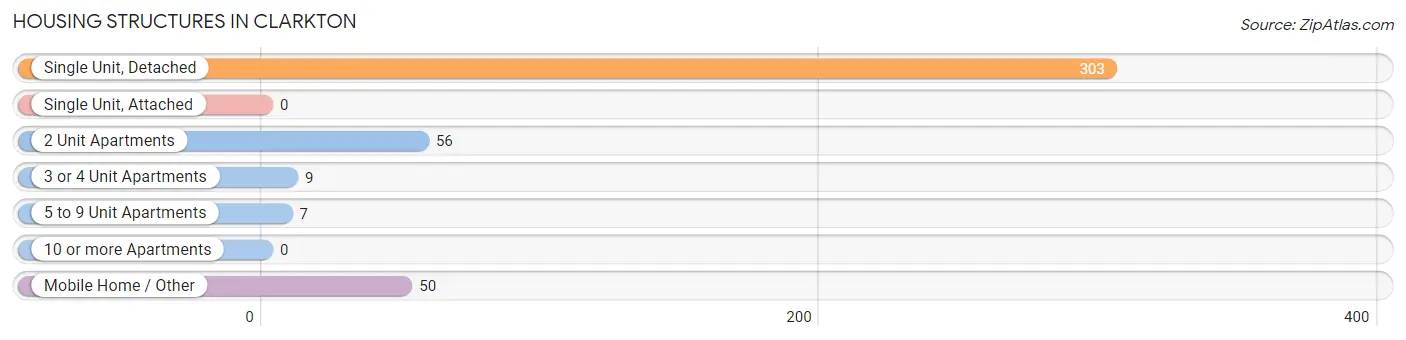
| Structure Type | # Housing Units | % Housing Units |
| Single Unit, Detached | 303 | 71.3% |
| Single Unit, Attached | 0 | 0.0% |
| 2 Unit Apartments | 56 | 13.2% |
| 3 or 4 Unit Apartments | 9 | 2.1% |
| 5 to 9 Unit Apartments | 7 | 1.7% |
| 10 or more Apartments | 0 | 0.0% |
| Mobile Home / Other | 50 | 11.8% |
| Total | 425 | 100.0% |
Housing Structures by Occupancy in Clarkton
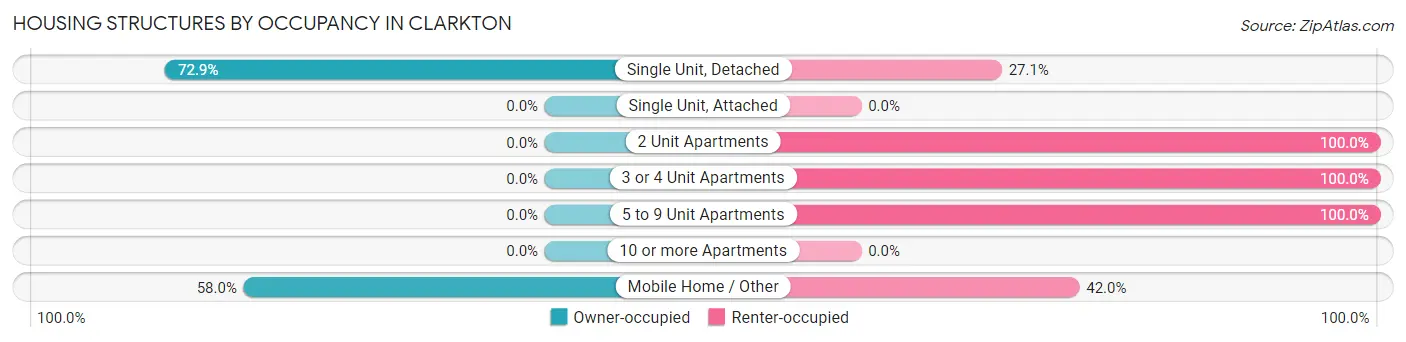
| Structure Type | Owner-occupied | Renter-occupied |
| Single Unit, Detached | 221 (72.9%) | 82 (27.1%) |
| Single Unit, Attached | 0 (0.0%) | 0 (0.0%) |
| 2 Unit Apartments | 0 (0.0%) | 56 (100.0%) |
| 3 or 4 Unit Apartments | 0 (0.0%) | 9 (100.0%) |
| 5 to 9 Unit Apartments | 0 (0.0%) | 7 (100.0%) |
| 10 or more Apartments | 0 (0.0%) | 0 (0.0%) |
| Mobile Home / Other | 29 (58.0%) | 21 (42.0%) |
| Total | 250 (58.8%) | 175 (41.2%) |
Housing Structures by Number of Rooms in Clarkton
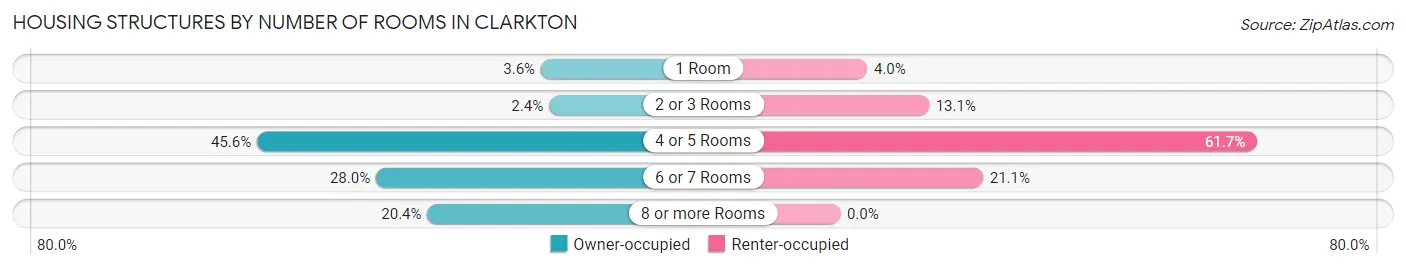
| Number of Rooms | Owner-occupied | Renter-occupied |
| 1 Room | 9 (3.6%) | 7 (4.0%) |
| 2 or 3 Rooms | 6 (2.4%) | 23 (13.1%) |
| 4 or 5 Rooms | 114 (45.6%) | 108 (61.7%) |
| 6 or 7 Rooms | 70 (28.0%) | 37 (21.1%) |
| 8 or more Rooms | 51 (20.4%) | 0 (0.0%) |
| Total | 250 (100.0%) | 175 (100.0%) |
Housing Structure by Heating Type in Clarkton
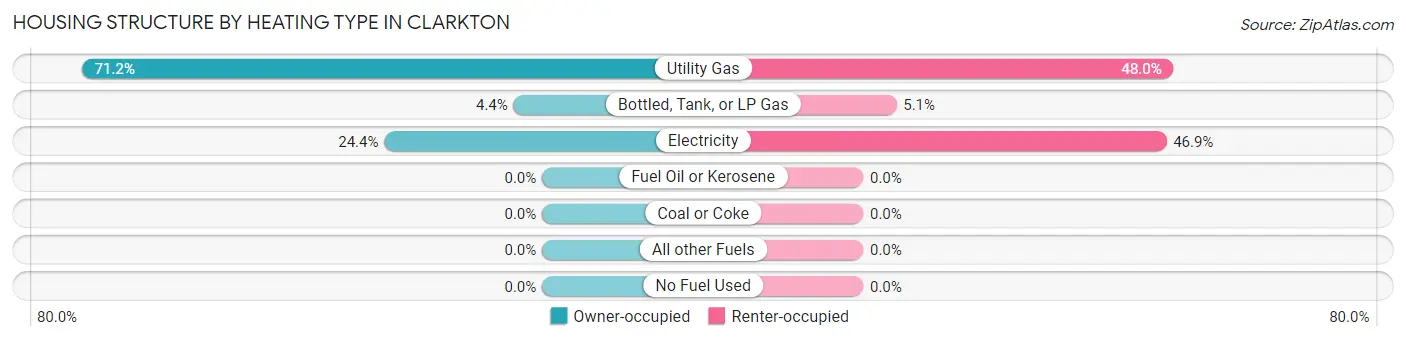
| Heating Type | Owner-occupied | Renter-occupied |
| Utility Gas | 178 (71.2%) | 84 (48.0%) |
| Bottled, Tank, or LP Gas | 11 (4.4%) | 9 (5.1%) |
| Electricity | 61 (24.4%) | 82 (46.9%) |
| Fuel Oil or Kerosene | 0 (0.0%) | 0 (0.0%) |
| Coal or Coke | 0 (0.0%) | 0 (0.0%) |
| All other Fuels | 0 (0.0%) | 0 (0.0%) |
| No Fuel Used | 0 (0.0%) | 0 (0.0%) |
| Total | 250 (100.0%) | 175 (100.0%) |
Household Vehicle Usage in Clarkton
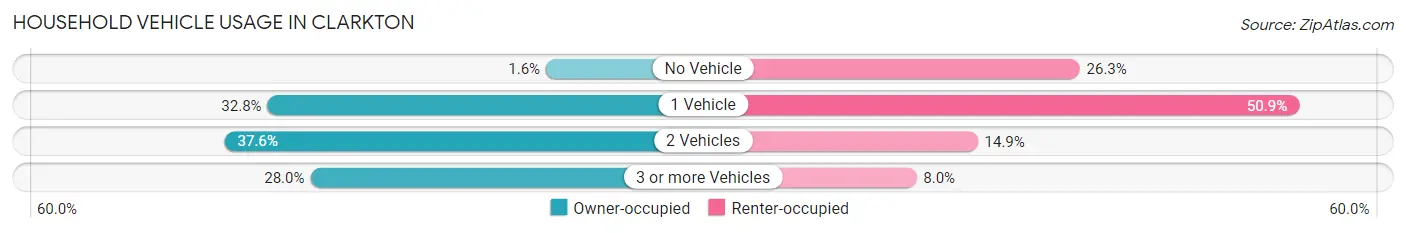
| Vehicles per Household | Owner-occupied | Renter-occupied |
| No Vehicle | 4 (1.6%) | 46 (26.3%) |
| 1 Vehicle | 82 (32.8%) | 89 (50.9%) |
| 2 Vehicles | 94 (37.6%) | 26 (14.9%) |
| 3 or more Vehicles | 70 (28.0%) | 14 (8.0%) |
| Total | 250 (100.0%) | 175 (100.0%) |
Real Estate & Mortgages in Clarkton
Real Estate and Mortgage Overview in Clarkton
| Characteristic | Without Mortgage | With Mortgage |
| Housing Units | 157 | 93 |
| Median Property Value | $50,400 | $48,200 |
| Median Household Income | $38,438 | $3 |
| Monthly Housing Costs | $398 | $0 |
| Real Estate Taxes | $381 | $0 |
Property Value by Mortgage Status in Clarkton
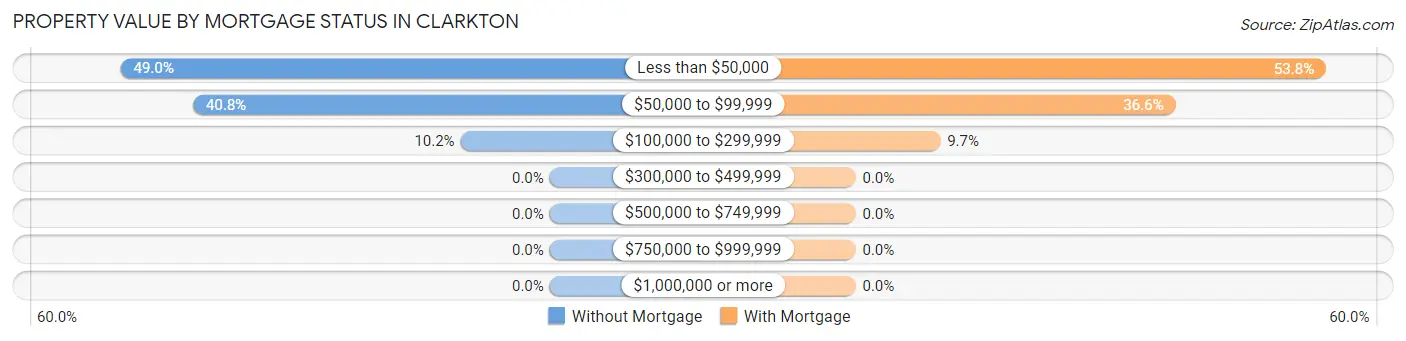
| Property Value | Without Mortgage | With Mortgage |
| Less than $50,000 | 77 (49.0%) | 50 (53.8%) |
| $50,000 to $99,999 | 64 (40.8%) | 34 (36.6%) |
| $100,000 to $299,999 | 16 (10.2%) | 9 (9.7%) |
| $300,000 to $499,999 | 0 (0.0%) | 0 (0.0%) |
| $500,000 to $749,999 | 0 (0.0%) | 0 (0.0%) |
| $750,000 to $999,999 | 0 (0.0%) | 0 (0.0%) |
| $1,000,000 or more | 0 (0.0%) | 0 (0.0%) |
| Total | 157 (100.0%) | 93 (100.0%) |
Household Income by Mortgage Status in Clarkton
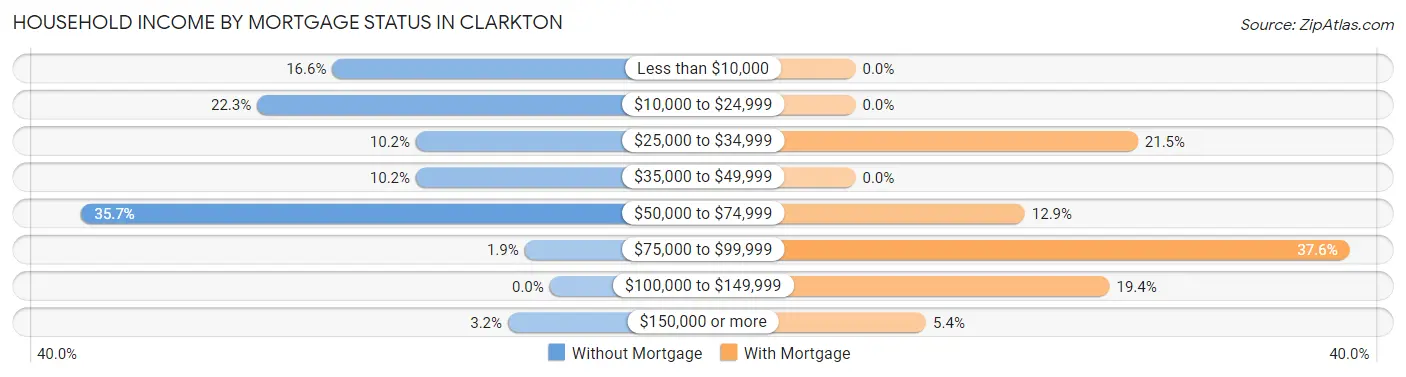
| Household Income | Without Mortgage | With Mortgage |
| Less than $10,000 | 26 (16.6%) | 0 (0.0%) |
| $10,000 to $24,999 | 35 (22.3%) | 0 (0.0%) |
| $25,000 to $34,999 | 16 (10.2%) | 20 (21.5%) |
| $35,000 to $49,999 | 16 (10.2%) | 0 (0.0%) |
| $50,000 to $74,999 | 56 (35.7%) | 12 (12.9%) |
| $75,000 to $99,999 | 3 (1.9%) | 35 (37.6%) |
| $100,000 to $149,999 | 0 (0.0%) | 18 (19.4%) |
| $150,000 or more | 5 (3.2%) | 5 (5.4%) |
| Total | 157 (100.0%) | 93 (100.0%) |
Property Value to Household Income Ratio in Clarkton
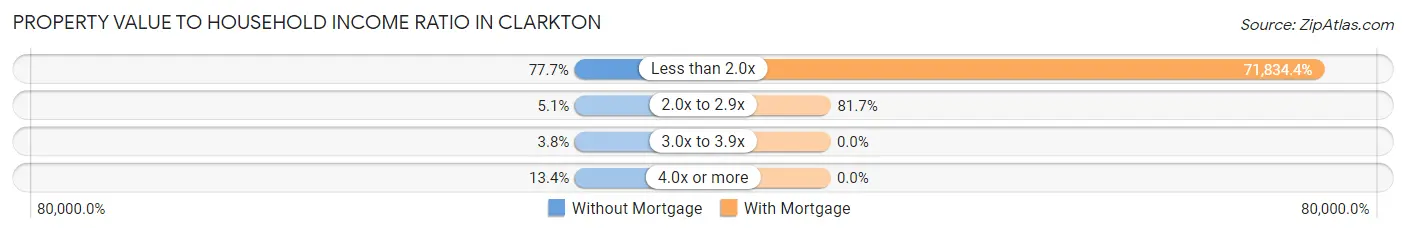
| Value-to-Income Ratio | Without Mortgage | With Mortgage |
| Less than 2.0x | 122 (77.7%) | 66,806 (71,834.4%) |
| 2.0x to 2.9x | 8 (5.1%) | 76 (81.7%) |
| 3.0x to 3.9x | 6 (3.8%) | 0 (0.0%) |
| 4.0x or more | 21 (13.4%) | 0 (0.0%) |
| Total | 157 (100.0%) | 93 (100.0%) |
Real Estate Taxes by Mortgage Status in Clarkton
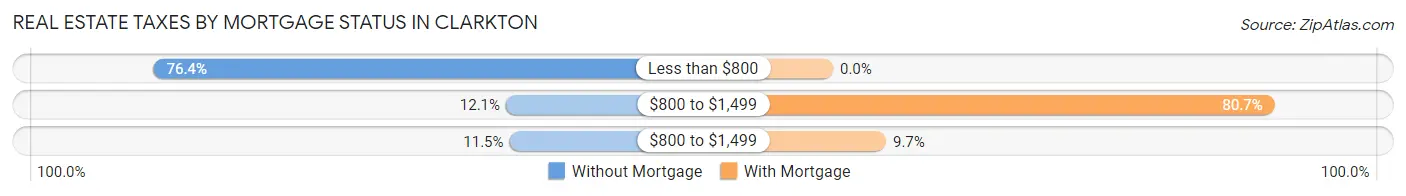
| Property Taxes | Without Mortgage | With Mortgage |
| Less than $800 | 120 (76.4%) | 0 (0.0%) |
| $800 to $1,499 | 19 (12.1%) | 75 (80.6%) |
| $800 to $1,499 | 18 (11.5%) | 9 (9.7%) |
| Total | 157 (100.0%) | 93 (100.0%) |
Health & Disability in Clarkton
Health Insurance Coverage by Age in Clarkton
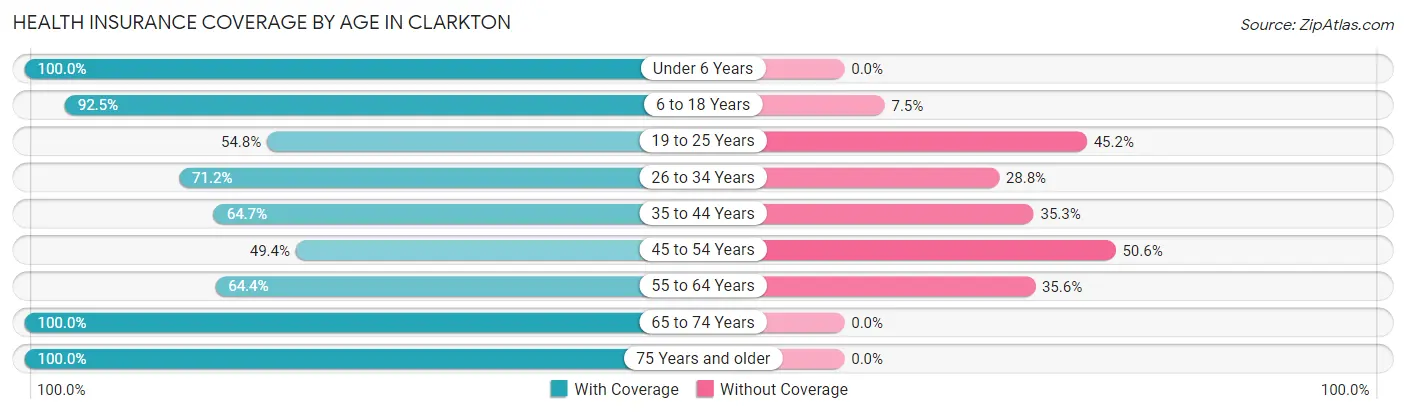
| Age Bracket | With Coverage | Without Coverage |
| Under 6 Years | 111 (100.0%) | 0 (0.0%) |
| 6 to 18 Years | 197 (92.5%) | 16 (7.5%) |
| 19 to 25 Years | 80 (54.8%) | 66 (45.2%) |
| 26 to 34 Years | 116 (71.2%) | 47 (28.8%) |
| 35 to 44 Years | 44 (64.7%) | 24 (35.3%) |
| 45 to 54 Years | 43 (49.4%) | 44 (50.6%) |
| 55 to 64 Years | 116 (64.4%) | 64 (35.6%) |
| 65 to 74 Years | 81 (100.0%) | 0 (0.0%) |
| 75 Years and older | 45 (100.0%) | 0 (0.0%) |
| Total | 833 (76.1%) | 261 (23.9%) |
Health Insurance Coverage by Citizenship Status in Clarkton
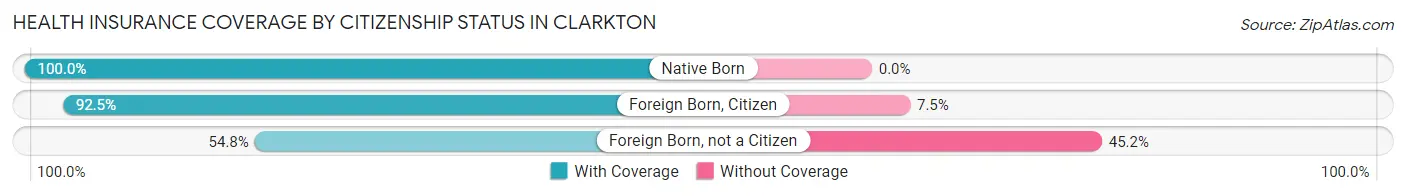
| Citizenship Status | With Coverage | Without Coverage |
| Native Born | 111 (100.0%) | 0 (0.0%) |
| Foreign Born, Citizen | 197 (92.5%) | 16 (7.5%) |
| Foreign Born, not a Citizen | 80 (54.8%) | 66 (45.2%) |
Health Insurance Coverage by Household Income in Clarkton
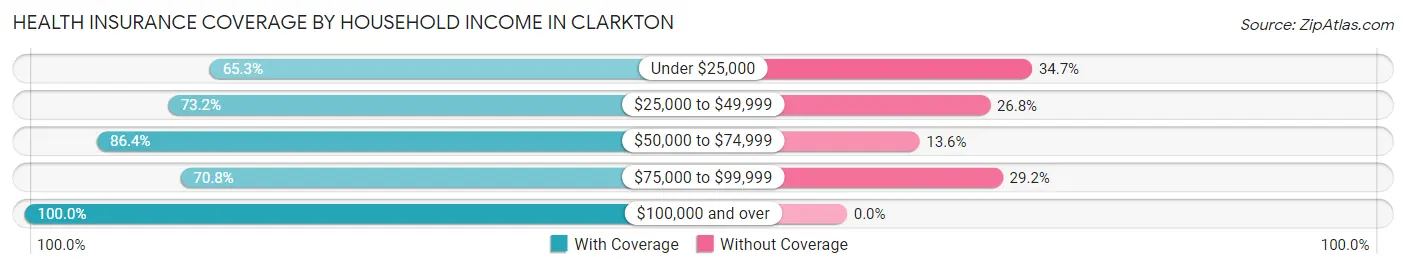
| Household Income | With Coverage | Without Coverage |
| Under $25,000 | 192 (65.3%) | 102 (34.7%) |
| $25,000 to $49,999 | 221 (73.2%) | 81 (26.8%) |
| $50,000 to $74,999 | 286 (86.4%) | 45 (13.6%) |
| $75,000 to $99,999 | 80 (70.8%) | 33 (29.2%) |
| $100,000 and over | 54 (100.0%) | 0 (0.0%) |
Public vs Private Health Insurance Coverage by Age in Clarkton
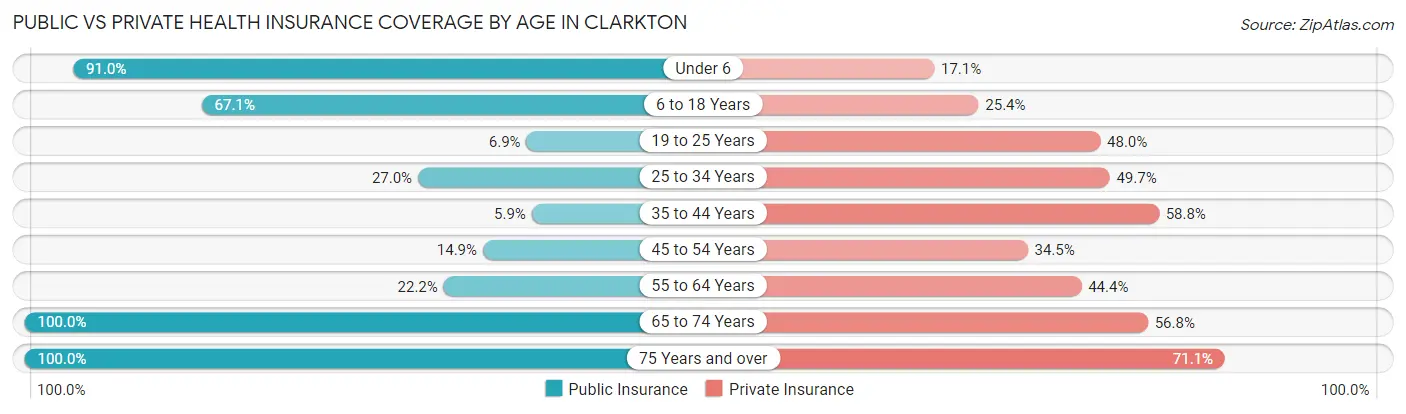
| Age Bracket | Public Insurance | Private Insurance |
| Under 6 | 101 (91.0%) | 19 (17.1%) |
| 6 to 18 Years | 143 (67.1%) | 54 (25.4%) |
| 19 to 25 Years | 10 (6.9%) | 70 (47.9%) |
| 25 to 34 Years | 44 (27.0%) | 81 (49.7%) |
| 35 to 44 Years | 4 (5.9%) | 40 (58.8%) |
| 45 to 54 Years | 13 (14.9%) | 30 (34.5%) |
| 55 to 64 Years | 40 (22.2%) | 80 (44.4%) |
| 65 to 74 Years | 81 (100.0%) | 46 (56.8%) |
| 75 Years and over | 45 (100.0%) | 32 (71.1%) |
| Total | 481 (44.0%) | 452 (41.3%) |
Disability Status by Sex by Age in Clarkton
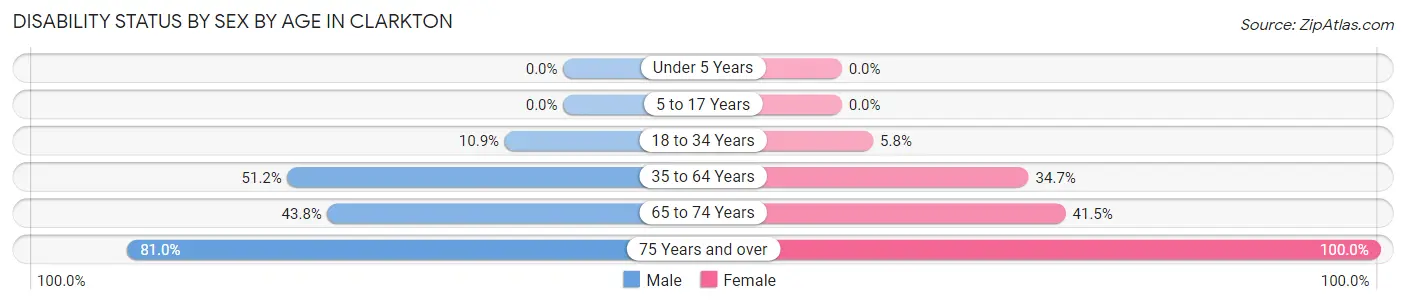
| Age Bracket | Male | Female |
| Under 5 Years | 0 (0.0%) | 0 (0.0%) |
| 5 to 17 Years | 0 (0.0%) | 0 (0.0%) |
| 18 to 34 Years | 14 (10.8%) | 11 (5.8%) |
| 35 to 64 Years | 108 (51.2%) | 43 (34.7%) |
| 65 to 74 Years | 7 (43.8%) | 27 (41.5%) |
| 75 Years and over | 17 (80.9%) | 24 (100.0%) |
Disability Class by Sex by Age in Clarkton
Disability Class: Hearing Difficulty
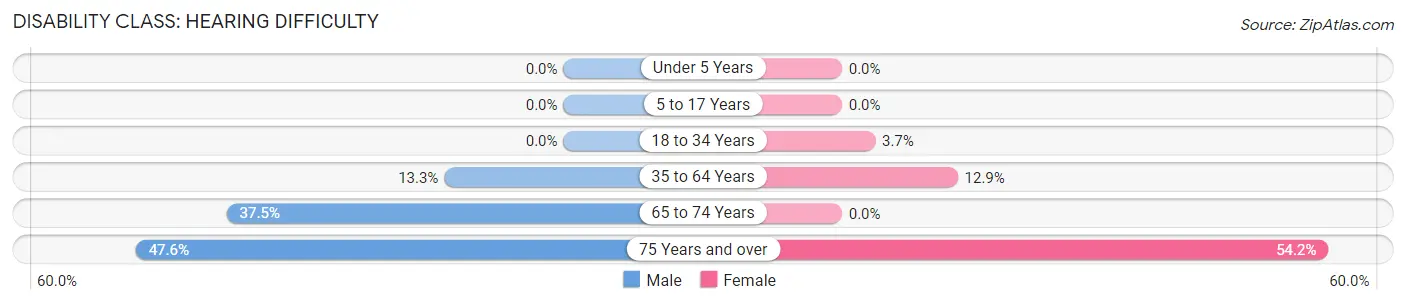
| Age Bracket | Male | Female |
| Under 5 Years | 0 (0.0%) | 0 (0.0%) |
| 5 to 17 Years | 0 (0.0%) | 0 (0.0%) |
| 18 to 34 Years | 0 (0.0%) | 7 (3.7%) |
| 35 to 64 Years | 28 (13.3%) | 16 (12.9%) |
| 65 to 74 Years | 6 (37.5%) | 0 (0.0%) |
| 75 Years and over | 10 (47.6%) | 13 (54.2%) |
Disability Class: Vision Difficulty
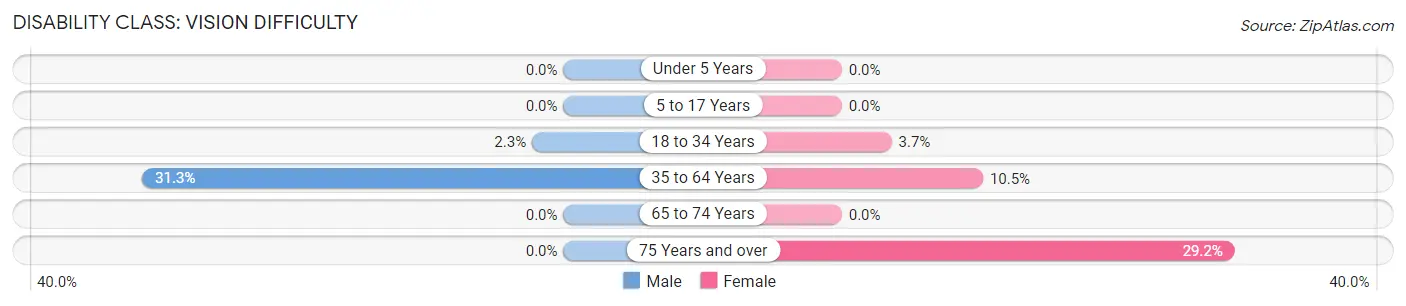
| Age Bracket | Male | Female |
| Under 5 Years | 0 (0.0%) | 0 (0.0%) |
| 5 to 17 Years | 0 (0.0%) | 0 (0.0%) |
| 18 to 34 Years | 3 (2.3%) | 7 (3.7%) |
| 35 to 64 Years | 66 (31.3%) | 13 (10.5%) |
| 65 to 74 Years | 0 (0.0%) | 0 (0.0%) |
| 75 Years and over | 0 (0.0%) | 7 (29.2%) |
Disability Class: Cognitive Difficulty
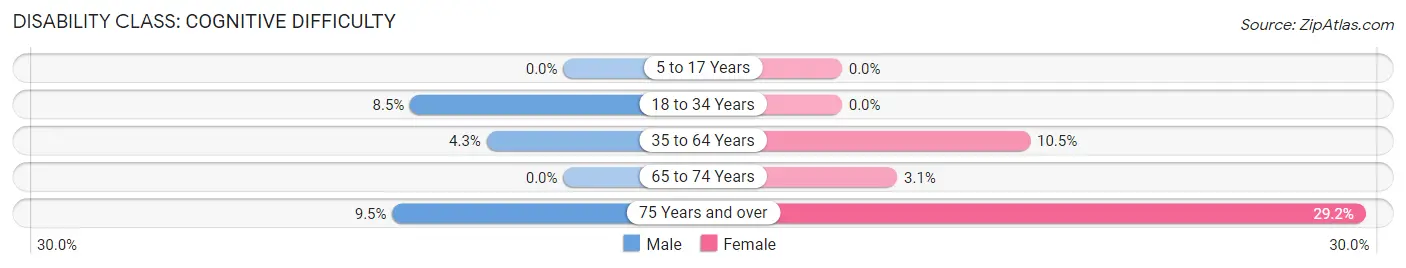
| Age Bracket | Male | Female |
| 5 to 17 Years | 0 (0.0%) | 0 (0.0%) |
| 18 to 34 Years | 11 (8.5%) | 0 (0.0%) |
| 35 to 64 Years | 9 (4.3%) | 13 (10.5%) |
| 65 to 74 Years | 0 (0.0%) | 2 (3.1%) |
| 75 Years and over | 2 (9.5%) | 7 (29.2%) |
Disability Class: Ambulatory Difficulty
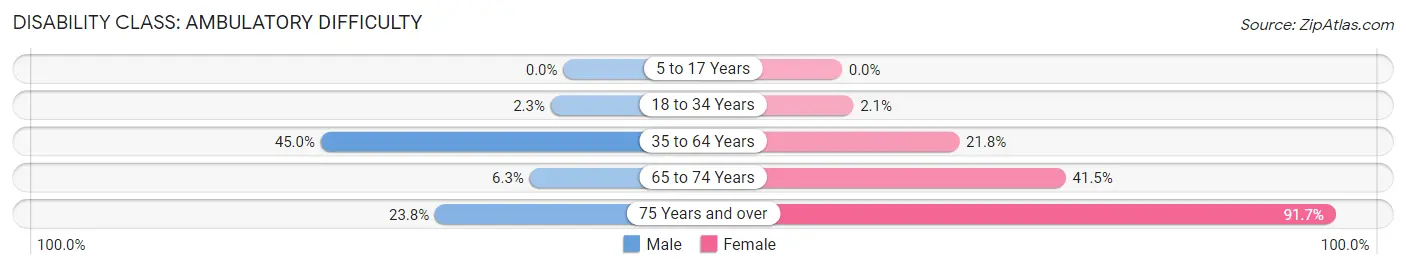
| Age Bracket | Male | Female |
| 5 to 17 Years | 0 (0.0%) | 0 (0.0%) |
| 18 to 34 Years | 3 (2.3%) | 4 (2.1%) |
| 35 to 64 Years | 95 (45.0%) | 27 (21.8%) |
| 65 to 74 Years | 1 (6.2%) | 27 (41.5%) |
| 75 Years and over | 5 (23.8%) | 22 (91.7%) |
Disability Class: Self-Care Difficulty
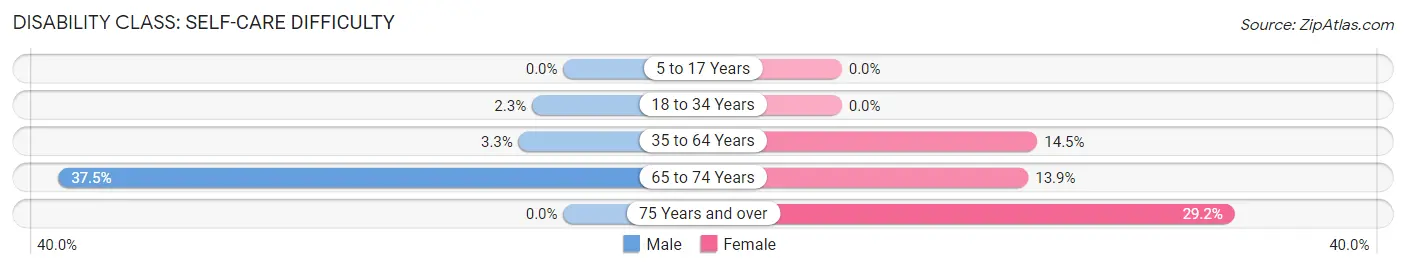
| Age Bracket | Male | Female |
| 5 to 17 Years | 0 (0.0%) | 0 (0.0%) |
| 18 to 34 Years | 3 (2.3%) | 0 (0.0%) |
| 35 to 64 Years | 7 (3.3%) | 18 (14.5%) |
| 65 to 74 Years | 6 (37.5%) | 9 (13.9%) |
| 75 Years and over | 0 (0.0%) | 7 (29.2%) |
Technology Access in Clarkton
Computing Device Access in Clarkton
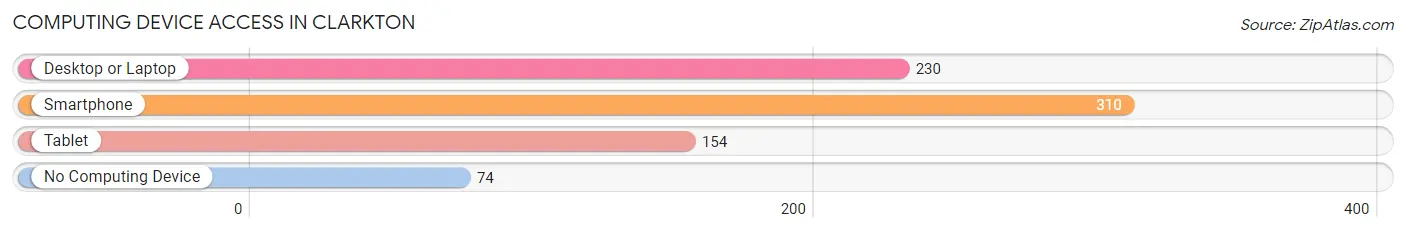
| Device Type | # Households | % Households |
| Desktop or Laptop | 230 | 54.1% |
| Smartphone | 310 | 72.9% |
| Tablet | 154 | 36.2% |
| No Computing Device | 74 | 17.4% |
| Total | 425 | 100.0% |
Internet Access in Clarkton
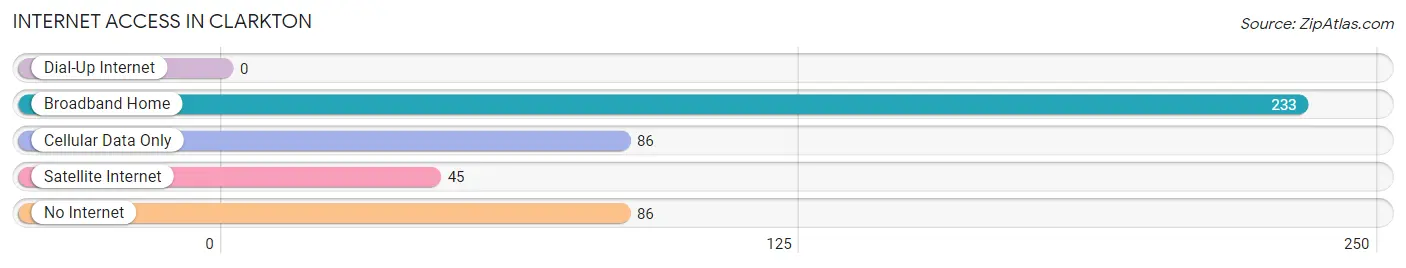
| Internet Type | # Households | % Households |
| Dial-Up Internet | 0 | 0.0% |
| Broadband Home | 233 | 54.8% |
| Cellular Data Only | 86 | 20.2% |
| Satellite Internet | 45 | 10.6% |
| No Internet | 86 | 20.2% |
| Total | 425 | 100.0% |
Clarkton Summary
Clarkton is a small city located in Dunklin County, Missouri. It is situated in the southeastern corner of the state, near the Arkansas border. The city has a population of 1,845 people, according to the 2010 census.
History
The area that is now Clarkton was first settled in the early 1800s by a group of settlers from Kentucky. The town was originally known as “Clark’s Town” after the first settler, William Clark. The town was officially incorporated in 1883.
In the early 1900s, the town was a thriving agricultural center, with cotton, corn, and soybeans being the main crops. The town also had a thriving lumber industry, with several sawmills in the area.
In the 1950s, the town began to decline as the agricultural industry shifted away from the area. The sawmills also closed, leaving the town without a major industry.
Geography
Clarkton is located in the southeastern corner of Missouri, near the Arkansas border. The city is situated on the banks of the St. Francis River. The city is surrounded by rolling hills and farmland.
The climate in Clarkton is humid subtropical, with hot, humid summers and mild winters. The average annual temperature is around 64 degrees Fahrenheit.
Economy
The economy of Clarkton is largely based on agriculture. The town is home to several farms, which produce cotton, corn, soybeans, and other crops. The town also has a few small businesses, including a grocery store, a hardware store, and a few restaurants.
Demographics
According to the 2010 census, the population of Clarkton was 1,845 people. The racial makeup of the town was 95.3% White, 1.2% African American, 0.3% Native American, 0.2% Asian, and 2.9% from other races. The median household income was $30,938.
Conclusion
Clarkton is a small city located in Dunklin County, Missouri. It is situated in the southeastern corner of the state, near the Arkansas border. The city has a population of 1,845 people, according to the 2010 census. The economy of Clarkton is largely based on agriculture, with cotton, corn, soybeans, and other crops being the main crops. The town also has a few small businesses, including a grocery store, a hardware store, and a few restaurants. The racial makeup of the town was 95.3% White, 1.2% African American, 0.3% Native American, 0.2% Asian, and 2.9% from other races. The median household income was $30,938.
Common Questions
What is Per Capita Income in Clarkton?
Per Capita income in Clarkton is $16,756.
What is the Median Family Income in Clarkton?
Median Family Income in Clarkton is $46,875.
What is the Median Household income in Clarkton?
Median Household Income in Clarkton is $39,219.
What is Income or Wage Gap in Clarkton?
Income or Wage Gap in Clarkton is 32.1%.
Women in Clarkton earn 67.9 cents for every dollar earned by a man.
What is Inequality or Gini Index in Clarkton?
Inequality or Gini Index in Clarkton is 0.40.
What is the Total Population of Clarkton?
Total Population of Clarkton is 1,094.
What is the Total Male Population of Clarkton?
Total Male Population of Clarkton is 542.
What is the Total Female Population of Clarkton?
Total Female Population of Clarkton is 552.
What is the Ratio of Males per 100 Females in Clarkton?
There are 98.19 Males per 100 Females in Clarkton.
What is the Ratio of Females per 100 Males in Clarkton?
There are 101.85 Females per 100 Males in Clarkton.
What is the Median Population Age in Clarkton?
Median Population Age in Clarkton is 29.4 Years.
What is the Average Family Size in Clarkton
Average Family Size in Clarkton is 3.2 People.
What is the Average Household Size in Clarkton
Average Household Size in Clarkton is 2.6 People.
How Large is the Labor Force in Clarkton?
There are 419 People in the Labor Forcein in Clarkton.
What is the Percentage of People in the Labor Force in Clarkton?
51.9% of People are in the Labor Force in Clarkton.
What is the Unemployment Rate in Clarkton?
Unemployment Rate in Clarkton is 2.6%.