Clarence, MO Map & Demographics
Clarence Map
Clarence Overview
$18,009
PER CAPITA INCOME
$31,111
AVG FAMILY INCOME
$28,843
AVG HOUSEHOLD INCOME
18.7%
WAGE / INCOME GAP [ % ]
81.3¢/ $1
WAGE / INCOME GAP [ $ ]
0.46
INEQUALITY / GINI INDEX
936
TOTAL POPULATION
452
MALE POPULATION
484
FEMALE POPULATION
93.39
MALES / 100 FEMALES
107.08
FEMALES / 100 MALES
47.0
MEDIAN AGE
3.1
AVG FAMILY SIZE
2.3
AVG HOUSEHOLD SIZE
343
LABOR FORCE [ PEOPLE ]
43.0%
PERCENT IN LABOR FORCE
2.3%
UNEMPLOYMENT RATE
Clarence Zip Codes
Clarence Area Codes
Income in Clarence
Income Overview in Clarence
Per Capita Income in Clarence is $18,009, while median incomes of families and households are $31,111 and $28,843 respectively.
| Characteristic | Number | Measure |
| Per Capita Income | 936 | $18,009 |
| Median Family Income | 212 | $31,111 |
| Mean Family Income | 212 | $46,250 |
| Median Household Income | 385 | $28,843 |
| Mean Household Income | 385 | $40,054 |
| Income Deficit | 212 | $0 |
| Wage / Income Gap (%) | 936 | 18.74% |
| Wage / Income Gap ($) | 936 | 81.26¢ per $1 |
| Gini / Inequality Index | 936 | 0.46 |
Earnings by Sex in Clarence
Average Earnings in Clarence are $29,318, $33,125 for men and $26,917 for women, a difference of 18.7%.
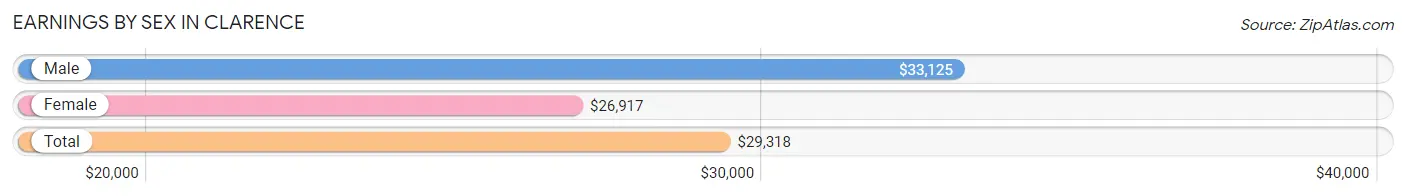
| Sex | Number | Average Earnings |
| Male | 163 (44.3%) | $33,125 |
| Female | 205 (55.7%) | $26,917 |
| Total | 368 (100.0%) | $29,318 |
Earnings by Sex by Income Bracket in Clarence
The most common earnings brackets in Clarence are $40,000 to $44,999 for men (25 | 15.3%) and $25,000 to $29,999 for women (37 | 18.0%).
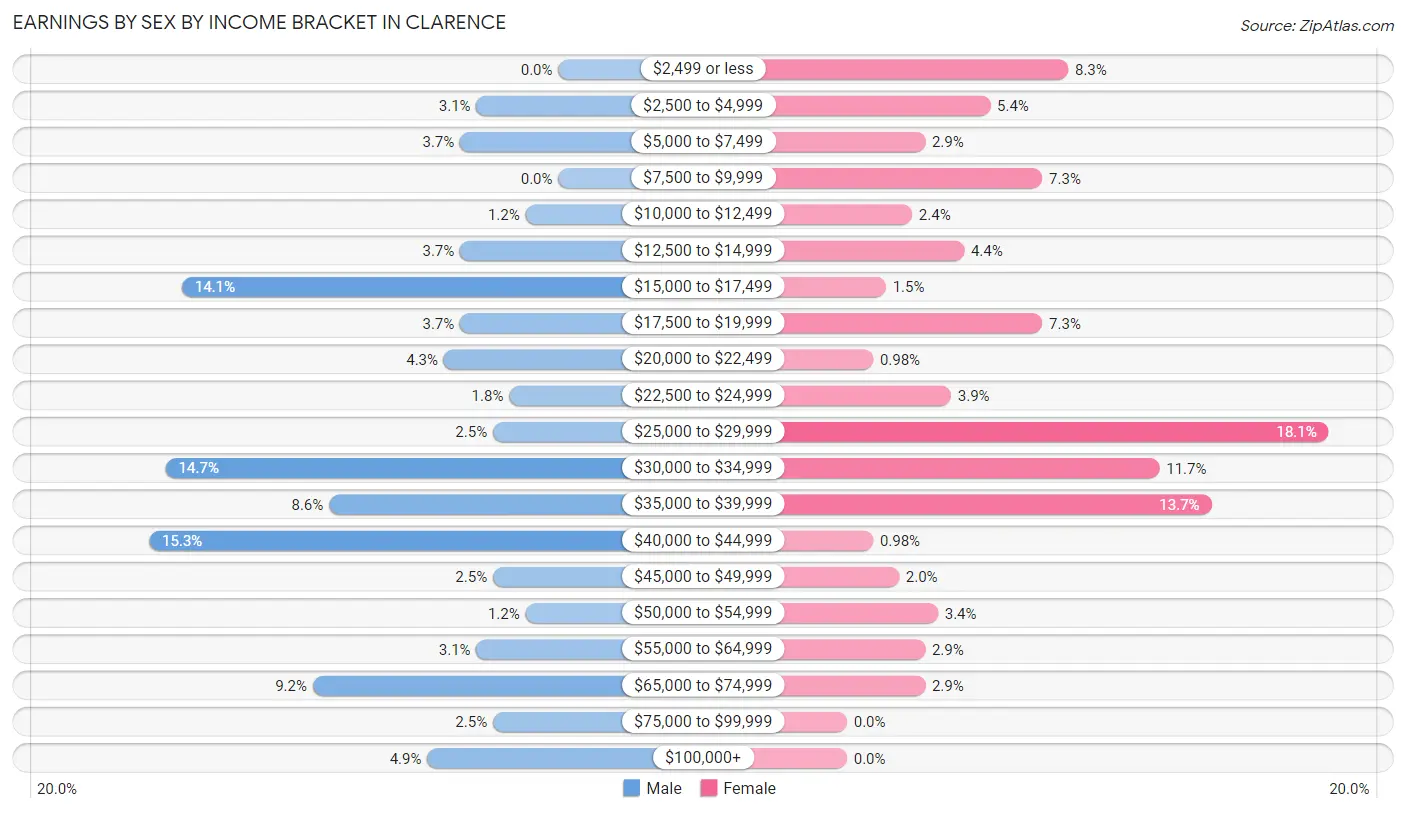
| Income | Male | Female |
| $2,499 or less | 0 (0.0%) | 17 (8.3%) |
| $2,500 to $4,999 | 5 (3.1%) | 11 (5.4%) |
| $5,000 to $7,499 | 6 (3.7%) | 6 (2.9%) |
| $7,500 to $9,999 | 0 (0.0%) | 15 (7.3%) |
| $10,000 to $12,499 | 2 (1.2%) | 5 (2.4%) |
| $12,500 to $14,999 | 6 (3.7%) | 9 (4.4%) |
| $15,000 to $17,499 | 23 (14.1%) | 3 (1.5%) |
| $17,500 to $19,999 | 6 (3.7%) | 15 (7.3%) |
| $20,000 to $22,499 | 7 (4.3%) | 2 (1.0%) |
| $22,500 to $24,999 | 3 (1.8%) | 8 (3.9%) |
| $25,000 to $29,999 | 4 (2.5%) | 37 (18.0%) |
| $30,000 to $34,999 | 24 (14.7%) | 24 (11.7%) |
| $35,000 to $39,999 | 14 (8.6%) | 28 (13.7%) |
| $40,000 to $44,999 | 25 (15.3%) | 2 (1.0%) |
| $45,000 to $49,999 | 4 (2.5%) | 4 (1.9%) |
| $50,000 to $54,999 | 2 (1.2%) | 7 (3.4%) |
| $55,000 to $64,999 | 5 (3.1%) | 6 (2.9%) |
| $65,000 to $74,999 | 15 (9.2%) | 6 (2.9%) |
| $75,000 to $99,999 | 4 (2.5%) | 0 (0.0%) |
| $100,000+ | 8 (4.9%) | 0 (0.0%) |
| Total | 163 (100.0%) | 205 (100.0%) |
Earnings by Sex by Educational Attainment in Clarence
Average earnings in Clarence are $37,143 for men and $27,417 for women, a difference of 26.2%. Men with an educational attainment of high school diploma enjoy the highest average annual earnings of $40,875, while those with college or associate's degree education earn the least with $32,188. Women with an educational attainment of high school diploma earn the most with the average annual earnings of $28,580, while those with college or associate's degree education have the smallest earnings of $19,432.
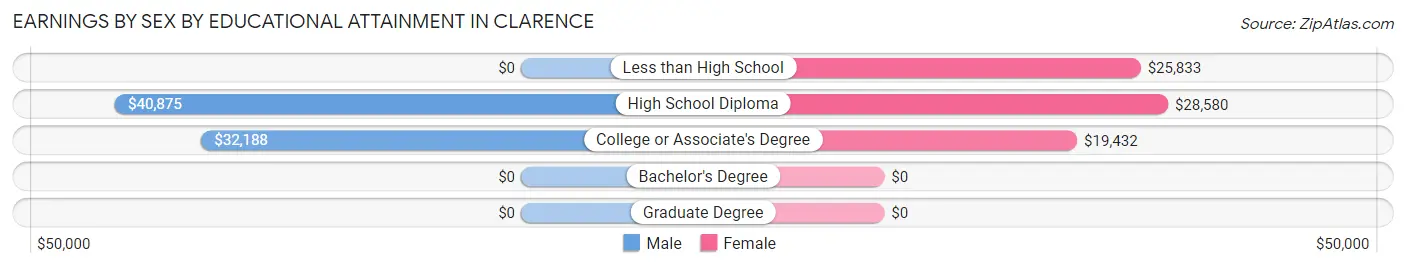
| Educational Attainment | Male Income | Female Income |
| Less than High School | - | - |
| High School Diploma | $40,875 | $28,580 |
| College or Associate's Degree | $32,188 | $19,432 |
| Bachelor's Degree | - | - |
| Graduate Degree | - | - |
| Total | $37,143 | $27,417 |
Family Income in Clarence
Family Income Brackets in Clarence
According to the Clarence family income data, there are 61 families falling into the $25,000 to $34,999 income range, which is the most common income bracket and makes up 28.8% of all families.
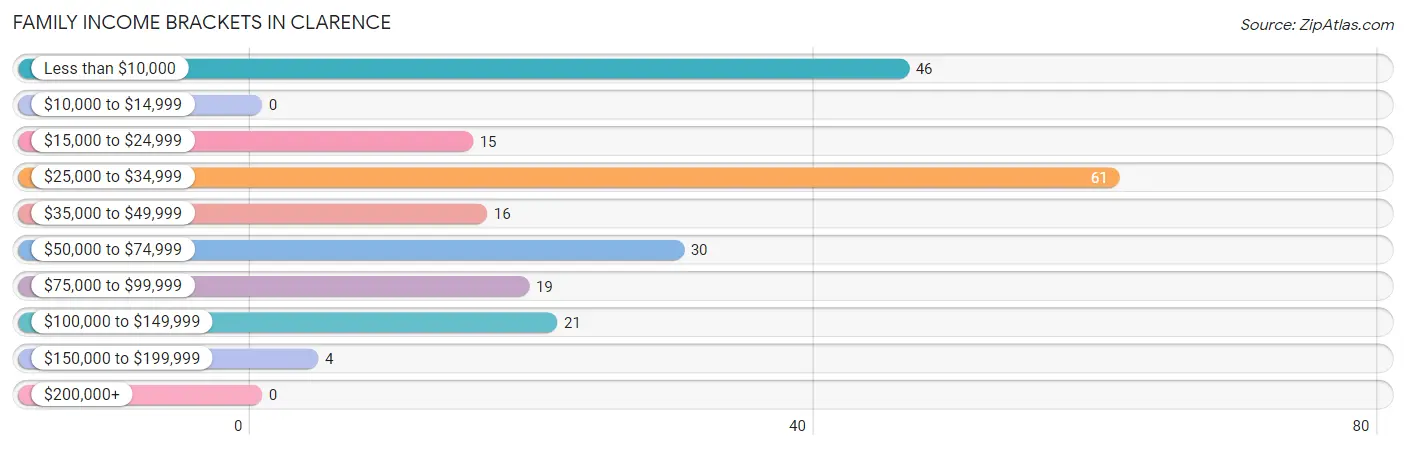
| Income Bracket | # Families | % Families |
| Less than $10,000 | 46 | 21.7% |
| $10,000 to $14,999 | 0 | 0.0% |
| $15,000 to $24,999 | 15 | 7.1% |
| $25,000 to $34,999 | 61 | 28.8% |
| $35,000 to $49,999 | 16 | 7.5% |
| $50,000 to $74,999 | 30 | 14.2% |
| $75,000 to $99,999 | 19 | 9.0% |
| $100,000 to $149,999 | 21 | 9.9% |
| $150,000 to $199,999 | 4 | 1.9% |
| $200,000+ | 0 | 0.0% |
Family Income by Famaliy Size in Clarence
4-person families (8 | 3.8%) account for the highest median family income in Clarence with $73,333 per family, while 4-person families (8 | 3.8%) have the highest median income of $18,333 per family member.

| Income Bracket | # Families | Median Income |
| 2-Person Families | 113 (53.3%) | $33,375 |
| 3-Person Families | 61 (28.8%) | $28,650 |
| 4-Person Families | 8 (3.8%) | $73,333 |
| 5-Person Families | 22 (10.4%) | $0 |
| 6-Person Families | 8 (3.8%) | $0 |
| 7+ Person Families | 0 (0.0%) | $0 |
| Total | 212 (100.0%) | $31,111 |
Family Income by Number of Earners in Clarence
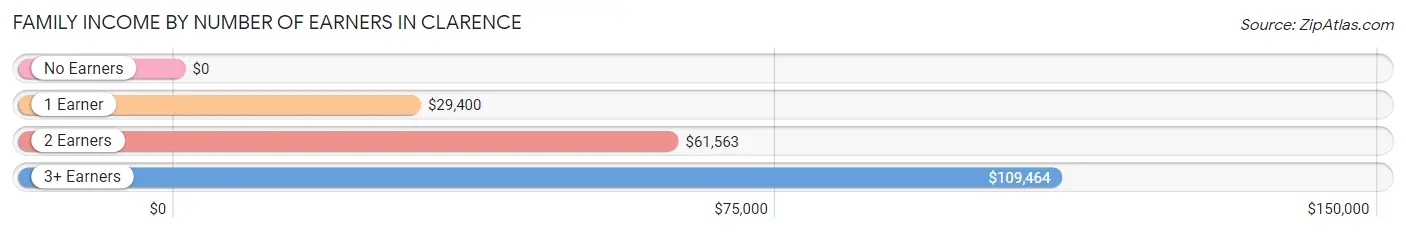
| Number of Earners | # Families | Median Income |
| No Earners | 58 (27.4%) | $0 |
| 1 Earner | 92 (43.4%) | $29,400 |
| 2 Earners | 47 (22.2%) | $61,563 |
| 3+ Earners | 15 (7.1%) | $109,464 |
| Total | 212 (100.0%) | $31,111 |
Household Income in Clarence
Household Income Brackets in Clarence
With 75 households falling in the category, the $25,000 to $34,999 income range is the most frequent in Clarence, accounting for 19.5% of all households.
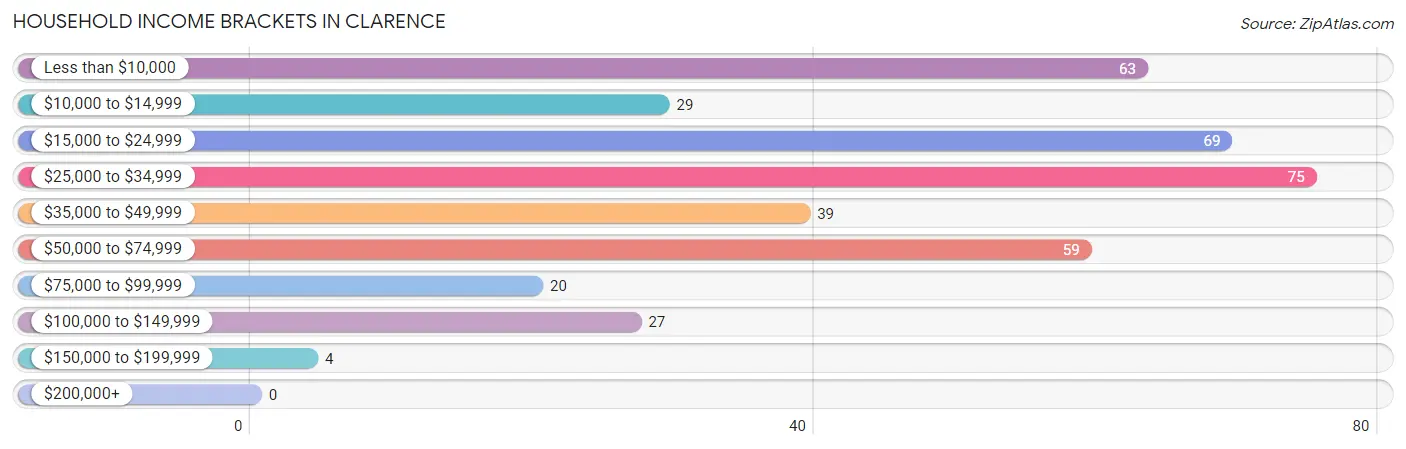
| Income Bracket | # Households | % Households |
| Less than $10,000 | 63 | 16.4% |
| $10,000 to $14,999 | 29 | 7.5% |
| $15,000 to $24,999 | 69 | 17.9% |
| $25,000 to $34,999 | 75 | 19.5% |
| $35,000 to $49,999 | 39 | 10.1% |
| $50,000 to $74,999 | 59 | 15.3% |
| $75,000 to $99,999 | 20 | 5.2% |
| $100,000 to $149,999 | 27 | 7.0% |
| $150,000 to $199,999 | 4 | 1.0% |
| $200,000+ | 0 | 0.0% |
Household Income by Householder Age in Clarence
The median household income in Clarence is $28,843, with the highest median household income of $50,625 found in the 25 to 44 years age bracket for the primary householder. A total of 68 households (17.7%) fall into this category. Meanwhile, the 15 to 24 years age bracket for the primary householder has the lowest median household income of $0, with 24 households (6.2%) in this group.
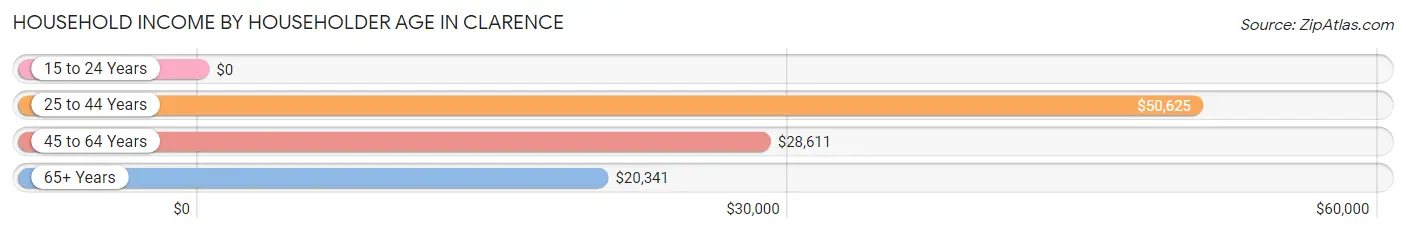
| Income Bracket | # Households | Median Income |
| 15 to 24 Years | 24 (6.2%) | $0 |
| 25 to 44 Years | 68 (17.7%) | $50,625 |
| 45 to 64 Years | 152 (39.5%) | $28,611 |
| 65+ Years | 141 (36.6%) | $20,341 |
| Total | 385 (100.0%) | $28,843 |
Poverty in Clarence
Income Below Poverty by Sex and Age in Clarence
With 27.2% poverty level for males and 37.0% for females among the residents of Clarence, 65 to 74 year old males and 5 year old females are the most vulnerable to poverty, with 42 males (56.0%) and 5 females (100.0%) in their respective age groups living below the poverty level.
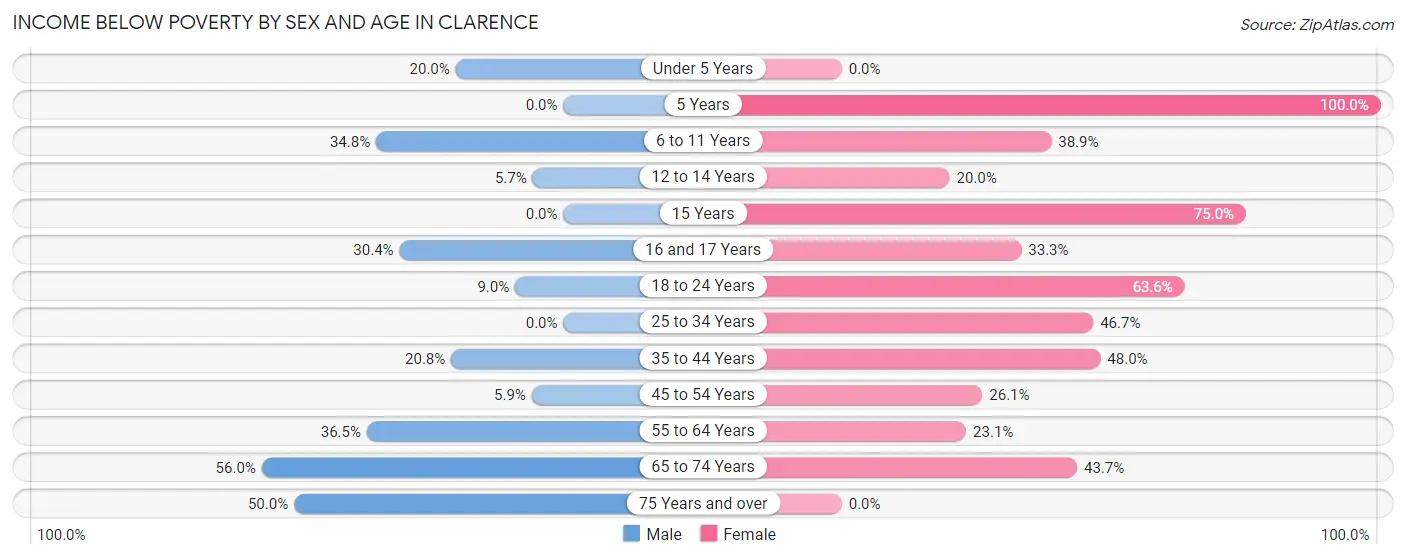
| Age Bracket | Male | Female |
| Under 5 Years | 3 (20.0%) | 0 (0.0%) |
| 5 Years | 0 (0.0%) | 5 (100.0%) |
| 6 to 11 Years | 8 (34.8%) | 7 (38.9%) |
| 12 to 14 Years | 2 (5.7%) | 1 (20.0%) |
| 15 Years | 0 (0.0%) | 3 (75.0%) |
| 16 and 17 Years | 7 (30.4%) | 1 (33.3%) |
| 18 to 24 Years | 6 (9.0%) | 42 (63.6%) |
| 25 to 34 Years | 0 (0.0%) | 21 (46.7%) |
| 35 to 44 Years | 10 (20.8%) | 24 (48.0%) |
| 45 to 54 Years | 2 (5.9%) | 12 (26.1%) |
| 55 to 64 Years | 27 (36.5%) | 15 (23.1%) |
| 65 to 74 Years | 42 (56.0%) | 38 (43.7%) |
| 75 Years and over | 12 (50.0%) | 0 (0.0%) |
| Total | 119 (27.2%) | 169 (37.0%) |
Income Above Poverty by Sex and Age in Clarence
According to the poverty statistics in Clarence, males aged 15 years and females aged under 5 years are the age groups that are most secure financially, with 100.0% of males and 100.0% of females in these age groups living above the poverty line.
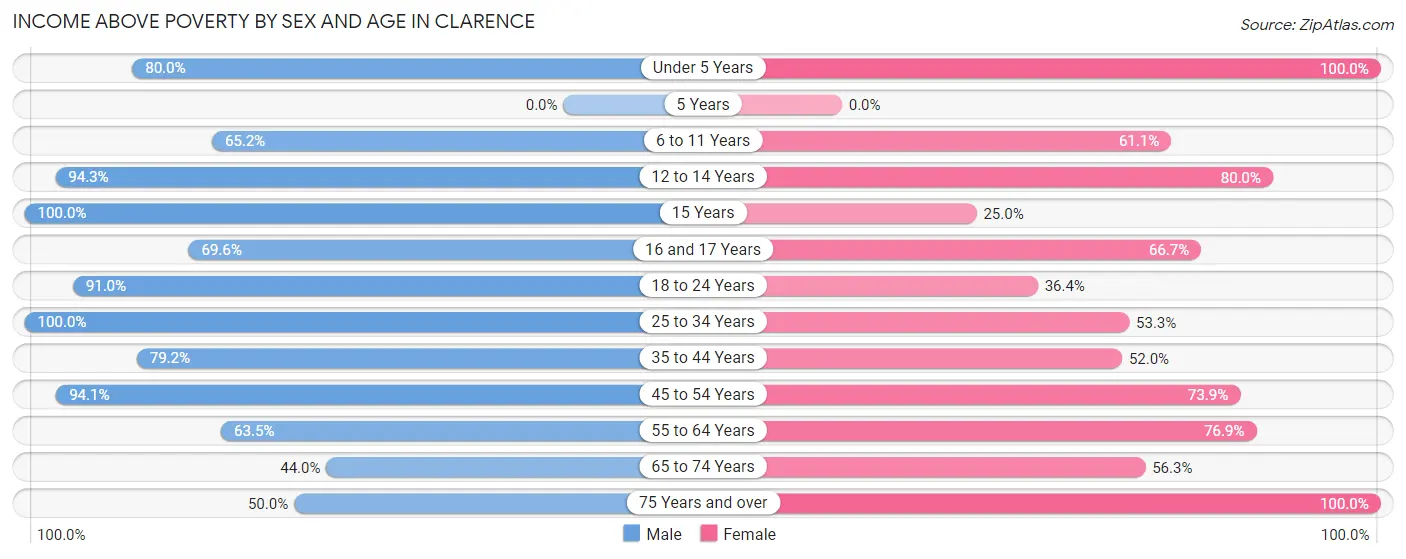
| Age Bracket | Male | Female |
| Under 5 Years | 12 (80.0%) | 29 (100.0%) |
| 5 Years | 0 (0.0%) | 0 (0.0%) |
| 6 to 11 Years | 15 (65.2%) | 11 (61.1%) |
| 12 to 14 Years | 33 (94.3%) | 4 (80.0%) |
| 15 Years | 4 (100.0%) | 1 (25.0%) |
| 16 and 17 Years | 16 (69.6%) | 2 (66.7%) |
| 18 to 24 Years | 61 (91.0%) | 24 (36.4%) |
| 25 to 34 Years | 15 (100.0%) | 24 (53.3%) |
| 35 to 44 Years | 38 (79.2%) | 26 (52.0%) |
| 45 to 54 Years | 32 (94.1%) | 34 (73.9%) |
| 55 to 64 Years | 47 (63.5%) | 50 (76.9%) |
| 65 to 74 Years | 33 (44.0%) | 49 (56.3%) |
| 75 Years and over | 12 (50.0%) | 34 (100.0%) |
| Total | 318 (72.8%) | 288 (63.0%) |
Income Below Poverty Among Married-Couple Families in Clarence
The poverty statistics for married-couple families in Clarence show that 34.0% or 50 of the total 147 families live below the poverty line. Families with no children have the highest poverty rate of 37.6%, comprising of 41 families. On the other hand, families with 3 or 4 children have the lowest poverty rate of 0.0%, which includes 0 families.
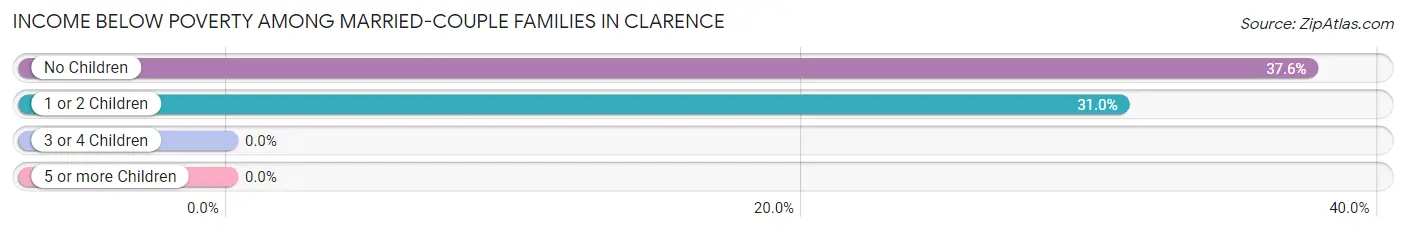
| Children | Above Poverty | Below Poverty |
| No Children | 68 (62.4%) | 41 (37.6%) |
| 1 or 2 Children | 20 (69.0%) | 9 (31.0%) |
| 3 or 4 Children | 9 (100.0%) | 0 (0.0%) |
| 5 or more Children | 0 (0.0%) | 0 (0.0%) |
| Total | 97 (66.0%) | 50 (34.0%) |
Income Below Poverty Among Single-Parent Households in Clarence
According to the poverty data in Clarence, 5.9% or 1 single-father households and 22.9% or 11 single-mother households are living below the poverty line. Among single-father households, those with 3 or 4 children have the highest poverty rate, with 1 households (100.0%) experiencing poverty. Likewise, among single-mother households, those with 3 or 4 children have the highest poverty rate, with 1 households (100.0%) falling below the poverty line.
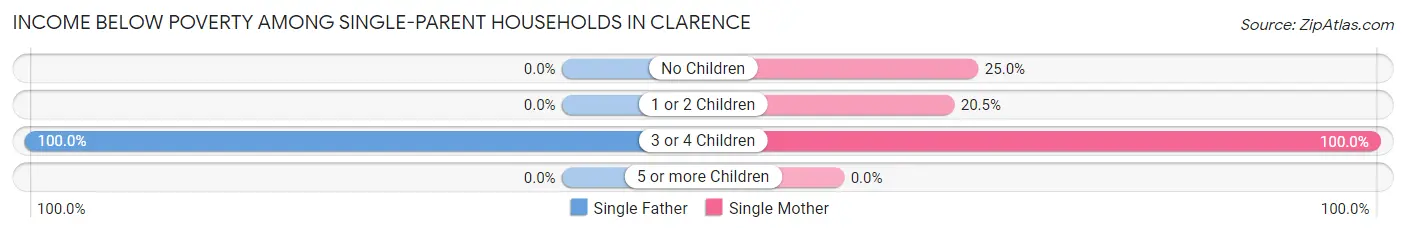
| Children | Single Father | Single Mother |
| No Children | 0 (0.0%) | 2 (25.0%) |
| 1 or 2 Children | 0 (0.0%) | 8 (20.5%) |
| 3 or 4 Children | 1 (100.0%) | 1 (100.0%) |
| 5 or more Children | 0 (0.0%) | 0 (0.0%) |
| Total | 1 (5.9%) | 11 (22.9%) |
Income Below Poverty Among Married-Couple vs Single-Parent Households in Clarence
The poverty data for Clarence shows that 50 of the married-couple family households (34.0%) and 12 of the single-parent households (18.5%) are living below the poverty level. Within the married-couple family households, those with no children have the highest poverty rate, with 41 households (37.6%) falling below the poverty line. Among the single-parent households, those with 3 or 4 children have the highest poverty rate, with 2 household (100.0%) living below poverty.
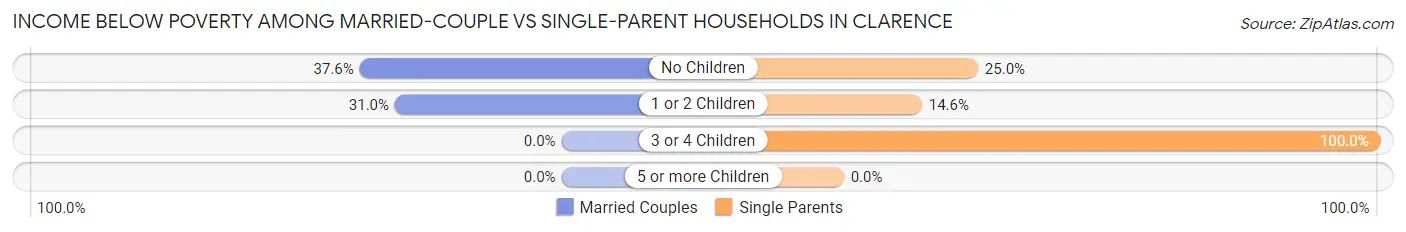
| Children | Married-Couple Families | Single-Parent Households |
| No Children | 41 (37.6%) | 2 (25.0%) |
| 1 or 2 Children | 9 (31.0%) | 8 (14.5%) |
| 3 or 4 Children | 0 (0.0%) | 2 (100.0%) |
| 5 or more Children | 0 (0.0%) | 0 (0.0%) |
| Total | 50 (34.0%) | 12 (18.5%) |
Race in Clarence
The most populous races in Clarence are White / Caucasian (884 | 94.4%), Hispanic or Latino (43 | 4.6%), and Two or more Races (28 | 3.0%).
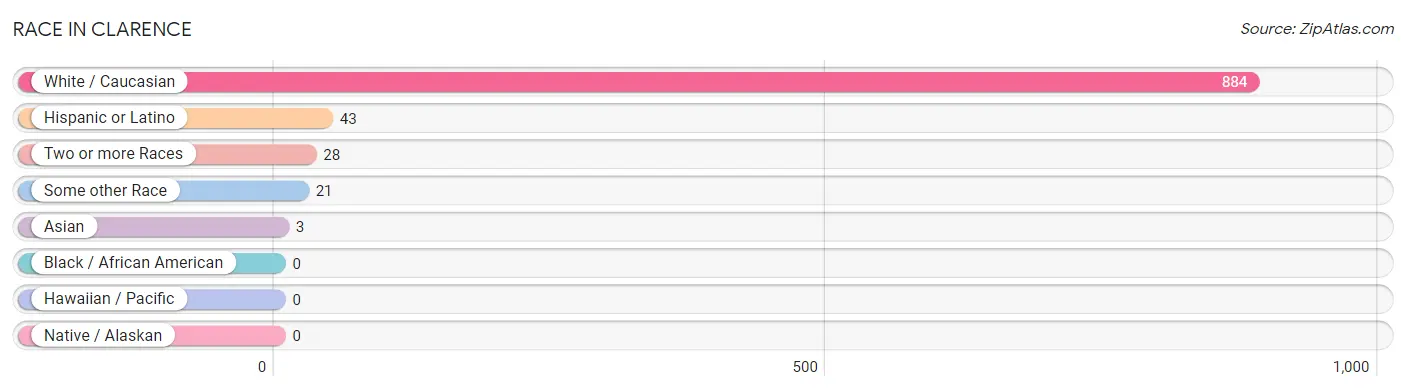
| Race | # Population | % Population |
| Asian | 3 | 0.3% |
| Black / African American | 0 | 0.0% |
| Hawaiian / Pacific | 0 | 0.0% |
| Hispanic or Latino | 43 | 4.6% |
| Native / Alaskan | 0 | 0.0% |
| White / Caucasian | 884 | 94.4% |
| Two or more Races | 28 | 3.0% |
| Some other Race | 21 | 2.2% |
| Total | 936 | 100.0% |
Ancestry in Clarence
The most populous ancestries reported in Clarence are American (160 | 17.1%), German (126 | 13.5%), English (86 | 9.2%), Irish (71 | 7.6%), and Mexican (30 | 3.2%), together accounting for 50.5% of all Clarence residents.
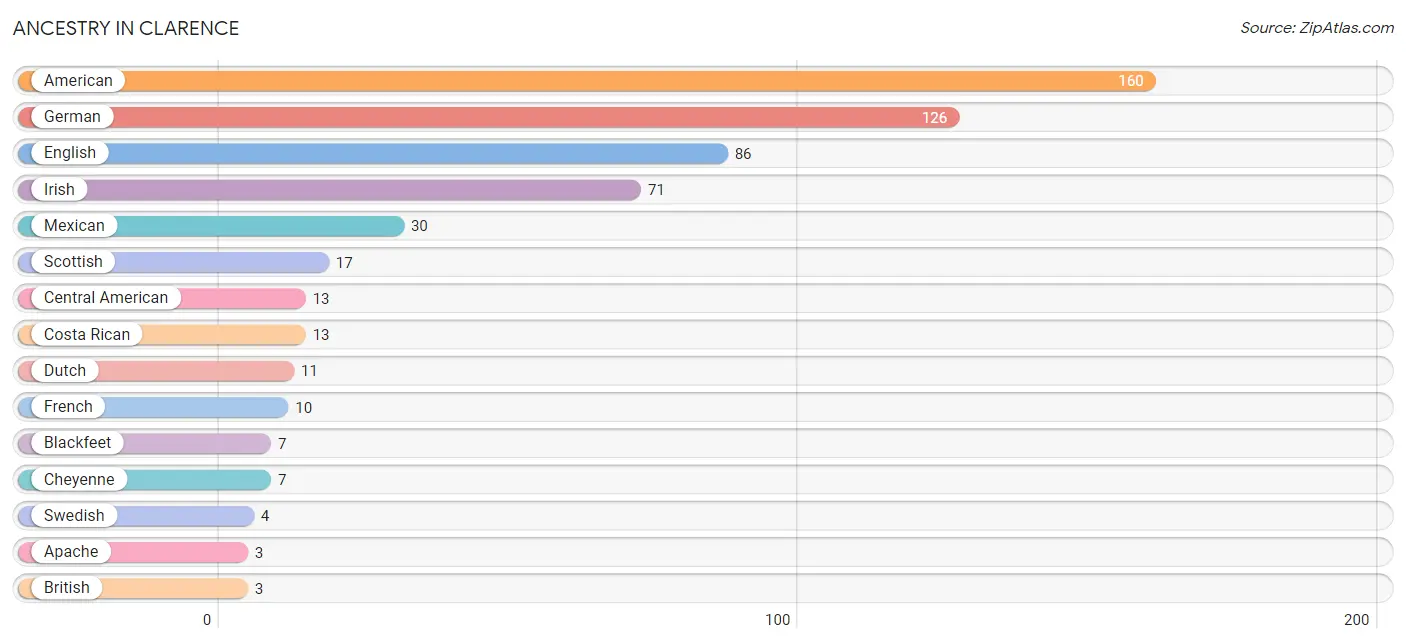
| Ancestry | # Population | % Population |
| American | 160 | 17.1% |
| Apache | 3 | 0.3% |
| Blackfeet | 7 | 0.7% |
| British | 3 | 0.3% |
| Central American | 13 | 1.4% |
| Cherokee | 2 | 0.2% |
| Cheyenne | 7 | 0.7% |
| Costa Rican | 13 | 1.4% |
| Dutch | 11 | 1.2% |
| English | 86 | 9.2% |
| French | 10 | 1.1% |
| German | 126 | 13.5% |
| Irish | 71 | 7.6% |
| Japanese | 3 | 0.3% |
| Lumbee | 3 | 0.3% |
| Mexican | 30 | 3.2% |
| Scotch-Irish | 2 | 0.2% |
| Scottish | 17 | 1.8% |
| Swedish | 4 | 0.4% | View All 19 Rows |
Immigrants in Clarence
The most numerous immigrant groups reported in Clarence came from Central America (4 | 0.4%), Latin America (4 | 0.4%), Mexico (4 | 0.4%), Asia (3 | 0.3%), and Cambodia (3 | 0.3%), together accounting for 1.9% of all Clarence residents.
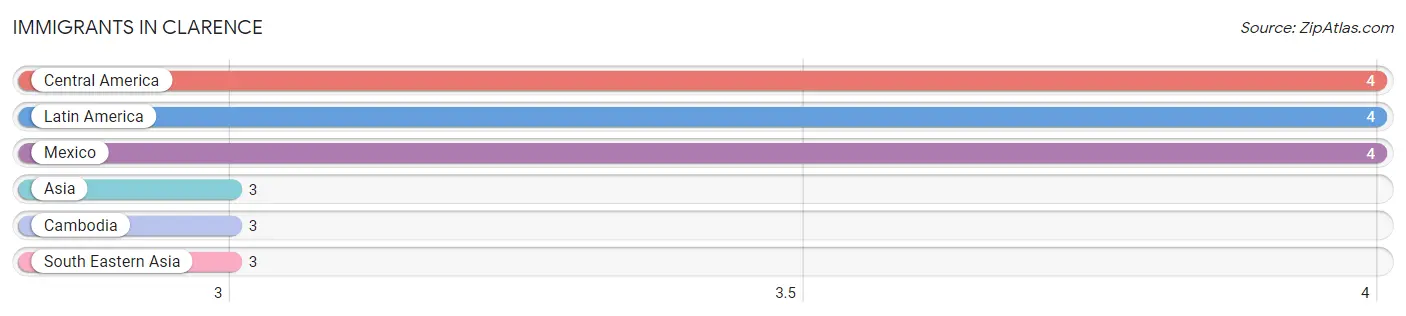
| Immigration Origin | # Population | % Population |
| Asia | 3 | 0.3% |
| Cambodia | 3 | 0.3% |
| Central America | 4 | 0.4% |
| Latin America | 4 | 0.4% |
| Mexico | 4 | 0.4% |
| South Eastern Asia | 3 | 0.3% | View All 6 Rows |
Sex and Age in Clarence
Sex and Age in Clarence
The most populous age groups in Clarence are 20 to 24 Years (59 | 13.1%) for men and 55 to 59 Years (45 | 9.3%) for women.
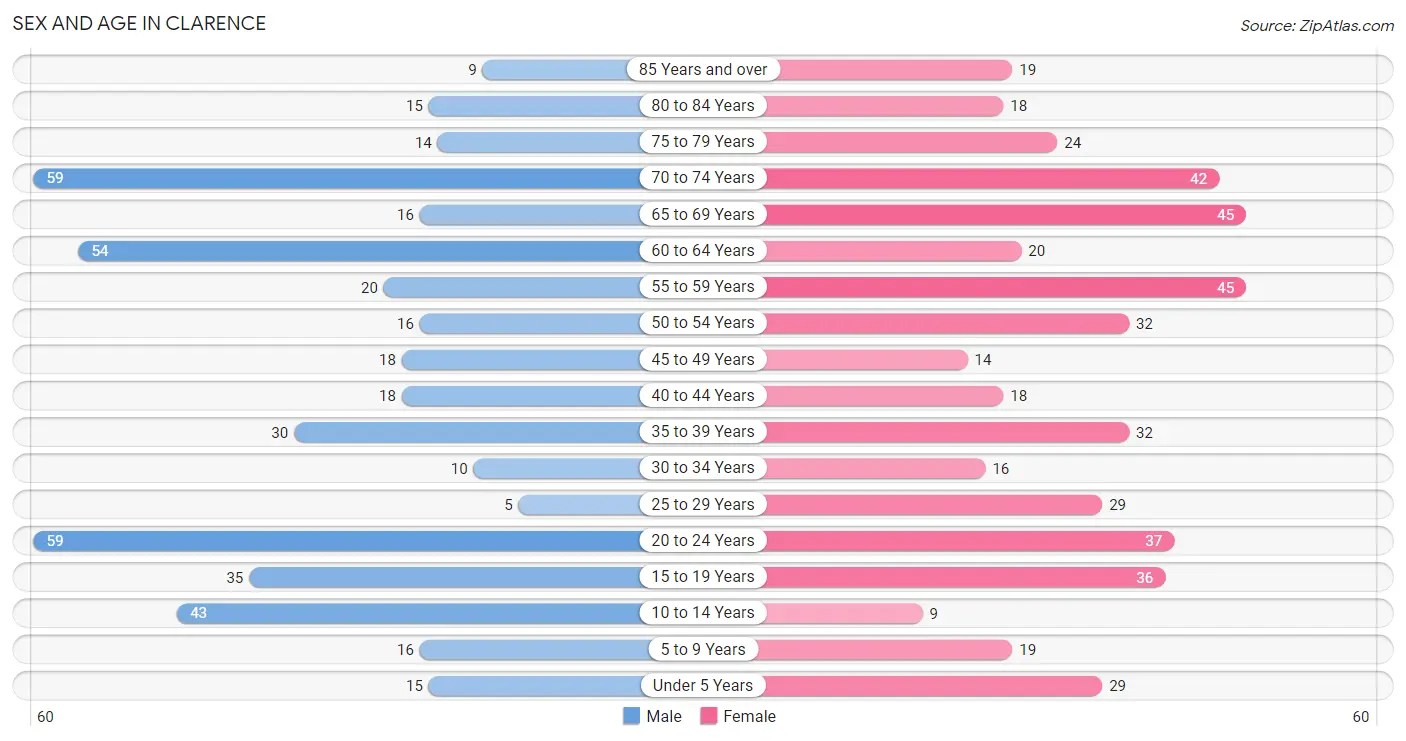
| Age Bracket | Male | Female |
| Under 5 Years | 15 (3.3%) | 29 (6.0%) |
| 5 to 9 Years | 16 (3.5%) | 19 (3.9%) |
| 10 to 14 Years | 43 (9.5%) | 9 (1.9%) |
| 15 to 19 Years | 35 (7.7%) | 36 (7.4%) |
| 20 to 24 Years | 59 (13.1%) | 37 (7.6%) |
| 25 to 29 Years | 5 (1.1%) | 29 (6.0%) |
| 30 to 34 Years | 10 (2.2%) | 16 (3.3%) |
| 35 to 39 Years | 30 (6.6%) | 32 (6.6%) |
| 40 to 44 Years | 18 (4.0%) | 18 (3.7%) |
| 45 to 49 Years | 18 (4.0%) | 14 (2.9%) |
| 50 to 54 Years | 16 (3.5%) | 32 (6.6%) |
| 55 to 59 Years | 20 (4.4%) | 45 (9.3%) |
| 60 to 64 Years | 54 (11.9%) | 20 (4.1%) |
| 65 to 69 Years | 16 (3.5%) | 45 (9.3%) |
| 70 to 74 Years | 59 (13.1%) | 42 (8.7%) |
| 75 to 79 Years | 14 (3.1%) | 24 (5.0%) |
| 80 to 84 Years | 15 (3.3%) | 18 (3.7%) |
| 85 Years and over | 9 (2.0%) | 19 (3.9%) |
| Total | 452 (100.0%) | 484 (100.0%) |
Families and Households in Clarence
Median Family Size in Clarence
The median family size in Clarence is 3.15 persons per family, with single female/mother families (48 | 22.6%) accounting for the largest median family size of 4.02 persons per family. On the other hand, married-couple families (147 | 69.3%) represent the smallest median family size with 2.82 persons per family.
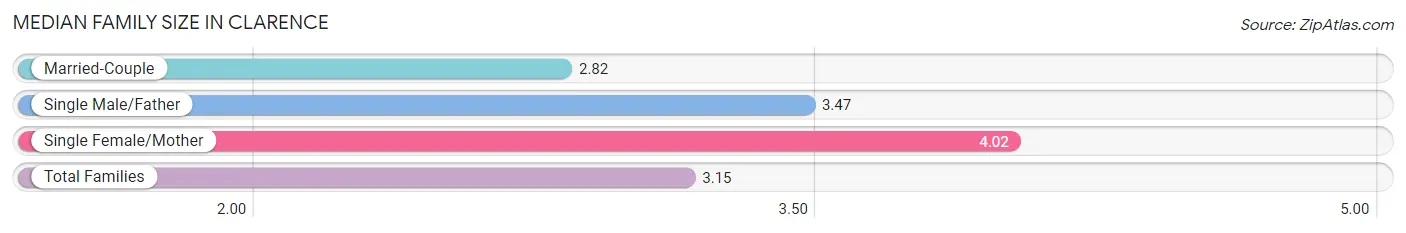
| Family Type | # Families | Family Size |
| Married-Couple | 147 (69.3%) | 2.82 |
| Single Male/Father | 17 (8.0%) | 3.47 |
| Single Female/Mother | 48 (22.6%) | 4.02 |
| Total Families | 212 (100.0%) | 3.15 |
Median Household Size in Clarence
The median household size in Clarence is 2.32 persons per household, with single male/father households (17 | 4.4%) accounting for the largest median household size of 4.71 persons per household. non-family households (173 | 44.9%) represent the smallest median household size with 1.02 persons per household.
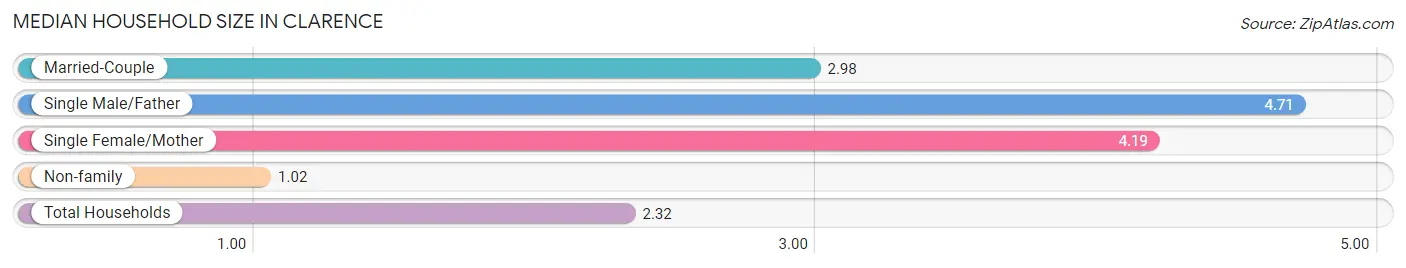
| Household Type | # Households | Household Size |
| Married-Couple | 147 (38.2%) | 2.98 |
| Single Male/Father | 17 (4.4%) | 4.71 |
| Single Female/Mother | 48 (12.5%) | 4.19 |
| Non-family | 173 (44.9%) | 1.02 |
| Total Households | 385 (100.0%) | 2.32 |
Household Size by Marriage Status in Clarence
Out of a total of 385 households in Clarence, 212 (55.1%) are family households, while 173 (44.9%) are nonfamily households. The most numerous type of family households are 2-person households, comprising 98, and the most common type of nonfamily households are 1-person households, comprising 171.
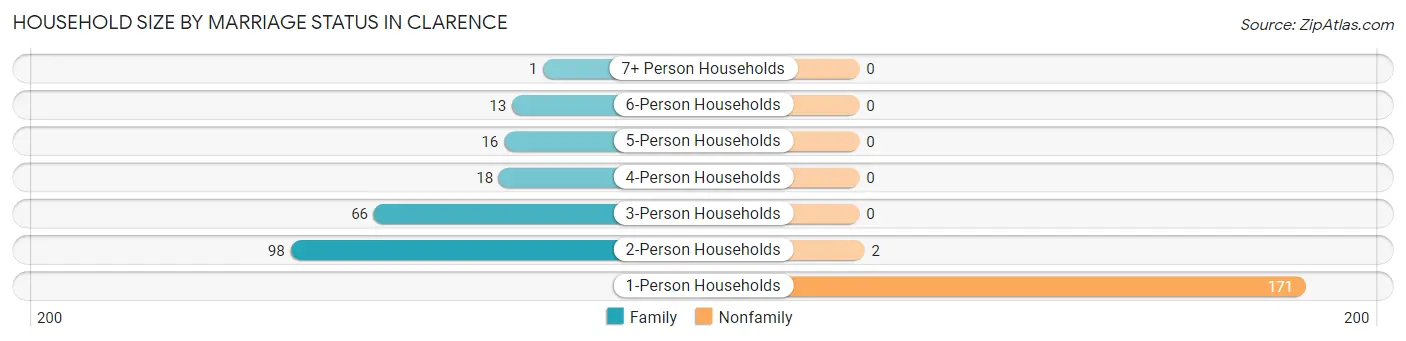
| Household Size | Family Households | Nonfamily Households |
| 1-Person Households | - | 171 (44.4%) |
| 2-Person Households | 98 (25.5%) | 2 (0.5%) |
| 3-Person Households | 66 (17.1%) | 0 (0.0%) |
| 4-Person Households | 18 (4.7%) | 0 (0.0%) |
| 5-Person Households | 16 (4.2%) | 0 (0.0%) |
| 6-Person Households | 13 (3.4%) | 0 (0.0%) |
| 7+ Person Households | 1 (0.3%) | 0 (0.0%) |
| Total | 212 (55.1%) | 173 (44.9%) |
Female Fertility in Clarence
Fertility by Age in Clarence
Average fertility rate in Clarence is 82.0 births per 1,000 women. Women in the age bracket of 20 to 34 years have the highest fertility rate with 134.0 births per 1,000 women. Women in the age bracket of 20 to 34 years acount for 73.3% of all women with births.
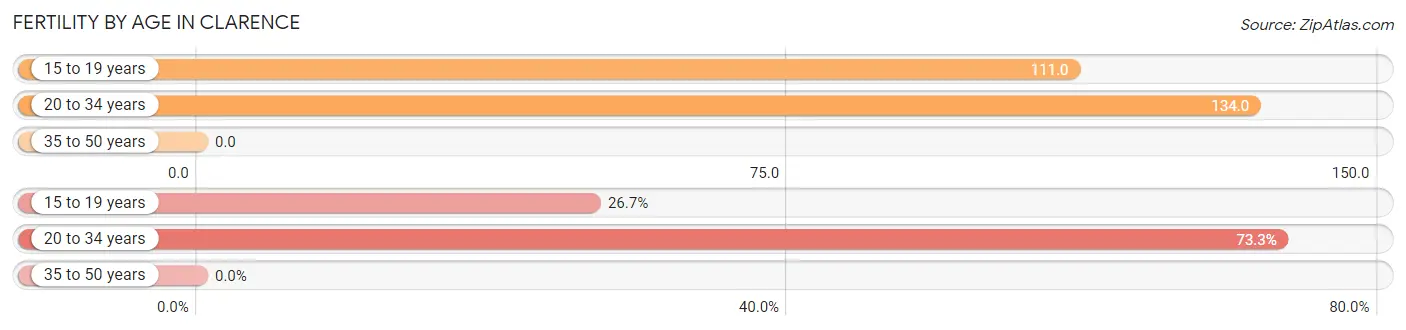
| Age Bracket | Women with Births | Births / 1,000 Women |
| 15 to 19 years | 4 (26.7%) | 111.0 |
| 20 to 34 years | 11 (73.3%) | 134.0 |
| 35 to 50 years | 0 (0.0%) | 0.0 |
| Total | 15 (100.0%) | 82.0 |
Fertility by Age by Marriage Status in Clarence
20.0% of women with births (15) in Clarence are married. The highest percentage of unmarried women with births falls into 15 to 19 years age bracket with 100.0% of them unmarried at the time of birth, while the lowest percentage of unmarried women with births belong to 20 to 34 years age bracket with 72.7% of them unmarried.
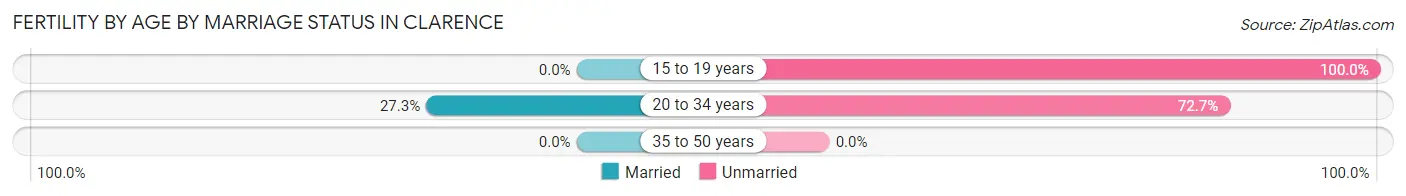
| Age Bracket | Married | Unmarried |
| 15 to 19 years | 0 (0.0%) | 4 (100.0%) |
| 20 to 34 years | 3 (27.3%) | 8 (72.7%) |
| 35 to 50 years | 0 (0.0%) | 0 (0.0%) |
| Total | 3 (20.0%) | 12 (80.0%) |
Fertility by Education in Clarence
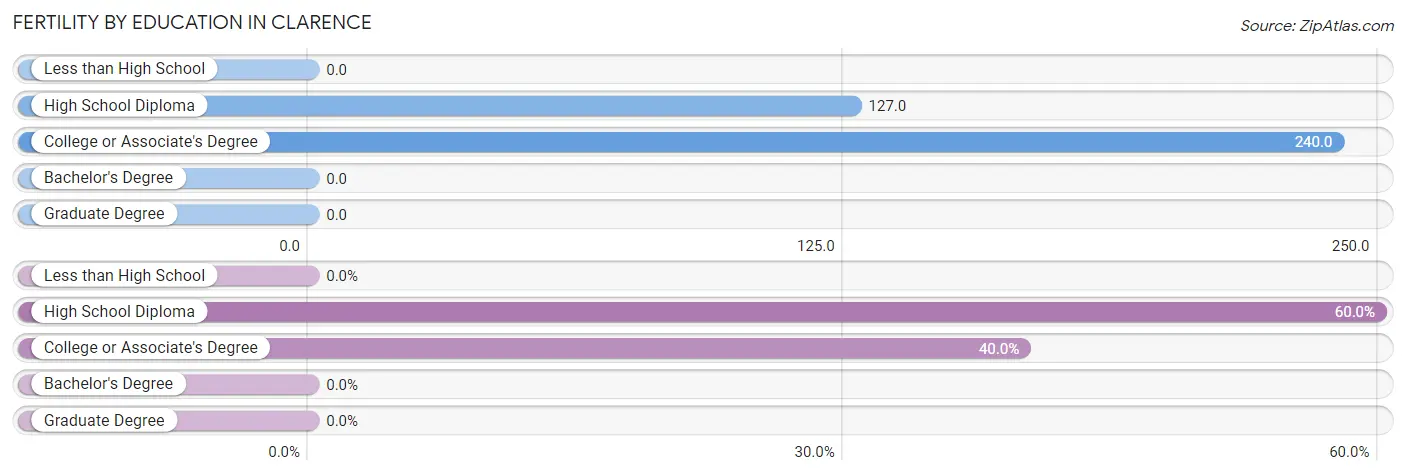
| Educational Attainment | Women with Births | Births / 1,000 Women |
| Less than High School | 0 (0.0%) | 0.0 |
| High School Diploma | 9 (60.0%) | 127.0 |
| College or Associate's Degree | 6 (40.0%) | 240.0 |
| Bachelor's Degree | 0 (0.0%) | 0.0 |
| Graduate Degree | 0 (0.0%) | 0.0 |
| Total | 15 (100.0%) | 82.0 |
Fertility by Education by Marriage Status in Clarence
80.0% of women with births in Clarence are unmarried. Women with the educational attainment of college or associate's degree are most likely to be married with 50.0% of them married at childbirth, while women with the educational attainment of high school diploma are least likely to be married with 100.0% of them unmarried at childbirth.
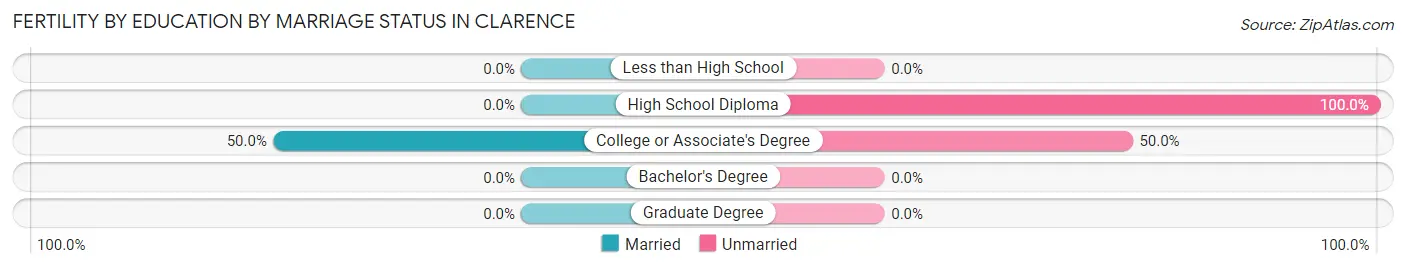
| Educational Attainment | Married | Unmarried |
| Less than High School | 0 (0.0%) | 0 (0.0%) |
| High School Diploma | 0 (0.0%) | 9 (100.0%) |
| College or Associate's Degree | 3 (50.0%) | 3 (50.0%) |
| Bachelor's Degree | 0 (0.0%) | 0 (0.0%) |
| Graduate Degree | 0 (0.0%) | 0 (0.0%) |
| Total | 3 (20.0%) | 12 (80.0%) |
Employment Characteristics in Clarence
Employment by Class of Employer in Clarence
Among the 323 employed individuals in Clarence, private company employees (237 | 73.4%), self-employed (not incorporated) (46 | 14.2%), and local government employees (13 | 4.0%) make up the most common classes of employment.
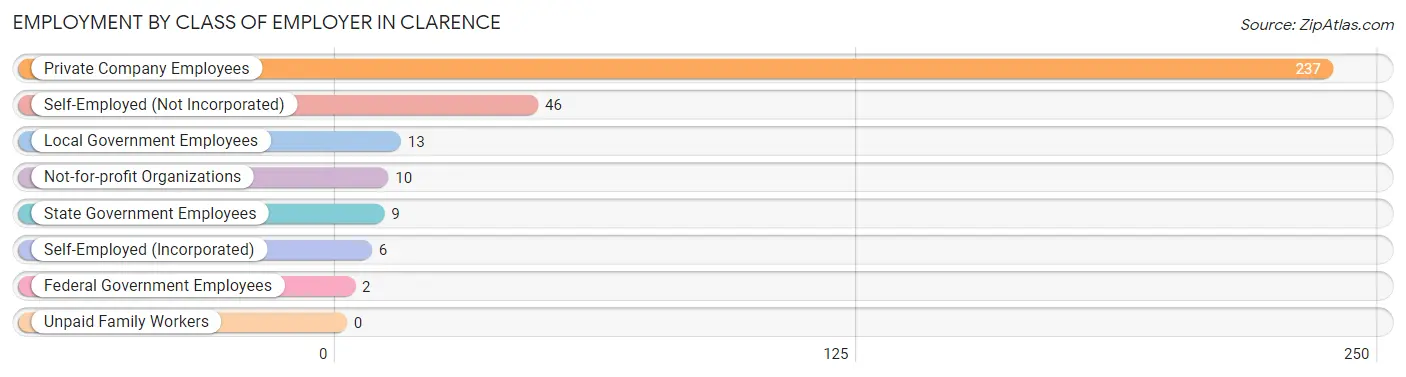
| Employer Class | # Employees | % Employees |
| Private Company Employees | 237 | 73.4% |
| Self-Employed (Incorporated) | 6 | 1.9% |
| Self-Employed (Not Incorporated) | 46 | 14.2% |
| Not-for-profit Organizations | 10 | 3.1% |
| Local Government Employees | 13 | 4.0% |
| State Government Employees | 9 | 2.8% |
| Federal Government Employees | 2 | 0.6% |
| Unpaid Family Workers | 0 | 0.0% |
| Total | 323 | 100.0% |
Employment Status by Age in Clarence
According to the labor force statistics for Clarence, out of the total population over 16 years of age (797), 43.0% or 343 individuals are in the labor force, with 2.3% or 8 of them unemployed. The age group with the highest labor force participation rate is 30 to 34 years, with 76.9% or 20 individuals in the labor force. Within the labor force, the 20 to 24 years age range has the highest percentage of unemployed individuals, with 13.9% or 5 of them being unemployed.
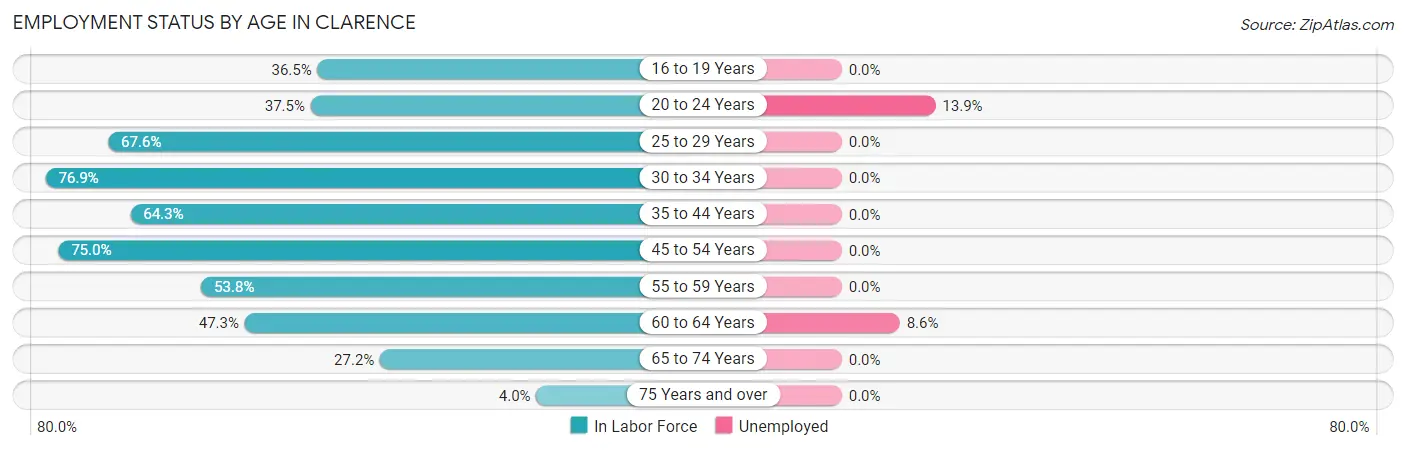
| Age Bracket | In Labor Force | Unemployed |
| 16 to 19 Years | 23 (36.5%) | 0 (0.0%) |
| 20 to 24 Years | 36 (37.5%) | 5 (13.9%) |
| 25 to 29 Years | 23 (67.6%) | 0 (0.0%) |
| 30 to 34 Years | 20 (76.9%) | 0 (0.0%) |
| 35 to 44 Years | 63 (64.3%) | 0 (0.0%) |
| 45 to 54 Years | 60 (75.0%) | 0 (0.0%) |
| 55 to 59 Years | 35 (53.8%) | 0 (0.0%) |
| 60 to 64 Years | 35 (47.3%) | 3 (8.6%) |
| 65 to 74 Years | 44 (27.2%) | 0 (0.0%) |
| 75 Years and over | 4 (4.0%) | 0 (0.0%) |
| Total | 343 (43.0%) | 8 (2.3%) |
Employment Status by Educational Attainment in Clarence
According to labor force statistics for Clarence, 62.6% of individuals (236) out of the total population between 25 and 64 years of age (377) are in the labor force, with 1.3% or 3 of them being unemployed. The group with the highest labor force participation rate are those with the educational attainment of high school diploma, with 72.0% or 126 individuals in the labor force. Within the labor force, individuals with high school diploma education have the highest percentage of unemployment, with 2.4% or 3 of them being unemployed.
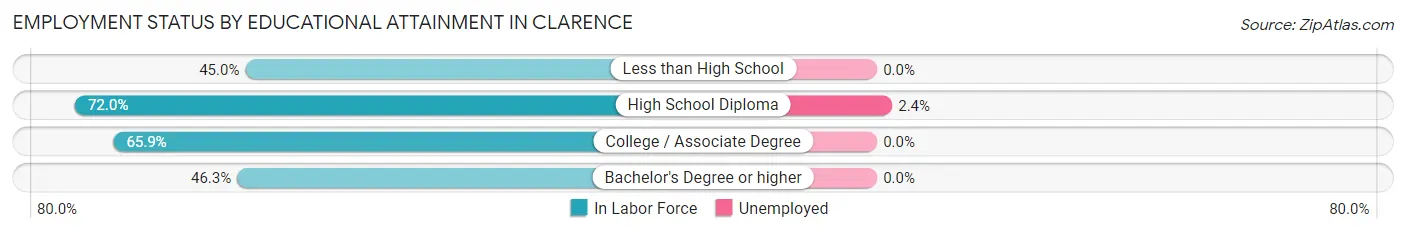
| Educational Attainment | In Labor Force | Unemployed |
| Less than High School | 27 (45.0%) | 0 (0.0%) |
| High School Diploma | 126 (72.0%) | 4 (2.4%) |
| College / Associate Degree | 58 (65.9%) | 0 (0.0%) |
| Bachelor's Degree or higher | 25 (46.3%) | 0 (0.0%) |
| Total | 236 (62.6%) | 5 (1.3%) |
Employment Occupations by Sex in Clarence
Management, Business, Science and Arts Occupations
The most common Management, Business, Science and Arts occupations in Clarence are Management (25 | 7.5%), Health Diagnosing & Treating (15 | 4.5%), Community & Social Service (9 | 2.7%), Education Instruction & Library (9 | 2.7%), and Computers, Engineering & Science (7 | 2.1%).
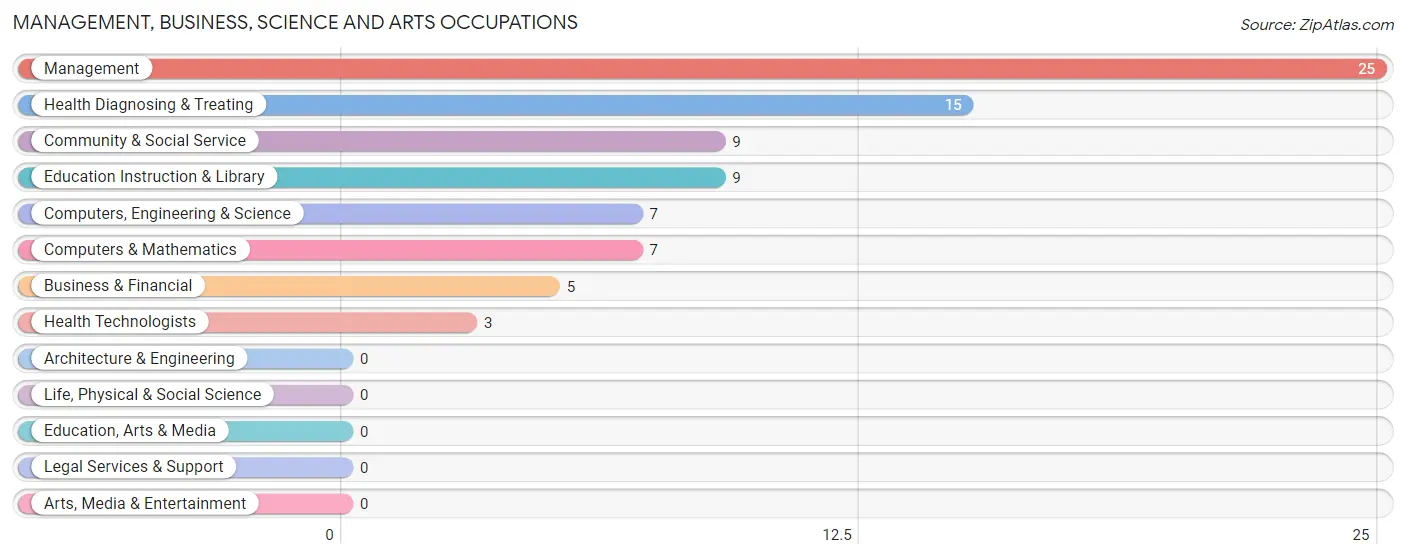
Management, Business, Science and Arts Occupations by Sex
Within the Management, Business, Science and Arts occupations in Clarence, the most male-oriented occupations are Computers, Engineering & Science (100.0%), Computers & Mathematics (100.0%), and Management (72.0%), while the most female-oriented occupations are Business & Financial (100.0%), Health Diagnosing & Treating (100.0%), and Health Technologists (100.0%).
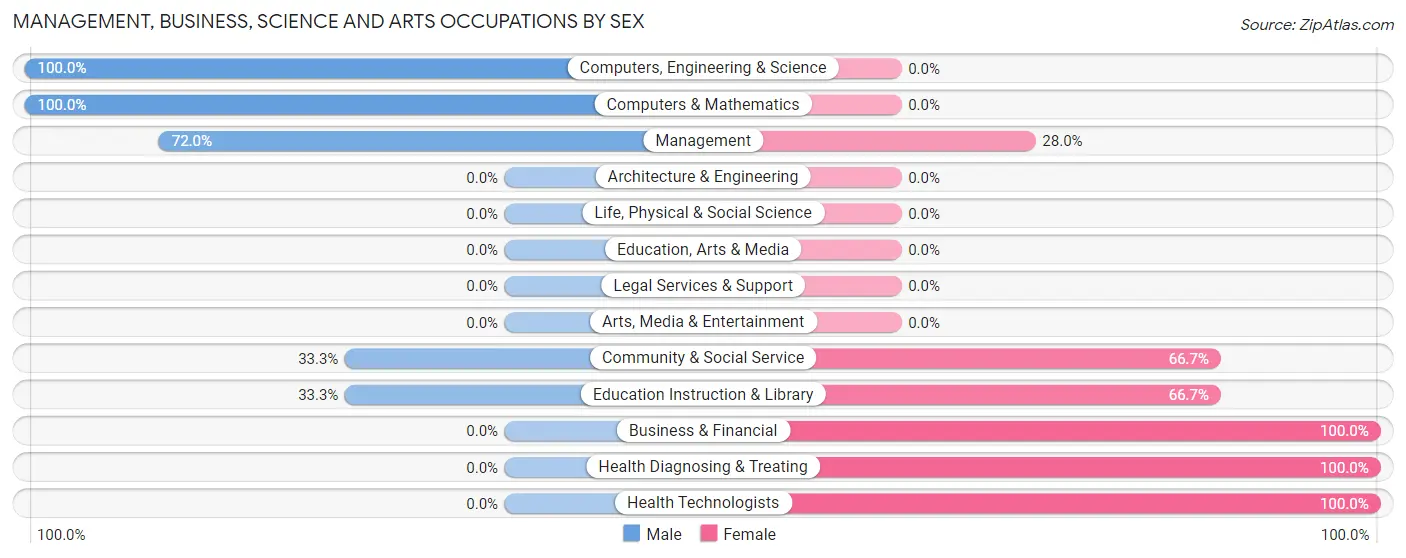
| Occupation | Male | Female |
| Management | 18 (72.0%) | 7 (28.0%) |
| Business & Financial | 0 (0.0%) | 5 (100.0%) |
| Computers, Engineering & Science | 7 (100.0%) | 0 (0.0%) |
| Computers & Mathematics | 7 (100.0%) | 0 (0.0%) |
| Architecture & Engineering | 0 (0.0%) | 0 (0.0%) |
| Life, Physical & Social Science | 0 (0.0%) | 0 (0.0%) |
| Community & Social Service | 3 (33.3%) | 6 (66.7%) |
| Education, Arts & Media | 0 (0.0%) | 0 (0.0%) |
| Legal Services & Support | 0 (0.0%) | 0 (0.0%) |
| Education Instruction & Library | 3 (33.3%) | 6 (66.7%) |
| Arts, Media & Entertainment | 0 (0.0%) | 0 (0.0%) |
| Health Diagnosing & Treating | 0 (0.0%) | 15 (100.0%) |
| Health Technologists | 0 (0.0%) | 3 (100.0%) |
| Total (Category) | 28 (45.9%) | 33 (54.1%) |
| Total (Overall) | 153 (45.7%) | 182 (54.3%) |
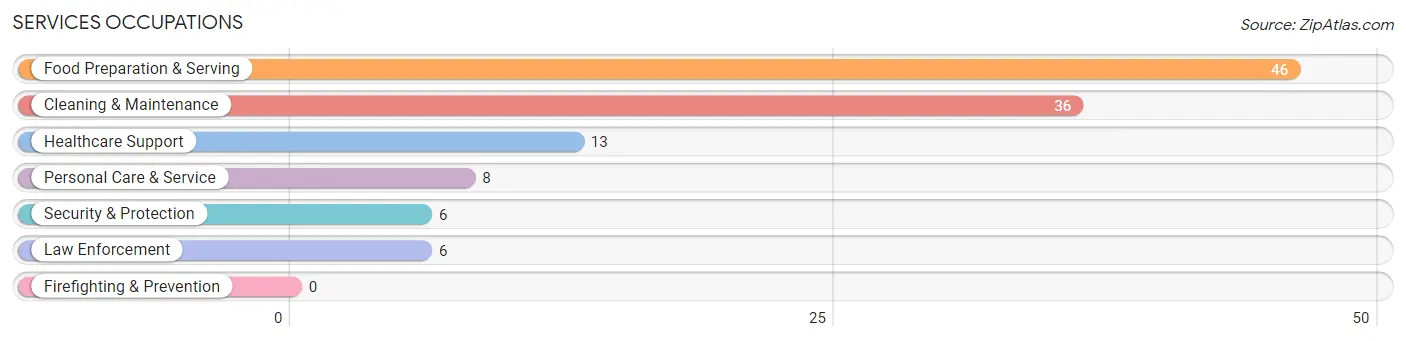
Services Occupations
The most common Services occupations in Clarence are Food Preparation & Serving (46 | 13.7%), Cleaning & Maintenance (36 | 10.7%), Healthcare Support (13 | 3.9%), Personal Care & Service (8 | 2.4%), and Security & Protection (6 | 1.8%).
Services Occupations by Sex
Within the Services occupations in Clarence, the most male-oriented occupations are Security & Protection (100.0%), Law Enforcement (100.0%), and Food Preparation & Serving (45.7%), while the most female-oriented occupations are Personal Care & Service (100.0%), Cleaning & Maintenance (86.1%), and Healthcare Support (76.9%).
| Occupation | Male | Female |
| Healthcare Support | 3 (23.1%) | 10 (76.9%) |
| Security & Protection | 6 (100.0%) | 0 (0.0%) |
| Firefighting & Prevention | 0 (0.0%) | 0 (0.0%) |
| Law Enforcement | 6 (100.0%) | 0 (0.0%) |
| Food Preparation & Serving | 21 (45.7%) | 25 (54.3%) |
| Cleaning & Maintenance | 5 (13.9%) | 31 (86.1%) |
| Personal Care & Service | 0 (0.0%) | 8 (100.0%) |
| Total (Category) | 35 (32.1%) | 74 (67.9%) |
| Total (Overall) | 153 (45.7%) | 182 (54.3%) |
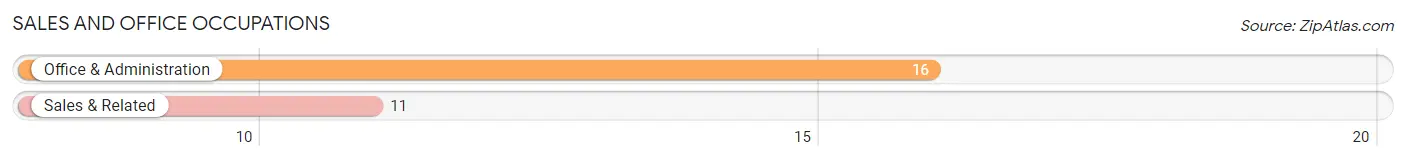
Sales and Office Occupations
The most common Sales and Office occupations in Clarence are Office & Administration (16 | 4.8%), and Sales & Related (11 | 3.3%).
Sales and Office Occupations by Sex
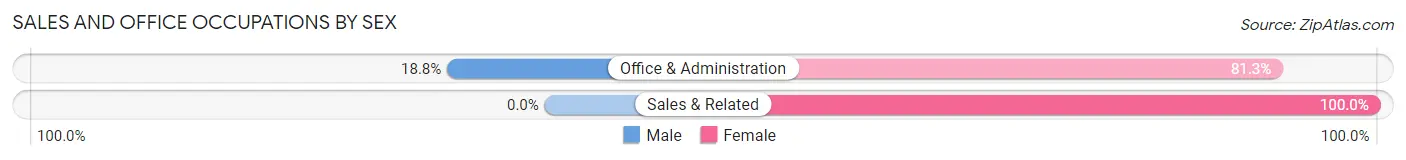
| Occupation | Male | Female |
| Sales & Related | 0 (0.0%) | 11 (100.0%) |
| Office & Administration | 3 (18.8%) | 13 (81.2%) |
| Total (Category) | 3 (11.1%) | 24 (88.9%) |
| Total (Overall) | 153 (45.7%) | 182 (54.3%) |
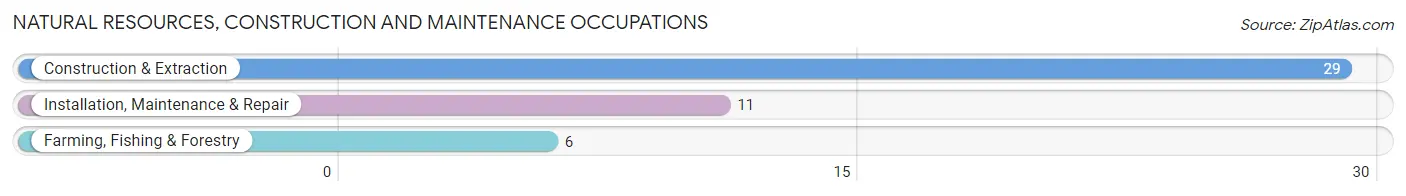
Natural Resources, Construction and Maintenance Occupations
The most common Natural Resources, Construction and Maintenance occupations in Clarence are Construction & Extraction (29 | 8.7%), Installation, Maintenance & Repair (11 | 3.3%), and Farming, Fishing & Forestry (6 | 1.8%).
Natural Resources, Construction and Maintenance Occupations by Sex
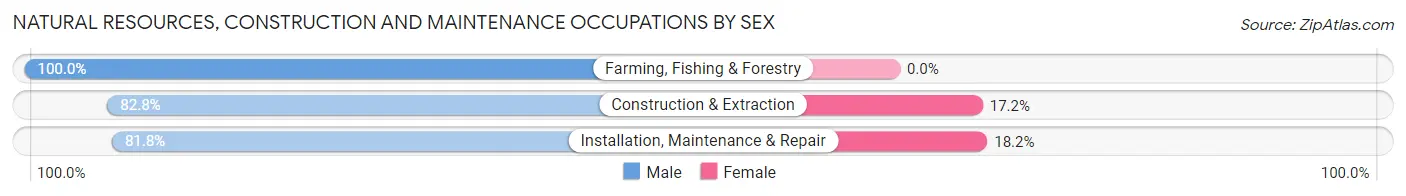
| Occupation | Male | Female |
| Farming, Fishing & Forestry | 6 (100.0%) | 0 (0.0%) |
| Construction & Extraction | 24 (82.8%) | 5 (17.2%) |
| Installation, Maintenance & Repair | 9 (81.8%) | 2 (18.2%) |
| Total (Category) | 39 (84.8%) | 7 (15.2%) |
| Total (Overall) | 153 (45.7%) | 182 (54.3%) |
Production, Transportation and Moving Occupations
The most common Production, Transportation and Moving occupations in Clarence are Production (34 | 10.2%), Transportation (29 | 8.7%), and Material Moving (29 | 8.7%).
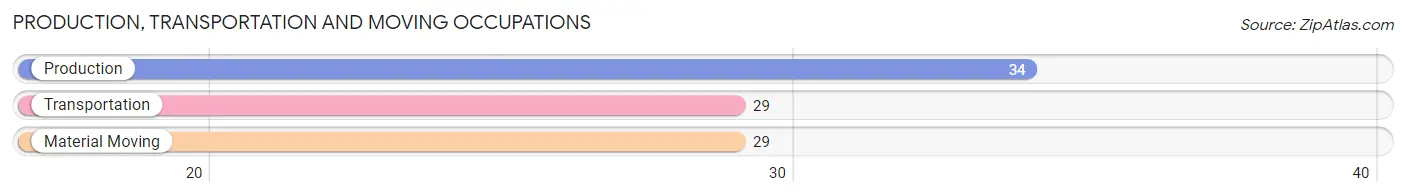
Production, Transportation and Moving Occupations by Sex
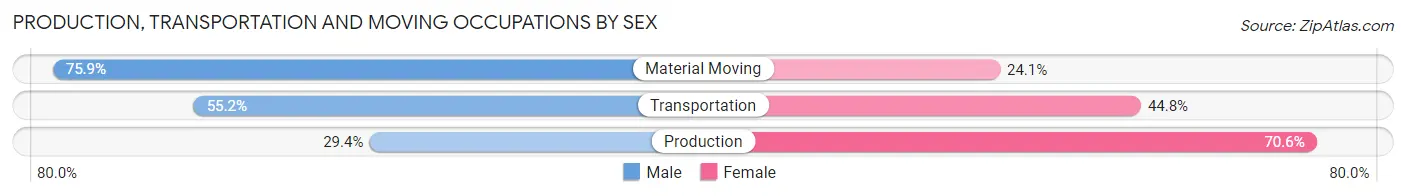
| Occupation | Male | Female |
| Production | 10 (29.4%) | 24 (70.6%) |
| Transportation | 16 (55.2%) | 13 (44.8%) |
| Material Moving | 22 (75.9%) | 7 (24.1%) |
| Total (Category) | 48 (52.2%) | 44 (47.8%) |
| Total (Overall) | 153 (45.7%) | 182 (54.3%) |
Employment Industries by Sex in Clarence
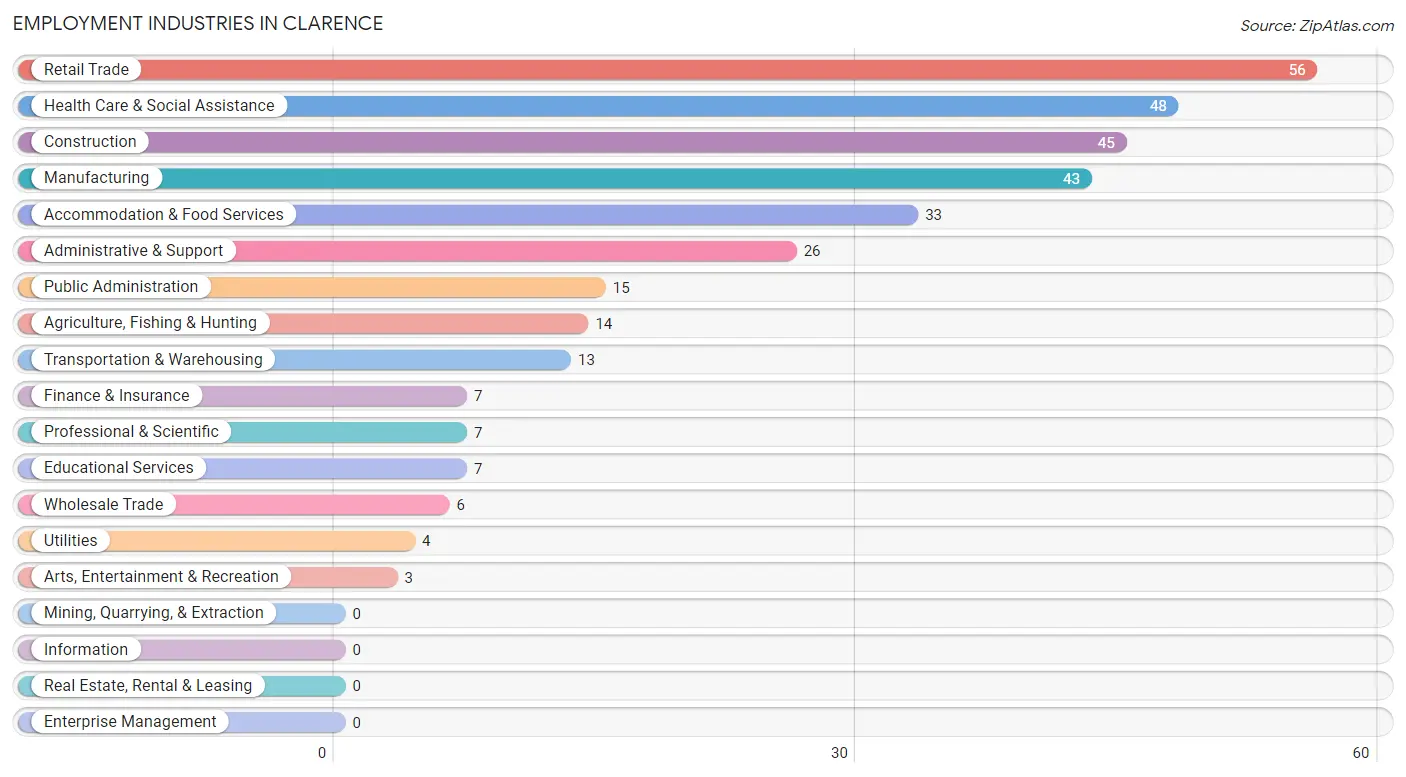
Employment Industries in Clarence
The major employment industries in Clarence include Retail Trade (56 | 16.7%), Health Care & Social Assistance (48 | 14.3%), Construction (45 | 13.4%), Manufacturing (43 | 12.8%), and Accommodation & Food Services (33 | 9.9%).
Employment Industries by Sex in Clarence
The Clarence industries that see more men than women are Wholesale Trade (100.0%), Transportation & Warehousing (100.0%), and Utilities (100.0%), whereas the industries that tend to have a higher number of women are Finance & Insurance (100.0%), Health Care & Social Assistance (85.4%), and Administrative & Support (84.6%).
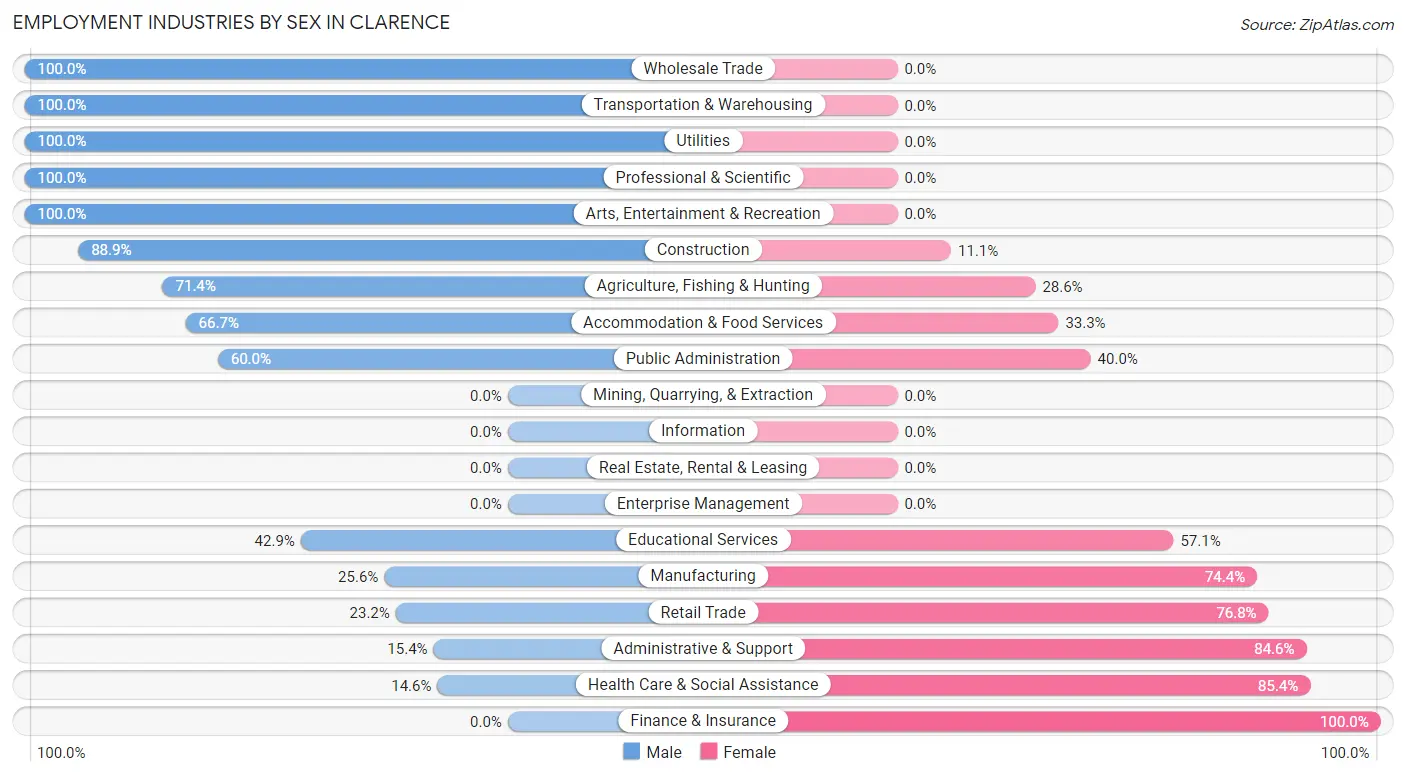
| Industry | Male | Female |
| Agriculture, Fishing & Hunting | 10 (71.4%) | 4 (28.6%) |
| Mining, Quarrying, & Extraction | 0 (0.0%) | 0 (0.0%) |
| Construction | 40 (88.9%) | 5 (11.1%) |
| Manufacturing | 11 (25.6%) | 32 (74.4%) |
| Wholesale Trade | 6 (100.0%) | 0 (0.0%) |
| Retail Trade | 13 (23.2%) | 43 (76.8%) |
| Transportation & Warehousing | 13 (100.0%) | 0 (0.0%) |
| Utilities | 4 (100.0%) | 0 (0.0%) |
| Information | 0 (0.0%) | 0 (0.0%) |
| Finance & Insurance | 0 (0.0%) | 7 (100.0%) |
| Real Estate, Rental & Leasing | 0 (0.0%) | 0 (0.0%) |
| Professional & Scientific | 7 (100.0%) | 0 (0.0%) |
| Enterprise Management | 0 (0.0%) | 0 (0.0%) |
| Administrative & Support | 4 (15.4%) | 22 (84.6%) |
| Educational Services | 3 (42.9%) | 4 (57.1%) |
| Health Care & Social Assistance | 7 (14.6%) | 41 (85.4%) |
| Arts, Entertainment & Recreation | 3 (100.0%) | 0 (0.0%) |
| Accommodation & Food Services | 22 (66.7%) | 11 (33.3%) |
| Public Administration | 9 (60.0%) | 6 (40.0%) |
| Total | 153 (45.7%) | 182 (54.3%) |
Education in Clarence
School Enrollment in Clarence
The most common levels of schooling among the 177 students in Clarence are high school (52 | 29.4%), middle school (45 | 25.4%), and college / undergraduate (33 | 18.6%).
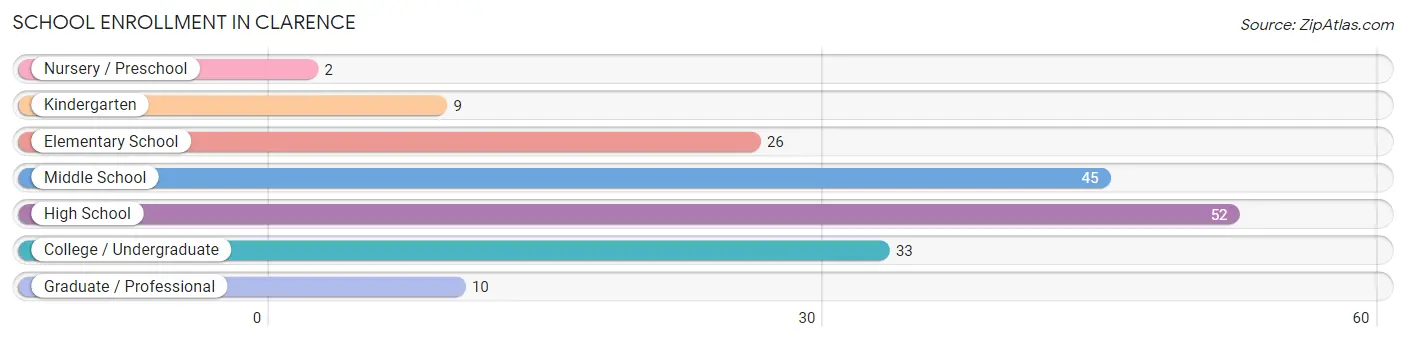
| School Level | # Students | % Students |
| Nursery / Preschool | 2 | 1.1% |
| Kindergarten | 9 | 5.1% |
| Elementary School | 26 | 14.7% |
| Middle School | 45 | 25.4% |
| High School | 52 | 29.4% |
| College / Undergraduate | 33 | 18.6% |
| Graduate / Professional | 10 | 5.7% |
| Total | 177 | 100.0% |
School Enrollment by Age by Funding Source in Clarence
Out of a total of 177 students who are enrolled in schools in Clarence, 7 (4.0%) attend a private institution, while the remaining 170 (96.0%) are enrolled in public schools. The age group of 25 to 34 year olds has the highest likelihood of being enrolled in private schools, with 7 (100.0% in the age bracket) enrolled. Conversely, the age group of 3 to 4 year olds has the lowest likelihood of being enrolled in a private school, with 2 (100.0% in the age bracket) attending a public institution.
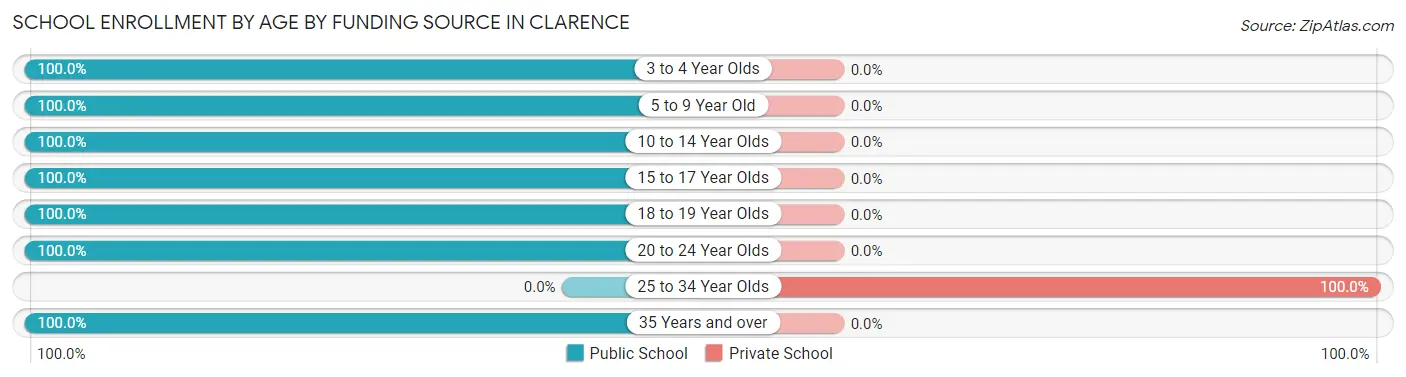
| Age Bracket | Public School | Private School |
| 3 to 4 Year Olds | 2 (100.0%) | 0 (0.0%) |
| 5 to 9 Year Old | 30 (100.0%) | 0 (0.0%) |
| 10 to 14 Year Olds | 52 (100.0%) | 0 (0.0%) |
| 15 to 17 Year Olds | 34 (100.0%) | 0 (0.0%) |
| 18 to 19 Year Olds | 20 (100.0%) | 0 (0.0%) |
| 20 to 24 Year Olds | 26 (100.0%) | 0 (0.0%) |
| 25 to 34 Year Olds | 0 (0.0%) | 7 (100.0%) |
| 35 Years and over | 6 (100.0%) | 0 (0.0%) |
| Total | 170 (96.0%) | 7 (4.0%) |
Educational Attainment by Field of Study in Clarence
Arts & humanities (17 | 22.7%), education (14 | 18.7%), business (12 | 16.0%), computers & mathematics (7 | 9.3%), and social sciences (6 | 8.0%) are the most common fields of study among 75 individuals in Clarence who have obtained a bachelor's degree or higher.
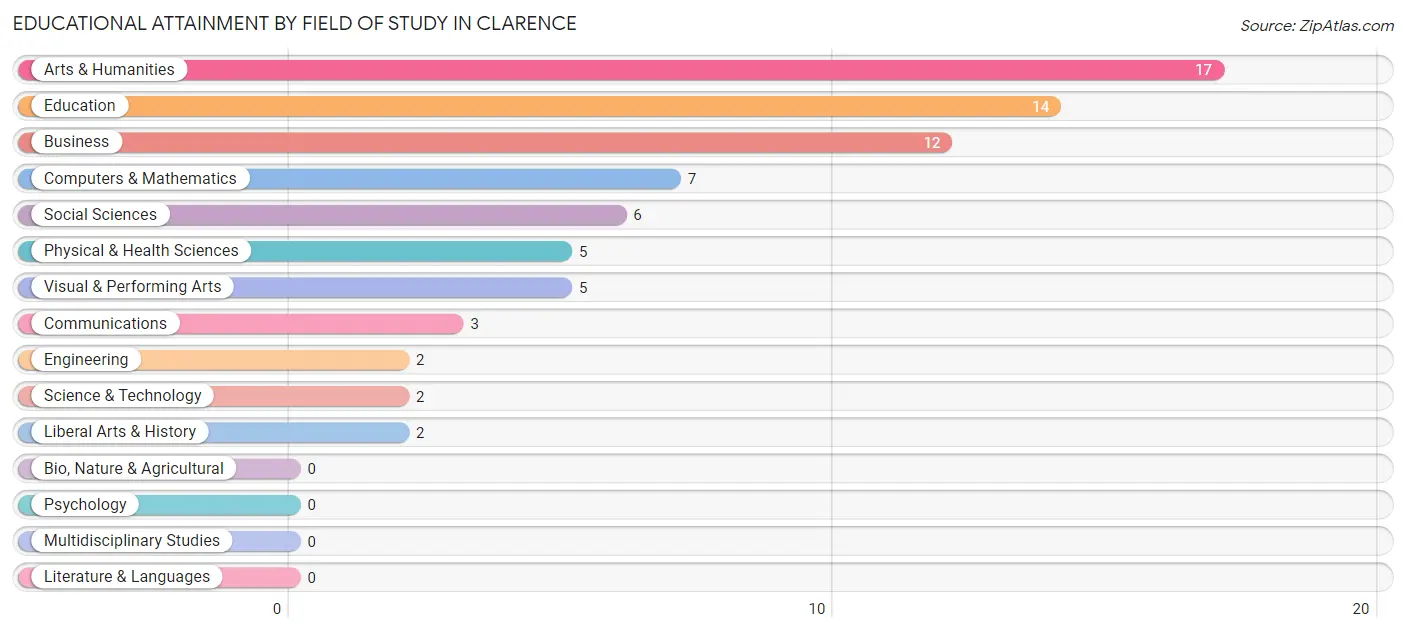
| Field of Study | # Graduates | % Graduates |
| Computers & Mathematics | 7 | 9.3% |
| Bio, Nature & Agricultural | 0 | 0.0% |
| Physical & Health Sciences | 5 | 6.7% |
| Psychology | 0 | 0.0% |
| Social Sciences | 6 | 8.0% |
| Engineering | 2 | 2.7% |
| Multidisciplinary Studies | 0 | 0.0% |
| Science & Technology | 2 | 2.7% |
| Business | 12 | 16.0% |
| Education | 14 | 18.7% |
| Literature & Languages | 0 | 0.0% |
| Liberal Arts & History | 2 | 2.7% |
| Visual & Performing Arts | 5 | 6.7% |
| Communications | 3 | 4.0% |
| Arts & Humanities | 17 | 22.7% |
| Total | 75 | 100.0% |
Transportation & Commute in Clarence
Vehicle Availability by Sex in Clarence
The most prevalent vehicle ownership categories in Clarence are males with 2 vehicles (61, accounting for 42.4%) and females with 2 vehicles (56, making up 34.1%).
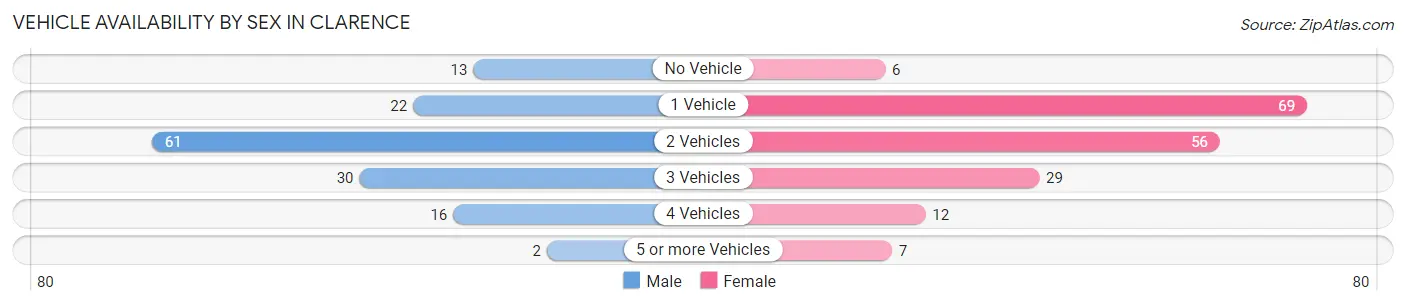
| Vehicles Available | Male | Female |
| No Vehicle | 13 (9.0%) | 6 (3.4%) |
| 1 Vehicle | 22 (15.3%) | 69 (38.6%) |
| 2 Vehicles | 61 (42.4%) | 56 (31.3%) |
| 3 Vehicles | 30 (20.8%) | 29 (16.2%) |
| 4 Vehicles | 16 (11.1%) | 12 (6.7%) |
| 5 or more Vehicles | 2 (1.4%) | 7 (3.9%) |
| Total | 144 (100.0%) | 179 (100.0%) |
Commute Time in Clarence
The most frequently occuring commute durations in Clarence are 15 to 19 minutes (70 commuters, 22.3%), 5 to 9 minutes (52 commuters, 16.6%), and 20 to 24 minutes (48 commuters, 15.3%).
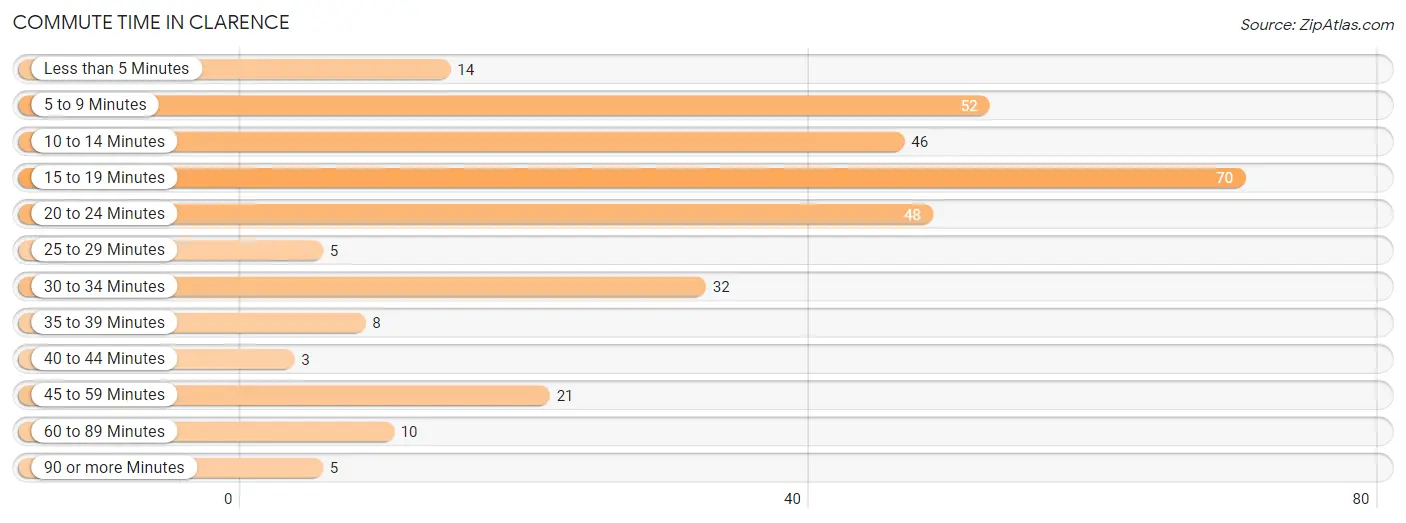
| Commute Time | # Commuters | % Commuters |
| Less than 5 Minutes | 14 | 4.5% |
| 5 to 9 Minutes | 52 | 16.6% |
| 10 to 14 Minutes | 46 | 14.6% |
| 15 to 19 Minutes | 70 | 22.3% |
| 20 to 24 Minutes | 48 | 15.3% |
| 25 to 29 Minutes | 5 | 1.6% |
| 30 to 34 Minutes | 32 | 10.2% |
| 35 to 39 Minutes | 8 | 2.5% |
| 40 to 44 Minutes | 3 | 1.0% |
| 45 to 59 Minutes | 21 | 6.7% |
| 60 to 89 Minutes | 10 | 3.2% |
| 90 or more Minutes | 5 | 1.6% |
Commute Time by Sex in Clarence
The most common commute times in Clarence are 10 to 14 minutes (33 commuters, 23.4%) for males and 15 to 19 minutes (49 commuters, 28.3%) for females.
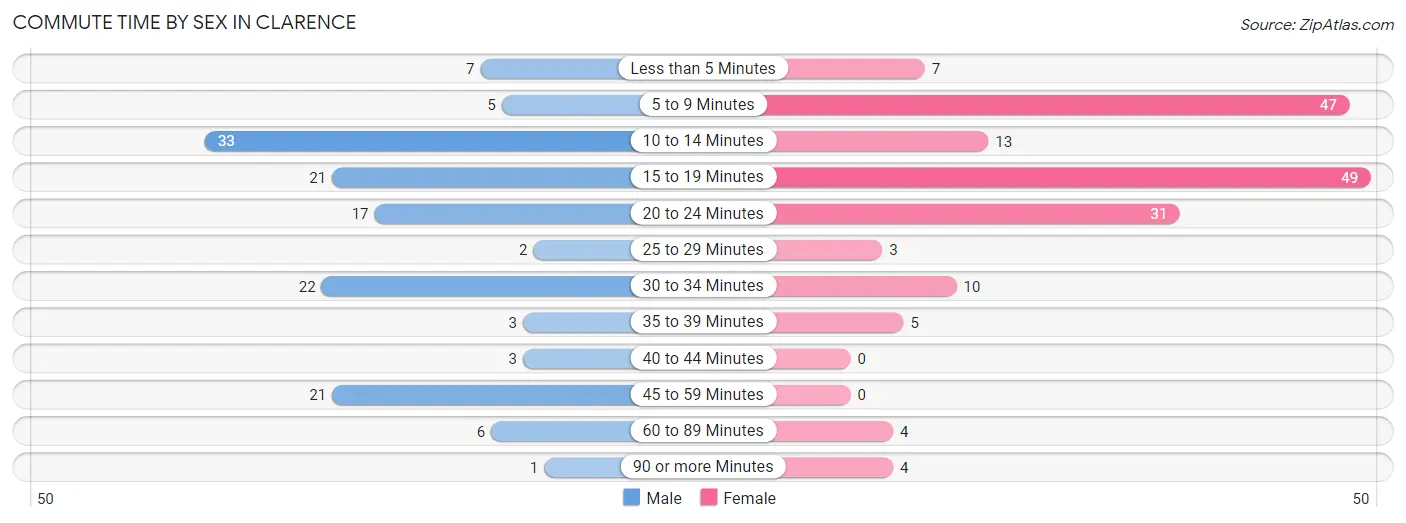
| Commute Time | Male | Female |
| Less than 5 Minutes | 7 (5.0%) | 7 (4.1%) |
| 5 to 9 Minutes | 5 (3.5%) | 47 (27.2%) |
| 10 to 14 Minutes | 33 (23.4%) | 13 (7.5%) |
| 15 to 19 Minutes | 21 (14.9%) | 49 (28.3%) |
| 20 to 24 Minutes | 17 (12.1%) | 31 (17.9%) |
| 25 to 29 Minutes | 2 (1.4%) | 3 (1.7%) |
| 30 to 34 Minutes | 22 (15.6%) | 10 (5.8%) |
| 35 to 39 Minutes | 3 (2.1%) | 5 (2.9%) |
| 40 to 44 Minutes | 3 (2.1%) | 0 (0.0%) |
| 45 to 59 Minutes | 21 (14.9%) | 0 (0.0%) |
| 60 to 89 Minutes | 6 (4.3%) | 4 (2.3%) |
| 90 or more Minutes | 1 (0.7%) | 4 (2.3%) |
Time of Departure to Work by Sex in Clarence
The most frequent times of departure to work in Clarence are 7:30 AM to 7:59 AM (27, 19.2%) for males and 7:30 AM to 7:59 AM (58, 33.5%) for females.
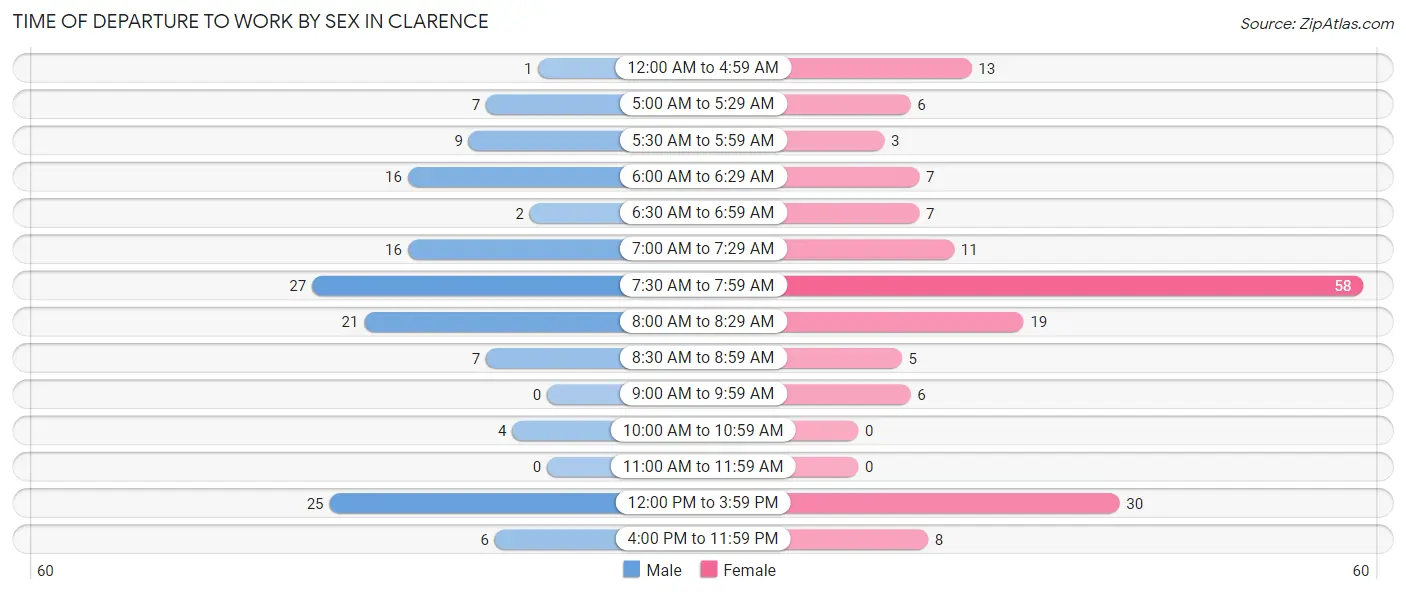
| Time of Departure | Male | Female |
| 12:00 AM to 4:59 AM | 1 (0.7%) | 13 (7.5%) |
| 5:00 AM to 5:29 AM | 7 (5.0%) | 6 (3.5%) |
| 5:30 AM to 5:59 AM | 9 (6.4%) | 3 (1.7%) |
| 6:00 AM to 6:29 AM | 16 (11.4%) | 7 (4.1%) |
| 6:30 AM to 6:59 AM | 2 (1.4%) | 7 (4.1%) |
| 7:00 AM to 7:29 AM | 16 (11.4%) | 11 (6.4%) |
| 7:30 AM to 7:59 AM | 27 (19.2%) | 58 (33.5%) |
| 8:00 AM to 8:29 AM | 21 (14.9%) | 19 (11.0%) |
| 8:30 AM to 8:59 AM | 7 (5.0%) | 5 (2.9%) |
| 9:00 AM to 9:59 AM | 0 (0.0%) | 6 (3.5%) |
| 10:00 AM to 10:59 AM | 4 (2.8%) | 0 (0.0%) |
| 11:00 AM to 11:59 AM | 0 (0.0%) | 0 (0.0%) |
| 12:00 PM to 3:59 PM | 25 (17.7%) | 30 (17.3%) |
| 4:00 PM to 11:59 PM | 6 (4.3%) | 8 (4.6%) |
| Total | 141 (100.0%) | 173 (100.0%) |
Housing Occupancy in Clarence
Occupancy by Ownership in Clarence
Of the total 385 dwellings in Clarence, owner-occupied units account for 260 (67.5%), while renter-occupied units make up 125 (32.5%).
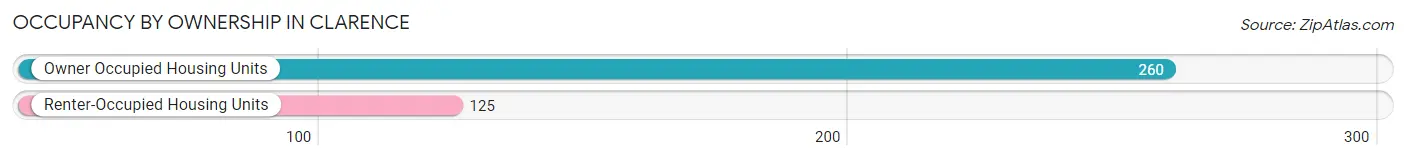
| Occupancy | # Housing Units | % Housing Units |
| Owner Occupied Housing Units | 260 | 67.5% |
| Renter-Occupied Housing Units | 125 | 32.5% |
| Total Occupied Housing Units | 385 | 100.0% |
Occupancy by Household Size in Clarence
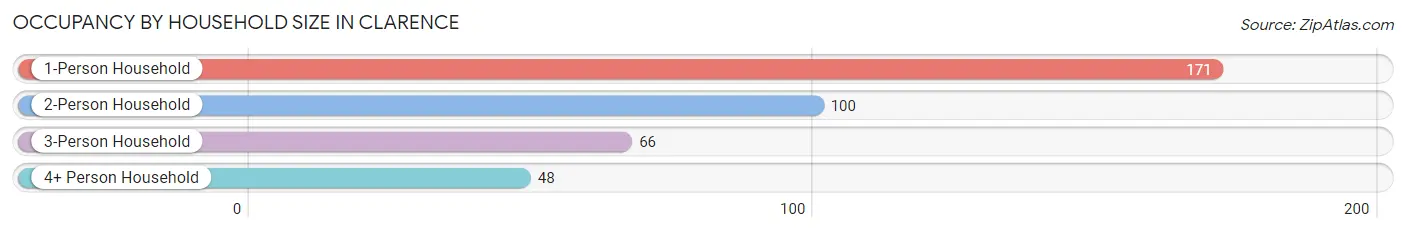
| Household Size | # Housing Units | % Housing Units |
| 1-Person Household | 171 | 44.4% |
| 2-Person Household | 100 | 26.0% |
| 3-Person Household | 66 | 17.1% |
| 4+ Person Household | 48 | 12.5% |
| Total Housing Units | 385 | 100.0% |
Occupancy by Ownership by Household Size in Clarence
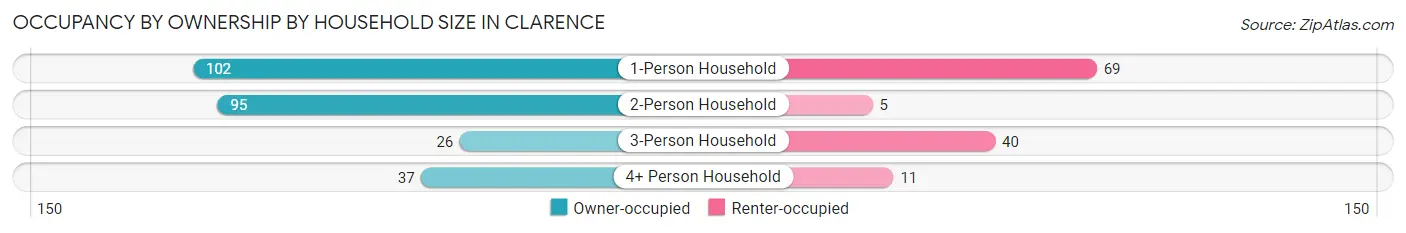
| Household Size | Owner-occupied | Renter-occupied |
| 1-Person Household | 102 (59.7%) | 69 (40.4%) |
| 2-Person Household | 95 (95.0%) | 5 (5.0%) |
| 3-Person Household | 26 (39.4%) | 40 (60.6%) |
| 4+ Person Household | 37 (77.1%) | 11 (22.9%) |
| Total Housing Units | 260 (67.5%) | 125 (32.5%) |
Occupancy by Educational Attainment in Clarence
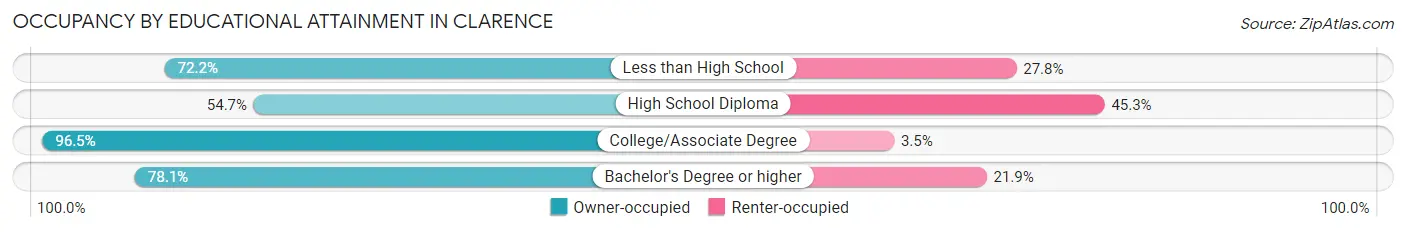
| Household Size | Owner-occupied | Renter-occupied |
| Less than High School | 26 (72.2%) | 10 (27.8%) |
| High School Diploma | 127 (54.7%) | 105 (45.3%) |
| College/Associate Degree | 82 (96.5%) | 3 (3.5%) |
| Bachelor's Degree or higher | 25 (78.1%) | 7 (21.9%) |
Occupancy by Age of Householder in Clarence
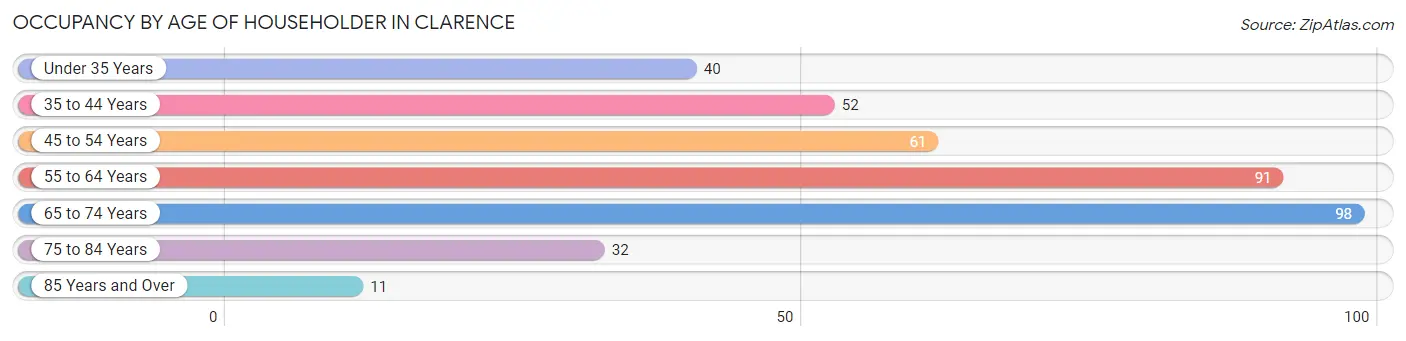
| Age Bracket | # Households | % Households |
| Under 35 Years | 40 | 10.4% |
| 35 to 44 Years | 52 | 13.5% |
| 45 to 54 Years | 61 | 15.8% |
| 55 to 64 Years | 91 | 23.6% |
| 65 to 74 Years | 98 | 25.5% |
| 75 to 84 Years | 32 | 8.3% |
| 85 Years and Over | 11 | 2.9% |
| Total | 385 | 100.0% |
Housing Finances in Clarence
Median Income by Occupancy in Clarence
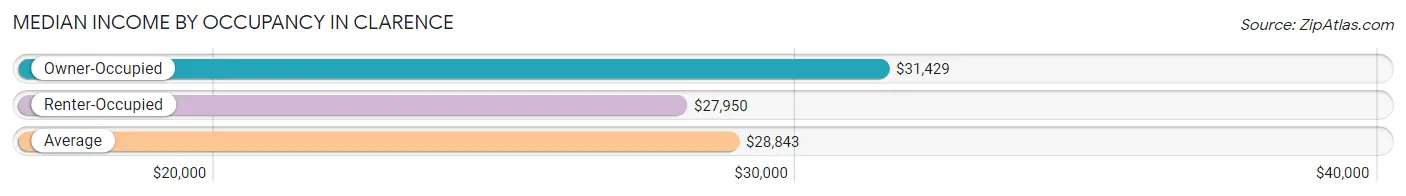
| Occupancy Type | # Households | Median Income |
| Owner-Occupied | 260 (67.5%) | $31,429 |
| Renter-Occupied | 125 (32.5%) | $27,950 |
| Average | 385 (100.0%) | $28,843 |
Occupancy by Householder Income Bracket in Clarence
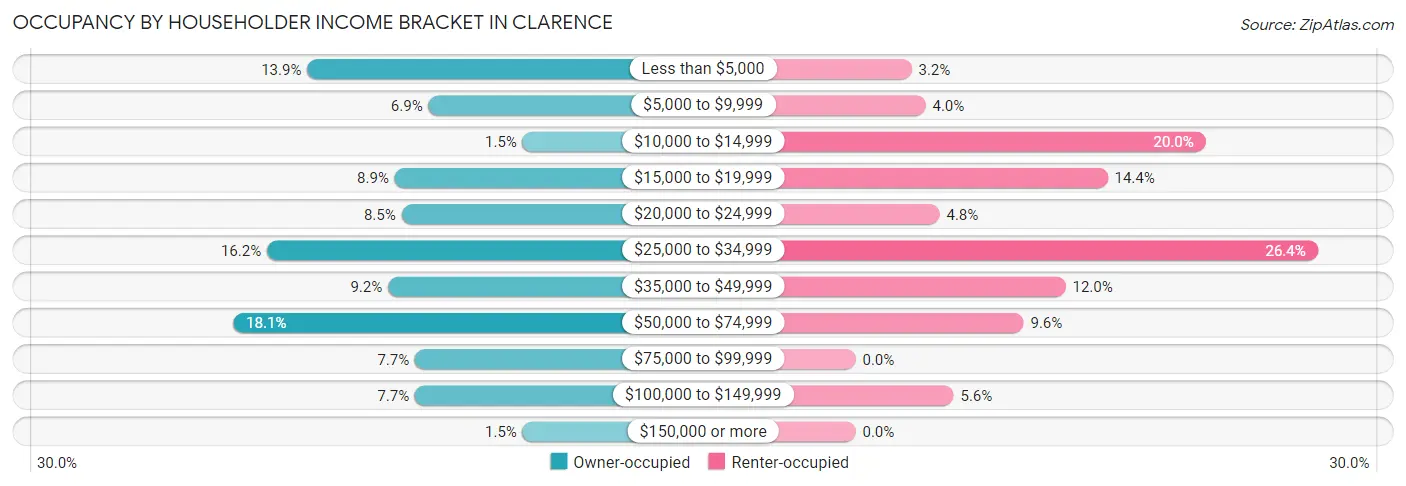
| Income Bracket | Owner-occupied | Renter-occupied |
| Less than $5,000 | 36 (13.9%) | 4 (3.2%) |
| $5,000 to $9,999 | 18 (6.9%) | 5 (4.0%) |
| $10,000 to $14,999 | 4 (1.5%) | 25 (20.0%) |
| $15,000 to $19,999 | 23 (8.8%) | 18 (14.4%) |
| $20,000 to $24,999 | 22 (8.5%) | 6 (4.8%) |
| $25,000 to $34,999 | 42 (16.2%) | 33 (26.4%) |
| $35,000 to $49,999 | 24 (9.2%) | 15 (12.0%) |
| $50,000 to $74,999 | 47 (18.1%) | 12 (9.6%) |
| $75,000 to $99,999 | 20 (7.7%) | 0 (0.0%) |
| $100,000 to $149,999 | 20 (7.7%) | 7 (5.6%) |
| $150,000 or more | 4 (1.5%) | 0 (0.0%) |
| Total | 260 (100.0%) | 125 (100.0%) |
Monthly Housing Cost Tiers in Clarence
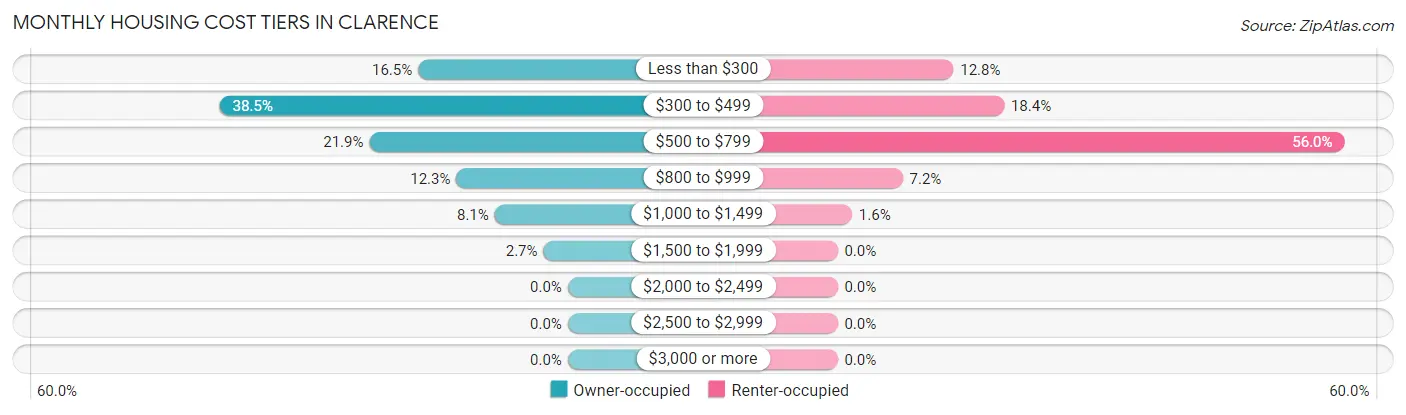
| Monthly Cost | Owner-occupied | Renter-occupied |
| Less than $300 | 43 (16.5%) | 16 (12.8%) |
| $300 to $499 | 100 (38.5%) | 23 (18.4%) |
| $500 to $799 | 57 (21.9%) | 70 (56.0%) |
| $800 to $999 | 32 (12.3%) | 9 (7.2%) |
| $1,000 to $1,499 | 21 (8.1%) | 2 (1.6%) |
| $1,500 to $1,999 | 7 (2.7%) | 0 (0.0%) |
| $2,000 to $2,499 | 0 (0.0%) | 0 (0.0%) |
| $2,500 to $2,999 | 0 (0.0%) | 0 (0.0%) |
| $3,000 or more | 0 (0.0%) | 0 (0.0%) |
| Total | 260 (100.0%) | 125 (100.0%) |
Physical Housing Characteristics in Clarence
Housing Structures in Clarence
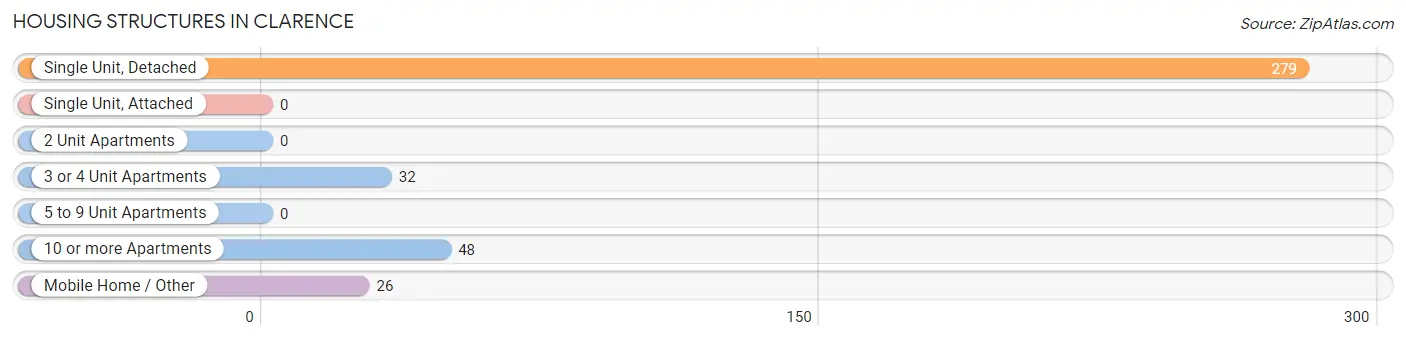
| Structure Type | # Housing Units | % Housing Units |
| Single Unit, Detached | 279 | 72.5% |
| Single Unit, Attached | 0 | 0.0% |
| 2 Unit Apartments | 0 | 0.0% |
| 3 or 4 Unit Apartments | 32 | 8.3% |
| 5 to 9 Unit Apartments | 0 | 0.0% |
| 10 or more Apartments | 48 | 12.5% |
| Mobile Home / Other | 26 | 6.8% |
| Total | 385 | 100.0% |
Housing Structures by Occupancy in Clarence
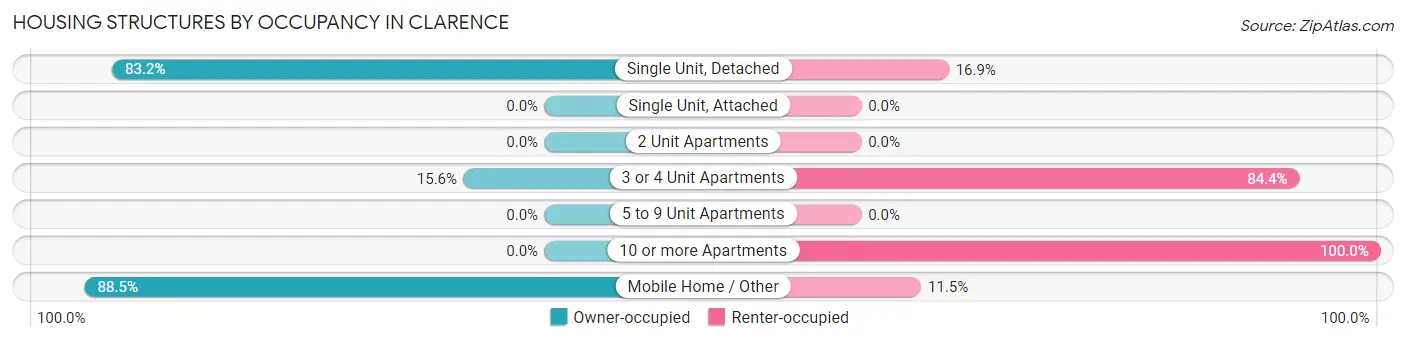
| Structure Type | Owner-occupied | Renter-occupied |
| Single Unit, Detached | 232 (83.2%) | 47 (16.9%) |
| Single Unit, Attached | 0 (0.0%) | 0 (0.0%) |
| 2 Unit Apartments | 0 (0.0%) | 0 (0.0%) |
| 3 or 4 Unit Apartments | 5 (15.6%) | 27 (84.4%) |
| 5 to 9 Unit Apartments | 0 (0.0%) | 0 (0.0%) |
| 10 or more Apartments | 0 (0.0%) | 48 (100.0%) |
| Mobile Home / Other | 23 (88.5%) | 3 (11.5%) |
| Total | 260 (67.5%) | 125 (32.5%) |
Housing Structures by Number of Rooms in Clarence
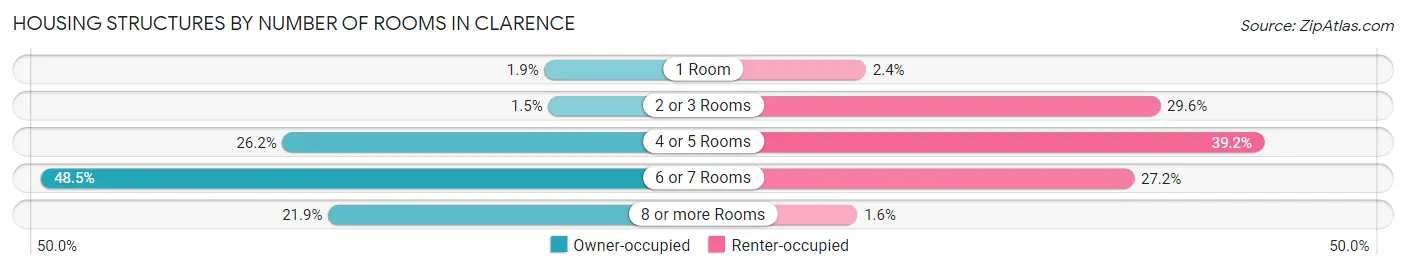
| Number of Rooms | Owner-occupied | Renter-occupied |
| 1 Room | 5 (1.9%) | 3 (2.4%) |
| 2 or 3 Rooms | 4 (1.5%) | 37 (29.6%) |
| 4 or 5 Rooms | 68 (26.2%) | 49 (39.2%) |
| 6 or 7 Rooms | 126 (48.5%) | 34 (27.2%) |
| 8 or more Rooms | 57 (21.9%) | 2 (1.6%) |
| Total | 260 (100.0%) | 125 (100.0%) |
Housing Structure by Heating Type in Clarence
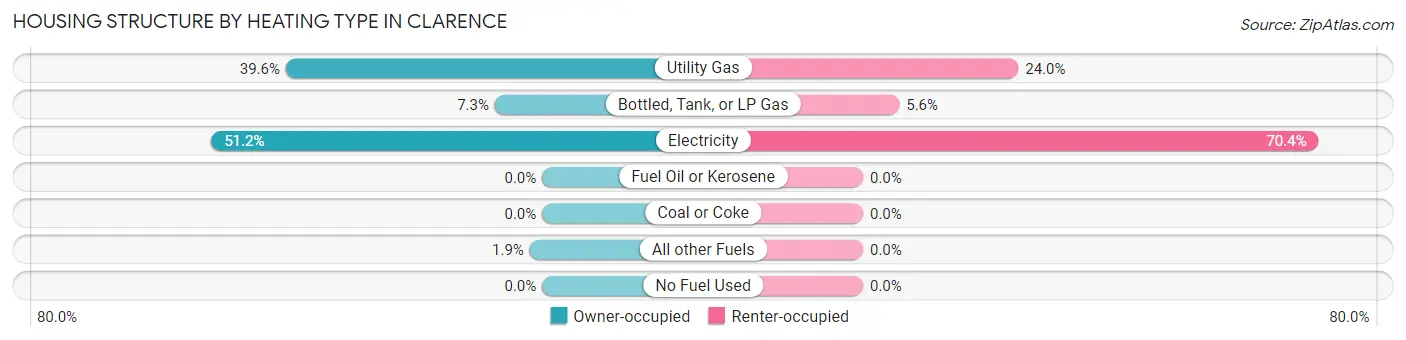
| Heating Type | Owner-occupied | Renter-occupied |
| Utility Gas | 103 (39.6%) | 30 (24.0%) |
| Bottled, Tank, or LP Gas | 19 (7.3%) | 7 (5.6%) |
| Electricity | 133 (51.1%) | 88 (70.4%) |
| Fuel Oil or Kerosene | 0 (0.0%) | 0 (0.0%) |
| Coal or Coke | 0 (0.0%) | 0 (0.0%) |
| All other Fuels | 5 (1.9%) | 0 (0.0%) |
| No Fuel Used | 0 (0.0%) | 0 (0.0%) |
| Total | 260 (100.0%) | 125 (100.0%) |
Household Vehicle Usage in Clarence
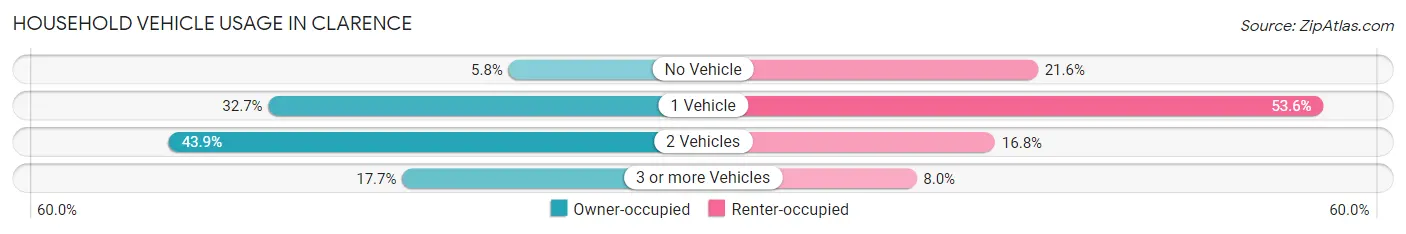
| Vehicles per Household | Owner-occupied | Renter-occupied |
| No Vehicle | 15 (5.8%) | 27 (21.6%) |
| 1 Vehicle | 85 (32.7%) | 67 (53.6%) |
| 2 Vehicles | 114 (43.9%) | 21 (16.8%) |
| 3 or more Vehicles | 46 (17.7%) | 10 (8.0%) |
| Total | 260 (100.0%) | 125 (100.0%) |
Real Estate & Mortgages in Clarence
Real Estate and Mortgage Overview in Clarence
| Characteristic | Without Mortgage | With Mortgage |
| Housing Units | 181 | 79 |
| Median Property Value | $74,200 | $71,500 |
| Median Household Income | $25,625 | $2 |
| Monthly Housing Costs | $335 | $0 |
| Real Estate Taxes | $546 | $3 |
Property Value by Mortgage Status in Clarence
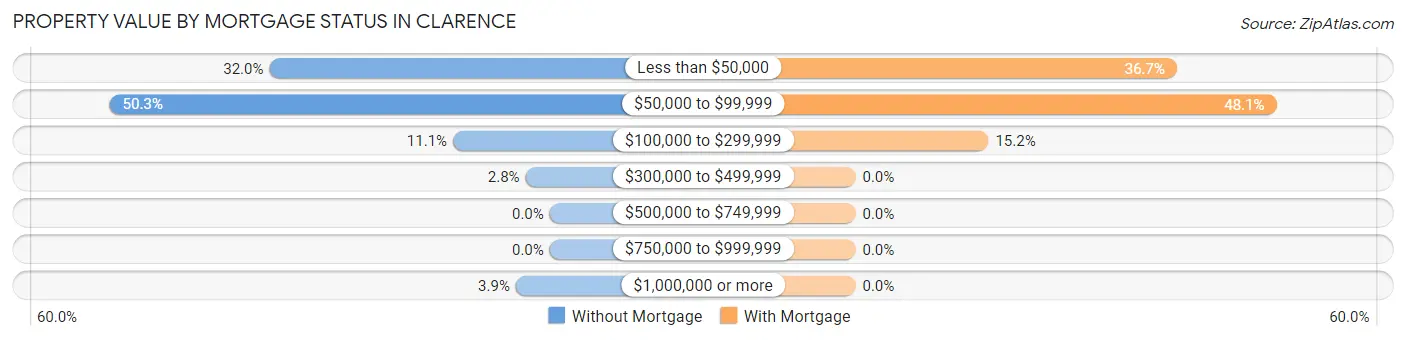
| Property Value | Without Mortgage | With Mortgage |
| Less than $50,000 | 58 (32.0%) | 29 (36.7%) |
| $50,000 to $99,999 | 91 (50.3%) | 38 (48.1%) |
| $100,000 to $299,999 | 20 (11.1%) | 12 (15.2%) |
| $300,000 to $499,999 | 5 (2.8%) | 0 (0.0%) |
| $500,000 to $749,999 | 0 (0.0%) | 0 (0.0%) |
| $750,000 to $999,999 | 0 (0.0%) | 0 (0.0%) |
| $1,000,000 or more | 7 (3.9%) | 0 (0.0%) |
| Total | 181 (100.0%) | 79 (100.0%) |
Household Income by Mortgage Status in Clarence
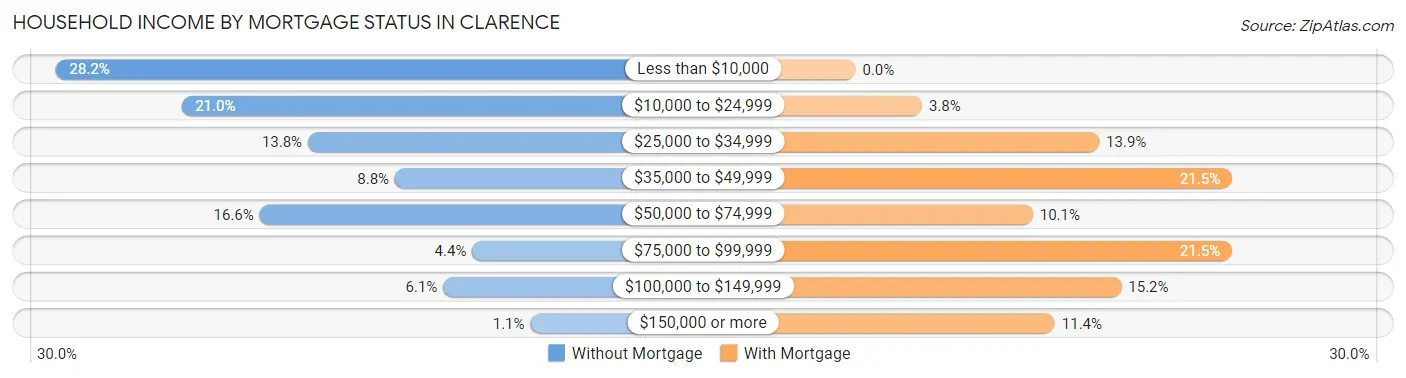
| Household Income | Without Mortgage | With Mortgage |
| Less than $10,000 | 51 (28.2%) | 0 (0.0%) |
| $10,000 to $24,999 | 38 (21.0%) | 3 (3.8%) |
| $25,000 to $34,999 | 25 (13.8%) | 11 (13.9%) |
| $35,000 to $49,999 | 16 (8.8%) | 17 (21.5%) |
| $50,000 to $74,999 | 30 (16.6%) | 8 (10.1%) |
| $75,000 to $99,999 | 8 (4.4%) | 17 (21.5%) |
| $100,000 to $149,999 | 11 (6.1%) | 12 (15.2%) |
| $150,000 or more | 2 (1.1%) | 9 (11.4%) |
| Total | 181 (100.0%) | 79 (100.0%) |
Property Value to Household Income Ratio in Clarence
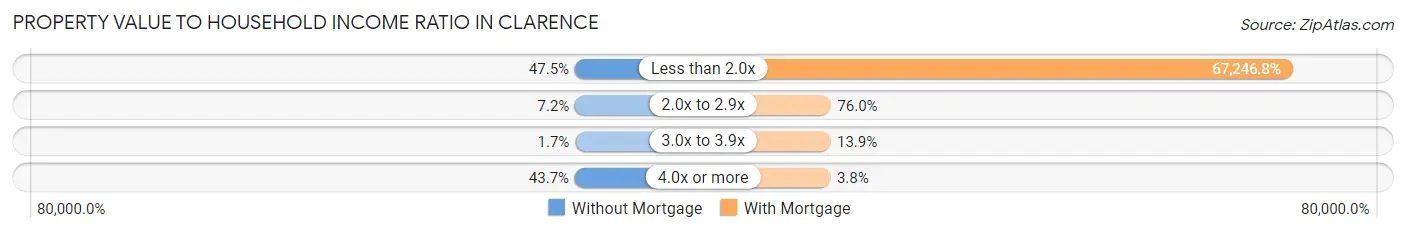
| Value-to-Income Ratio | Without Mortgage | With Mortgage |
| Less than 2.0x | 86 (47.5%) | 53,125 (67,246.8%) |
| 2.0x to 2.9x | 13 (7.2%) | 60 (75.9%) |
| 3.0x to 3.9x | 3 (1.7%) | 11 (13.9%) |
| 4.0x or more | 79 (43.6%) | 3 (3.8%) |
| Total | 181 (100.0%) | 79 (100.0%) |
Real Estate Taxes by Mortgage Status in Clarence
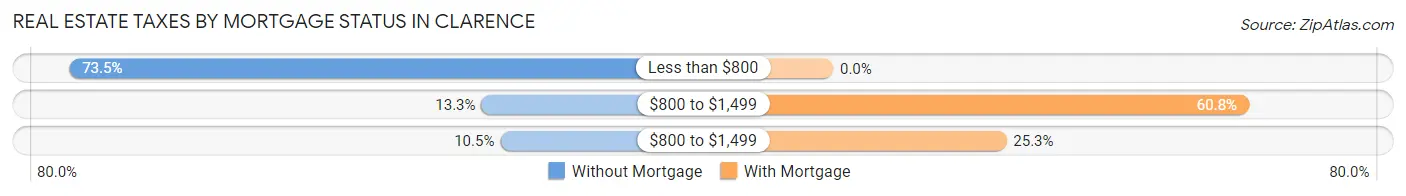
| Property Taxes | Without Mortgage | With Mortgage |
| Less than $800 | 133 (73.5%) | 0 (0.0%) |
| $800 to $1,499 | 24 (13.3%) | 48 (60.8%) |
| $800 to $1,499 | 19 (10.5%) | 20 (25.3%) |
| Total | 181 (100.0%) | 79 (100.0%) |
Health & Disability in Clarence
Health Insurance Coverage by Age in Clarence
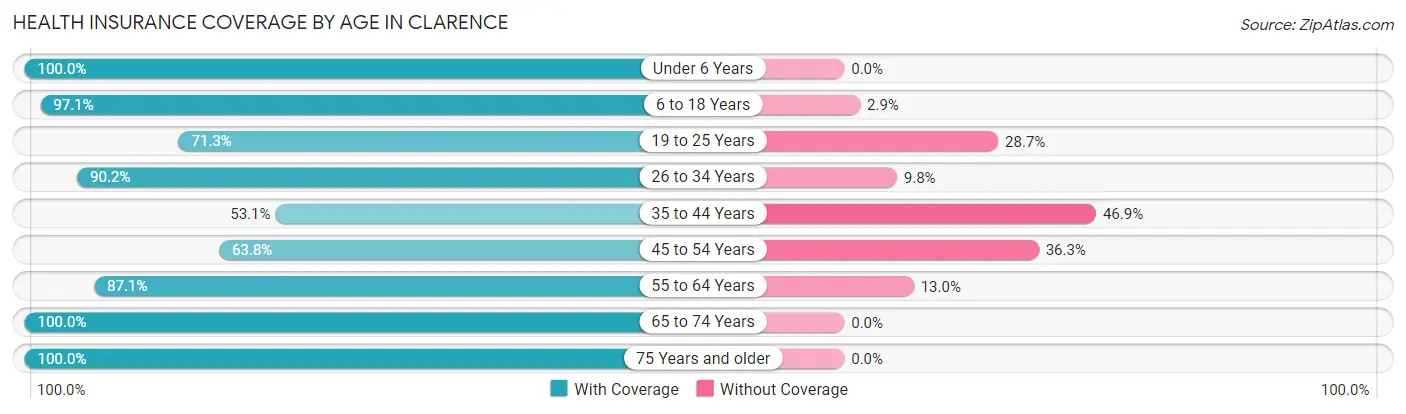
| Age Bracket | With Coverage | Without Coverage |
| Under 6 Years | 49 (100.0%) | 0 (0.0%) |
| 6 to 18 Years | 132 (97.1%) | 4 (2.9%) |
| 19 to 25 Years | 87 (71.3%) | 35 (28.7%) |
| 26 to 34 Years | 46 (90.2%) | 5 (9.8%) |
| 35 to 44 Years | 52 (53.1%) | 46 (46.9%) |
| 45 to 54 Years | 51 (63.7%) | 29 (36.2%) |
| 55 to 64 Years | 121 (87.1%) | 18 (13.0%) |
| 65 to 74 Years | 162 (100.0%) | 0 (0.0%) |
| 75 Years and older | 58 (100.0%) | 0 (0.0%) |
| Total | 758 (84.7%) | 137 (15.3%) |
Health Insurance Coverage by Citizenship Status in Clarence
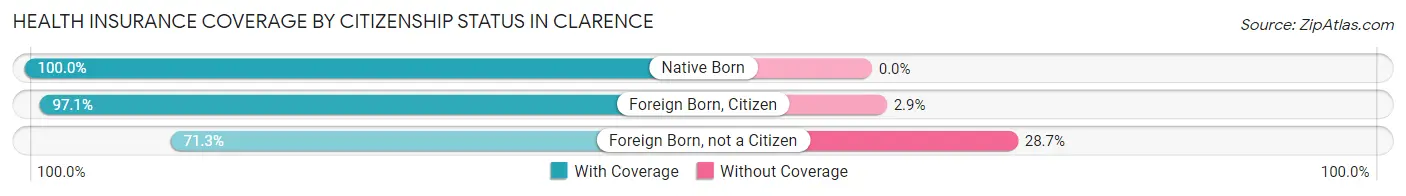
| Citizenship Status | With Coverage | Without Coverage |
| Native Born | 49 (100.0%) | 0 (0.0%) |
| Foreign Born, Citizen | 132 (97.1%) | 4 (2.9%) |
| Foreign Born, not a Citizen | 87 (71.3%) | 35 (28.7%) |
Health Insurance Coverage by Household Income in Clarence
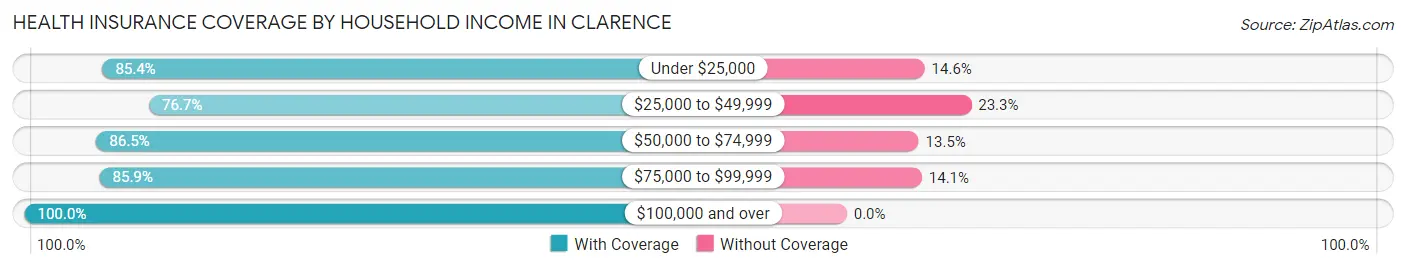
| Household Income | With Coverage | Without Coverage |
| Under $25,000 | 240 (85.4%) | 41 (14.6%) |
| $25,000 to $49,999 | 217 (76.7%) | 66 (23.3%) |
| $50,000 to $74,999 | 135 (86.5%) | 21 (13.5%) |
| $75,000 to $99,999 | 55 (85.9%) | 9 (14.1%) |
| $100,000 and over | 111 (100.0%) | 0 (0.0%) |
Public vs Private Health Insurance Coverage by Age in Clarence
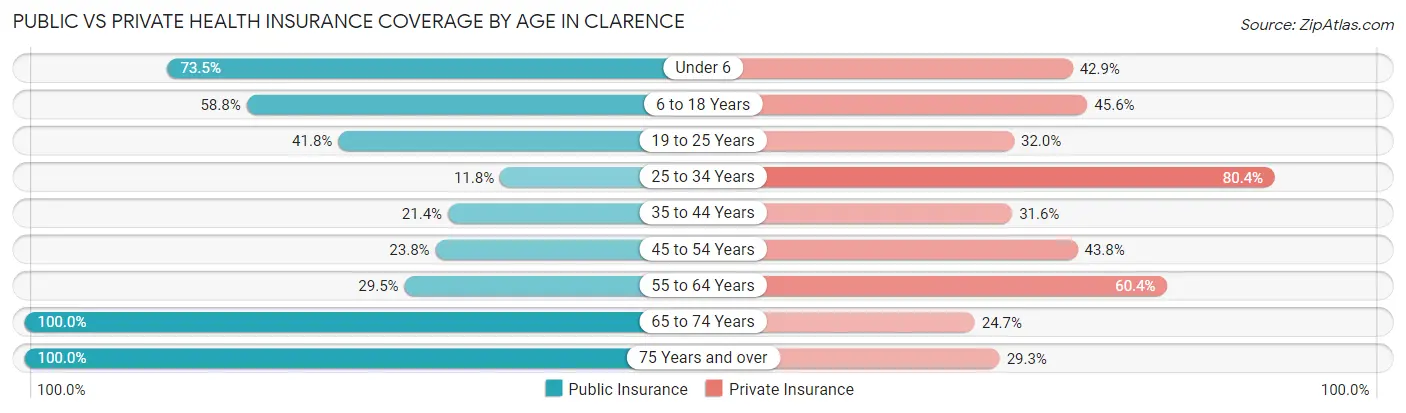
| Age Bracket | Public Insurance | Private Insurance |
| Under 6 | 36 (73.5%) | 21 (42.9%) |
| 6 to 18 Years | 80 (58.8%) | 62 (45.6%) |
| 19 to 25 Years | 51 (41.8%) | 39 (32.0%) |
| 25 to 34 Years | 6 (11.8%) | 41 (80.4%) |
| 35 to 44 Years | 21 (21.4%) | 31 (31.6%) |
| 45 to 54 Years | 19 (23.7%) | 35 (43.8%) |
| 55 to 64 Years | 41 (29.5%) | 84 (60.4%) |
| 65 to 74 Years | 162 (100.0%) | 40 (24.7%) |
| 75 Years and over | 58 (100.0%) | 17 (29.3%) |
| Total | 474 (53.0%) | 370 (41.3%) |
Disability Status by Sex by Age in Clarence
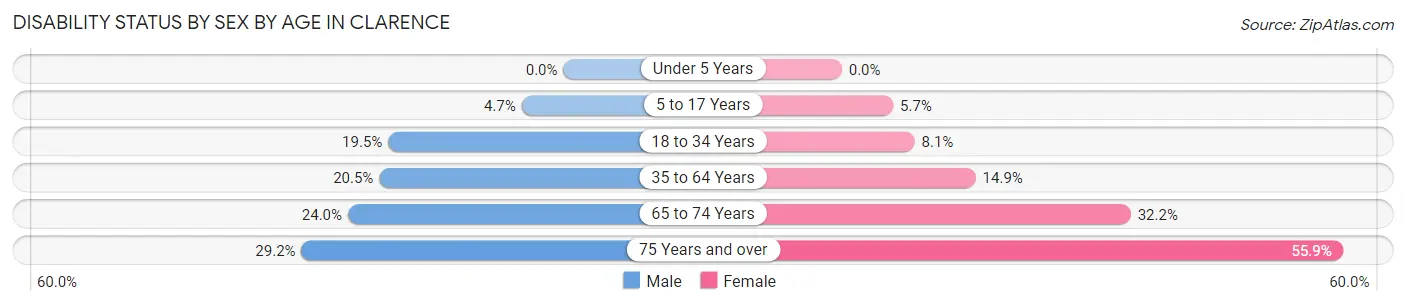
| Age Bracket | Male | Female |
| Under 5 Years | 0 (0.0%) | 0 (0.0%) |
| 5 to 17 Years | 4 (4.6%) | 2 (5.7%) |
| 18 to 34 Years | 16 (19.5%) | 9 (8.1%) |
| 35 to 64 Years | 32 (20.5%) | 24 (14.9%) |
| 65 to 74 Years | 18 (24.0%) | 28 (32.2%) |
| 75 Years and over | 7 (29.2%) | 19 (55.9%) |
Disability Class by Sex by Age in Clarence
Disability Class: Hearing Difficulty
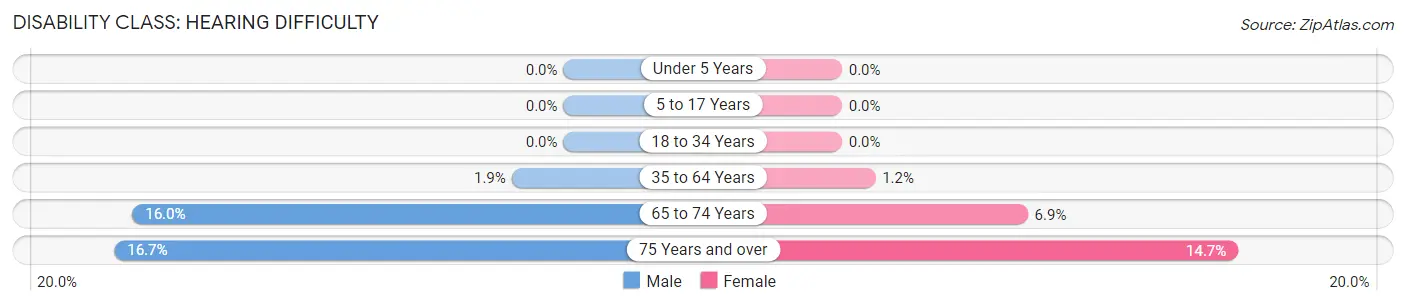
| Age Bracket | Male | Female |
| Under 5 Years | 0 (0.0%) | 0 (0.0%) |
| 5 to 17 Years | 0 (0.0%) | 0 (0.0%) |
| 18 to 34 Years | 0 (0.0%) | 0 (0.0%) |
| 35 to 64 Years | 3 (1.9%) | 2 (1.2%) |
| 65 to 74 Years | 12 (16.0%) | 6 (6.9%) |
| 75 Years and over | 4 (16.7%) | 5 (14.7%) |
Disability Class: Vision Difficulty
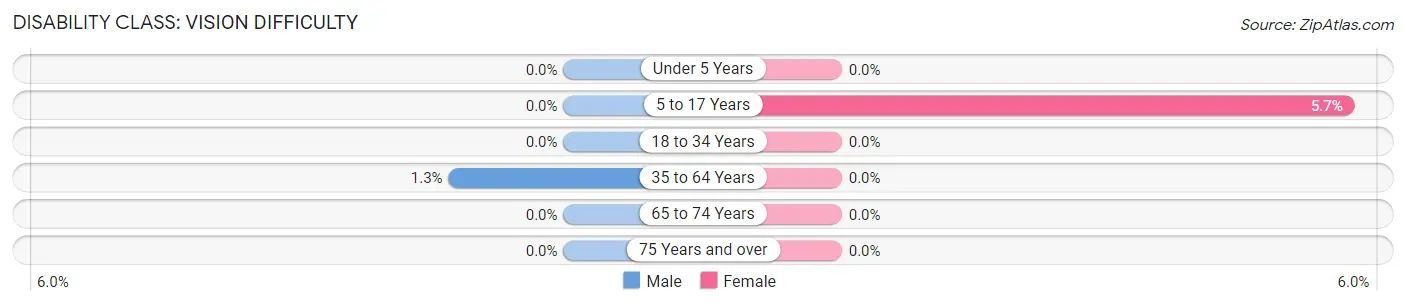
| Age Bracket | Male | Female |
| Under 5 Years | 0 (0.0%) | 0 (0.0%) |
| 5 to 17 Years | 0 (0.0%) | 2 (5.7%) |
| 18 to 34 Years | 0 (0.0%) | 0 (0.0%) |
| 35 to 64 Years | 2 (1.3%) | 0 (0.0%) |
| 65 to 74 Years | 0 (0.0%) | 0 (0.0%) |
| 75 Years and over | 0 (0.0%) | 0 (0.0%) |
Disability Class: Cognitive Difficulty
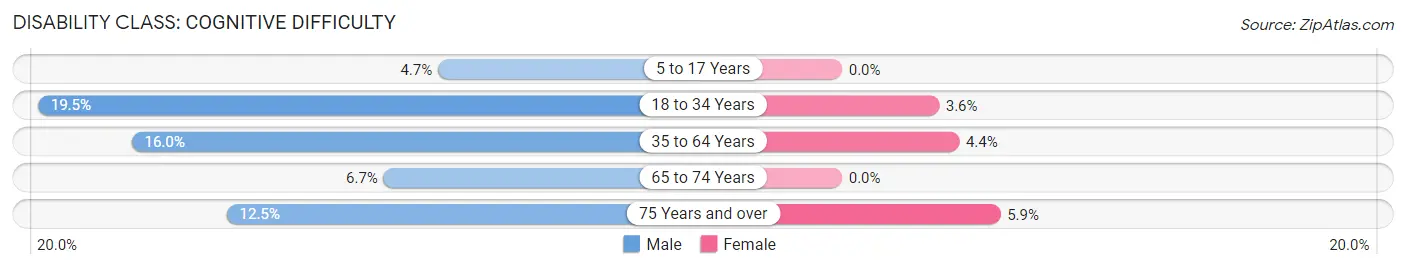
| Age Bracket | Male | Female |
| 5 to 17 Years | 4 (4.6%) | 0 (0.0%) |
| 18 to 34 Years | 16 (19.5%) | 4 (3.6%) |
| 35 to 64 Years | 25 (16.0%) | 7 (4.3%) |
| 65 to 74 Years | 5 (6.7%) | 0 (0.0%) |
| 75 Years and over | 3 (12.5%) | 2 (5.9%) |
Disability Class: Ambulatory Difficulty
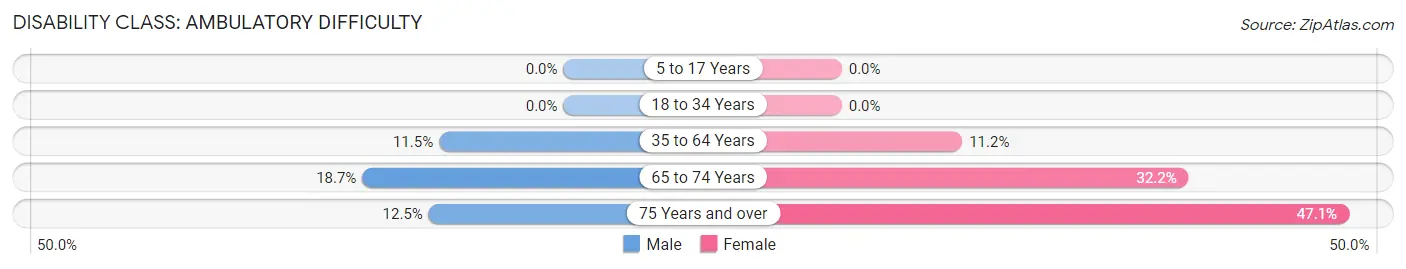
| Age Bracket | Male | Female |
| 5 to 17 Years | 0 (0.0%) | 0 (0.0%) |
| 18 to 34 Years | 0 (0.0%) | 0 (0.0%) |
| 35 to 64 Years | 18 (11.5%) | 18 (11.2%) |
| 65 to 74 Years | 14 (18.7%) | 28 (32.2%) |
| 75 Years and over | 3 (12.5%) | 16 (47.1%) |
Disability Class: Self-Care Difficulty
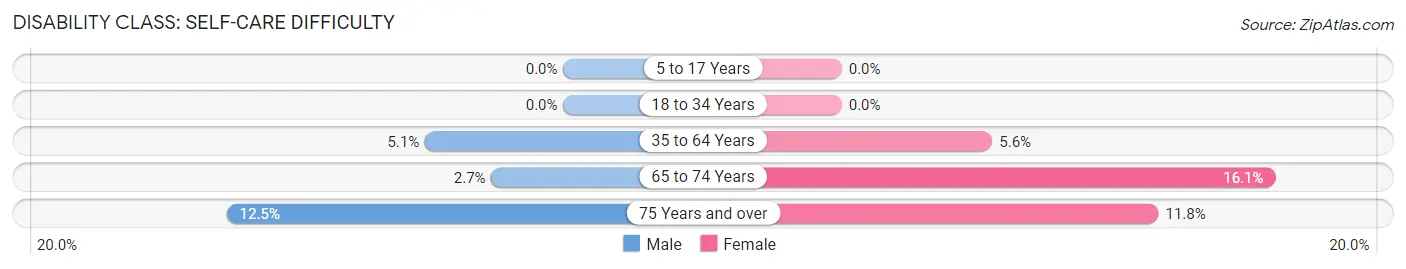
| Age Bracket | Male | Female |
| 5 to 17 Years | 0 (0.0%) | 0 (0.0%) |
| 18 to 34 Years | 0 (0.0%) | 0 (0.0%) |
| 35 to 64 Years | 8 (5.1%) | 9 (5.6%) |
| 65 to 74 Years | 2 (2.7%) | 14 (16.1%) |
| 75 Years and over | 3 (12.5%) | 4 (11.8%) |
Technology Access in Clarence
Computing Device Access in Clarence
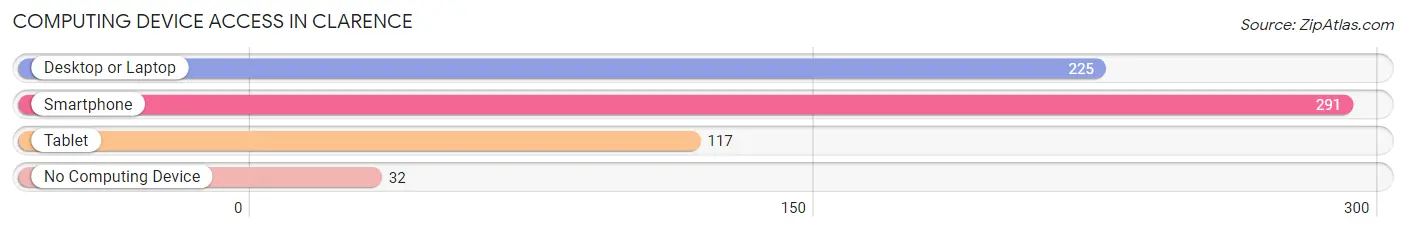
| Device Type | # Households | % Households |
| Desktop or Laptop | 225 | 58.4% |
| Smartphone | 291 | 75.6% |
| Tablet | 117 | 30.4% |
| No Computing Device | 32 | 8.3% |
| Total | 385 | 100.0% |
Internet Access in Clarence
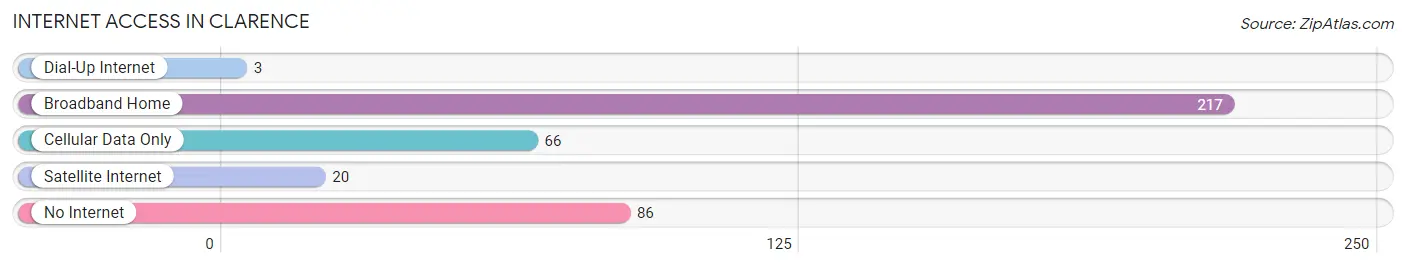
| Internet Type | # Households | % Households |
| Dial-Up Internet | 3 | 0.8% |
| Broadband Home | 217 | 56.4% |
| Cellular Data Only | 66 | 17.1% |
| Satellite Internet | 20 | 5.2% |
| No Internet | 86 | 22.3% |
| Total | 385 | 100.0% |
Clarence Summary
Clarence, Missouri is a small town located in Shelby County, Missouri. It is situated in the northeast corner of the state, approximately 50 miles northeast of the state capital, Jefferson City. The town was founded in 1871 and has a population of approximately 1,000 people.
History
Clarence was founded in 1871 by a group of settlers from the nearby town of Shelbina. The town was named after Clarence Smith, a prominent local businessman. The town was originally a farming community, but in the early 1900s, the railroad came to town and the economy shifted to a more industrial focus. The railroad brought with it a number of businesses, including a lumber mill, a grain elevator, and a brick factory.
In the early 1900s, Clarence was a thriving community with a population of over 1,000 people. The town had a number of businesses, including a bank, a hotel, a movie theater, and a variety of stores. The town also had a number of churches, including the Methodist, Baptist, and Presbyterian churches.
In the 1950s, the town began to decline as the railroad industry began to decline. The population of the town began to decline as well, and by the 1970s, the population had dropped to just over 500 people.
Geography
Clarence is located in the northeast corner of Missouri, approximately 50 miles northeast of the state capital, Jefferson City. The town is situated in the middle of the Mark Twain National Forest, and is surrounded by rolling hills and wooded areas. The town is located on the banks of the Salt River, which flows through the town and provides a source of recreation for the residents.
The climate in Clarence is typical of the Midwest, with hot summers and cold winters. The average temperature in the summer is around 80 degrees Fahrenheit, and the average temperature in the winter is around 30 degrees Fahrenheit.
Economy
The economy of Clarence is largely based on agriculture and tourism. The town is home to a number of farms, which produce a variety of crops, including corn, soybeans, and wheat. The town is also home to a number of tourist attractions, including the Mark Twain National Forest, the Salt River, and the Clarence Historical Museum.
The town also has a number of small businesses, including restaurants, stores, and a variety of other services. The town is also home to a number of manufacturing businesses, including a furniture factory and a plastics factory.
Demographics
As of the 2010 census, the population of Clarence was 1,000 people. The racial makeup of the town was 97.2% White, 0.7% African American, 0.2% Native American, 0.2% Asian, 0.2% from other races, and 1.7% from two or more races. The median household income in the town was $37,500, and the median family income was $45,000.
Conclusion
Clarence, Missouri is a small town located in the northeast corner of the state. The town was founded in 1871 and has a population of approximately 1,000 people. The economy of the town is largely based on agriculture and tourism, and the town is home to a number of small businesses. The racial makeup of the town is predominantly white, and the median household income is $37,500.
Common Questions
What is Per Capita Income in Clarence?
Per Capita income in Clarence is $18,009.
What is the Median Family Income in Clarence?
Median Family Income in Clarence is $31,111.
What is the Median Household income in Clarence?
Median Household Income in Clarence is $28,843.
What is Income or Wage Gap in Clarence?
Income or Wage Gap in Clarence is 18.7%.
Women in Clarence earn 81.3 cents for every dollar earned by a man.
What is Inequality or Gini Index in Clarence?
Inequality or Gini Index in Clarence is 0.46.
What is the Total Population of Clarence?
Total Population of Clarence is 936.
What is the Total Male Population of Clarence?
Total Male Population of Clarence is 452.
What is the Total Female Population of Clarence?
Total Female Population of Clarence is 484.
What is the Ratio of Males per 100 Females in Clarence?
There are 93.39 Males per 100 Females in Clarence.
What is the Ratio of Females per 100 Males in Clarence?
There are 107.08 Females per 100 Males in Clarence.
What is the Median Population Age in Clarence?
Median Population Age in Clarence is 47.0 Years.
What is the Average Family Size in Clarence
Average Family Size in Clarence is 3.1 People.
What is the Average Household Size in Clarence
Average Household Size in Clarence is 2.3 People.
How Large is the Labor Force in Clarence?
There are 343 People in the Labor Forcein in Clarence.
What is the Percentage of People in the Labor Force in Clarence?
43.0% of People are in the Labor Force in Clarence.
What is the Unemployment Rate in Clarence?
Unemployment Rate in Clarence is 2.3%.