Castle Point, MO Map & Demographics
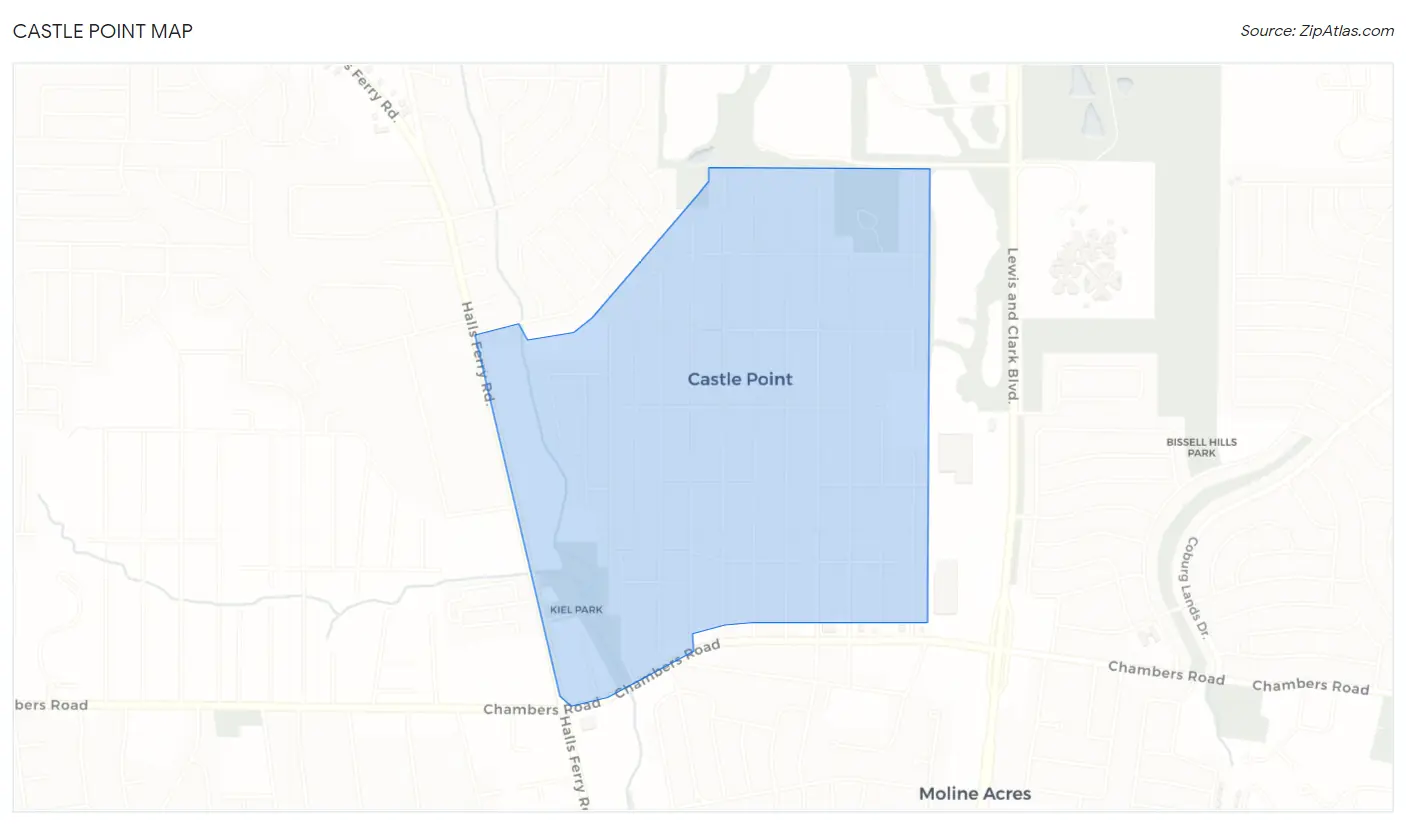
Castle Point Map
Castle Point Overview
$18,955
PER CAPITA INCOME
$34,513
AVG FAMILY INCOME
$34,190
AVG HOUSEHOLD INCOME
5.5%
WAGE / INCOME GAP [ % ]
94.5¢/ $1
WAGE / INCOME GAP [ $ ]
0.46
INEQUALITY / GINI INDEX
2,940
TOTAL POPULATION
1,159
MALE POPULATION
1,781
FEMALE POPULATION
65.08
MALES / 100 FEMALES
153.67
FEMALES / 100 MALES
30.9
MEDIAN AGE
3.4
AVG FAMILY SIZE
2.8
AVG HOUSEHOLD SIZE
1,222
LABOR FORCE [ PEOPLE ]
61.7%
PERCENT IN LABOR FORCE
6.5%
UNEMPLOYMENT RATE
Income in Castle Point
Income Overview in Castle Point
Per Capita Income in Castle Point is $18,955, while median incomes of families and households are $34,513 and $34,190 respectively.
| Characteristic | Number | Measure |
| Per Capita Income | 2,940 | $18,955 |
| Median Family Income | 671 | $34,513 |
| Mean Family Income | 671 | $46,560 |
| Median Household Income | 1,064 | $34,190 |
| Mean Household Income | 1,064 | $49,639 |
| Income Deficit | 671 | $0 |
| Wage / Income Gap (%) | 2,940 | 5.46% |
| Wage / Income Gap ($) | 2,940 | 94.54¢ per $1 |
| Gini / Inequality Index | 2,940 | 0.46 |
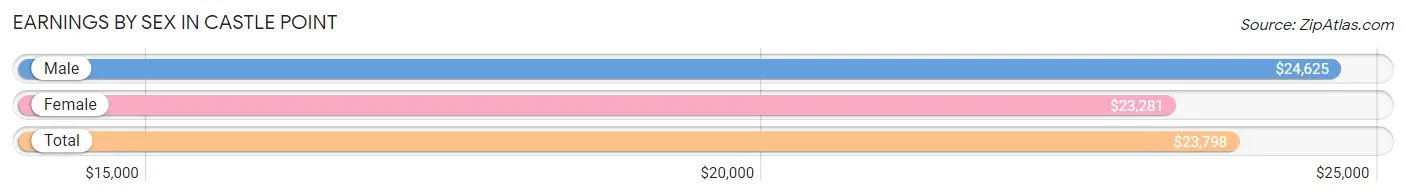
Earnings by Sex in Castle Point
Average Earnings in Castle Point are $23,798, $24,625 for men and $23,281 for women, a difference of 5.5%.
| Sex | Number | Average Earnings |
| Male | 404 (32.3%) | $24,625 |
| Female | 848 (67.7%) | $23,281 |
| Total | 1,252 (100.0%) | $23,798 |
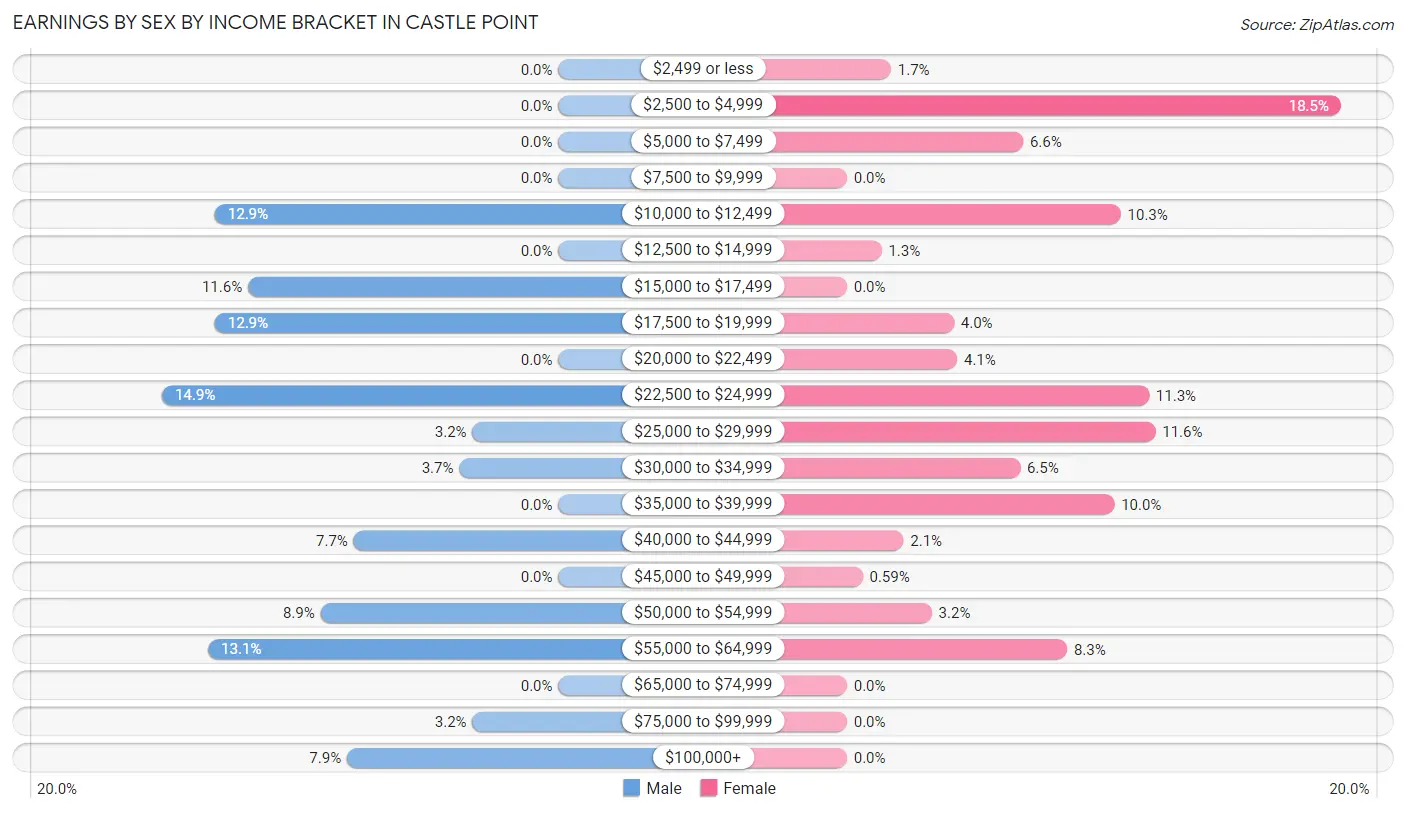
Earnings by Sex by Income Bracket in Castle Point
The most common earnings brackets in Castle Point are $22,500 to $24,999 for men (60 | 14.8%) and $2,500 to $4,999 for women (157 | 18.5%).
| Income | Male | Female |
| $2,499 or less | 0 (0.0%) | 14 (1.7%) |
| $2,500 to $4,999 | 0 (0.0%) | 157 (18.5%) |
| $5,000 to $7,499 | 0 (0.0%) | 56 (6.6%) |
| $7,500 to $9,999 | 0 (0.0%) | 0 (0.0%) |
| $10,000 to $12,499 | 52 (12.9%) | 87 (10.3%) |
| $12,500 to $14,999 | 0 (0.0%) | 11 (1.3%) |
| $15,000 to $17,499 | 47 (11.6%) | 0 (0.0%) |
| $17,500 to $19,999 | 52 (12.9%) | 34 (4.0%) |
| $20,000 to $22,499 | 0 (0.0%) | 35 (4.1%) |
| $22,500 to $24,999 | 60 (14.8%) | 96 (11.3%) |
| $25,000 to $29,999 | 13 (3.2%) | 98 (11.6%) |
| $30,000 to $34,999 | 15 (3.7%) | 55 (6.5%) |
| $35,000 to $39,999 | 0 (0.0%) | 85 (10.0%) |
| $40,000 to $44,999 | 31 (7.7%) | 18 (2.1%) |
| $45,000 to $49,999 | 0 (0.0%) | 5 (0.6%) |
| $50,000 to $54,999 | 36 (8.9%) | 27 (3.2%) |
| $55,000 to $64,999 | 53 (13.1%) | 70 (8.3%) |
| $65,000 to $74,999 | 0 (0.0%) | 0 (0.0%) |
| $75,000 to $99,999 | 13 (3.2%) | 0 (0.0%) |
| $100,000+ | 32 (7.9%) | 0 (0.0%) |
| Total | 404 (100.0%) | 848 (100.0%) |
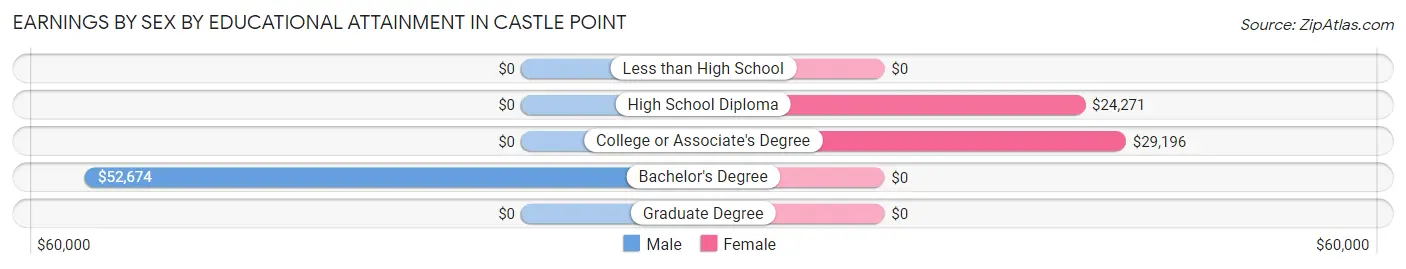
Earnings by Sex by Educational Attainment in Castle Point
Average earnings in Castle Point are $24,625 for men and $24,753 for women, a difference of 0.5%. Men with an educational attainment of bachelor's degree enjoy the highest average annual earnings of $52,674, while those with bachelor's degree education earn the least with $52,674. Women with an educational attainment of college or associate's degree earn the most with the average annual earnings of $29,196, while those with high school diploma education have the smallest earnings of $24,271.
| Educational Attainment | Male Income | Female Income |
| Less than High School | - | - |
| High School Diploma | - | - |
| College or Associate's Degree | - | - |
| Bachelor's Degree | $52,674 | $0 |
| Graduate Degree | - | - |
| Total | $24,625 | $24,753 |
Family Income in Castle Point
Family Income Brackets in Castle Point
According to the Castle Point family income data, there are 143 families falling into the $25,000 to $34,999 income range, which is the most common income bracket and makes up 21.3% of all families.
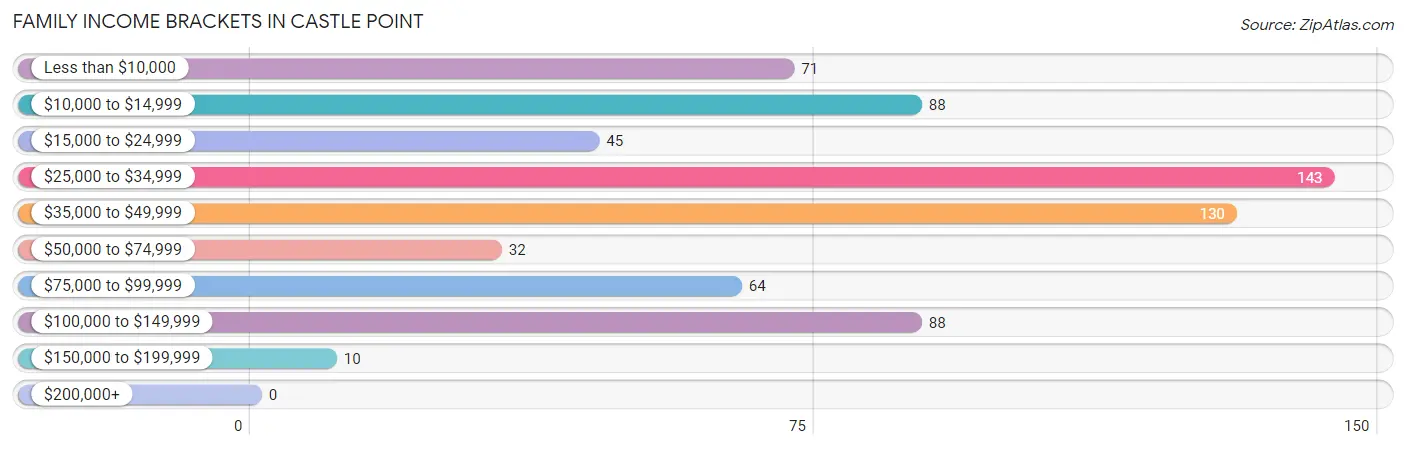
| Income Bracket | # Families | % Families |
| Less than $10,000 | 71 | 10.6% |
| $10,000 to $14,999 | 88 | 13.1% |
| $15,000 to $24,999 | 45 | 6.7% |
| $25,000 to $34,999 | 143 | 21.3% |
| $35,000 to $49,999 | 130 | 19.4% |
| $50,000 to $74,999 | 32 | 4.8% |
| $75,000 to $99,999 | 64 | 9.5% |
| $100,000 to $149,999 | 88 | 13.1% |
| $150,000 to $199,999 | 10 | 1.5% |
| $200,000+ | 0 | 0.0% |
Family Income by Famaliy Size in Castle Point
3-person families (199 | 29.7%) account for the highest median family income in Castle Point with $40,788 per family, while 2-person families (272 | 40.5%) have the highest median income of $14,662 per family member.
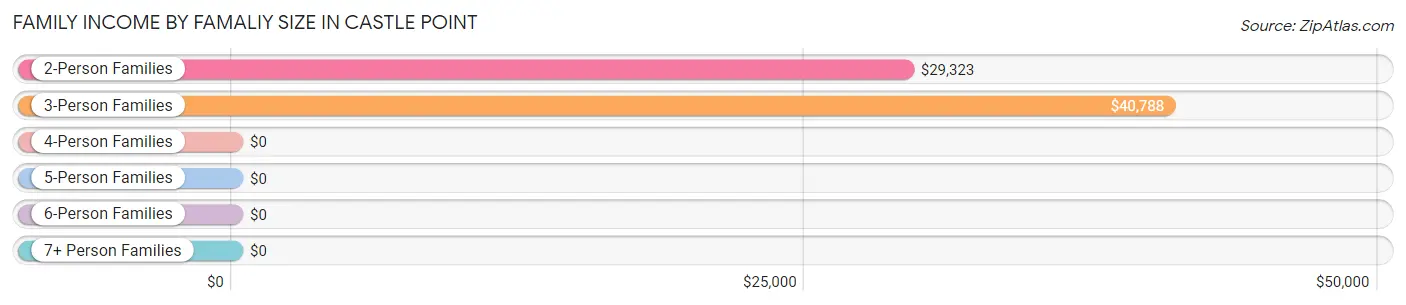
| Income Bracket | # Families | Median Income |
| 2-Person Families | 272 (40.5%) | $29,323 |
| 3-Person Families | 199 (29.7%) | $40,788 |
| 4-Person Families | 125 (18.6%) | $0 |
| 5-Person Families | 29 (4.3%) | $0 |
| 6-Person Families | 46 (6.9%) | $0 |
| 7+ Person Families | 0 (0.0%) | $0 |
| Total | 671 (100.0%) | $34,513 |
Family Income by Number of Earners in Castle Point
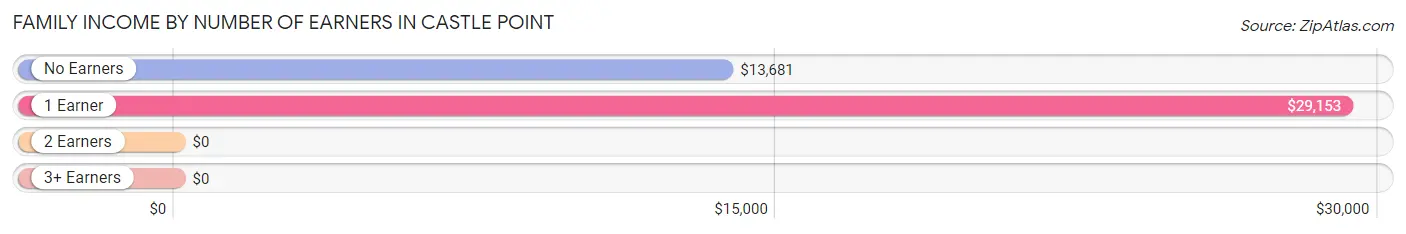
| Number of Earners | # Families | Median Income |
| No Earners | 99 (14.7%) | $13,681 |
| 1 Earner | 358 (53.3%) | $29,153 |
| 2 Earners | 193 (28.8%) | $0 |
| 3+ Earners | 21 (3.1%) | $0 |
| Total | 671 (100.0%) | $34,513 |
Household Income in Castle Point
Household Income Brackets in Castle Point
With 231 households falling in the category, the $25,000 to $34,999 income range is the most frequent in Castle Point, accounting for 21.7% of all households. In contrast, only 10 households (0.9%) fall into the $150,000 to $199,999 income bracket, making it the least populous group.
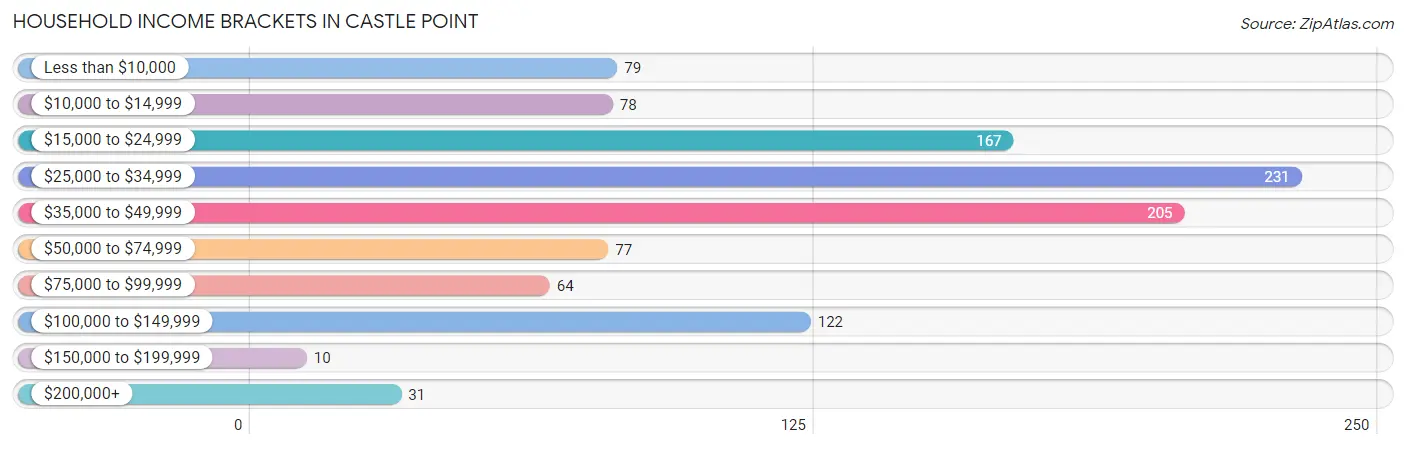
| Income Bracket | # Households | % Households |
| Less than $10,000 | 79 | 7.4% |
| $10,000 to $14,999 | 78 | 7.3% |
| $15,000 to $24,999 | 167 | 15.7% |
| $25,000 to $34,999 | 231 | 21.7% |
| $35,000 to $49,999 | 205 | 19.3% |
| $50,000 to $74,999 | 77 | 7.2% |
| $75,000 to $99,999 | 64 | 6.0% |
| $100,000 to $149,999 | 122 | 11.5% |
| $150,000 to $199,999 | 10 | 0.9% |
| $200,000+ | 31 | 2.9% |
Household Income by Householder Age in Castle Point
The median household income in Castle Point is $34,190, with the highest median household income of $43,173 found in the 65+ years age bracket for the primary householder. A total of 282 households (26.5%) fall into this category. Meanwhile, the 15 to 24 years age bracket for the primary householder has the lowest median household income of $0, with 86 households (8.1%) in this group.
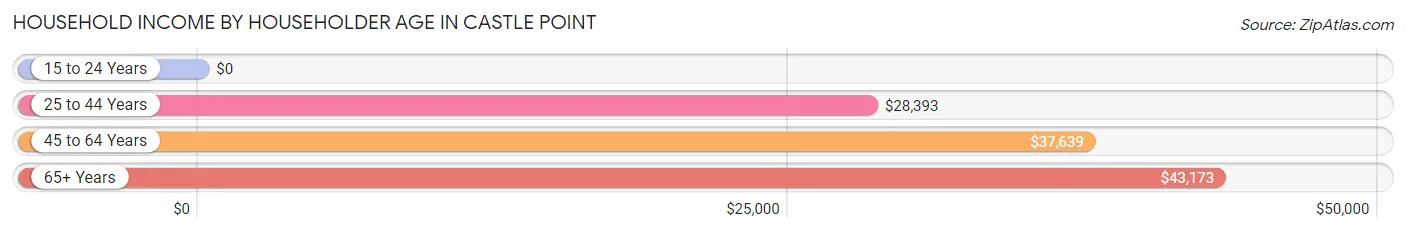
| Income Bracket | # Households | Median Income |
| 15 to 24 Years | 86 (8.1%) | $0 |
| 25 to 44 Years | 240 (22.6%) | $28,393 |
| 45 to 64 Years | 456 (42.9%) | $37,639 |
| 65+ Years | 282 (26.5%) | $43,173 |
| Total | 1,064 (100.0%) | $34,190 |
Poverty in Castle Point
Income Below Poverty by Sex and Age in Castle Point
With 33.8% poverty level for males and 39.6% for females among the residents of Castle Point, 5 year old males and 6 to 11 year old females are the most vulnerable to poverty, with 54 males (100.0%) and 39 females (100.0%) in their respective age groups living below the poverty level.
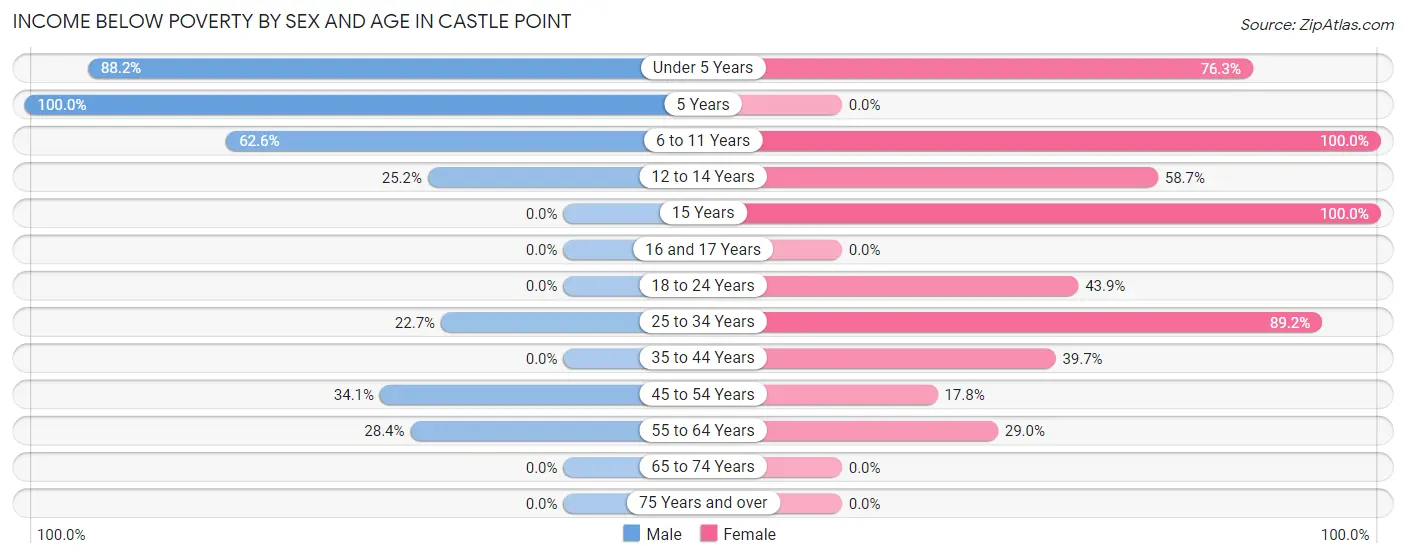
| Age Bracket | Male | Female |
| Under 5 Years | 60 (88.2%) | 45 (76.3%) |
| 5 Years | 54 (100.0%) | 0 (0.0%) |
| 6 to 11 Years | 112 (62.6%) | 39 (100.0%) |
| 12 to 14 Years | 39 (25.2%) | 78 (58.7%) |
| 15 Years | 0 (0.0%) | 144 (100.0%) |
| 16 and 17 Years | 0 (0.0%) | 0 (0.0%) |
| 18 to 24 Years | 0 (0.0%) | 104 (43.9%) |
| 25 to 34 Years | 30 (22.7%) | 115 (89.1%) |
| 35 to 44 Years | 0 (0.0%) | 46 (39.7%) |
| 45 to 54 Years | 47 (34.1%) | 54 (17.8%) |
| 55 to 64 Years | 46 (28.4%) | 66 (28.9%) |
| 65 to 74 Years | 0 (0.0%) | 0 (0.0%) |
| 75 Years and over | 0 (0.0%) | 0 (0.0%) |
| Total | 388 (33.8%) | 691 (39.6%) |
Income Above Poverty by Sex and Age in Castle Point
According to the poverty statistics in Castle Point, males aged 15 years and females aged 5 years are the age groups that are most secure financially, with 100.0% of males and 100.0% of females in these age groups living above the poverty line.
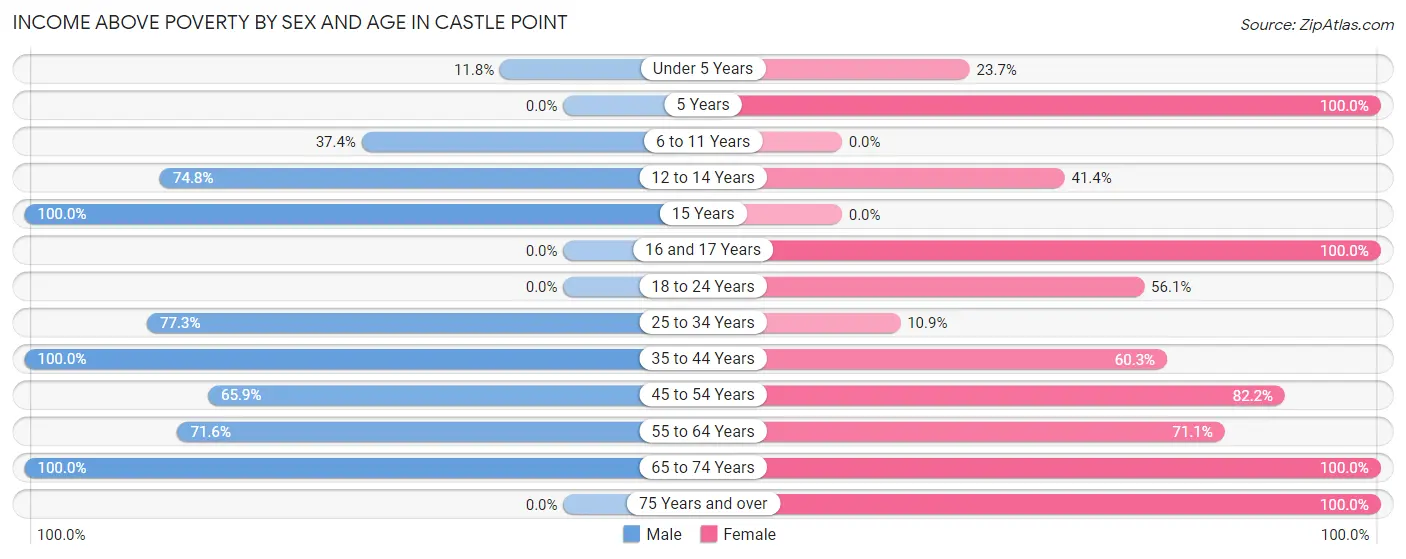
| Age Bracket | Male | Female |
| Under 5 Years | 8 (11.8%) | 14 (23.7%) |
| 5 Years | 0 (0.0%) | 54 (100.0%) |
| 6 to 11 Years | 67 (37.4%) | 0 (0.0%) |
| 12 to 14 Years | 116 (74.8%) | 55 (41.3%) |
| 15 Years | 29 (100.0%) | 0 (0.0%) |
| 16 and 17 Years | 0 (0.0%) | 37 (100.0%) |
| 18 to 24 Years | 0 (0.0%) | 133 (56.1%) |
| 25 to 34 Years | 102 (77.3%) | 14 (10.8%) |
| 35 to 44 Years | 92 (100.0%) | 70 (60.3%) |
| 45 to 54 Years | 91 (65.9%) | 250 (82.2%) |
| 55 to 64 Years | 116 (71.6%) | 162 (71.1%) |
| 65 to 74 Years | 140 (100.0%) | 232 (100.0%) |
| 75 Years and over | 0 (0.0%) | 33 (100.0%) |
| Total | 761 (66.2%) | 1,054 (60.4%) |
Income Below Poverty Among Married-Couple Families in Castle Point
| Children | Above Poverty | Below Poverty |
| No Children | 105 (100.0%) | 0 (0.0%) |
| 1 or 2 Children | 5 (100.0%) | 0 (0.0%) |
| 3 or 4 Children | 0 (0.0%) | 0 (0.0%) |
| 5 or more Children | 0 (0.0%) | 0 (0.0%) |
| Total | 110 (100.0%) | 0 (0.0%) |
Income Below Poverty Among Single-Parent Households in Castle Point
According to the poverty data in Castle Point, 41.7% or 10 single-father households and 42.6% or 229 single-mother households are living below the poverty line. Among single-father households, those with 3 or 4 children have the highest poverty rate, with 10 households (100.0%) experiencing poverty. Likewise, among single-mother households, those with 3 or 4 children have the highest poverty rate, with 93 households (66.0%) falling below the poverty line.
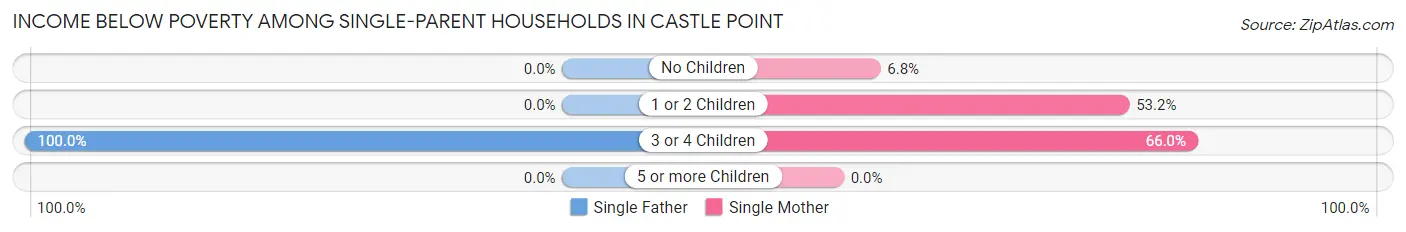
| Children | Single Father | Single Mother |
| No Children | 0 (0.0%) | 11 (6.8%) |
| 1 or 2 Children | 0 (0.0%) | 125 (53.2%) |
| 3 or 4 Children | 10 (100.0%) | 93 (66.0%) |
| 5 or more Children | 0 (0.0%) | 0 (0.0%) |
| Total | 10 (41.7%) | 229 (42.6%) |
Income Below Poverty Among Married-Couple vs Single-Parent Households in Castle Point
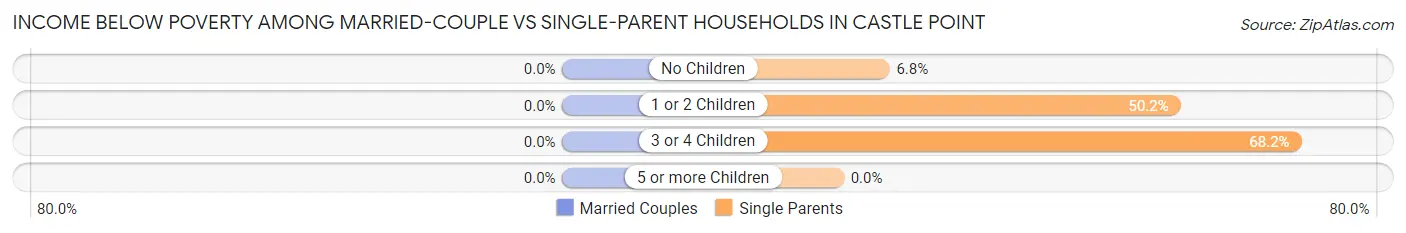
| Children | Married-Couple Families | Single-Parent Households |
| No Children | 0 (0.0%) | 11 (6.8%) |
| 1 or 2 Children | 0 (0.0%) | 125 (50.2%) |
| 3 or 4 Children | 0 (0.0%) | 103 (68.2%) |
| 5 or more Children | 0 (0.0%) | 0 (0.0%) |
| Total | 0 (0.0%) | 239 (42.6%) |
Race in Castle Point
The most populous races in Castle Point are Black / African American (2,684 | 91.3%), White / Caucasian (157 | 5.3%), and Hispanic or Latino (69 | 2.4%).
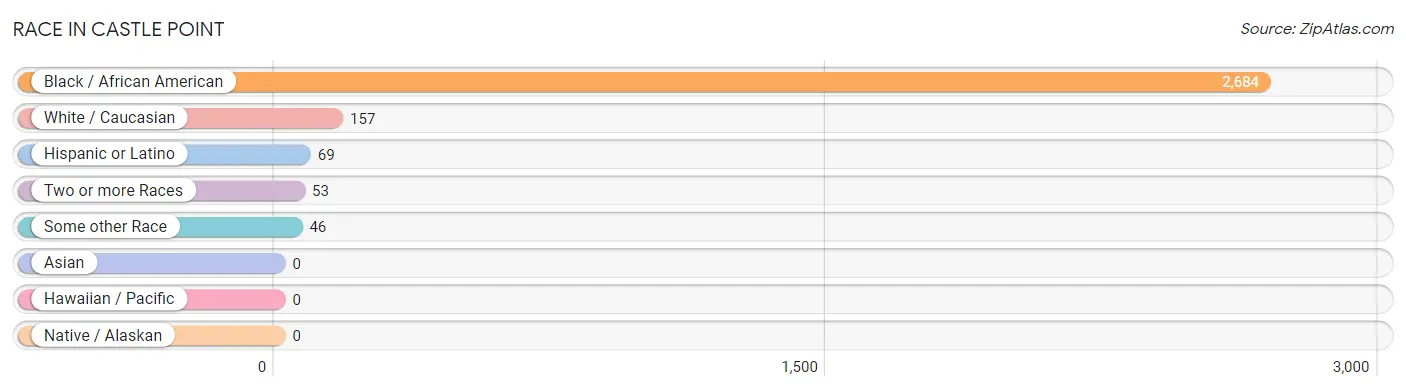
| Race | # Population | % Population |
| Asian | 0 | 0.0% |
| Black / African American | 2,684 | 91.3% |
| Hawaiian / Pacific | 0 | 0.0% |
| Hispanic or Latino | 69 | 2.4% |
| Native / Alaskan | 0 | 0.0% |
| White / Caucasian | 157 | 5.3% |
| Two or more Races | 53 | 1.8% |
| Some other Race | 46 | 1.6% |
| Total | 2,940 | 100.0% |
Ancestry in Castle Point
The most populous ancestries reported in Castle Point are Subsaharan African (80 | 2.7%), Irish (49 | 1.7%), African (47 | 1.6%), American (47 | 1.6%), and English (39 | 1.3%), together accounting for 8.9% of all Castle Point residents.
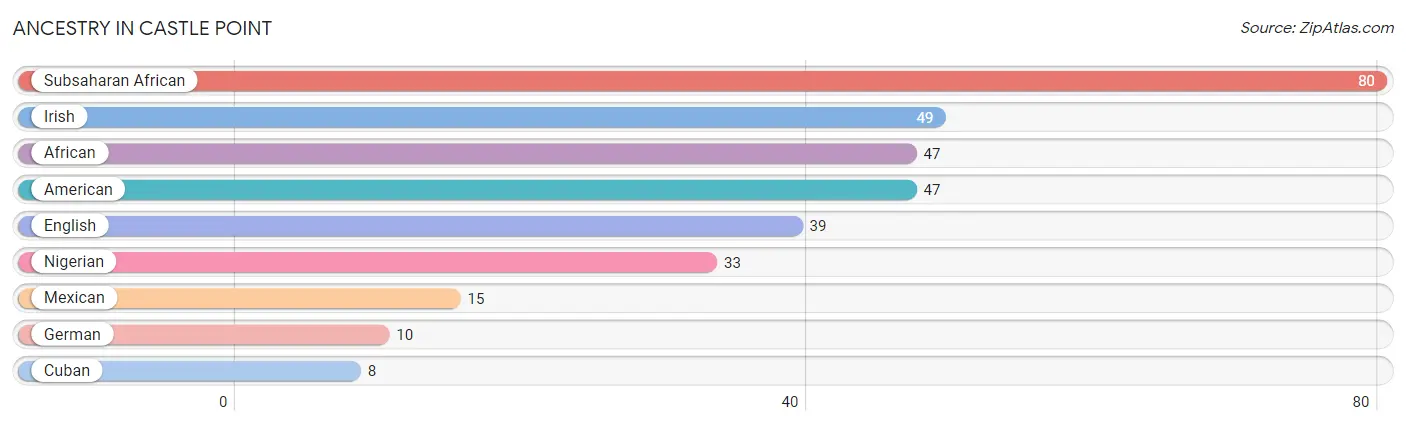
| Ancestry | # Population | % Population |
| African | 47 | 1.6% |
| American | 47 | 1.6% |
| Cuban | 8 | 0.3% |
| English | 39 | 1.3% |
| German | 10 | 0.3% |
| Irish | 49 | 1.7% |
| Mexican | 15 | 0.5% |
| Nigerian | 33 | 1.1% |
| Subsaharan African | 80 | 2.7% | View All 9 Rows |
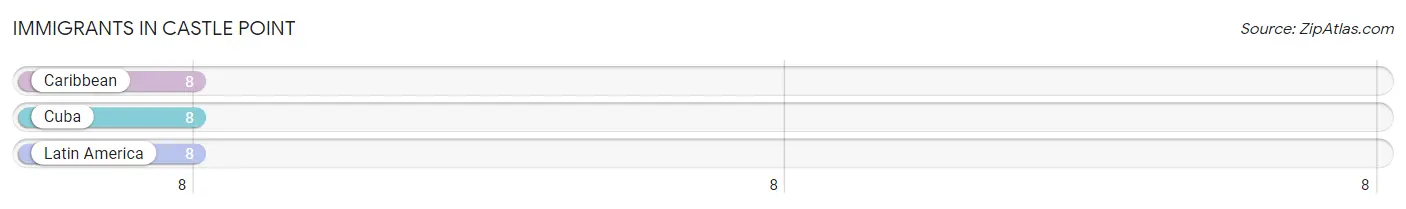
Immigrants in Castle Point
The most numerous immigrant groups reported in Castle Point came from Caribbean (8 | 0.3%), Cuba (8 | 0.3%), and Latin America (8 | 0.3%), together accounting for 0.8% of all Castle Point residents.
| Immigration Origin | # Population | % Population |
| Caribbean | 8 | 0.3% |
| Cuba | 8 | 0.3% |
| Latin America | 8 | 0.3% | View All 3 Rows |
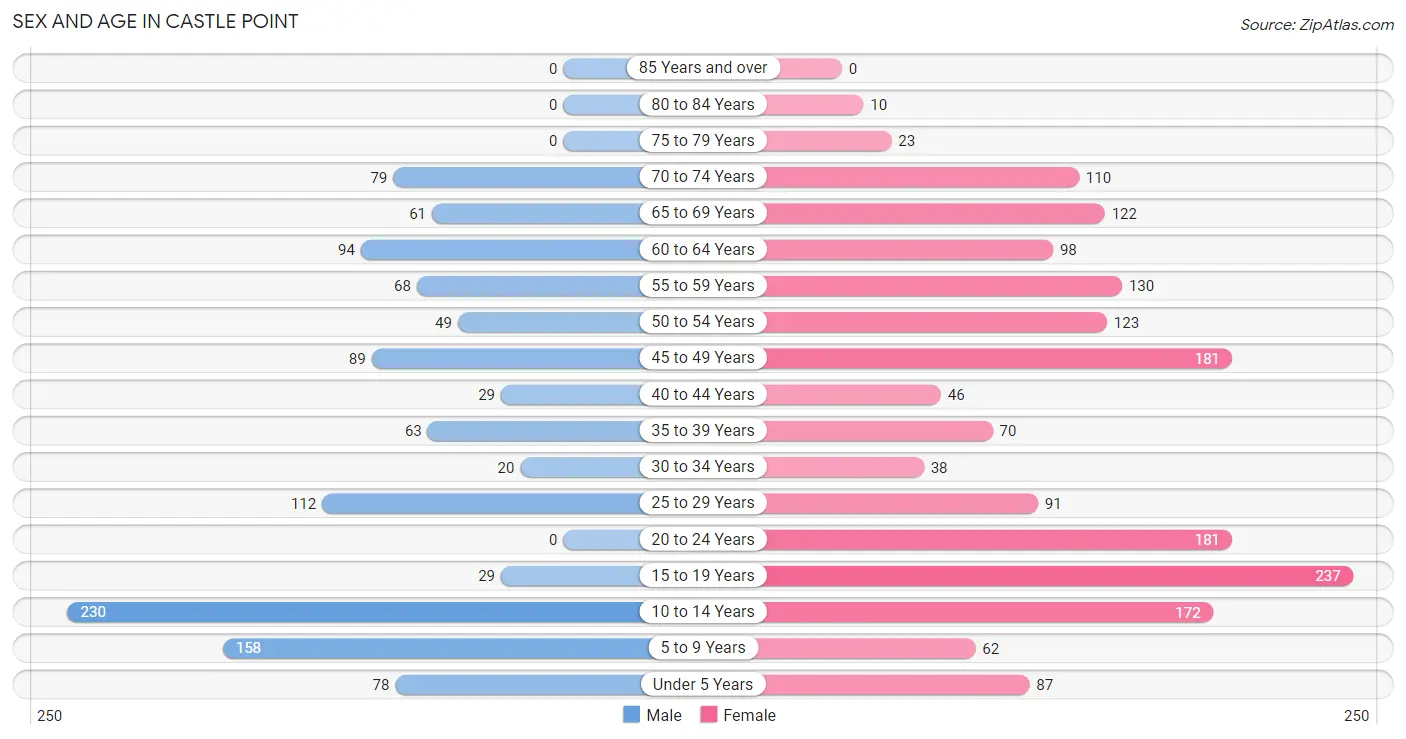
Sex and Age in Castle Point
Sex and Age in Castle Point
The most populous age groups in Castle Point are 10 to 14 Years (230 | 19.8%) for men and 15 to 19 Years (237 | 13.3%) for women.
| Age Bracket | Male | Female |
| Under 5 Years | 78 (6.7%) | 87 (4.9%) |
| 5 to 9 Years | 158 (13.6%) | 62 (3.5%) |
| 10 to 14 Years | 230 (19.8%) | 172 (9.7%) |
| 15 to 19 Years | 29 (2.5%) | 237 (13.3%) |
| 20 to 24 Years | 0 (0.0%) | 181 (10.2%) |
| 25 to 29 Years | 112 (9.7%) | 91 (5.1%) |
| 30 to 34 Years | 20 (1.7%) | 38 (2.1%) |
| 35 to 39 Years | 63 (5.4%) | 70 (3.9%) |
| 40 to 44 Years | 29 (2.5%) | 46 (2.6%) |
| 45 to 49 Years | 89 (7.7%) | 181 (10.2%) |
| 50 to 54 Years | 49 (4.2%) | 123 (6.9%) |
| 55 to 59 Years | 68 (5.9%) | 130 (7.3%) |
| 60 to 64 Years | 94 (8.1%) | 98 (5.5%) |
| 65 to 69 Years | 61 (5.3%) | 122 (6.9%) |
| 70 to 74 Years | 79 (6.8%) | 110 (6.2%) |
| 75 to 79 Years | 0 (0.0%) | 23 (1.3%) |
| 80 to 84 Years | 0 (0.0%) | 10 (0.6%) |
| 85 Years and over | 0 (0.0%) | 0 (0.0%) |
| Total | 1,159 (100.0%) | 1,781 (100.0%) |
Families and Households in Castle Point
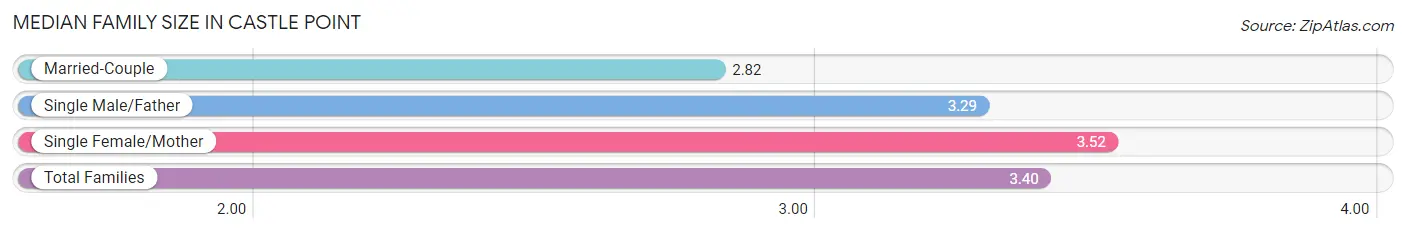
Median Family Size in Castle Point
The median family size in Castle Point is 3.40 persons per family, with single female/mother families (537 | 80.0%) accounting for the largest median family size of 3.52 persons per family. On the other hand, married-couple families (110 | 16.4%) represent the smallest median family size with 2.82 persons per family.
| Family Type | # Families | Family Size |
| Married-Couple | 110 (16.4%) | 2.82 |
| Single Male/Father | 24 (3.6%) | 3.29 |
| Single Female/Mother | 537 (80.0%) | 3.52 |
| Total Families | 671 (100.0%) | 3.40 |
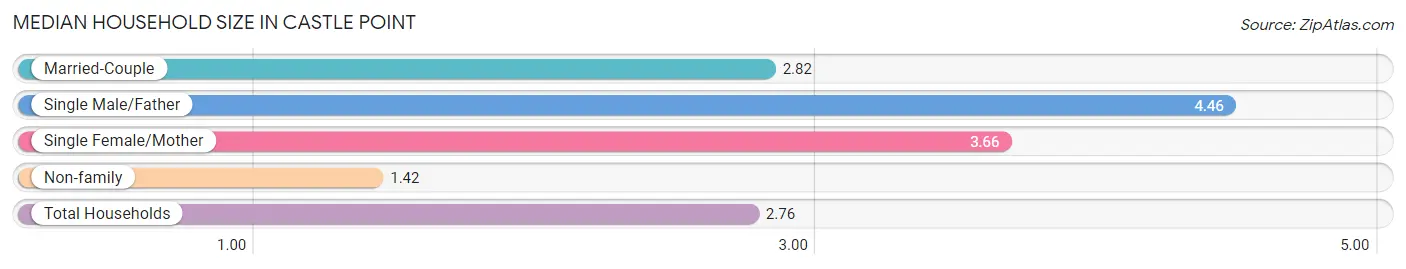
Median Household Size in Castle Point
The median household size in Castle Point is 2.76 persons per household, with single male/father households (24 | 2.3%) accounting for the largest median household size of 4.46 persons per household. non-family households (393 | 36.9%) represent the smallest median household size with 1.42 persons per household.
| Household Type | # Households | Household Size |
| Married-Couple | 110 (10.3%) | 2.82 |
| Single Male/Father | 24 (2.3%) | 4.46 |
| Single Female/Mother | 537 (50.5%) | 3.66 |
| Non-family | 393 (36.9%) | 1.42 |
| Total Households | 1,064 (100.0%) | 2.76 |
Household Size by Marriage Status in Castle Point
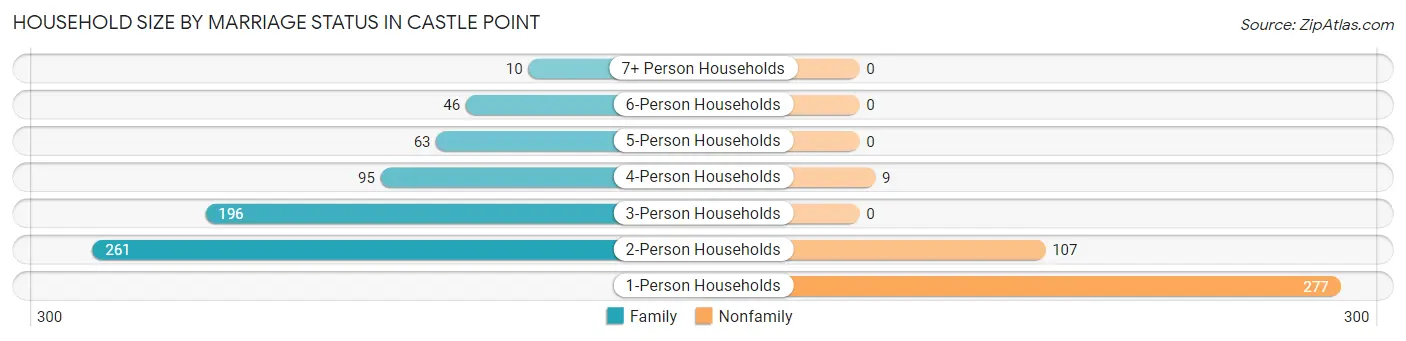
Out of a total of 1,064 households in Castle Point, 671 (63.1%) are family households, while 393 (36.9%) are nonfamily households. The most numerous type of family households are 2-person households, comprising 261, and the most common type of nonfamily households are 1-person households, comprising 277.
| Household Size | Family Households | Nonfamily Households |
| 1-Person Households | - | 277 (26.0%) |
| 2-Person Households | 261 (24.5%) | 107 (10.1%) |
| 3-Person Households | 196 (18.4%) | 0 (0.0%) |
| 4-Person Households | 95 (8.9%) | 9 (0.9%) |
| 5-Person Households | 63 (5.9%) | 0 (0.0%) |
| 6-Person Households | 46 (4.3%) | 0 (0.0%) |
| 7+ Person Households | 10 (0.9%) | 0 (0.0%) |
| Total | 671 (63.1%) | 393 (36.9%) |
Female Fertility in Castle Point
Fertility by Age in Castle Point
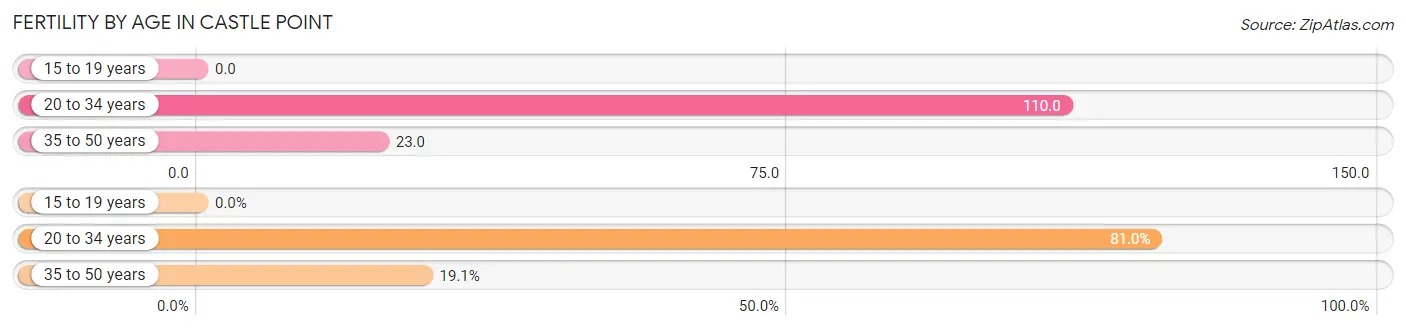
Average fertility rate in Castle Point is 47.0 births per 1,000 women. Women in the age bracket of 20 to 34 years have the highest fertility rate with 110.0 births per 1,000 women. Women in the age bracket of 20 to 34 years acount for 80.9% of all women with births.
| Age Bracket | Women with Births | Births / 1,000 Women |
| 15 to 19 years | 0 (0.0%) | 0.0 |
| 20 to 34 years | 34 (80.9%) | 110.0 |
| 35 to 50 years | 8 (19.1%) | 23.0 |
| Total | 42 (100.0%) | 47.0 |
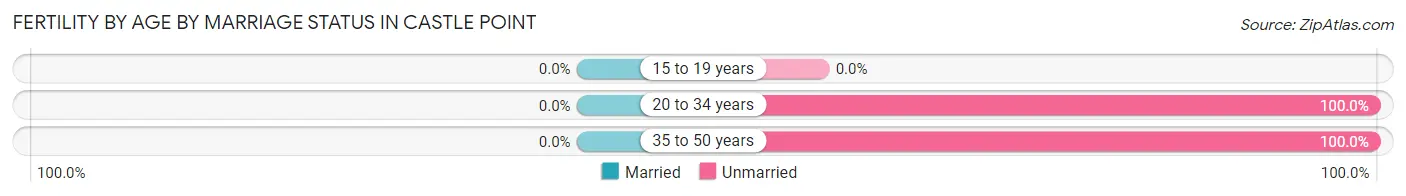
Fertility by Age by Marriage Status in Castle Point
| Age Bracket | Married | Unmarried |
| 15 to 19 years | 0 (0.0%) | 0 (0.0%) |
| 20 to 34 years | 0 (0.0%) | 34 (100.0%) |
| 35 to 50 years | 0 (0.0%) | 8 (100.0%) |
| Total | 0 (0.0%) | 42 (100.0%) |
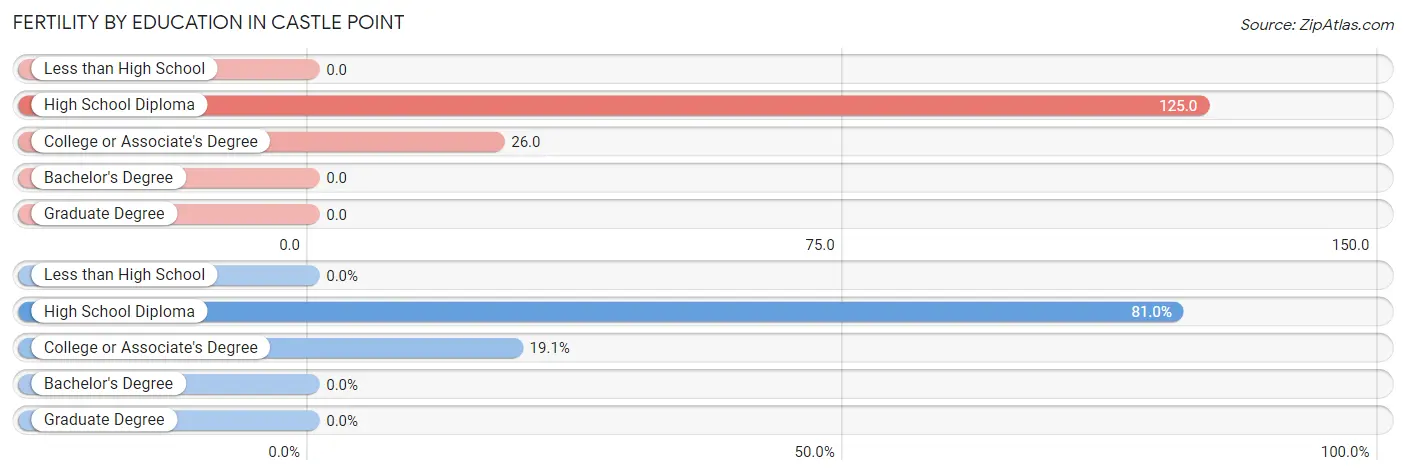
Fertility by Education in Castle Point
| Educational Attainment | Women with Births | Births / 1,000 Women |
| Less than High School | 0 (0.0%) | 0.0 |
| High School Diploma | 34 (80.9%) | 125.0 |
| College or Associate's Degree | 8 (19.1%) | 26.0 |
| Bachelor's Degree | 0 (0.0%) | 0.0 |
| Graduate Degree | 0 (0.0%) | 0.0 |
| Total | 42 (100.0%) | 47.0 |
Fertility by Education by Marriage Status in Castle Point
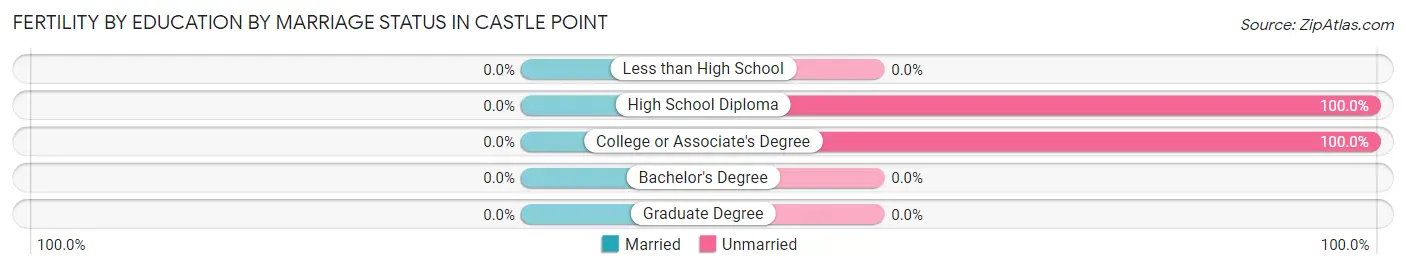
| Educational Attainment | Married | Unmarried |
| Less than High School | 0 (0.0%) | 0 (0.0%) |
| High School Diploma | 0 (0.0%) | 34 (100.0%) |
| College or Associate's Degree | 0 (0.0%) | 8 (100.0%) |
| Bachelor's Degree | 0 (0.0%) | 0 (0.0%) |
| Graduate Degree | 0 (0.0%) | 0 (0.0%) |
| Total | 0 (0.0%) | 42 (100.0%) |
Employment Characteristics in Castle Point
Employment by Class of Employer in Castle Point
Among the 1,028 employed individuals in Castle Point, private company employees (840 | 81.7%), not-for-profit organizations (71 | 6.9%), and self-employed (not incorporated) (40 | 3.9%) make up the most common classes of employment.
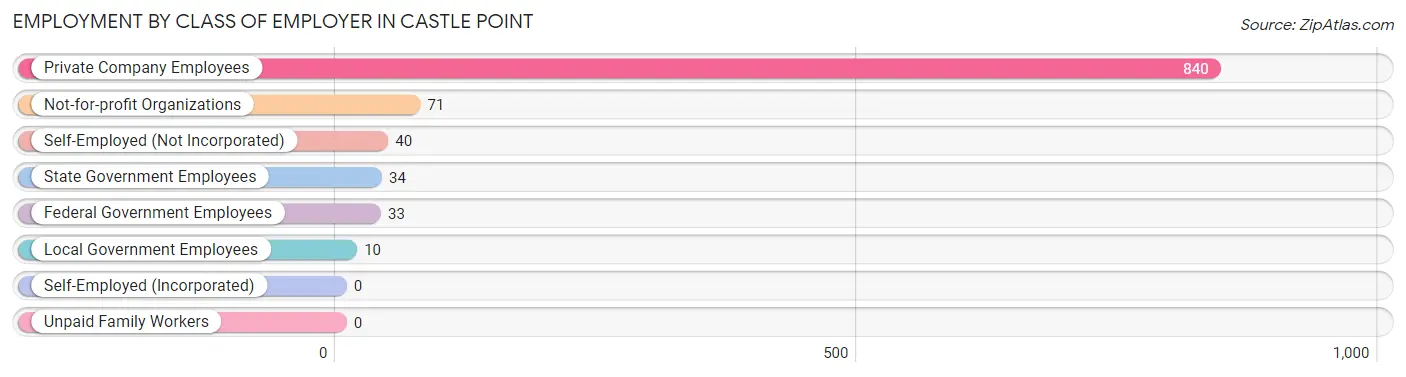
| Employer Class | # Employees | % Employees |
| Private Company Employees | 840 | 81.7% |
| Self-Employed (Incorporated) | 0 | 0.0% |
| Self-Employed (Not Incorporated) | 40 | 3.9% |
| Not-for-profit Organizations | 71 | 6.9% |
| Local Government Employees | 10 | 1.0% |
| State Government Employees | 34 | 3.3% |
| Federal Government Employees | 33 | 3.2% |
| Unpaid Family Workers | 0 | 0.0% |
| Total | 1,028 | 100.0% |
Employment Status by Age in Castle Point
According to the labor force statistics for Castle Point, out of the total population over 16 years of age (1,980), 61.7% or 1,222 individuals are in the labor force, with 6.5% or 79 of them unemployed. The age group with the highest labor force participation rate is 25 to 29 years, with 100.0% or 203 individuals in the labor force. Within the labor force, the 20 to 24 years age range has the highest percentage of unemployed individuals, with 22.5% or 25 of them being unemployed.
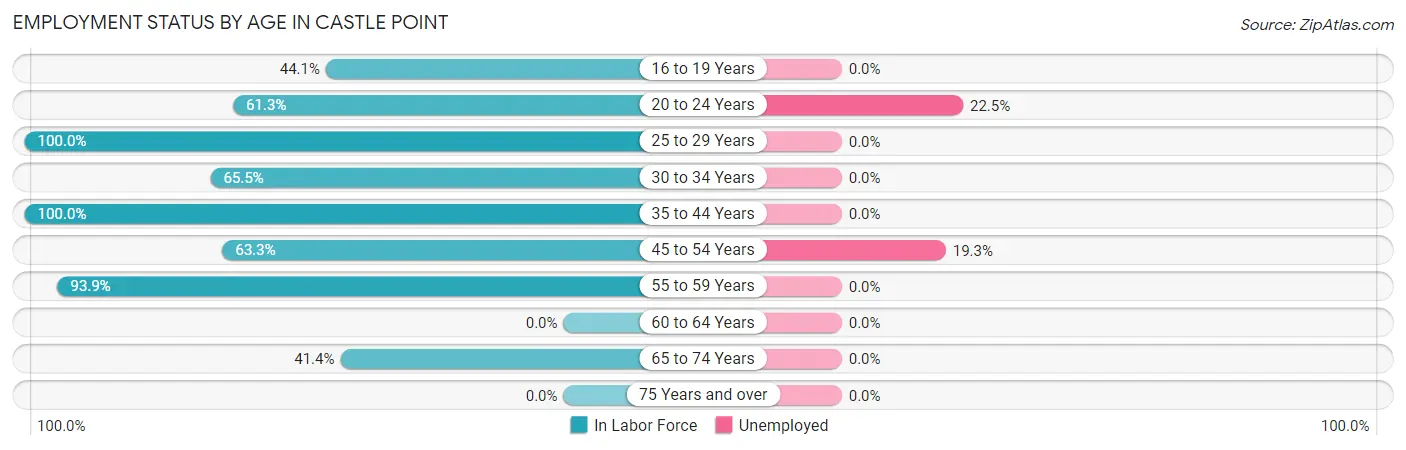
| Age Bracket | In Labor Force | Unemployed |
| 16 to 19 Years | 41 (44.1%) | 0 (0.0%) |
| 20 to 24 Years | 111 (61.3%) | 25 (22.5%) |
| 25 to 29 Years | 203 (100.0%) | 0 (0.0%) |
| 30 to 34 Years | 38 (65.5%) | 0 (0.0%) |
| 35 to 44 Years | 208 (100.0%) | 0 (0.0%) |
| 45 to 54 Years | 280 (63.3%) | 54 (19.3%) |
| 55 to 59 Years | 186 (93.9%) | 0 (0.0%) |
| 60 to 64 Years | 0 (0.0%) | 0 (0.0%) |
| 65 to 74 Years | 154 (41.4%) | 0 (0.0%) |
| 75 Years and over | 0 (0.0%) | 0 (0.0%) |
| Total | 1,222 (61.7%) | 79 (6.5%) |
Employment Status by Educational Attainment in Castle Point
According to labor force statistics for Castle Point, 70.3% of individuals (915) out of the total population between 25 and 64 years of age (1,301) are in the labor force, with 5.9% or 54 of them being unemployed. The group with the highest labor force participation rate are those with the educational attainment of bachelor's degree or higher, with 92.6% or 163 individuals in the labor force. Within the labor force, individuals with college / associate degree education have the highest percentage of unemployment, with 14.7% or 54 of them being unemployed.
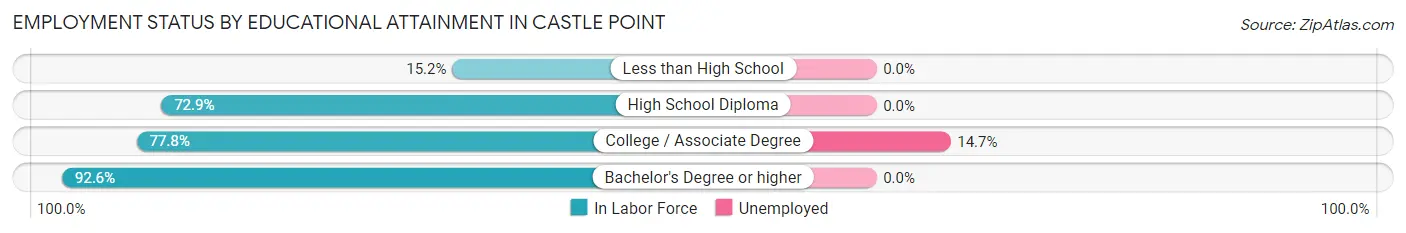
| Educational Attainment | In Labor Force | Unemployed |
| Less than High School | 24 (15.2%) | 0 (0.0%) |
| High School Diploma | 361 (72.9%) | 0 (0.0%) |
| College / Associate Degree | 367 (77.8%) | 69 (14.7%) |
| Bachelor's Degree or higher | 163 (92.6%) | 0 (0.0%) |
| Total | 915 (70.3%) | 77 (5.9%) |
Employment Occupations by Sex in Castle Point
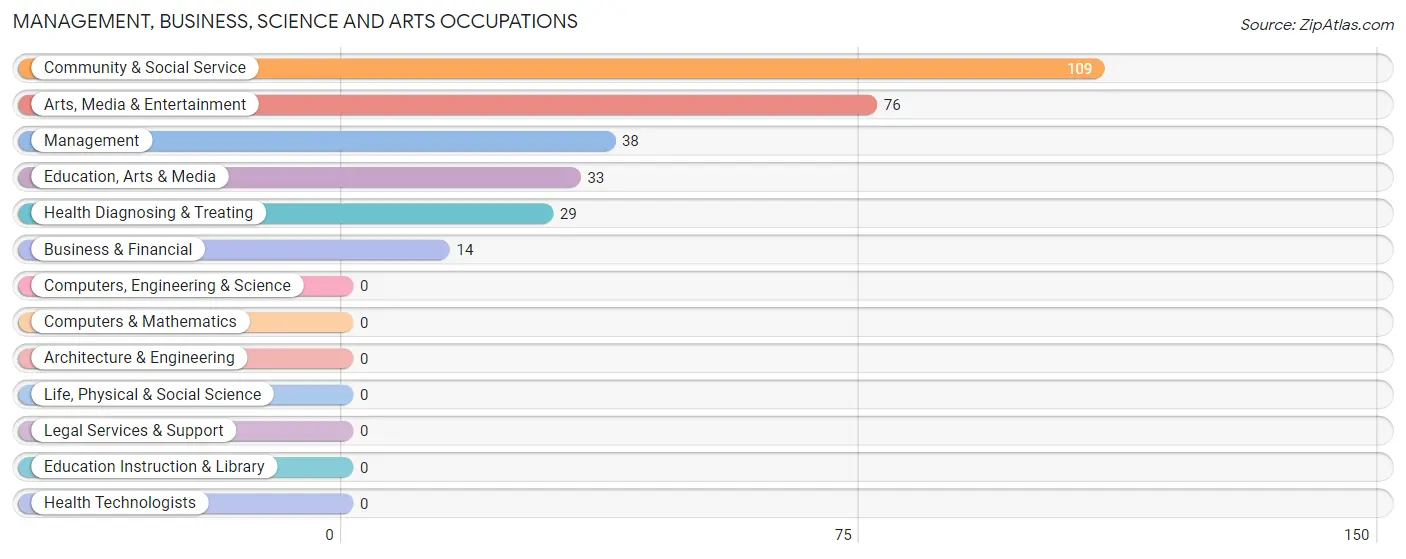
Management, Business, Science and Arts Occupations
The most common Management, Business, Science and Arts occupations in Castle Point are Community & Social Service (109 | 9.5%), Arts, Media & Entertainment (76 | 6.7%), Management (38 | 3.3%), Education, Arts & Media (33 | 2.9%), and Health Diagnosing & Treating (29 | 2.5%).
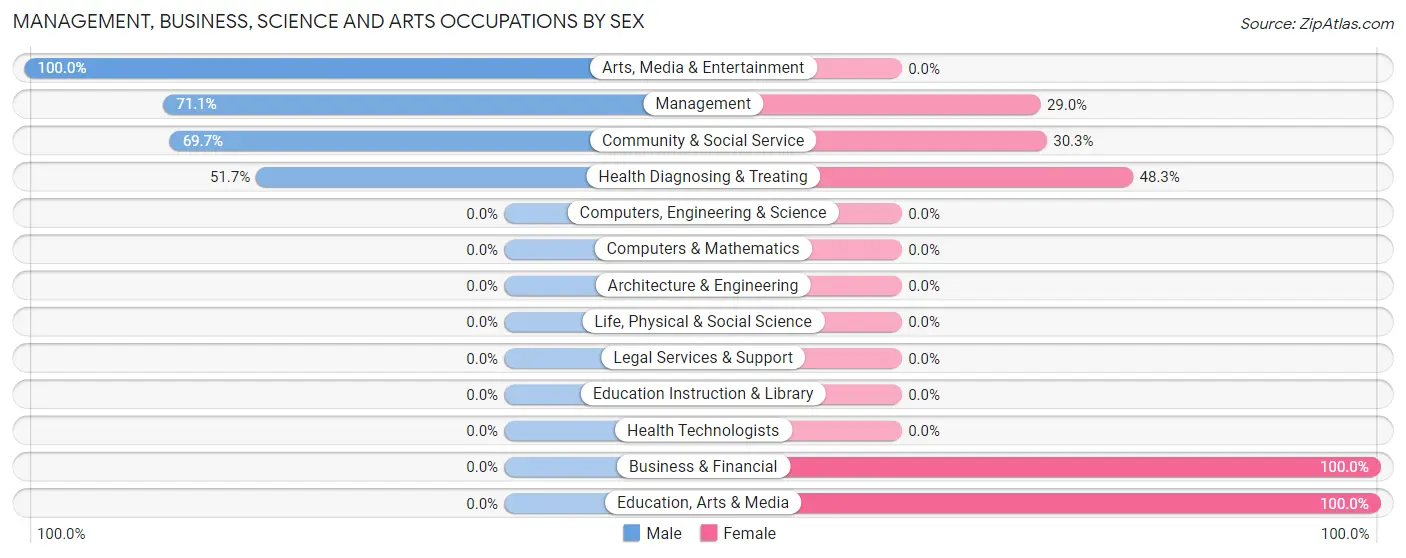
Management, Business, Science and Arts Occupations by Sex
Within the Management, Business, Science and Arts occupations in Castle Point, the most male-oriented occupations are Arts, Media & Entertainment (100.0%), Management (71.1%), and Community & Social Service (69.7%), while the most female-oriented occupations are Business & Financial (100.0%), Education, Arts & Media (100.0%), and Health Diagnosing & Treating (48.3%).
| Occupation | Male | Female |
| Management | 27 (71.1%) | 11 (28.9%) |
| Business & Financial | 0 (0.0%) | 14 (100.0%) |
| Computers, Engineering & Science | 0 (0.0%) | 0 (0.0%) |
| Computers & Mathematics | 0 (0.0%) | 0 (0.0%) |
| Architecture & Engineering | 0 (0.0%) | 0 (0.0%) |
| Life, Physical & Social Science | 0 (0.0%) | 0 (0.0%) |
| Community & Social Service | 76 (69.7%) | 33 (30.3%) |
| Education, Arts & Media | 0 (0.0%) | 33 (100.0%) |
| Legal Services & Support | 0 (0.0%) | 0 (0.0%) |
| Education Instruction & Library | 0 (0.0%) | 0 (0.0%) |
| Arts, Media & Entertainment | 76 (100.0%) | 0 (0.0%) |
| Health Diagnosing & Treating | 15 (51.7%) | 14 (48.3%) |
| Health Technologists | 0 (0.0%) | 0 (0.0%) |
| Total (Category) | 118 (62.1%) | 72 (37.9%) |
| Total (Overall) | 394 (34.5%) | 748 (65.5%) |
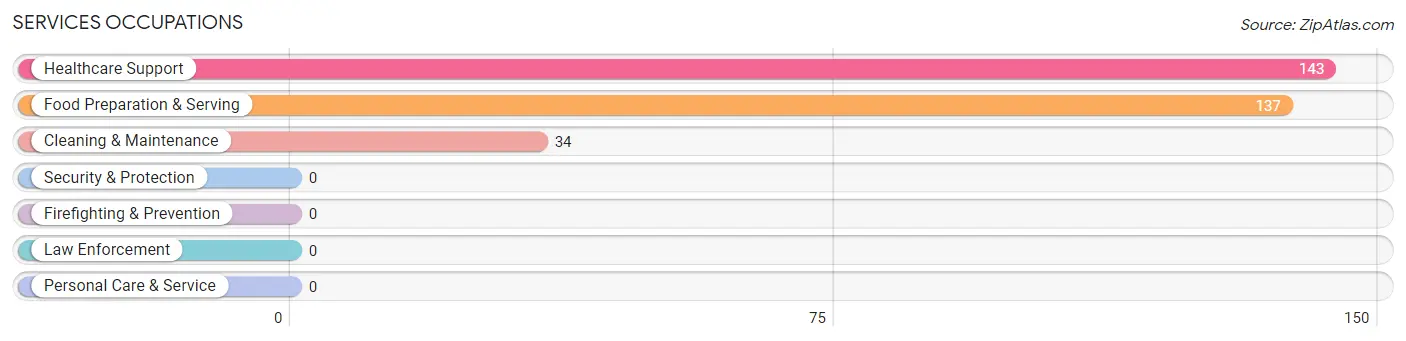
Services Occupations
The most common Services occupations in Castle Point are Healthcare Support (143 | 12.5%), Food Preparation & Serving (137 | 12.0%), and Cleaning & Maintenance (34 | 3.0%).
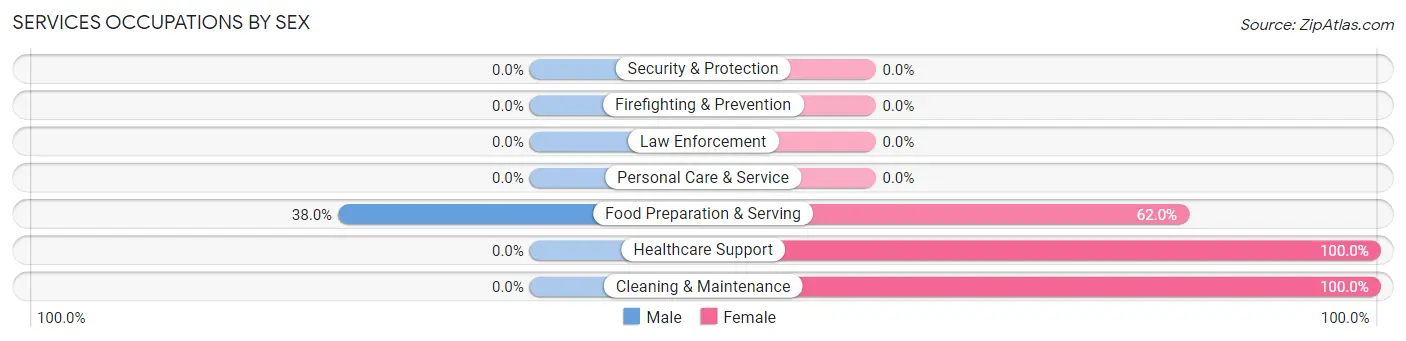
Services Occupations by Sex
| Occupation | Male | Female |
| Healthcare Support | 0 (0.0%) | 143 (100.0%) |
| Security & Protection | 0 (0.0%) | 0 (0.0%) |
| Firefighting & Prevention | 0 (0.0%) | 0 (0.0%) |
| Law Enforcement | 0 (0.0%) | 0 (0.0%) |
| Food Preparation & Serving | 52 (38.0%) | 85 (62.0%) |
| Cleaning & Maintenance | 0 (0.0%) | 34 (100.0%) |
| Personal Care & Service | 0 (0.0%) | 0 (0.0%) |
| Total (Category) | 52 (16.6%) | 262 (83.4%) |
| Total (Overall) | 394 (34.5%) | 748 (65.5%) |
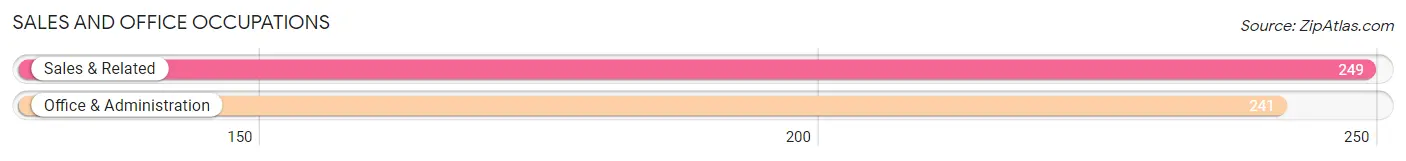
Sales and Office Occupations
The most common Sales and Office occupations in Castle Point are Sales & Related (249 | 21.8%), and Office & Administration (241 | 21.1%).
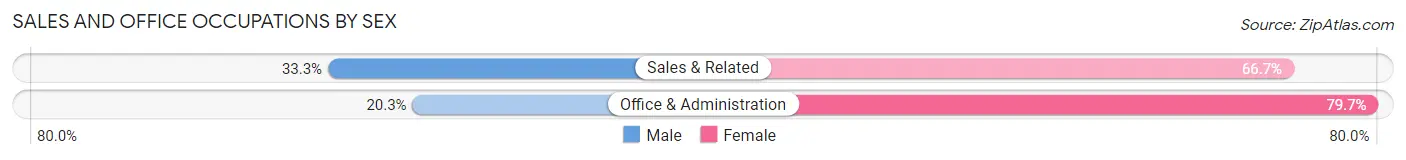
Sales and Office Occupations by Sex
| Occupation | Male | Female |
| Sales & Related | 83 (33.3%) | 166 (66.7%) |
| Office & Administration | 49 (20.3%) | 192 (79.7%) |
| Total (Category) | 132 (26.9%) | 358 (73.1%) |
| Total (Overall) | 394 (34.5%) | 748 (65.5%) |
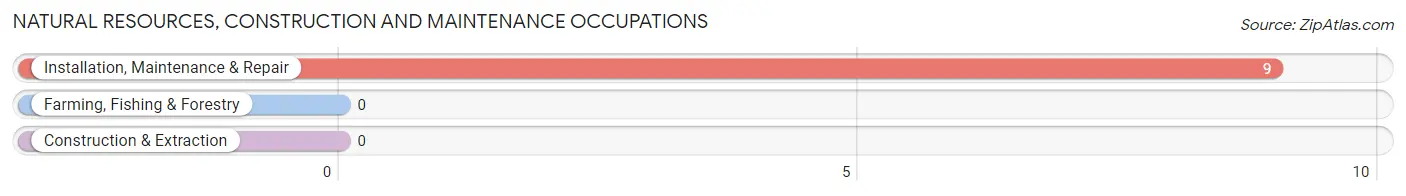
Natural Resources, Construction and Maintenance Occupations
The most common Natural Resources, Construction and Maintenance occupations in Castle Point are , and Installation, Maintenance & Repair (9 | 0.8%).
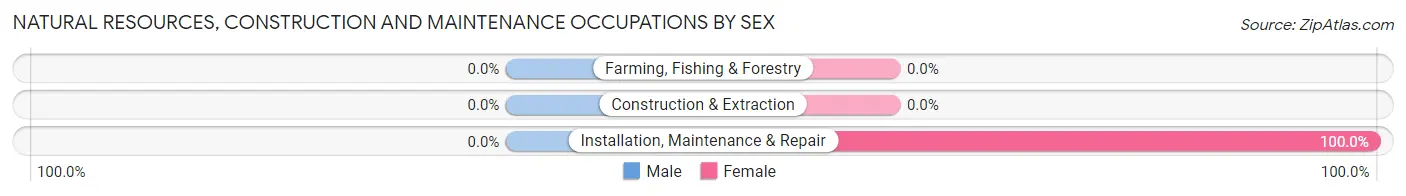
Natural Resources, Construction and Maintenance Occupations by Sex
| Occupation | Male | Female |
| Farming, Fishing & Forestry | 0 (0.0%) | 0 (0.0%) |
| Construction & Extraction | 0 (0.0%) | 0 (0.0%) |
| Installation, Maintenance & Repair | 0 (0.0%) | 9 (100.0%) |
| Total (Category) | 0 (0.0%) | 9 (100.0%) |
| Total (Overall) | 394 (34.5%) | 748 (65.5%) |
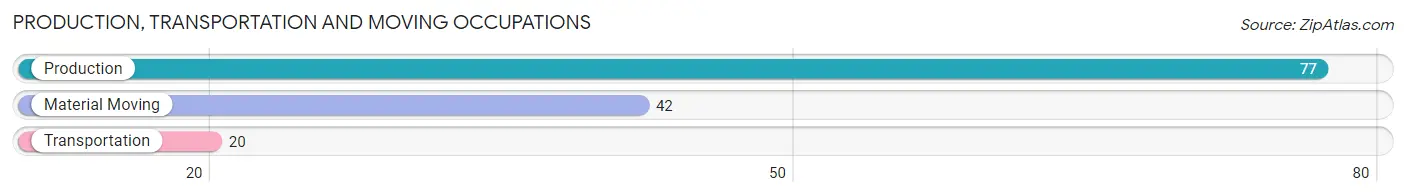
Production, Transportation and Moving Occupations
The most common Production, Transportation and Moving occupations in Castle Point are Production (77 | 6.7%), Material Moving (42 | 3.7%), and Transportation (20 | 1.8%).
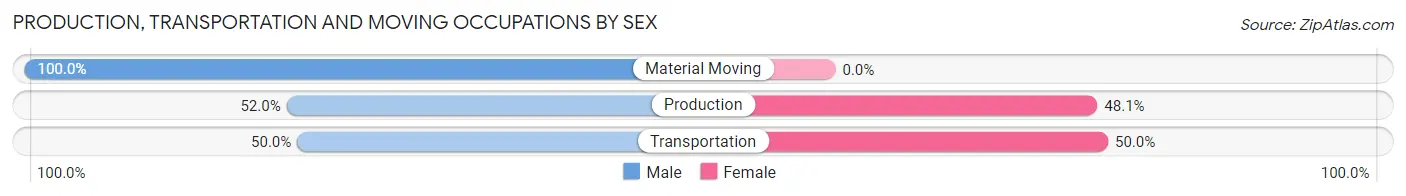
Production, Transportation and Moving Occupations by Sex
| Occupation | Male | Female |
| Production | 40 (51.9%) | 37 (48.0%) |
| Transportation | 10 (50.0%) | 10 (50.0%) |
| Material Moving | 42 (100.0%) | 0 (0.0%) |
| Total (Category) | 92 (66.2%) | 47 (33.8%) |
| Total (Overall) | 394 (34.5%) | 748 (65.5%) |
Employment Industries by Sex in Castle Point
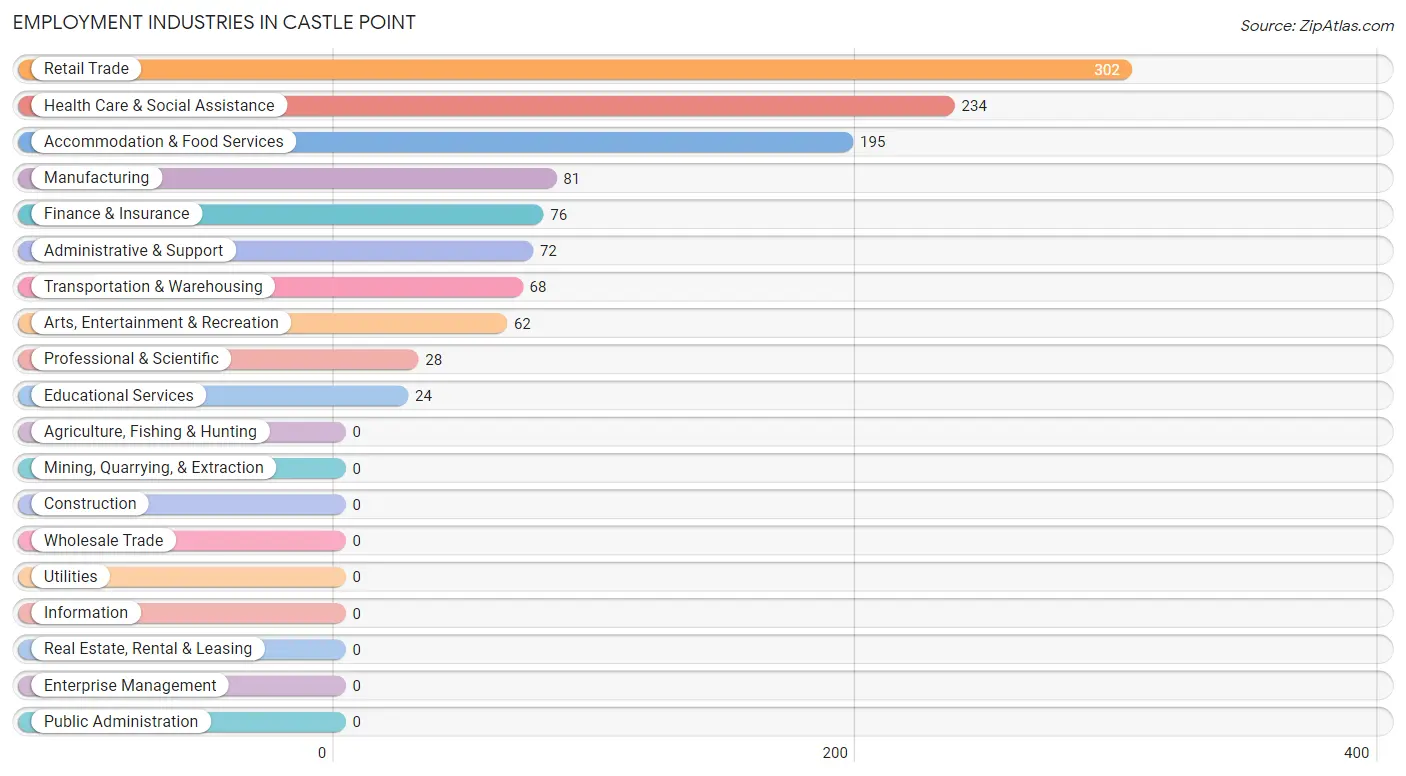
Employment Industries in Castle Point
The major employment industries in Castle Point include Retail Trade (302 | 26.4%), Health Care & Social Assistance (234 | 20.5%), Accommodation & Food Services (195 | 17.1%), Manufacturing (81 | 7.1%), and Finance & Insurance (76 | 6.7%).
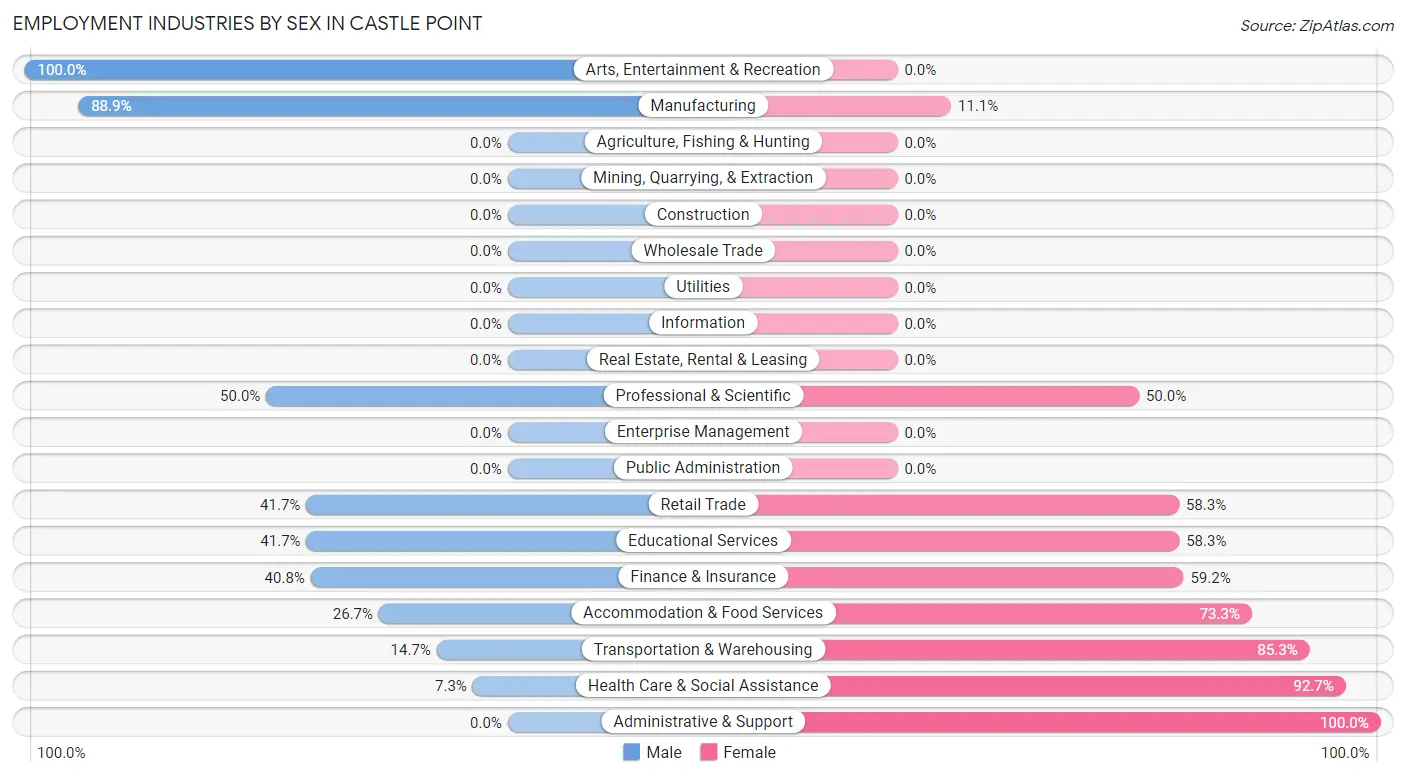
Employment Industries by Sex in Castle Point
The Castle Point industries that see more men than women are Arts, Entertainment & Recreation (100.0%), Manufacturing (88.9%), and Professional & Scientific (50.0%), whereas the industries that tend to have a higher number of women are Administrative & Support (100.0%), Health Care & Social Assistance (92.7%), and Transportation & Warehousing (85.3%).
| Industry | Male | Female |
| Agriculture, Fishing & Hunting | 0 (0.0%) | 0 (0.0%) |
| Mining, Quarrying, & Extraction | 0 (0.0%) | 0 (0.0%) |
| Construction | 0 (0.0%) | 0 (0.0%) |
| Manufacturing | 72 (88.9%) | 9 (11.1%) |
| Wholesale Trade | 0 (0.0%) | 0 (0.0%) |
| Retail Trade | 126 (41.7%) | 176 (58.3%) |
| Transportation & Warehousing | 10 (14.7%) | 58 (85.3%) |
| Utilities | 0 (0.0%) | 0 (0.0%) |
| Information | 0 (0.0%) | 0 (0.0%) |
| Finance & Insurance | 31 (40.8%) | 45 (59.2%) |
| Real Estate, Rental & Leasing | 0 (0.0%) | 0 (0.0%) |
| Professional & Scientific | 14 (50.0%) | 14 (50.0%) |
| Enterprise Management | 0 (0.0%) | 0 (0.0%) |
| Administrative & Support | 0 (0.0%) | 72 (100.0%) |
| Educational Services | 10 (41.7%) | 14 (58.3%) |
| Health Care & Social Assistance | 17 (7.3%) | 217 (92.7%) |
| Arts, Entertainment & Recreation | 62 (100.0%) | 0 (0.0%) |
| Accommodation & Food Services | 52 (26.7%) | 143 (73.3%) |
| Public Administration | 0 (0.0%) | 0 (0.0%) |
| Total | 394 (34.5%) | 748 (65.5%) |
Education in Castle Point
School Enrollment in Castle Point
The most common levels of schooling among the 788 students in Castle Point are high school (285 | 36.2%), middle school (171 | 21.7%), and kindergarten (108 | 13.7%).
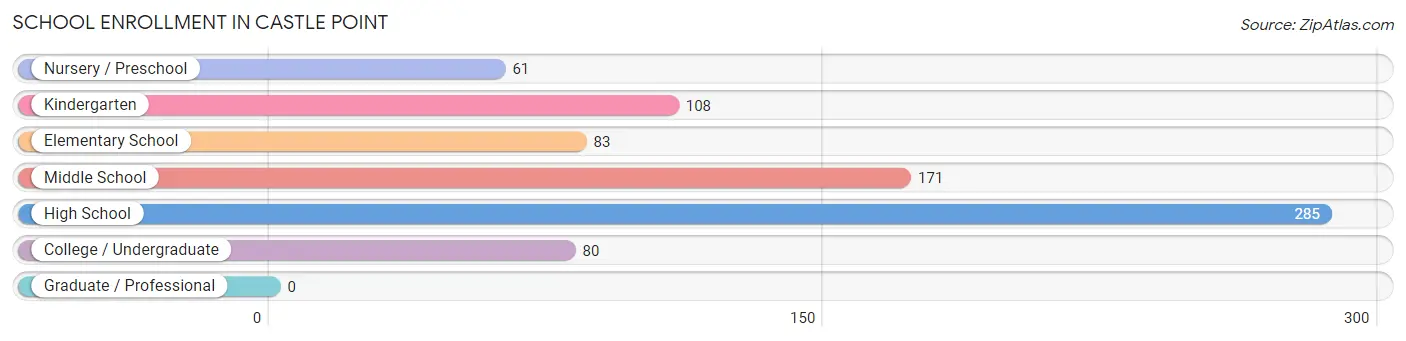
| School Level | # Students | % Students |
| Nursery / Preschool | 61 | 7.7% |
| Kindergarten | 108 | 13.7% |
| Elementary School | 83 | 10.5% |
| Middle School | 171 | 21.7% |
| High School | 285 | 36.2% |
| College / Undergraduate | 80 | 10.2% |
| Graduate / Professional | 0 | 0.0% |
| Total | 788 | 100.0% |
School Enrollment by Age by Funding Source in Castle Point
Out of a total of 788 students who are enrolled in schools in Castle Point, 39 (4.9%) attend a private institution, while the remaining 749 (95.1%) are enrolled in public schools. The age group of 20 to 24 year olds has the highest likelihood of being enrolled in private schools, with 17 (100.0% in the age bracket) enrolled. Conversely, the age group of 10 to 14 year olds has the lowest likelihood of being enrolled in a private school, with 271 (100.0% in the age bracket) attending a public institution.
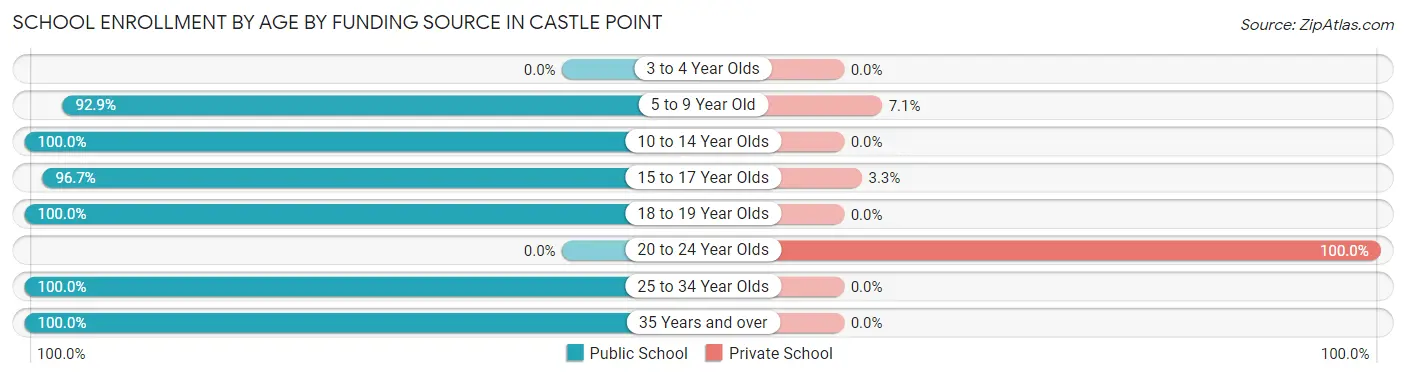
| Age Bracket | Public School | Private School |
| 3 to 4 Year Olds | 0 (0.0%) | 0 (0.0%) |
| 5 to 9 Year Old | 197 (92.9%) | 15 (7.1%) |
| 10 to 14 Year Olds | 271 (100.0%) | 0 (0.0%) |
| 15 to 17 Year Olds | 203 (96.7%) | 7 (3.3%) |
| 18 to 19 Year Olds | 15 (100.0%) | 0 (0.0%) |
| 20 to 24 Year Olds | 0 (0.0%) | 17 (100.0%) |
| 25 to 34 Year Olds | 14 (100.0%) | 0 (0.0%) |
| 35 Years and over | 49 (100.0%) | 0 (0.0%) |
| Total | 749 (95.1%) | 39 (4.9%) |
Educational Attainment by Field of Study in Castle Point
Bio, nature & agricultural (52 | 22.7%), visual & performing arts (47 | 20.5%), science & technology (33 | 14.4%), arts & humanities (33 | 14.4%), and communications (29 | 12.7%) are the most common fields of study among 229 individuals in Castle Point who have obtained a bachelor's degree or higher.
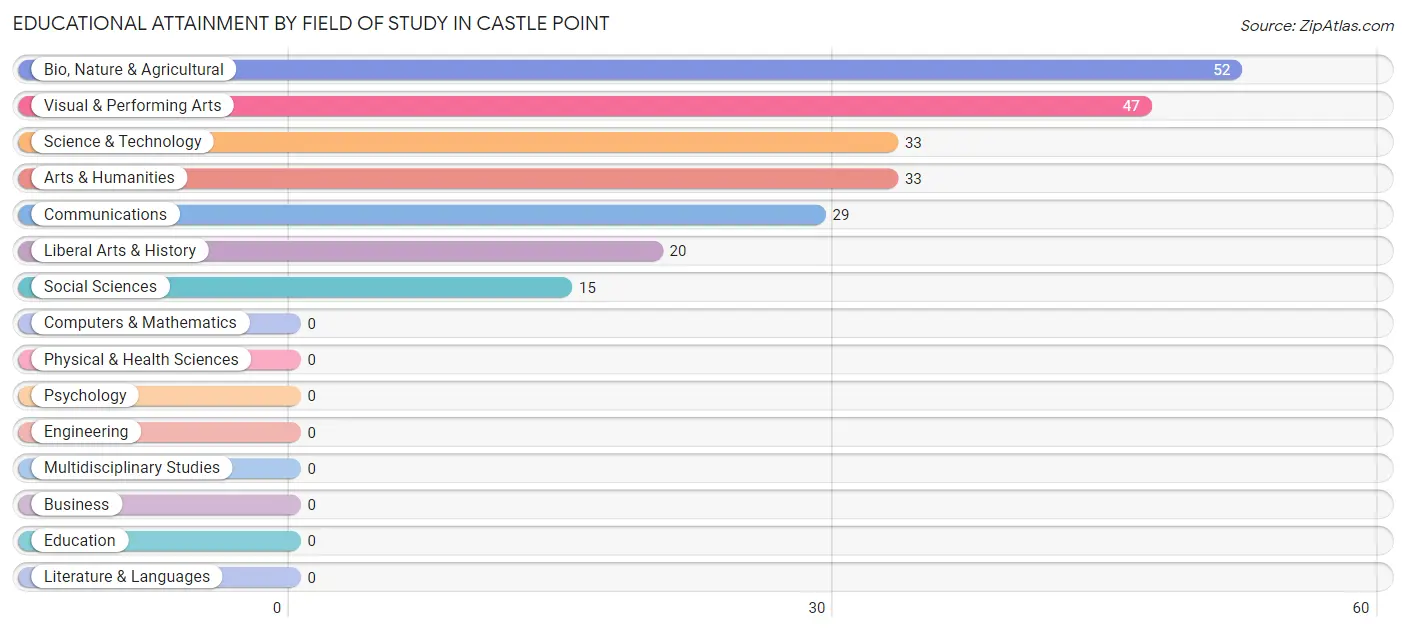
| Field of Study | # Graduates | % Graduates |
| Computers & Mathematics | 0 | 0.0% |
| Bio, Nature & Agricultural | 52 | 22.7% |
| Physical & Health Sciences | 0 | 0.0% |
| Psychology | 0 | 0.0% |
| Social Sciences | 15 | 6.6% |
| Engineering | 0 | 0.0% |
| Multidisciplinary Studies | 0 | 0.0% |
| Science & Technology | 33 | 14.4% |
| Business | 0 | 0.0% |
| Education | 0 | 0.0% |
| Literature & Languages | 0 | 0.0% |
| Liberal Arts & History | 20 | 8.7% |
| Visual & Performing Arts | 47 | 20.5% |
| Communications | 29 | 12.7% |
| Arts & Humanities | 33 | 14.4% |
| Total | 229 | 100.0% |
Transportation & Commute in Castle Point
Vehicle Availability by Sex in Castle Point
The most prevalent vehicle ownership categories in Castle Point are males with 2 vehicles (138, accounting for 38.1%) and females with 2 vehicles (116, making up 20.7%).
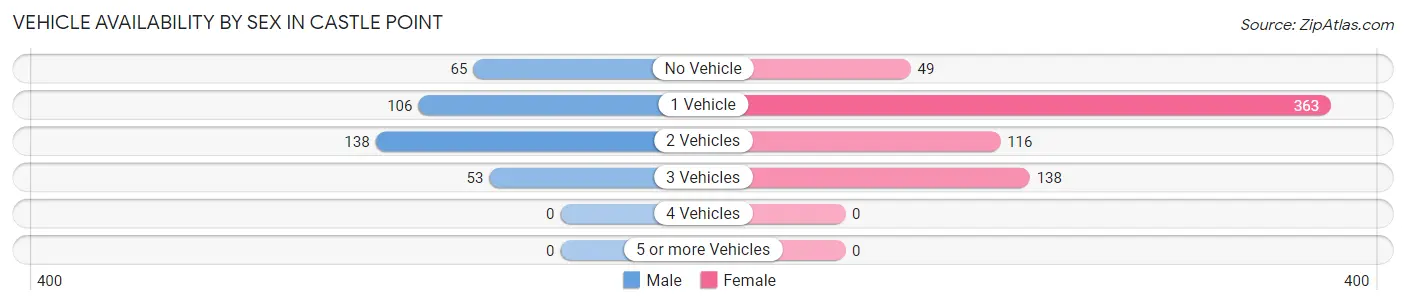
| Vehicles Available | Male | Female |
| No Vehicle | 65 (18.0%) | 49 (7.4%) |
| 1 Vehicle | 106 (29.3%) | 363 (54.5%) |
| 2 Vehicles | 138 (38.1%) | 116 (17.4%) |
| 3 Vehicles | 53 (14.6%) | 138 (20.7%) |
| 4 Vehicles | 0 (0.0%) | 0 (0.0%) |
| 5 or more Vehicles | 0 (0.0%) | 0 (0.0%) |
| Total | 362 (100.0%) | 666 (100.0%) |
Commute Time in Castle Point
The most frequently occuring commute durations in Castle Point are 20 to 24 minutes (246 commuters, 25.6%), 30 to 34 minutes (204 commuters, 21.2%), and 15 to 19 minutes (122 commuters, 12.7%).
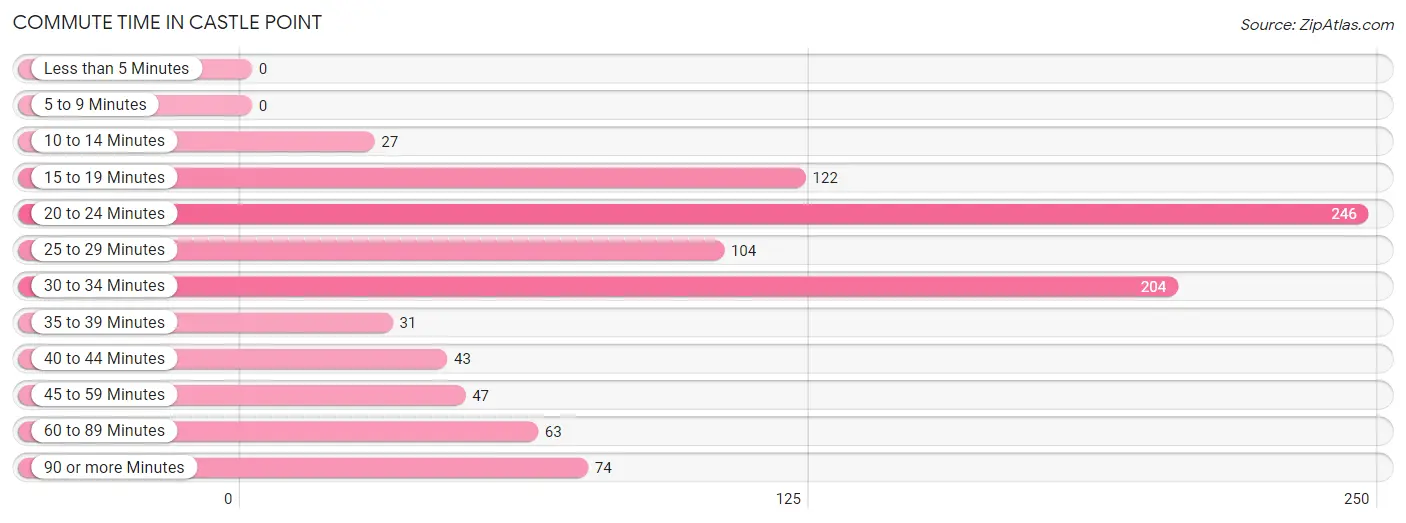
| Commute Time | # Commuters | % Commuters |
| Less than 5 Minutes | 0 | 0.0% |
| 5 to 9 Minutes | 0 | 0.0% |
| 10 to 14 Minutes | 27 | 2.8% |
| 15 to 19 Minutes | 122 | 12.7% |
| 20 to 24 Minutes | 246 | 25.6% |
| 25 to 29 Minutes | 104 | 10.8% |
| 30 to 34 Minutes | 204 | 21.2% |
| 35 to 39 Minutes | 31 | 3.2% |
| 40 to 44 Minutes | 43 | 4.5% |
| 45 to 59 Minutes | 47 | 4.9% |
| 60 to 89 Minutes | 63 | 6.6% |
| 90 or more Minutes | 74 | 7.7% |
Commute Time by Sex in Castle Point
The most common commute times in Castle Point are 30 to 34 minutes (115 commuters, 36.3%) for males and 20 to 24 minutes (174 commuters, 27.0%) for females.
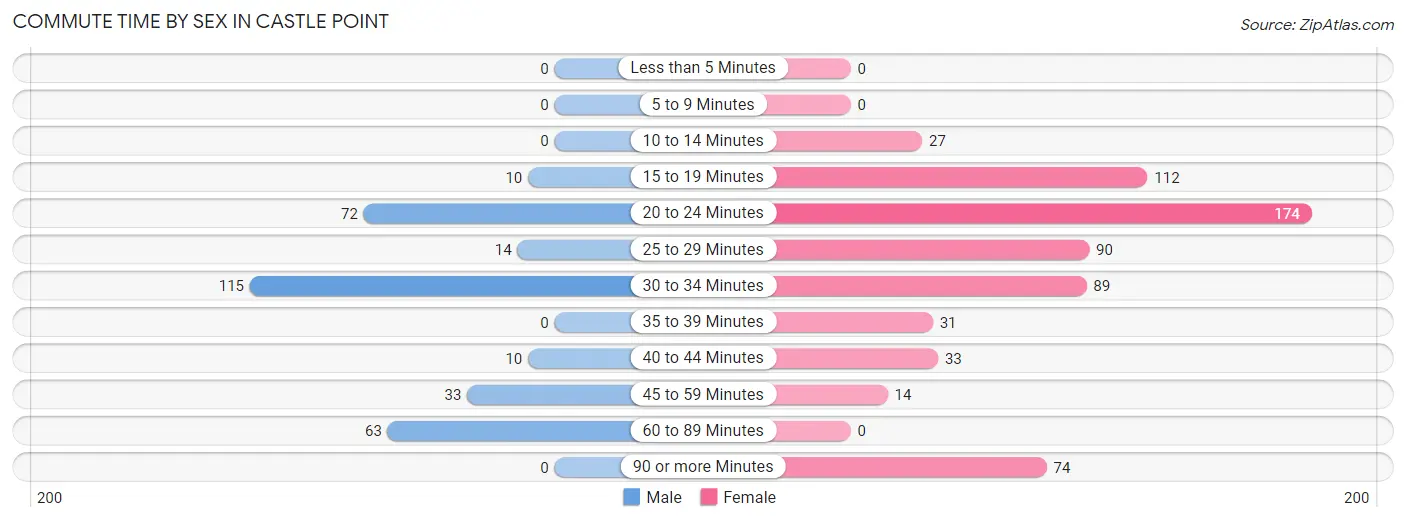
| Commute Time | Male | Female |
| Less than 5 Minutes | 0 (0.0%) | 0 (0.0%) |
| 5 to 9 Minutes | 0 (0.0%) | 0 (0.0%) |
| 10 to 14 Minutes | 0 (0.0%) | 27 (4.2%) |
| 15 to 19 Minutes | 10 (3.2%) | 112 (17.4%) |
| 20 to 24 Minutes | 72 (22.7%) | 174 (27.0%) |
| 25 to 29 Minutes | 14 (4.4%) | 90 (14.0%) |
| 30 to 34 Minutes | 115 (36.3%) | 89 (13.8%) |
| 35 to 39 Minutes | 0 (0.0%) | 31 (4.8%) |
| 40 to 44 Minutes | 10 (3.2%) | 33 (5.1%) |
| 45 to 59 Minutes | 33 (10.4%) | 14 (2.2%) |
| 60 to 89 Minutes | 63 (19.9%) | 0 (0.0%) |
| 90 or more Minutes | 0 (0.0%) | 74 (11.5%) |
Time of Departure to Work by Sex in Castle Point
The most frequent times of departure to work in Castle Point are 4:00 PM to 11:59 PM (83, 26.2%) for males and 7:30 AM to 7:59 AM (107, 16.6%) for females.
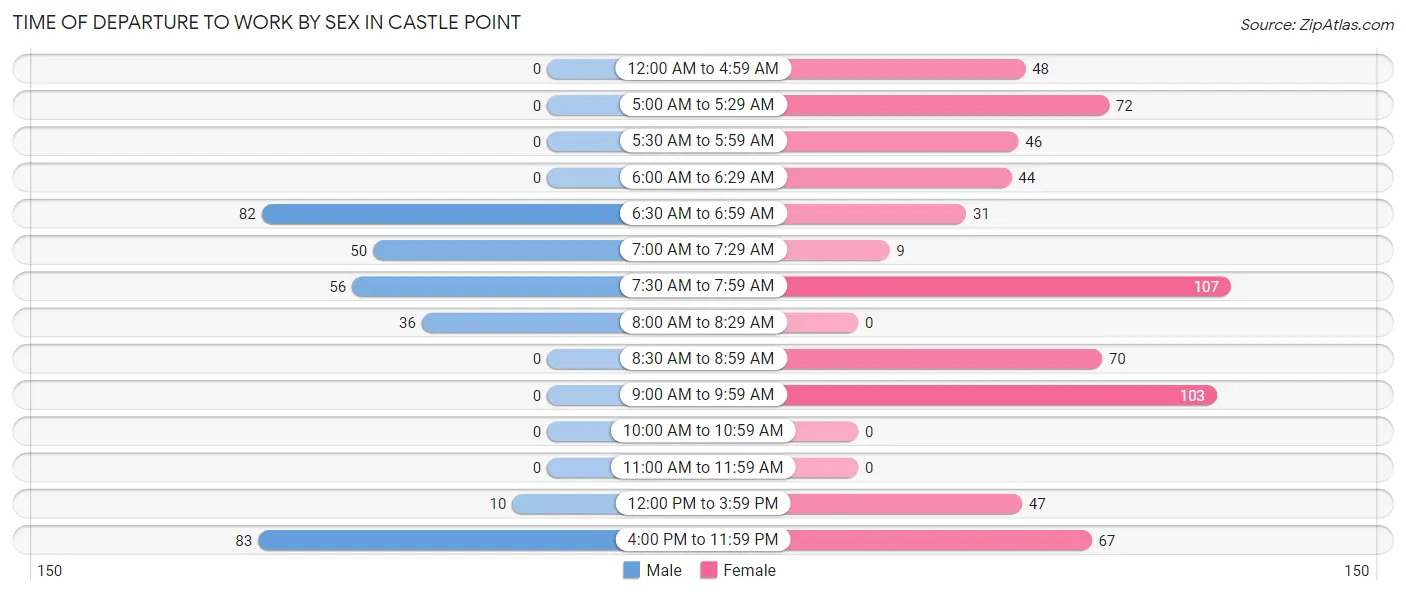
| Time of Departure | Male | Female |
| 12:00 AM to 4:59 AM | 0 (0.0%) | 48 (7.4%) |
| 5:00 AM to 5:29 AM | 0 (0.0%) | 72 (11.2%) |
| 5:30 AM to 5:59 AM | 0 (0.0%) | 46 (7.1%) |
| 6:00 AM to 6:29 AM | 0 (0.0%) | 44 (6.8%) |
| 6:30 AM to 6:59 AM | 82 (25.9%) | 31 (4.8%) |
| 7:00 AM to 7:29 AM | 50 (15.8%) | 9 (1.4%) |
| 7:30 AM to 7:59 AM | 56 (17.7%) | 107 (16.6%) |
| 8:00 AM to 8:29 AM | 36 (11.4%) | 0 (0.0%) |
| 8:30 AM to 8:59 AM | 0 (0.0%) | 70 (10.9%) |
| 9:00 AM to 9:59 AM | 0 (0.0%) | 103 (16.0%) |
| 10:00 AM to 10:59 AM | 0 (0.0%) | 0 (0.0%) |
| 11:00 AM to 11:59 AM | 0 (0.0%) | 0 (0.0%) |
| 12:00 PM to 3:59 PM | 10 (3.2%) | 47 (7.3%) |
| 4:00 PM to 11:59 PM | 83 (26.2%) | 67 (10.4%) |
| Total | 317 (100.0%) | 644 (100.0%) |
Housing Occupancy in Castle Point
Occupancy by Ownership in Castle Point
Of the total 1,064 dwellings in Castle Point, owner-occupied units account for 525 (49.3%), while renter-occupied units make up 539 (50.7%).
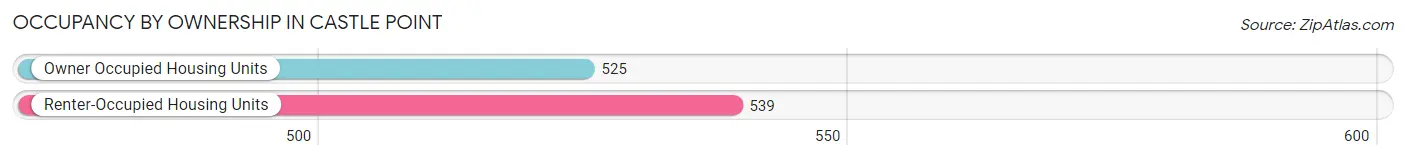
| Occupancy | # Housing Units | % Housing Units |
| Owner Occupied Housing Units | 525 | 49.3% |
| Renter-Occupied Housing Units | 539 | 50.7% |
| Total Occupied Housing Units | 1,064 | 100.0% |
Occupancy by Household Size in Castle Point
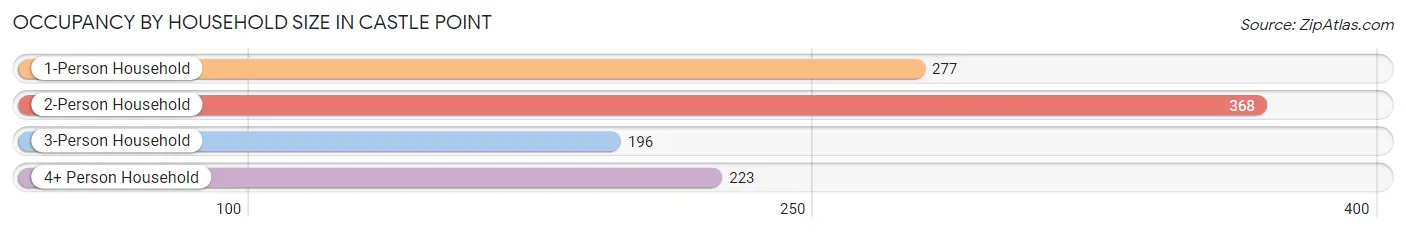
| Household Size | # Housing Units | % Housing Units |
| 1-Person Household | 277 | 26.0% |
| 2-Person Household | 368 | 34.6% |
| 3-Person Household | 196 | 18.4% |
| 4+ Person Household | 223 | 21.0% |
| Total Housing Units | 1,064 | 100.0% |
Occupancy by Ownership by Household Size in Castle Point
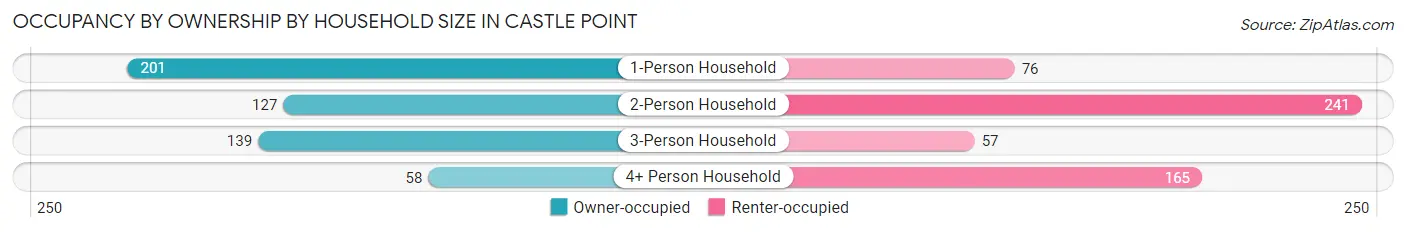
| Household Size | Owner-occupied | Renter-occupied |
| 1-Person Household | 201 (72.6%) | 76 (27.4%) |
| 2-Person Household | 127 (34.5%) | 241 (65.5%) |
| 3-Person Household | 139 (70.9%) | 57 (29.1%) |
| 4+ Person Household | 58 (26.0%) | 165 (74.0%) |
| Total Housing Units | 525 (49.3%) | 539 (50.7%) |
Occupancy by Educational Attainment in Castle Point
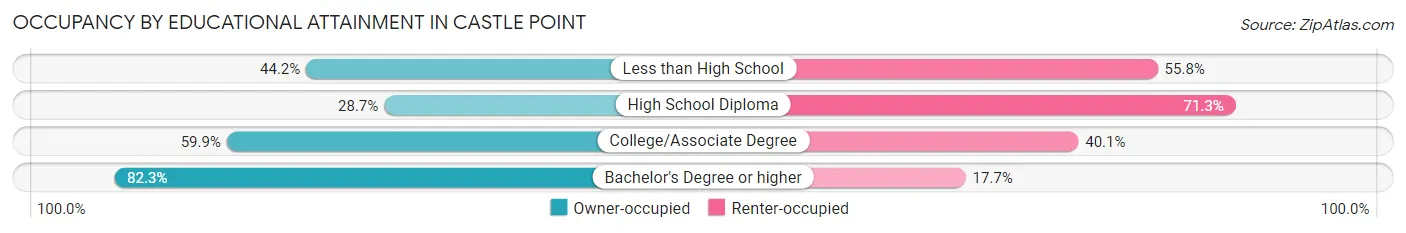
| Household Size | Owner-occupied | Renter-occupied |
| Less than High School | 38 (44.2%) | 48 (55.8%) |
| High School Diploma | 104 (28.7%) | 258 (71.3%) |
| College/Associate Degree | 332 (59.9%) | 222 (40.1%) |
| Bachelor's Degree or higher | 51 (82.3%) | 11 (17.7%) |
Occupancy by Age of Householder in Castle Point
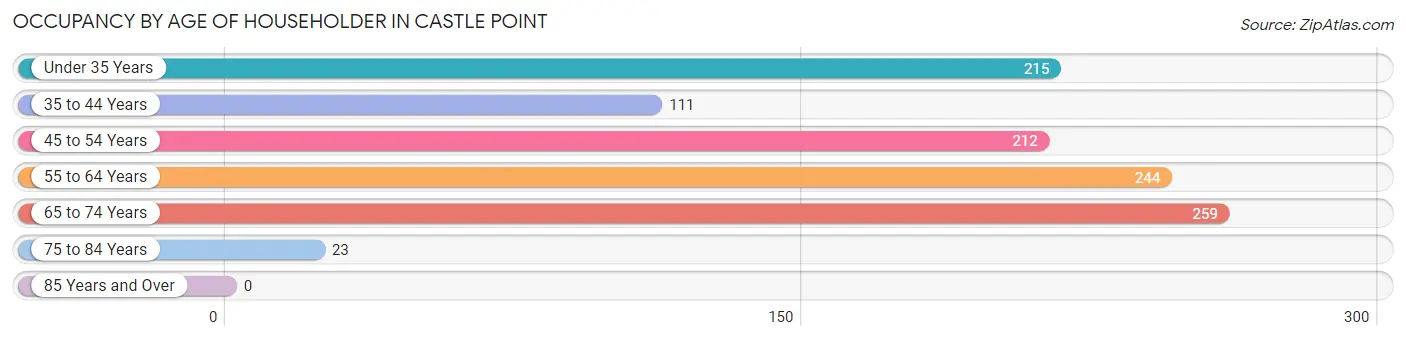
| Age Bracket | # Households | % Households |
| Under 35 Years | 215 | 20.2% |
| 35 to 44 Years | 111 | 10.4% |
| 45 to 54 Years | 212 | 19.9% |
| 55 to 64 Years | 244 | 22.9% |
| 65 to 74 Years | 259 | 24.3% |
| 75 to 84 Years | 23 | 2.2% |
| 85 Years and Over | 0 | 0.0% |
| Total | 1,064 | 100.0% |
Housing Finances in Castle Point
Median Income by Occupancy in Castle Point
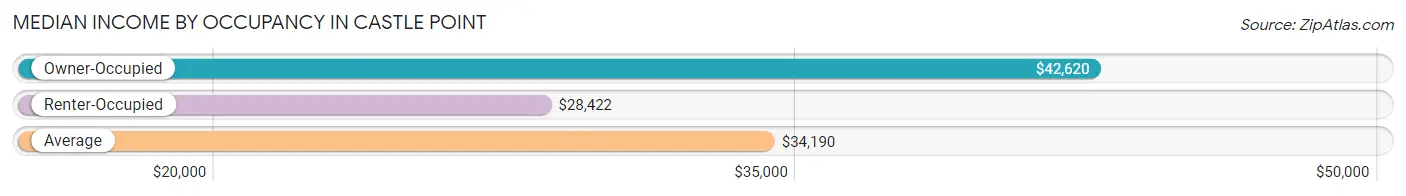
| Occupancy Type | # Households | Median Income |
| Owner-Occupied | 525 (49.3%) | $42,620 |
| Renter-Occupied | 539 (50.7%) | $28,422 |
| Average | 1,064 (100.0%) | $34,190 |
Occupancy by Householder Income Bracket in Castle Point
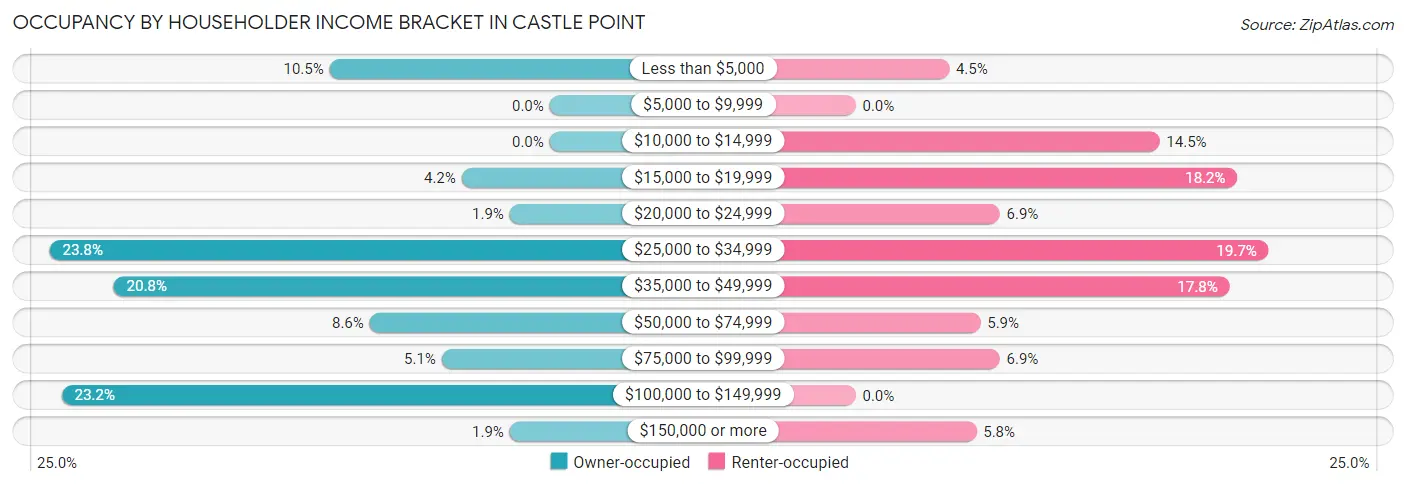
| Income Bracket | Owner-occupied | Renter-occupied |
| Less than $5,000 | 55 (10.5%) | 24 (4.4%) |
| $5,000 to $9,999 | 0 (0.0%) | 0 (0.0%) |
| $10,000 to $14,999 | 0 (0.0%) | 78 (14.5%) |
| $15,000 to $19,999 | 22 (4.2%) | 98 (18.2%) |
| $20,000 to $24,999 | 10 (1.9%) | 37 (6.9%) |
| $25,000 to $34,999 | 125 (23.8%) | 106 (19.7%) |
| $35,000 to $49,999 | 109 (20.8%) | 96 (17.8%) |
| $50,000 to $74,999 | 45 (8.6%) | 32 (5.9%) |
| $75,000 to $99,999 | 27 (5.1%) | 37 (6.9%) |
| $100,000 to $149,999 | 122 (23.2%) | 0 (0.0%) |
| $150,000 or more | 10 (1.9%) | 31 (5.8%) |
| Total | 525 (100.0%) | 539 (100.0%) |
Monthly Housing Cost Tiers in Castle Point
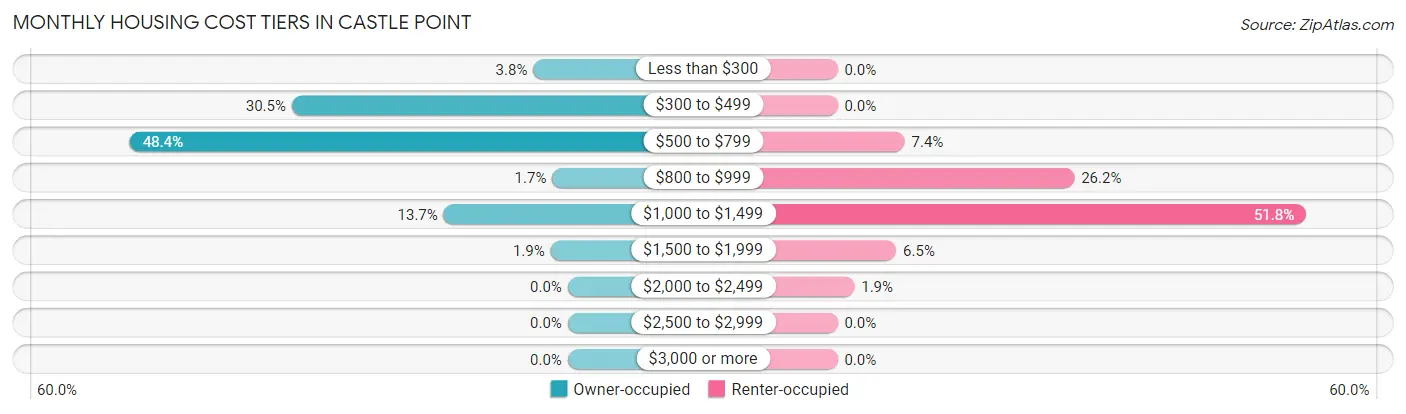
| Monthly Cost | Owner-occupied | Renter-occupied |
| Less than $300 | 20 (3.8%) | 0 (0.0%) |
| $300 to $499 | 160 (30.5%) | 0 (0.0%) |
| $500 to $799 | 254 (48.4%) | 40 (7.4%) |
| $800 to $999 | 9 (1.7%) | 141 (26.2%) |
| $1,000 to $1,499 | 72 (13.7%) | 279 (51.8%) |
| $1,500 to $1,999 | 10 (1.9%) | 35 (6.5%) |
| $2,000 to $2,499 | 0 (0.0%) | 10 (1.9%) |
| $2,500 to $2,999 | 0 (0.0%) | 0 (0.0%) |
| $3,000 or more | 0 (0.0%) | 0 (0.0%) |
| Total | 525 (100.0%) | 539 (100.0%) |
Physical Housing Characteristics in Castle Point
Housing Structures in Castle Point
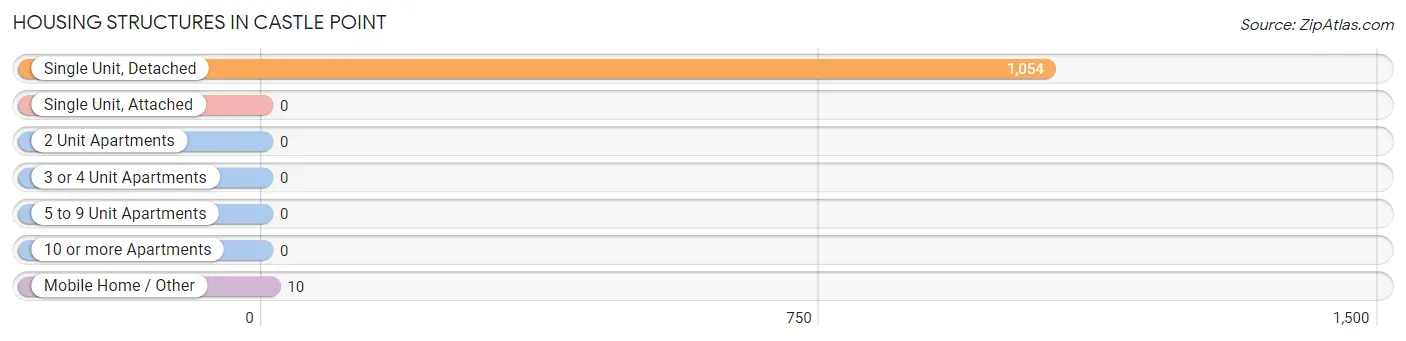
| Structure Type | # Housing Units | % Housing Units |
| Single Unit, Detached | 1,054 | 99.1% |
| Single Unit, Attached | 0 | 0.0% |
| 2 Unit Apartments | 0 | 0.0% |
| 3 or 4 Unit Apartments | 0 | 0.0% |
| 5 to 9 Unit Apartments | 0 | 0.0% |
| 10 or more Apartments | 0 | 0.0% |
| Mobile Home / Other | 10 | 0.9% |
| Total | 1,064 | 100.0% |
Housing Structures by Occupancy in Castle Point
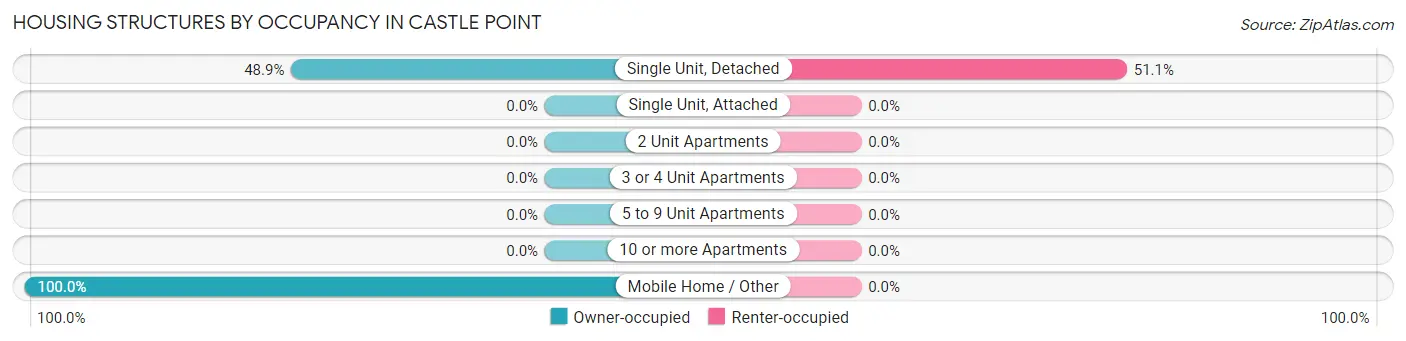
| Structure Type | Owner-occupied | Renter-occupied |
| Single Unit, Detached | 515 (48.9%) | 539 (51.1%) |
| Single Unit, Attached | 0 (0.0%) | 0 (0.0%) |
| 2 Unit Apartments | 0 (0.0%) | 0 (0.0%) |
| 3 or 4 Unit Apartments | 0 (0.0%) | 0 (0.0%) |
| 5 to 9 Unit Apartments | 0 (0.0%) | 0 (0.0%) |
| 10 or more Apartments | 0 (0.0%) | 0 (0.0%) |
| Mobile Home / Other | 10 (100.0%) | 0 (0.0%) |
| Total | 525 (49.3%) | 539 (50.7%) |
Housing Structures by Number of Rooms in Castle Point
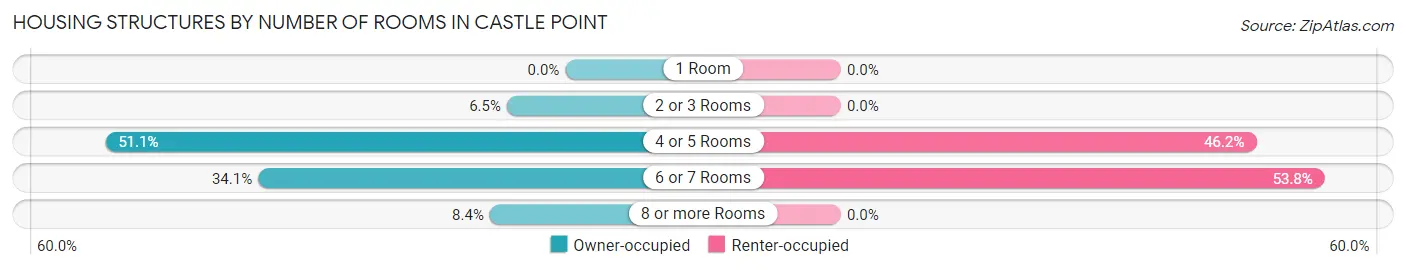
| Number of Rooms | Owner-occupied | Renter-occupied |
| 1 Room | 0 (0.0%) | 0 (0.0%) |
| 2 or 3 Rooms | 34 (6.5%) | 0 (0.0%) |
| 4 or 5 Rooms | 268 (51.0%) | 249 (46.2%) |
| 6 or 7 Rooms | 179 (34.1%) | 290 (53.8%) |
| 8 or more Rooms | 44 (8.4%) | 0 (0.0%) |
| Total | 525 (100.0%) | 539 (100.0%) |
Housing Structure by Heating Type in Castle Point
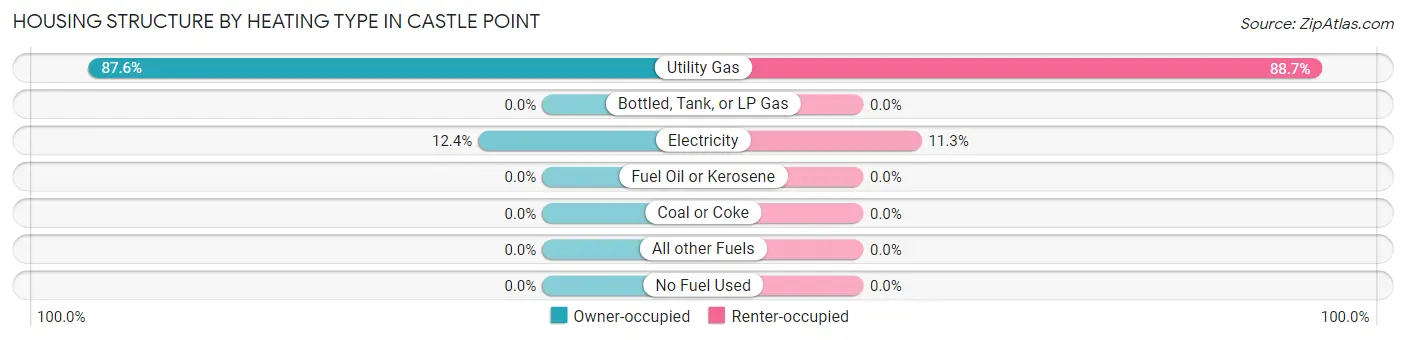
| Heating Type | Owner-occupied | Renter-occupied |
| Utility Gas | 460 (87.6%) | 478 (88.7%) |
| Bottled, Tank, or LP Gas | 0 (0.0%) | 0 (0.0%) |
| Electricity | 65 (12.4%) | 61 (11.3%) |
| Fuel Oil or Kerosene | 0 (0.0%) | 0 (0.0%) |
| Coal or Coke | 0 (0.0%) | 0 (0.0%) |
| All other Fuels | 0 (0.0%) | 0 (0.0%) |
| No Fuel Used | 0 (0.0%) | 0 (0.0%) |
| Total | 525 (100.0%) | 539 (100.0%) |
Household Vehicle Usage in Castle Point
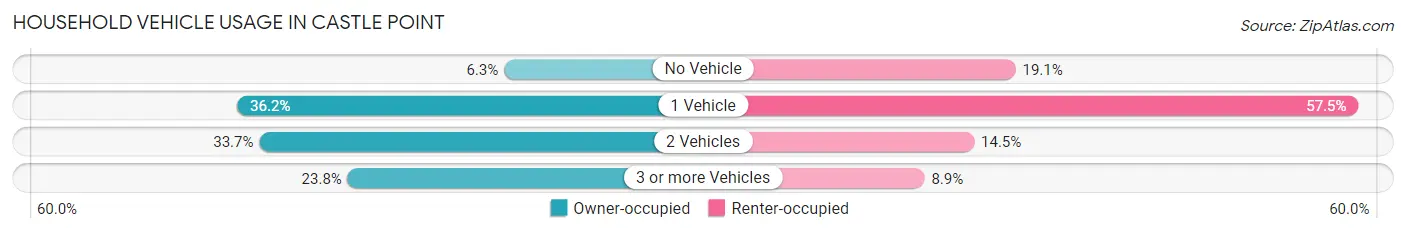
| Vehicles per Household | Owner-occupied | Renter-occupied |
| No Vehicle | 33 (6.3%) | 103 (19.1%) |
| 1 Vehicle | 190 (36.2%) | 310 (57.5%) |
| 2 Vehicles | 177 (33.7%) | 78 (14.5%) |
| 3 or more Vehicles | 125 (23.8%) | 48 (8.9%) |
| Total | 525 (100.0%) | 539 (100.0%) |
Real Estate & Mortgages in Castle Point
Real Estate and Mortgage Overview in Castle Point
| Characteristic | Without Mortgage | With Mortgage |
| Housing Units | 294 | 231 |
| Median Property Value | $57,600 | $48,800 |
| Median Household Income | - | - |
| Monthly Housing Costs | $400 | $0 |
| Real Estate Taxes | $1,420 | $9 |
Property Value by Mortgage Status in Castle Point
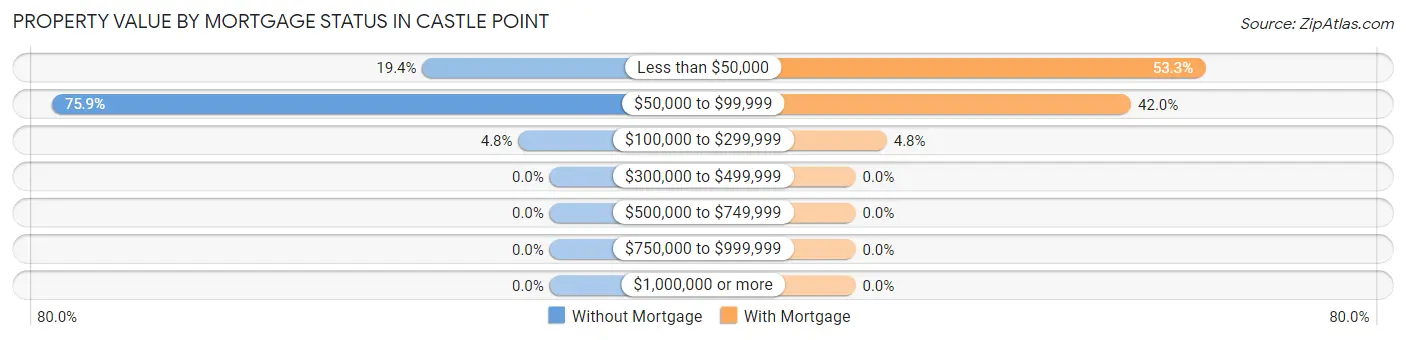
| Property Value | Without Mortgage | With Mortgage |
| Less than $50,000 | 57 (19.4%) | 123 (53.2%) |
| $50,000 to $99,999 | 223 (75.8%) | 97 (42.0%) |
| $100,000 to $299,999 | 14 (4.8%) | 11 (4.8%) |
| $300,000 to $499,999 | 0 (0.0%) | 0 (0.0%) |
| $500,000 to $749,999 | 0 (0.0%) | 0 (0.0%) |
| $750,000 to $999,999 | 0 (0.0%) | 0 (0.0%) |
| $1,000,000 or more | 0 (0.0%) | 0 (0.0%) |
| Total | 294 (100.0%) | 231 (100.0%) |
Household Income by Mortgage Status in Castle Point
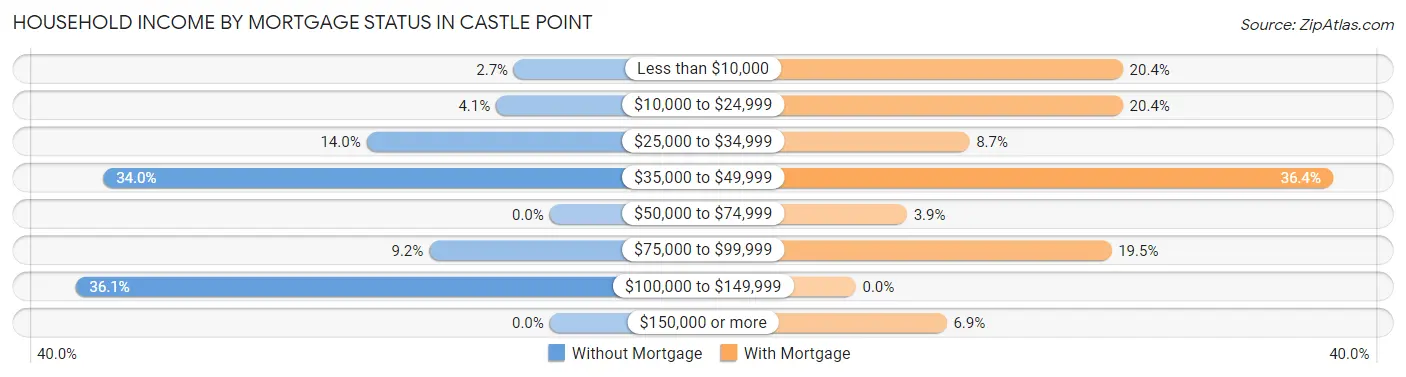
| Household Income | Without Mortgage | With Mortgage |
| Less than $10,000 | 8 (2.7%) | 47 (20.3%) |
| $10,000 to $24,999 | 12 (4.1%) | 47 (20.3%) |
| $25,000 to $34,999 | 41 (14.0%) | 20 (8.7%) |
| $35,000 to $49,999 | 100 (34.0%) | 84 (36.4%) |
| $50,000 to $74,999 | 0 (0.0%) | 9 (3.9%) |
| $75,000 to $99,999 | 27 (9.2%) | 45 (19.5%) |
| $100,000 to $149,999 | 106 (36.0%) | 0 (0.0%) |
| $150,000 or more | 0 (0.0%) | 16 (6.9%) |
| Total | 294 (100.0%) | 231 (100.0%) |
Property Value to Household Income Ratio in Castle Point
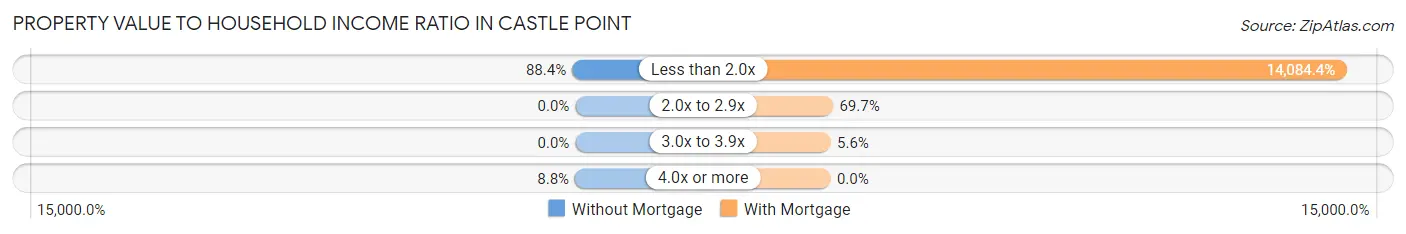
| Value-to-Income Ratio | Without Mortgage | With Mortgage |
| Less than 2.0x | 260 (88.4%) | 32,535 (14,084.4%) |
| 2.0x to 2.9x | 0 (0.0%) | 161 (69.7%) |
| 3.0x to 3.9x | 0 (0.0%) | 13 (5.6%) |
| 4.0x or more | 26 (8.8%) | 0 (0.0%) |
| Total | 294 (100.0%) | 231 (100.0%) |
Real Estate Taxes by Mortgage Status in Castle Point
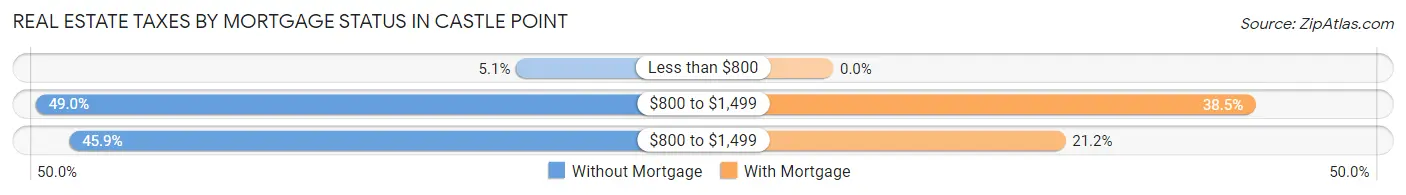
| Property Taxes | Without Mortgage | With Mortgage |
| Less than $800 | 15 (5.1%) | 0 (0.0%) |
| $800 to $1,499 | 144 (49.0%) | 89 (38.5%) |
| $800 to $1,499 | 135 (45.9%) | 49 (21.2%) |
| Total | 294 (100.0%) | 231 (100.0%) |
Health & Disability in Castle Point
Health Insurance Coverage by Age in Castle Point
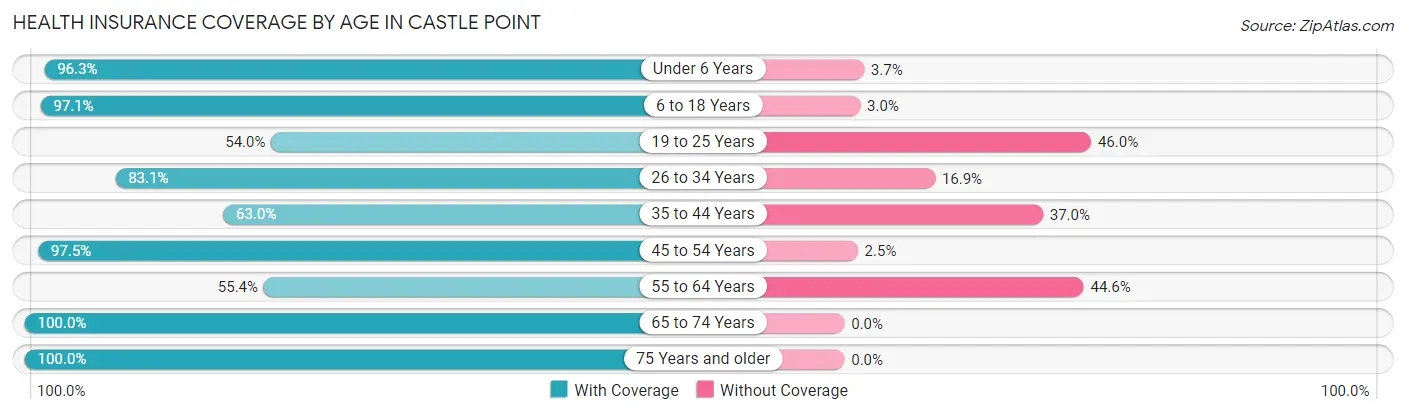
| Age Bracket | With Coverage | Without Coverage |
| Under 6 Years | 263 (96.3%) | 10 (3.7%) |
| 6 to 18 Years | 757 (97.1%) | 23 (2.9%) |
| 19 to 25 Years | 162 (54.0%) | 138 (46.0%) |
| 26 to 34 Years | 118 (83.1%) | 24 (16.9%) |
| 35 to 44 Years | 131 (63.0%) | 77 (37.0%) |
| 45 to 54 Years | 431 (97.5%) | 11 (2.5%) |
| 55 to 64 Years | 216 (55.4%) | 174 (44.6%) |
| 65 to 74 Years | 372 (100.0%) | 0 (0.0%) |
| 75 Years and older | 33 (100.0%) | 0 (0.0%) |
| Total | 2,483 (84.5%) | 457 (15.5%) |
Health Insurance Coverage by Citizenship Status in Castle Point
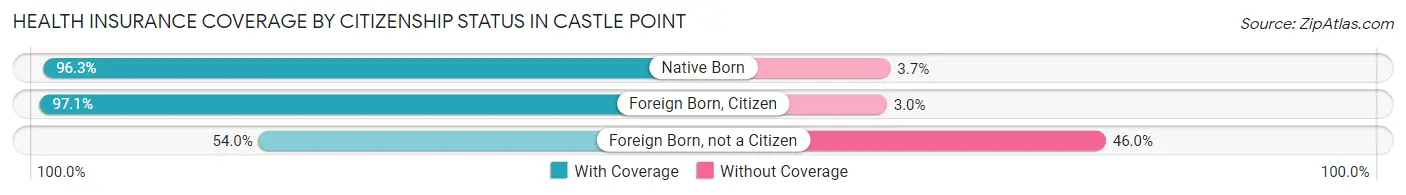
| Citizenship Status | With Coverage | Without Coverage |
| Native Born | 263 (96.3%) | 10 (3.7%) |
| Foreign Born, Citizen | 757 (97.1%) | 23 (2.9%) |
| Foreign Born, not a Citizen | 162 (54.0%) | 138 (46.0%) |
Health Insurance Coverage by Household Income in Castle Point
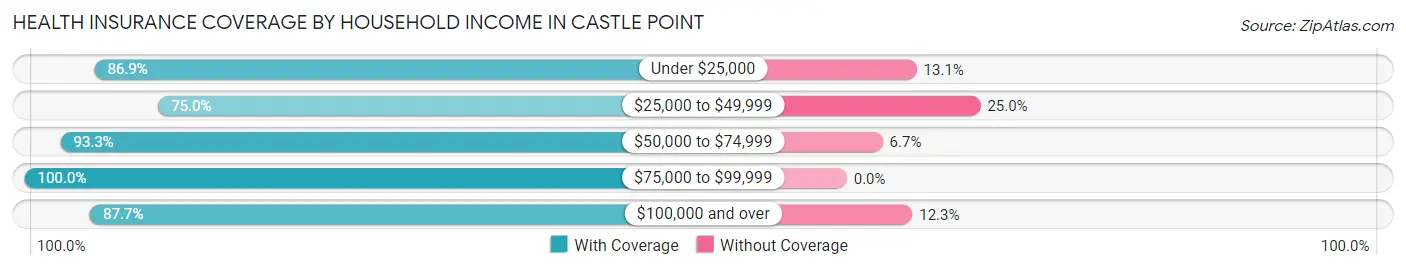
| Household Income | With Coverage | Without Coverage |
| Under $25,000 | 684 (86.9%) | 103 (13.1%) |
| $25,000 to $49,999 | 844 (75.0%) | 282 (25.0%) |
| $50,000 to $74,999 | 347 (93.3%) | 25 (6.7%) |
| $75,000 to $99,999 | 272 (100.0%) | 0 (0.0%) |
| $100,000 and over | 336 (87.7%) | 47 (12.3%) |
Public vs Private Health Insurance Coverage by Age in Castle Point
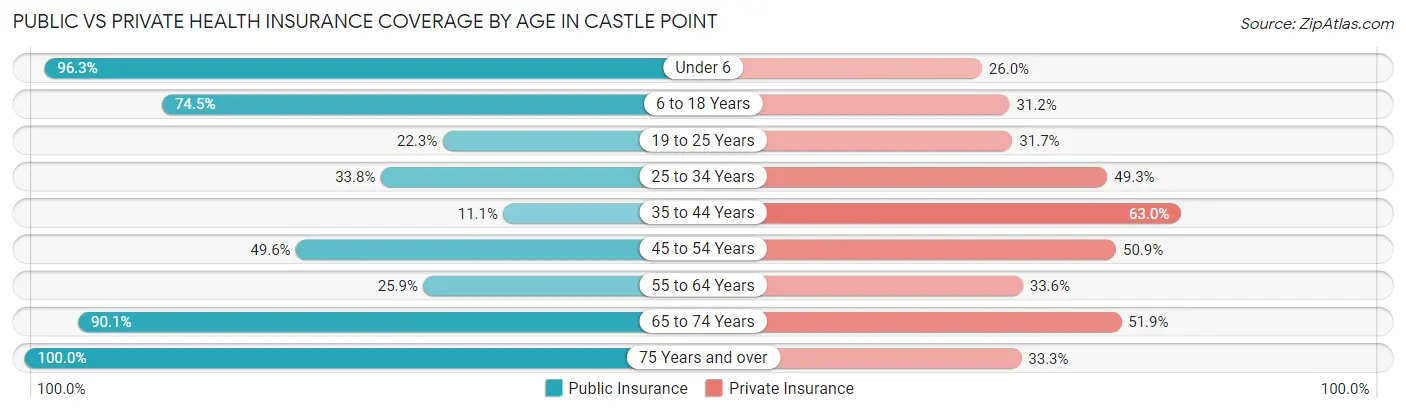
| Age Bracket | Public Insurance | Private Insurance |
| Under 6 | 263 (96.3%) | 71 (26.0%) |
| 6 to 18 Years | 581 (74.5%) | 243 (31.1%) |
| 19 to 25 Years | 67 (22.3%) | 95 (31.7%) |
| 25 to 34 Years | 48 (33.8%) | 70 (49.3%) |
| 35 to 44 Years | 23 (11.1%) | 131 (63.0%) |
| 45 to 54 Years | 219 (49.5%) | 225 (50.9%) |
| 55 to 64 Years | 101 (25.9%) | 131 (33.6%) |
| 65 to 74 Years | 335 (90.0%) | 193 (51.9%) |
| 75 Years and over | 33 (100.0%) | 11 (33.3%) |
| Total | 1,670 (56.8%) | 1,170 (39.8%) |
Disability Status by Sex by Age in Castle Point
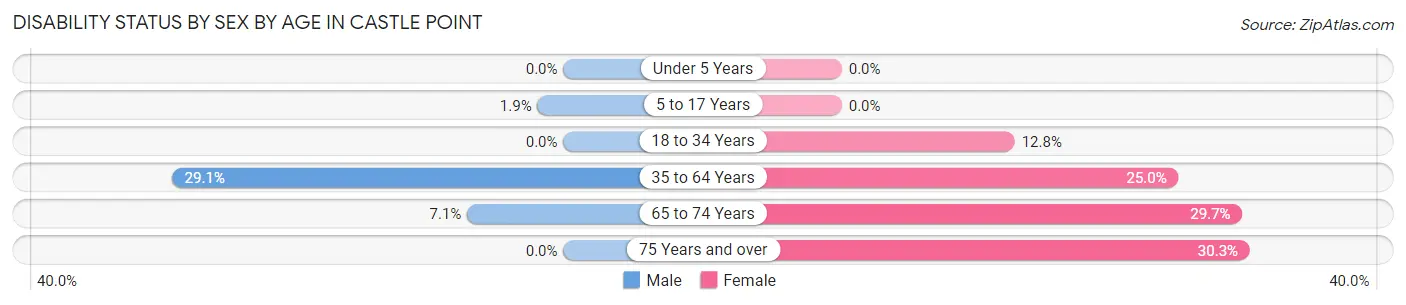
| Age Bracket | Male | Female |
| Under 5 Years | 0 (0.0%) | 0 (0.0%) |
| 5 to 17 Years | 8 (1.9%) | 0 (0.0%) |
| 18 to 34 Years | 0 (0.0%) | 47 (12.8%) |
| 35 to 64 Years | 114 (29.1%) | 162 (25.0%) |
| 65 to 74 Years | 10 (7.1%) | 69 (29.7%) |
| 75 Years and over | 0 (0.0%) | 10 (30.3%) |
Disability Class by Sex by Age in Castle Point
Disability Class: Hearing Difficulty
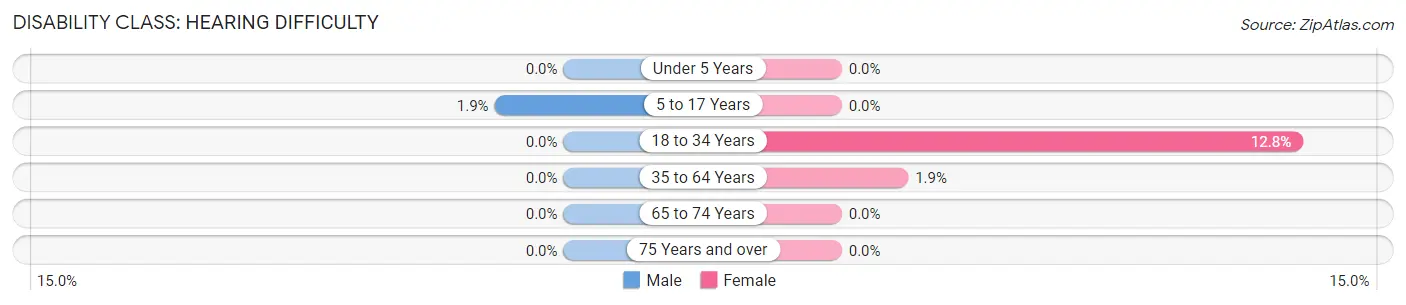
| Age Bracket | Male | Female |
| Under 5 Years | 0 (0.0%) | 0 (0.0%) |
| 5 to 17 Years | 8 (1.9%) | 0 (0.0%) |
| 18 to 34 Years | 0 (0.0%) | 47 (12.8%) |
| 35 to 64 Years | 0 (0.0%) | 12 (1.8%) |
| 65 to 74 Years | 0 (0.0%) | 0 (0.0%) |
| 75 Years and over | 0 (0.0%) | 0 (0.0%) |
Disability Class: Vision Difficulty
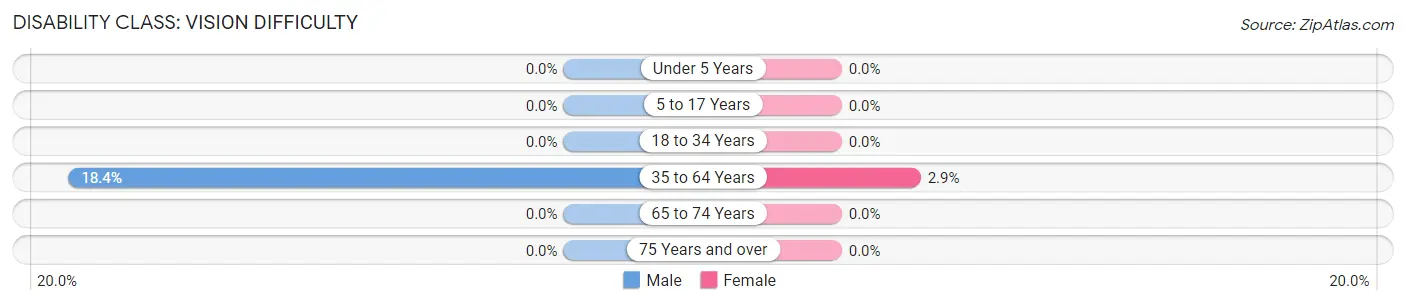
| Age Bracket | Male | Female |
| Under 5 Years | 0 (0.0%) | 0 (0.0%) |
| 5 to 17 Years | 0 (0.0%) | 0 (0.0%) |
| 18 to 34 Years | 0 (0.0%) | 0 (0.0%) |
| 35 to 64 Years | 72 (18.4%) | 19 (2.9%) |
| 65 to 74 Years | 0 (0.0%) | 0 (0.0%) |
| 75 Years and over | 0 (0.0%) | 0 (0.0%) |
Disability Class: Cognitive Difficulty
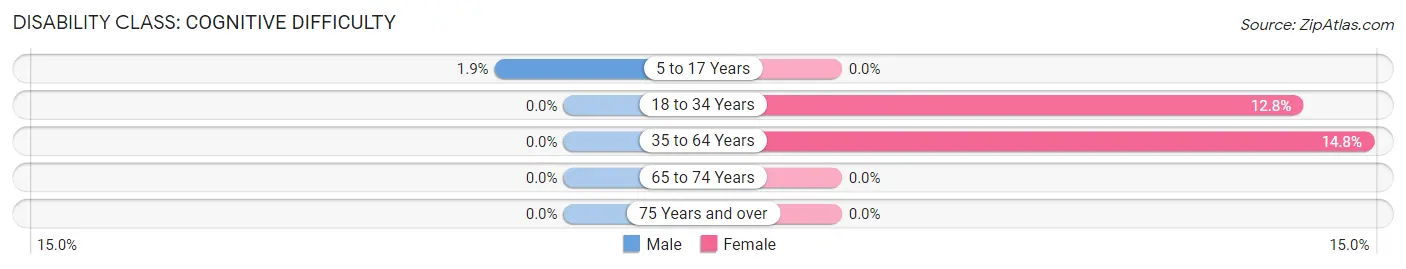
| Age Bracket | Male | Female |
| 5 to 17 Years | 8 (1.9%) | 0 (0.0%) |
| 18 to 34 Years | 0 (0.0%) | 47 (12.8%) |
| 35 to 64 Years | 0 (0.0%) | 96 (14.8%) |
| 65 to 74 Years | 0 (0.0%) | 0 (0.0%) |
| 75 Years and over | 0 (0.0%) | 0 (0.0%) |
Disability Class: Ambulatory Difficulty
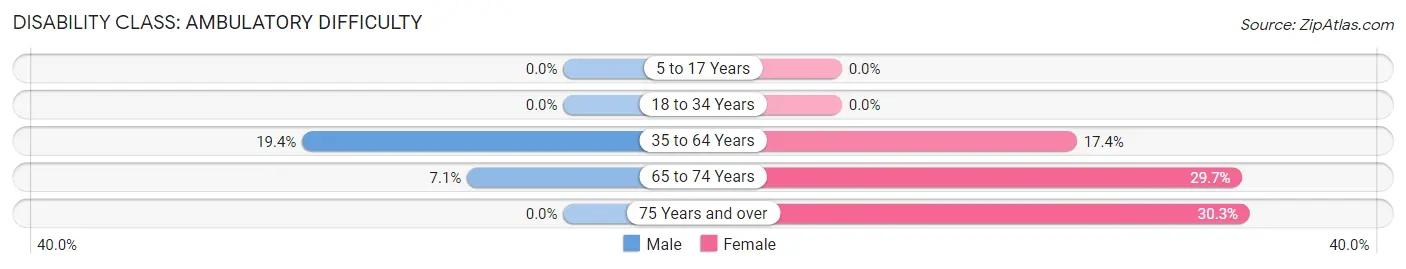
| Age Bracket | Male | Female |
| 5 to 17 Years | 0 (0.0%) | 0 (0.0%) |
| 18 to 34 Years | 0 (0.0%) | 0 (0.0%) |
| 35 to 64 Years | 76 (19.4%) | 113 (17.4%) |
| 65 to 74 Years | 10 (7.1%) | 69 (29.7%) |
| 75 Years and over | 0 (0.0%) | 10 (30.3%) |
Disability Class: Self-Care Difficulty
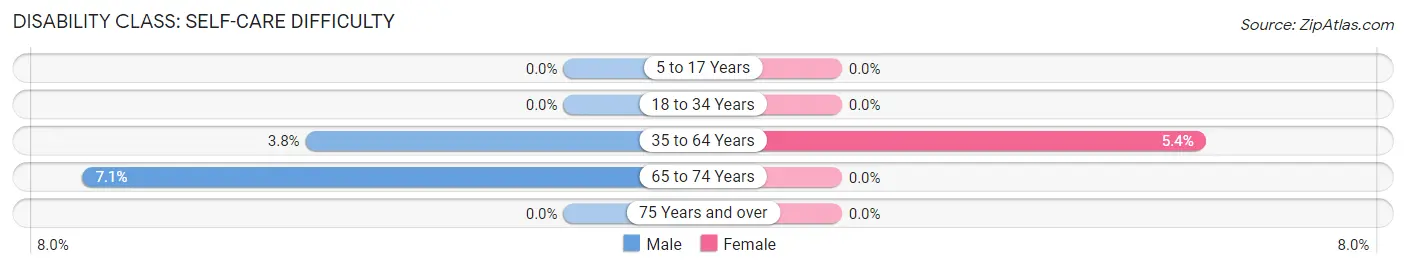
| Age Bracket | Male | Female |
| 5 to 17 Years | 0 (0.0%) | 0 (0.0%) |
| 18 to 34 Years | 0 (0.0%) | 0 (0.0%) |
| 35 to 64 Years | 15 (3.8%) | 35 (5.4%) |
| 65 to 74 Years | 10 (7.1%) | 0 (0.0%) |
| 75 Years and over | 0 (0.0%) | 0 (0.0%) |
Technology Access in Castle Point
Computing Device Access in Castle Point
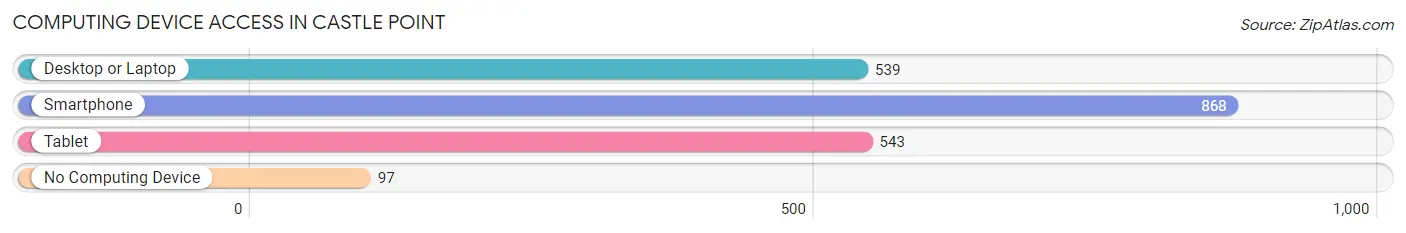
| Device Type | # Households | % Households |
| Desktop or Laptop | 539 | 50.7% |
| Smartphone | 868 | 81.6% |
| Tablet | 543 | 51.0% |
| No Computing Device | 97 | 9.1% |
| Total | 1,064 | 100.0% |
Internet Access in Castle Point
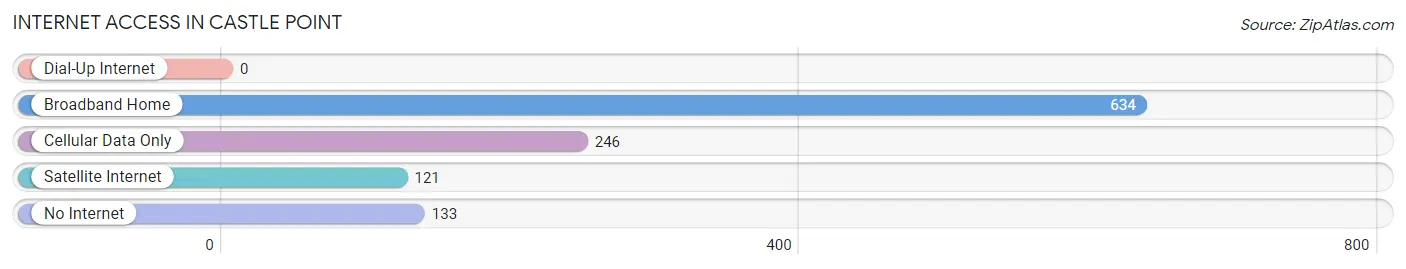
| Internet Type | # Households | % Households |
| Dial-Up Internet | 0 | 0.0% |
| Broadband Home | 634 | 59.6% |
| Cellular Data Only | 246 | 23.1% |
| Satellite Internet | 121 | 11.4% |
| No Internet | 133 | 12.5% |
| Total | 1,064 | 100.0% |
Castle Point Summary
Castle Point is a small unincorporated community located in St. Charles County, Missouri. It is situated on the banks of the Missouri River, just south of St. Charles and about 25 miles northwest of St. Louis. The community is named after the nearby Castle Point, a limestone bluff that overlooks the river.
History
The area around Castle Point has been inhabited for thousands of years. Native American tribes, including the Osage, Missouri, and Sioux, lived in the area before European settlers arrived. The first European settlers arrived in the area in the early 1800s. The area was originally part of the Spanish land grant of 1803, and the first settlers were mostly French-Canadian fur traders.
In 1818, the area was acquired by the United States as part of the Louisiana Purchase. The area was then part of the Missouri Territory, and in 1821 it became part of the newly formed state of Missouri.
In 1837, the area was surveyed and platted as the town of Castle Point. The town was named after the nearby limestone bluff, which was known as Castle Point. The town was incorporated in 1839, and the first post office was established in 1841.
The town grew slowly, and by the late 1800s it had a population of about 500 people. The town was primarily an agricultural community, and the main crops were corn, wheat, and hay.
Geography
Castle Point is located in St. Charles County, Missouri, on the banks of the Missouri River. The town is situated about 25 miles northwest of St. Louis and about 10 miles south of St. Charles.
The town is located on a limestone bluff known as Castle Point. The bluff overlooks the Missouri River and is about 200 feet high. The town is surrounded by rolling hills and farmland.
Economy
The economy of Castle Point is primarily based on agriculture. The main crops are corn, wheat, and hay. The town also has a few small businesses, including a grocery store, a hardware store, and a few restaurants.
Demographics
As of the 2010 census, the population of Castle Point was 1,093. The racial makeup of the town was 97.3% White, 0.7% African American, 0.3% Native American, 0.2% Asian, 0.1% Pacific Islander, 0.3% from other races, and 1.2% from two or more races. Hispanic or Latino of any race were 1.2% of the population.
The median household income in Castle Point was $50,000, and the median family income was $54,000. The per capita income was $20,000. About 8.3% of families and 10.2% of the population were below the poverty line, including 14.3% of those under age 18 and 6.2% of those age 65 or over.
Common Questions
What is Per Capita Income in Castle Point?
Per Capita income in Castle Point is $18,955.
What is the Median Family Income in Castle Point?
Median Family Income in Castle Point is $34,513.
What is the Median Household income in Castle Point?
Median Household Income in Castle Point is $34,190.
What is Income or Wage Gap in Castle Point?
Income or Wage Gap in Castle Point is 5.5%.
Women in Castle Point earn 94.5 cents for every dollar earned by a man.
What is Inequality or Gini Index in Castle Point?
Inequality or Gini Index in Castle Point is 0.46.
What is the Total Population of Castle Point?
Total Population of Castle Point is 2,940.
What is the Total Male Population of Castle Point?
Total Male Population of Castle Point is 1,159.
What is the Total Female Population of Castle Point?
Total Female Population of Castle Point is 1,781.
What is the Ratio of Males per 100 Females in Castle Point?
There are 65.08 Males per 100 Females in Castle Point.
What is the Ratio of Females per 100 Males in Castle Point?
There are 153.67 Females per 100 Males in Castle Point.
What is the Median Population Age in Castle Point?
Median Population Age in Castle Point is 30.9 Years.
What is the Average Family Size in Castle Point
Average Family Size in Castle Point is 3.4 People.
What is the Average Household Size in Castle Point
Average Household Size in Castle Point is 2.8 People.
How Large is the Labor Force in Castle Point?
There are 1,222 People in the Labor Forcein in Castle Point.
What is the Percentage of People in the Labor Force in Castle Point?
61.7% of People are in the Labor Force in Castle Point.
What is the Unemployment Rate in Castle Point?
Unemployment Rate in Castle Point is 6.5%.