Camdenton, MO Map & Demographics
Camdenton Map
Camdenton Overview
$24,186
PER CAPITA INCOME
$56,250
AVG FAMILY INCOME
$45,833
AVG HOUSEHOLD INCOME
41.9%
WAGE / INCOME GAP [ % ]
58.1¢/ $1
WAGE / INCOME GAP [ $ ]
0.45
INEQUALITY / GINI INDEX
3,979
TOTAL POPULATION
1,966
MALE POPULATION
2,013
FEMALE POPULATION
97.67
MALES / 100 FEMALES
102.39
FEMALES / 100 MALES
32.8
MEDIAN AGE
4.1
AVG FAMILY SIZE
3.3
AVG HOUSEHOLD SIZE
1,916
LABOR FORCE [ PEOPLE ]
63.1%
PERCENT IN LABOR FORCE
1.5%
UNEMPLOYMENT RATE
Camdenton Zip Codes
Camdenton Area Codes
Income in Camdenton
Income Overview in Camdenton
Per Capita Income in Camdenton is $24,186, while median incomes of families and households are $56,250 and $45,833 respectively.
| Characteristic | Number | Measure |
| Per Capita Income | 3,979 | $24,186 |
| Median Family Income | 751 | $56,250 |
| Mean Family Income | 751 | $75,077 |
| Median Household Income | 1,176 | $45,833 |
| Mean Household Income | 1,176 | $63,416 |
| Income Deficit | 751 | $0 |
| Wage / Income Gap (%) | 3,979 | 41.92% |
| Wage / Income Gap ($) | 3,979 | 58.08¢ per $1 |
| Gini / Inequality Index | 3,979 | 0.45 |
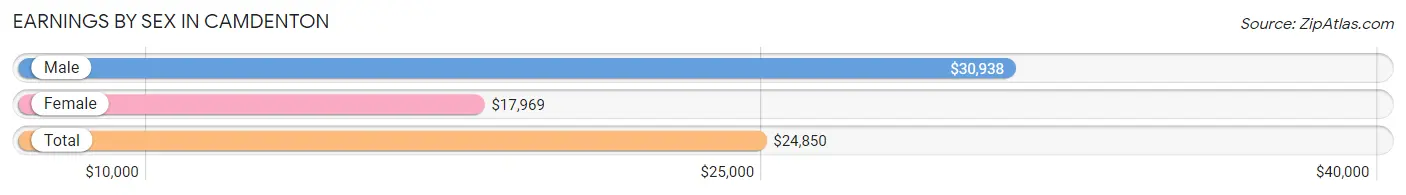
Earnings by Sex in Camdenton
Average Earnings in Camdenton are $24,850, $30,938 for men and $17,969 for women, a difference of 41.9%.
| Sex | Number | Average Earnings |
| Male | 970 (46.2%) | $30,938 |
| Female | 1,132 (53.8%) | $17,969 |
| Total | 2,102 (100.0%) | $24,850 |
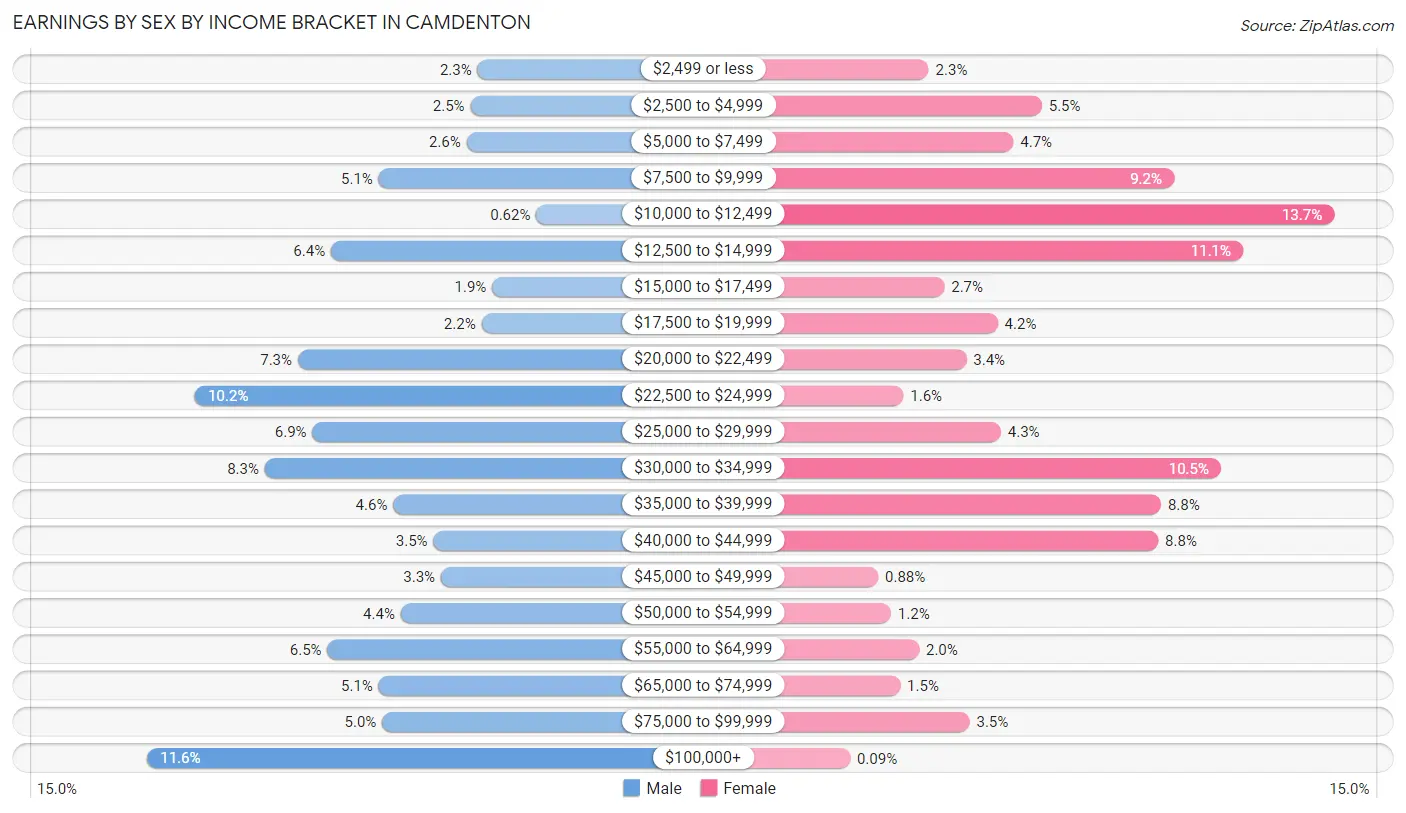
Earnings by Sex by Income Bracket in Camdenton
The most common earnings brackets in Camdenton are $100,000+ for men (112 | 11.6%) and $10,000 to $12,499 for women (155 | 13.7%).
| Income | Male | Female |
| $2,499 or less | 22 (2.3%) | 26 (2.3%) |
| $2,500 to $4,999 | 24 (2.5%) | 62 (5.5%) |
| $5,000 to $7,499 | 25 (2.6%) | 53 (4.7%) |
| $7,500 to $9,999 | 49 (5.1%) | 104 (9.2%) |
| $10,000 to $12,499 | 6 (0.6%) | 155 (13.7%) |
| $12,500 to $14,999 | 62 (6.4%) | 126 (11.1%) |
| $15,000 to $17,499 | 18 (1.9%) | 31 (2.7%) |
| $17,500 to $19,999 | 21 (2.2%) | 48 (4.2%) |
| $20,000 to $22,499 | 71 (7.3%) | 38 (3.4%) |
| $22,500 to $24,999 | 99 (10.2%) | 18 (1.6%) |
| $25,000 to $29,999 | 67 (6.9%) | 49 (4.3%) |
| $30,000 to $34,999 | 80 (8.3%) | 119 (10.5%) |
| $35,000 to $39,999 | 45 (4.6%) | 100 (8.8%) |
| $40,000 to $44,999 | 34 (3.5%) | 99 (8.7%) |
| $45,000 to $49,999 | 32 (3.3%) | 10 (0.9%) |
| $50,000 to $54,999 | 43 (4.4%) | 14 (1.2%) |
| $55,000 to $64,999 | 63 (6.5%) | 23 (2.0%) |
| $65,000 to $74,999 | 49 (5.1%) | 17 (1.5%) |
| $75,000 to $99,999 | 48 (5.0%) | 39 (3.5%) |
| $100,000+ | 112 (11.6%) | 1 (0.1%) |
| Total | 970 (100.0%) | 1,132 (100.0%) |
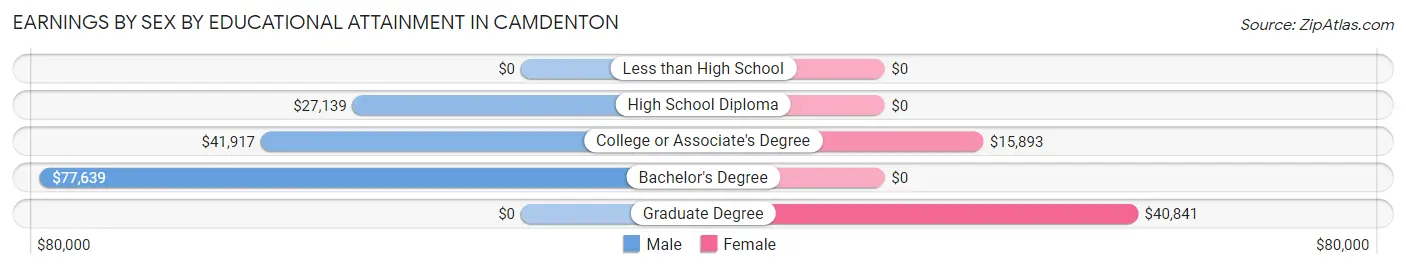
Earnings by Sex by Educational Attainment in Camdenton
Average earnings in Camdenton are $38,398 for men and $20,000 for women, a difference of 47.9%. Men with an educational attainment of bachelor's degree enjoy the highest average annual earnings of $77,639, while those with high school diploma education earn the least with $27,139. Women with an educational attainment of graduate degree earn the most with the average annual earnings of $40,841, while those with college or associate's degree education have the smallest earnings of $15,893.
| Educational Attainment | Male Income | Female Income |
| Less than High School | - | - |
| High School Diploma | $27,139 | $0 |
| College or Associate's Degree | $41,917 | $15,893 |
| Bachelor's Degree | $77,639 | $0 |
| Graduate Degree | - | - |
| Total | $38,398 | $20,000 |
Family Income in Camdenton
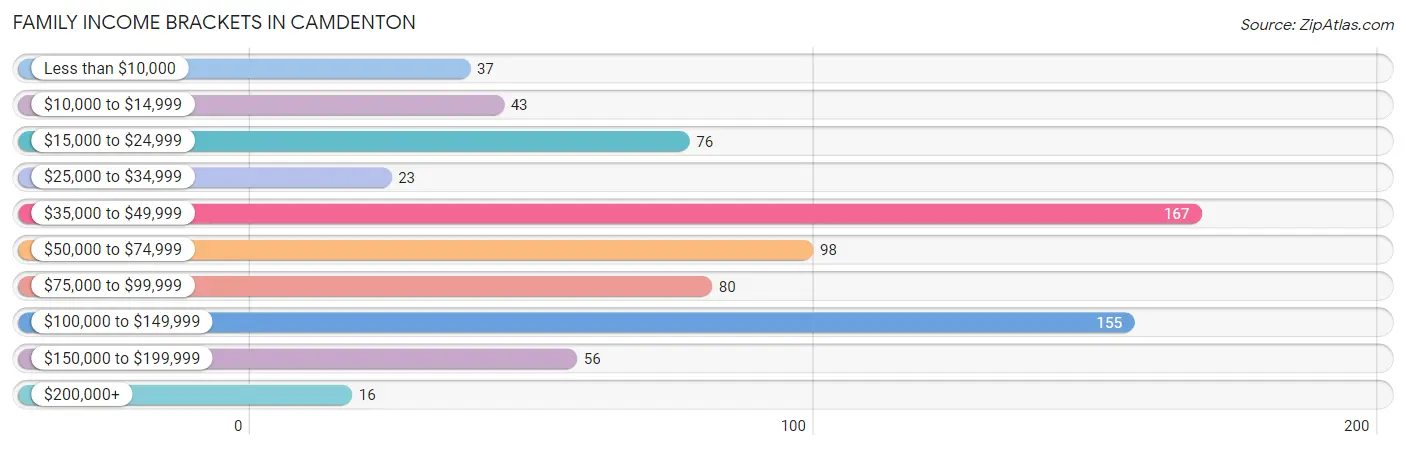
Family Income Brackets in Camdenton
According to the Camdenton family income data, there are 167 families falling into the $35,000 to $49,999 income range, which is the most common income bracket and makes up 22.2% of all families. Conversely, the $200,000+ income bracket is the least frequent group with only 16 families (2.1%) belonging to this category.
| Income Bracket | # Families | % Families |
| Less than $10,000 | 37 | 4.9% |
| $10,000 to $14,999 | 43 | 5.7% |
| $15,000 to $24,999 | 76 | 10.1% |
| $25,000 to $34,999 | 23 | 3.1% |
| $35,000 to $49,999 | 167 | 22.2% |
| $50,000 to $74,999 | 98 | 13.0% |
| $75,000 to $99,999 | 80 | 10.7% |
| $100,000 to $149,999 | 155 | 20.6% |
| $150,000 to $199,999 | 56 | 7.5% |
| $200,000+ | 16 | 2.1% |
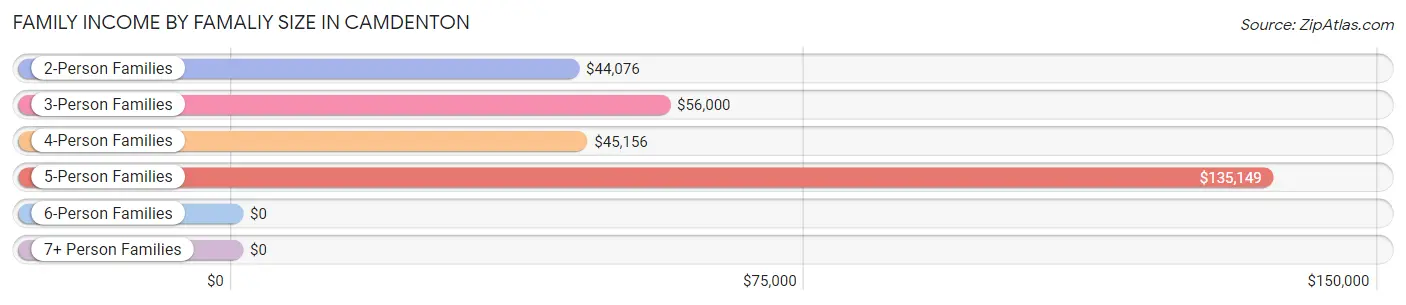
Family Income by Famaliy Size in Camdenton
5-person families (146 | 19.4%) account for the highest median family income in Camdenton with $135,149 per family, while 5-person families (146 | 19.4%) have the highest median income of $27,030 per family member.
| Income Bracket | # Families | Median Income |
| 2-Person Families | 315 (41.9%) | $44,076 |
| 3-Person Families | 176 (23.4%) | $56,000 |
| 4-Person Families | 79 (10.5%) | $45,156 |
| 5-Person Families | 146 (19.4%) | $135,149 |
| 6-Person Families | 32 (4.3%) | $0 |
| 7+ Person Families | 3 (0.4%) | $0 |
| Total | 751 (100.0%) | $56,250 |
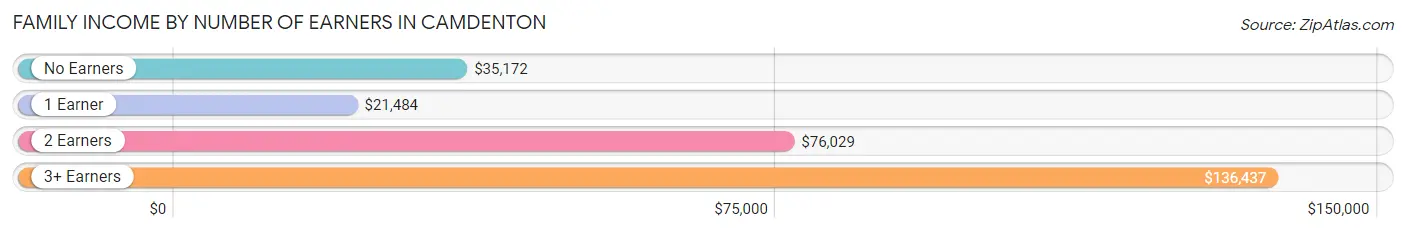
Family Income by Number of Earners in Camdenton
The median family income in Camdenton is $56,250, with families comprising 3+ earners (149) having the highest median family income of $136,437, while families with 1 earner (166) have the lowest median family income of $21,484, accounting for 19.8% and 22.1% of families, respectively.
| Number of Earners | # Families | Median Income |
| No Earners | 120 (16.0%) | $35,172 |
| 1 Earner | 166 (22.1%) | $21,484 |
| 2 Earners | 316 (42.1%) | $76,029 |
| 3+ Earners | 149 (19.8%) | $136,437 |
| Total | 751 (100.0%) | $56,250 |
Household Income in Camdenton
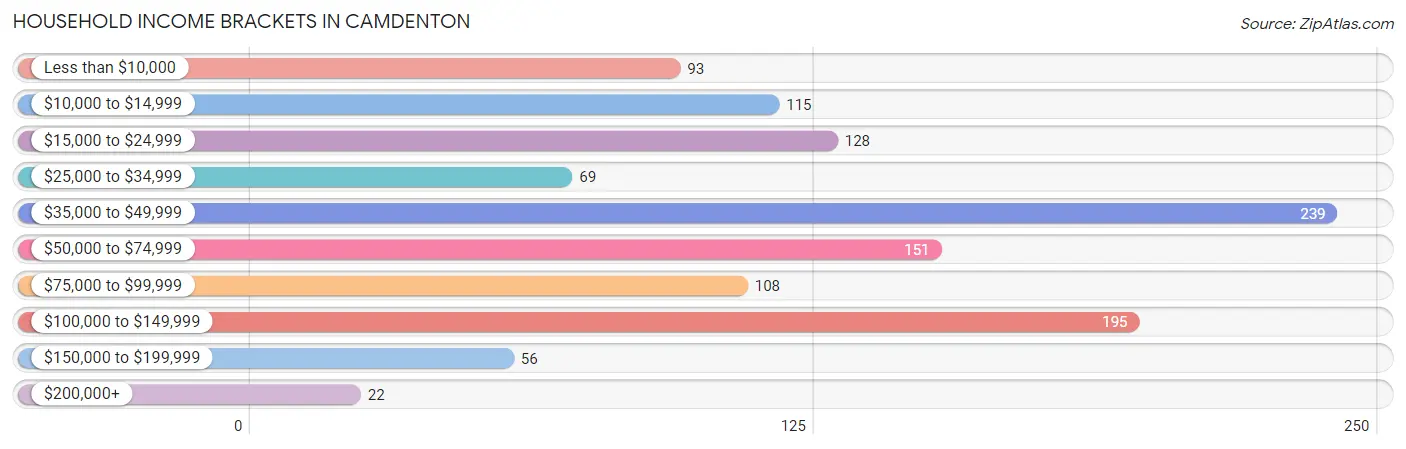
Household Income Brackets in Camdenton
With 239 households falling in the category, the $35,000 to $49,999 income range is the most frequent in Camdenton, accounting for 20.3% of all households. In contrast, only 22 households (1.9%) fall into the $200,000+ income bracket, making it the least populous group.
| Income Bracket | # Households | % Households |
| Less than $10,000 | 93 | 7.9% |
| $10,000 to $14,999 | 115 | 9.8% |
| $15,000 to $24,999 | 128 | 10.9% |
| $25,000 to $34,999 | 69 | 5.9% |
| $35,000 to $49,999 | 239 | 20.3% |
| $50,000 to $74,999 | 151 | 12.8% |
| $75,000 to $99,999 | 108 | 9.2% |
| $100,000 to $149,999 | 195 | 16.6% |
| $150,000 to $199,999 | 56 | 4.8% |
| $200,000+ | 22 | 1.9% |
Household Income by Householder Age in Camdenton
The median household income in Camdenton is $45,833, with the highest median household income of $49,135 found in the 45 to 64 years age bracket for the primary householder. A total of 463 households (39.4%) fall into this category. Meanwhile, the 15 to 24 years age bracket for the primary householder has the lowest median household income of $0, with 45 households (3.8%) in this group.
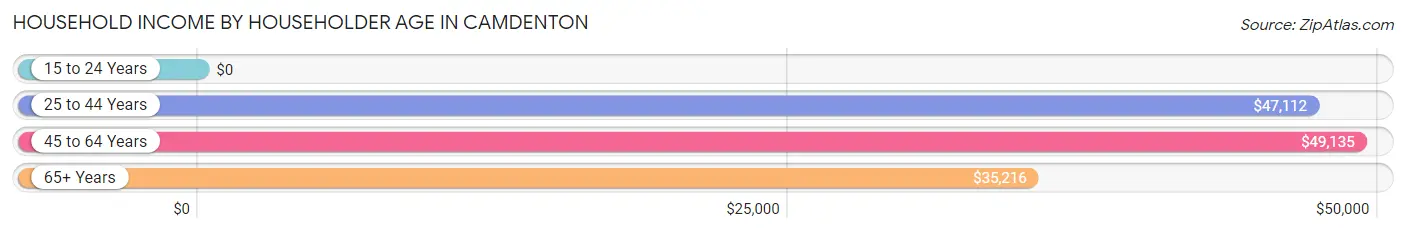
| Income Bracket | # Households | Median Income |
| 15 to 24 Years | 45 (3.8%) | $0 |
| 25 to 44 Years | 403 (34.3%) | $47,112 |
| 45 to 64 Years | 463 (39.4%) | $49,135 |
| 65+ Years | 265 (22.5%) | $35,216 |
| Total | 1,176 (100.0%) | $45,833 |
Poverty in Camdenton
Income Below Poverty by Sex and Age in Camdenton
With 29.5% poverty level for males and 24.4% for females among the residents of Camdenton, under 5 year old males and 5 year old females are the most vulnerable to poverty, with 102 males (71.3%) and 32 females (100.0%) in their respective age groups living below the poverty level.
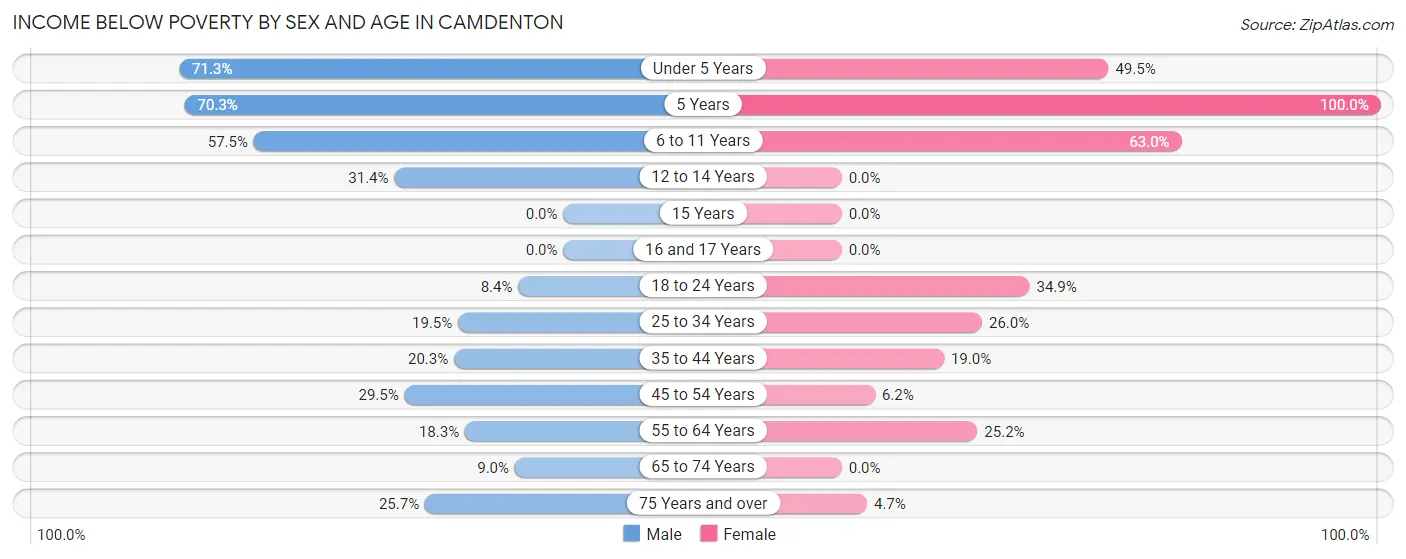
| Age Bracket | Male | Female |
| Under 5 Years | 102 (71.3%) | 50 (49.5%) |
| 5 Years | 64 (70.3%) | 32 (100.0%) |
| 6 to 11 Years | 81 (57.5%) | 87 (63.0%) |
| 12 to 14 Years | 48 (31.4%) | 0 (0.0%) |
| 15 Years | 0 (0.0%) | 0 (0.0%) |
| 16 and 17 Years | 0 (0.0%) | 0 (0.0%) |
| 18 to 24 Years | 17 (8.4%) | 69 (34.8%) |
| 25 to 34 Years | 59 (19.5%) | 100 (26.0%) |
| 35 to 44 Years | 44 (20.3%) | 33 (19.0%) |
| 45 to 54 Years | 89 (29.5%) | 11 (6.1%) |
| 55 to 64 Years | 21 (18.3%) | 76 (25.2%) |
| 65 to 74 Years | 9 (9.0%) | 0 (0.0%) |
| 75 Years and over | 19 (25.7%) | 9 (4.7%) |
| Total | 553 (29.5%) | 467 (24.4%) |
Income Above Poverty by Sex and Age in Camdenton
According to the poverty statistics in Camdenton, males aged 15 years and females aged 12 to 14 years are the age groups that are most secure financially, with 100.0% of males and 100.0% of females in these age groups living above the poverty line.
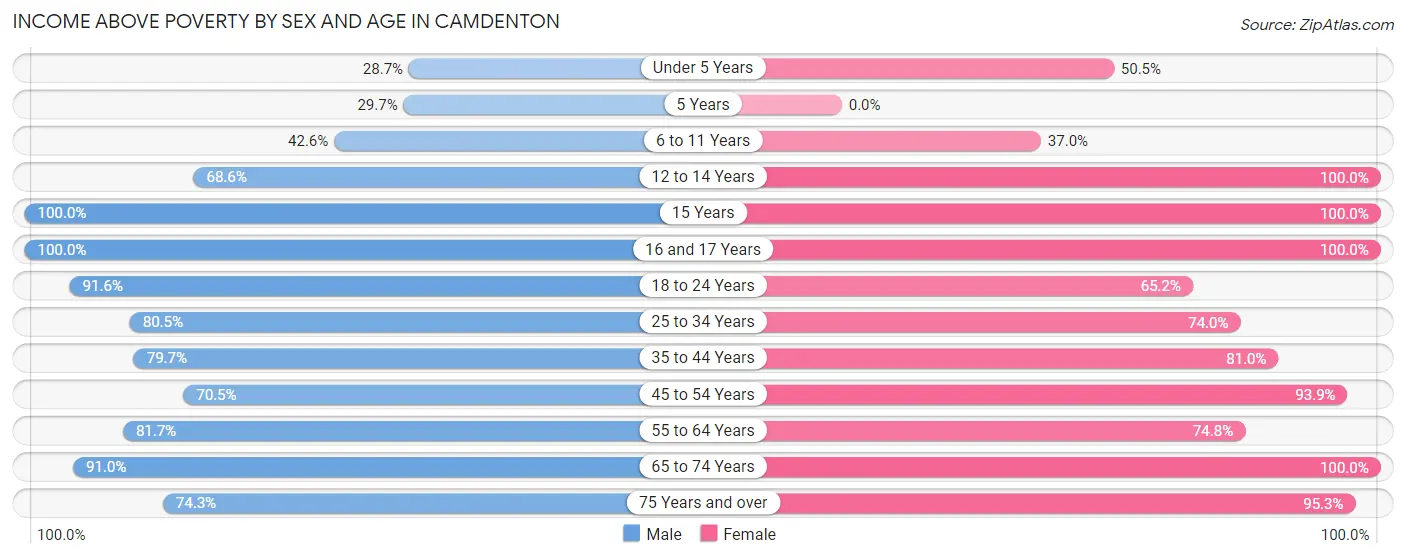
| Age Bracket | Male | Female |
| Under 5 Years | 41 (28.7%) | 51 (50.5%) |
| 5 Years | 27 (29.7%) | 0 (0.0%) |
| 6 to 11 Years | 60 (42.5%) | 51 (37.0%) |
| 12 to 14 Years | 105 (68.6%) | 24 (100.0%) |
| 15 Years | 23 (100.0%) | 46 (100.0%) |
| 16 and 17 Years | 13 (100.0%) | 7 (100.0%) |
| 18 to 24 Years | 186 (91.6%) | 129 (65.1%) |
| 25 to 34 Years | 243 (80.5%) | 284 (74.0%) |
| 35 to 44 Years | 173 (79.7%) | 141 (81.0%) |
| 45 to 54 Years | 213 (70.5%) | 168 (93.9%) |
| 55 to 64 Years | 94 (81.7%) | 226 (74.8%) |
| 65 to 74 Years | 91 (91.0%) | 138 (100.0%) |
| 75 Years and over | 55 (74.3%) | 183 (95.3%) |
| Total | 1,324 (70.5%) | 1,448 (75.6%) |
Income Below Poverty Among Married-Couple Families in Camdenton
The poverty statistics for married-couple families in Camdenton show that 15.4% or 96 of the total 624 families live below the poverty line. Families with 3 or 4 children have the highest poverty rate of 35.0%, comprising of 21 families. On the other hand, families with no children have the lowest poverty rate of 8.8%, which includes 28 families.
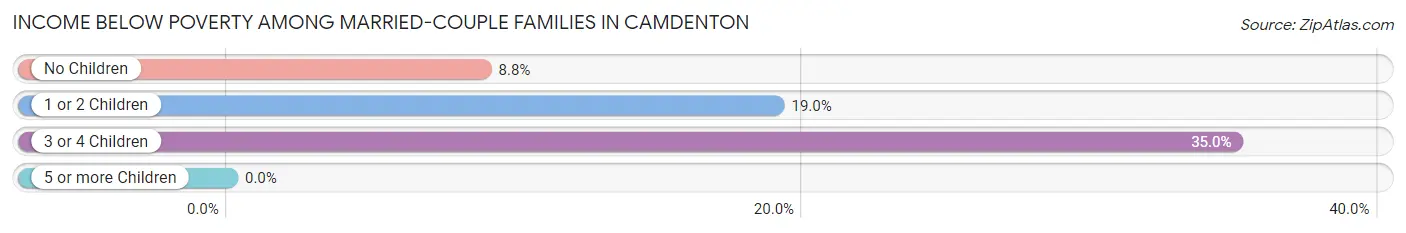
| Children | Above Poverty | Below Poverty |
| No Children | 289 (91.2%) | 28 (8.8%) |
| 1 or 2 Children | 200 (81.0%) | 47 (19.0%) |
| 3 or 4 Children | 39 (65.0%) | 21 (35.0%) |
| 5 or more Children | 0 (0.0%) | 0 (0.0%) |
| Total | 528 (84.6%) | 96 (15.4%) |
Income Below Poverty Among Single-Parent Households in Camdenton
According to the poverty data in Camdenton, 45.8% or 11 single-father households and 28.2% or 29 single-mother households are living below the poverty line. Among single-father households, those with 1 or 2 children have the highest poverty rate, with 11 households (68.8%) experiencing poverty. Likewise, among single-mother households, those with 5 or more children have the highest poverty rate, with 3 households (100.0%) falling below the poverty line.
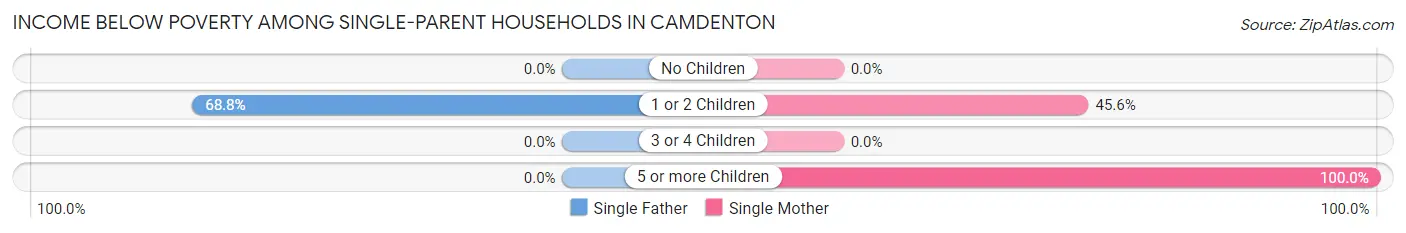
| Children | Single Father | Single Mother |
| No Children | 0 (0.0%) | 0 (0.0%) |
| 1 or 2 Children | 11 (68.8%) | 26 (45.6%) |
| 3 or 4 Children | 0 (0.0%) | 0 (0.0%) |
| 5 or more Children | 0 (0.0%) | 3 (100.0%) |
| Total | 11 (45.8%) | 29 (28.2%) |
Income Below Poverty Among Married-Couple vs Single-Parent Households in Camdenton
The poverty data for Camdenton shows that 96 of the married-couple family households (15.4%) and 40 of the single-parent households (31.5%) are living below the poverty level. Within the married-couple family households, those with 3 or 4 children have the highest poverty rate, with 21 households (35.0%) falling below the poverty line. Among the single-parent households, those with 5 or more children have the highest poverty rate, with 3 household (100.0%) living below poverty.
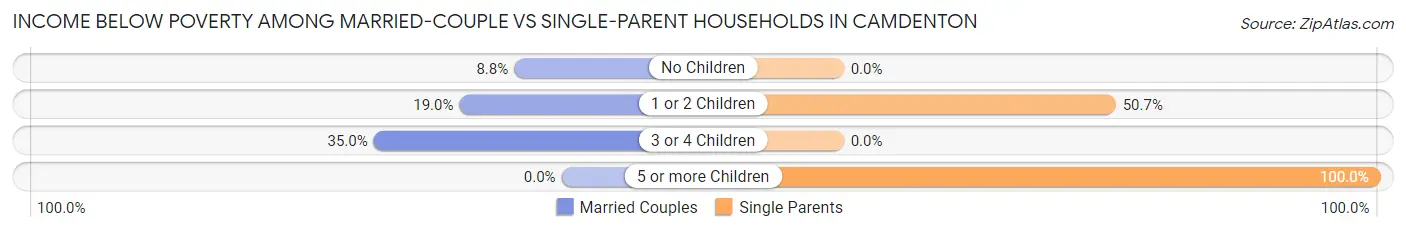
| Children | Married-Couple Families | Single-Parent Households |
| No Children | 28 (8.8%) | 0 (0.0%) |
| 1 or 2 Children | 47 (19.0%) | 37 (50.7%) |
| 3 or 4 Children | 21 (35.0%) | 0 (0.0%) |
| 5 or more Children | 0 (0.0%) | 3 (100.0%) |
| Total | 96 (15.4%) | 40 (31.5%) |
Race in Camdenton
The most populous races in Camdenton are White / Caucasian (3,782 | 95.1%), Hispanic or Latino (231 | 5.8%), and Black / African American (80 | 2.0%).
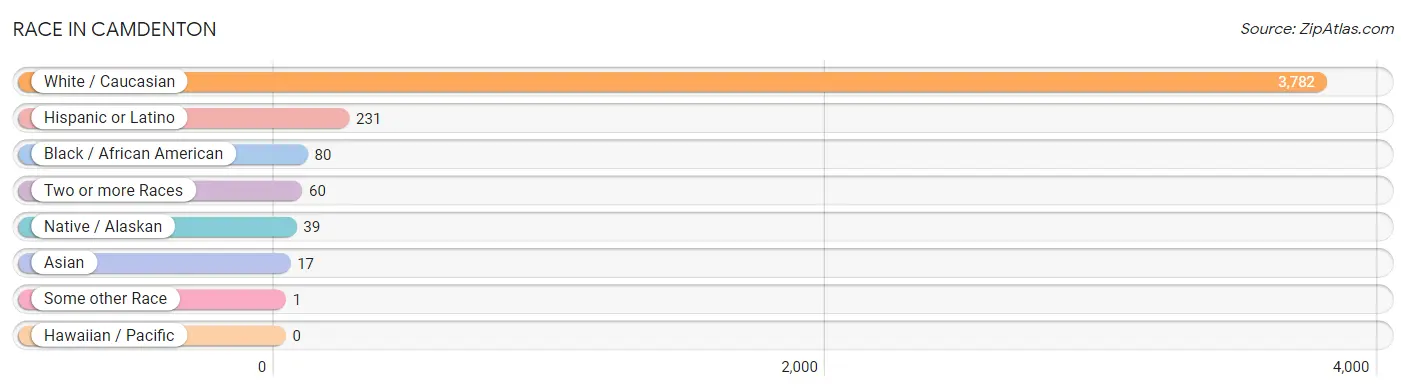
| Race | # Population | % Population |
| Asian | 17 | 0.4% |
| Black / African American | 80 | 2.0% |
| Hawaiian / Pacific | 0 | 0.0% |
| Hispanic or Latino | 231 | 5.8% |
| Native / Alaskan | 39 | 1.0% |
| White / Caucasian | 3,782 | 95.1% |
| Two or more Races | 60 | 1.5% |
| Some other Race | 1 | 0.0% |
| Total | 3,979 | 100.0% |
Ancestry in Camdenton
The most populous ancestries reported in Camdenton are American (879 | 22.1%), German (822 | 20.7%), Irish (570 | 14.3%), English (254 | 6.4%), and Mexican (170 | 4.3%), together accounting for 67.7% of all Camdenton residents.
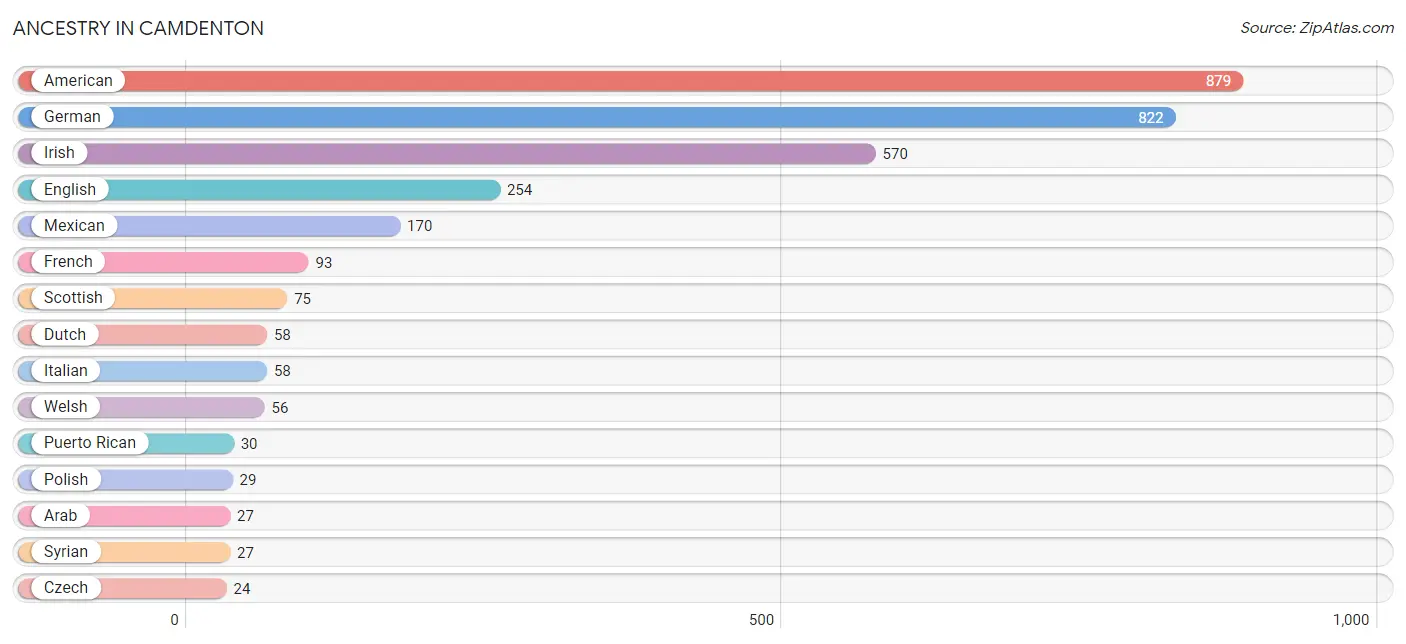
| Ancestry | # Population | % Population |
| American | 879 | 22.1% |
| Arab | 27 | 0.7% |
| Blackfeet | 9 | 0.2% |
| British | 7 | 0.2% |
| Cherokee | 9 | 0.2% |
| Czech | 24 | 0.6% |
| Danish | 1 | 0.0% |
| Dutch | 58 | 1.5% |
| Ecuadorian | 16 | 0.4% |
| English | 254 | 6.4% |
| European | 19 | 0.5% |
| Filipino | 17 | 0.4% |
| French | 93 | 2.3% |
| French Canadian | 19 | 0.5% |
| German | 822 | 20.7% |
| Irish | 570 | 14.3% |
| Italian | 58 | 1.5% |
| Korean | 17 | 0.4% |
| Mexican | 170 | 4.3% |
| Norwegian | 9 | 0.2% |
| Polish | 29 | 0.7% |
| Puerto Rican | 30 | 0.7% |
| Russian | 16 | 0.4% |
| Scottish | 75 | 1.9% |
| Serbian | 17 | 0.4% |
| South American | 16 | 0.4% |
| Spaniard | 8 | 0.2% |
| Spanish | 6 | 0.2% |
| Swedish | 7 | 0.2% |
| Syrian | 27 | 0.7% |
| Ukrainian | 10 | 0.3% |
| Welsh | 56 | 1.4% | View All 32 Rows |
Immigrants in Camdenton
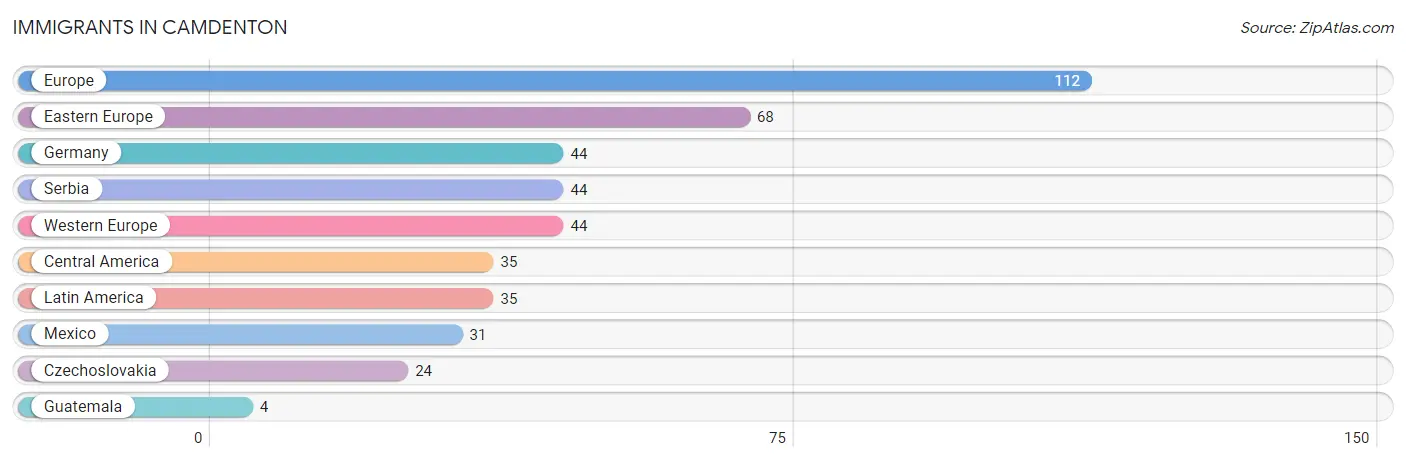
The most numerous immigrant groups reported in Camdenton came from Europe (112 | 2.8%), Eastern Europe (68 | 1.7%), Germany (44 | 1.1%), Serbia (44 | 1.1%), and Western Europe (44 | 1.1%), together accounting for 7.9% of all Camdenton residents.
| Immigration Origin | # Population | % Population |
| Central America | 35 | 0.9% |
| Czechoslovakia | 24 | 0.6% |
| Eastern Europe | 68 | 1.7% |
| Europe | 112 | 2.8% |
| Germany | 44 | 1.1% |
| Guatemala | 4 | 0.1% |
| Latin America | 35 | 0.9% |
| Mexico | 31 | 0.8% |
| Serbia | 44 | 1.1% |
| Western Europe | 44 | 1.1% | View All 10 Rows |
Sex and Age in Camdenton
Sex and Age in Camdenton
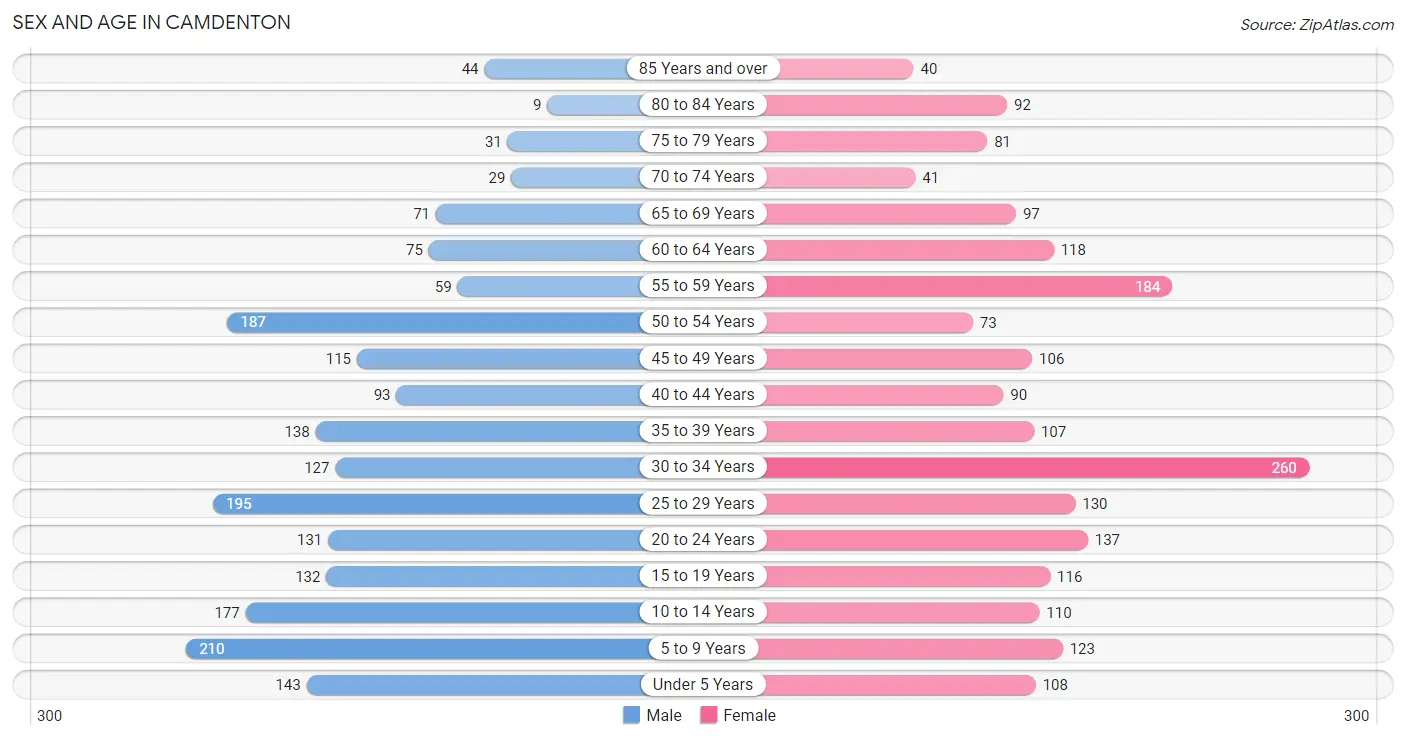
The most populous age groups in Camdenton are 5 to 9 Years (210 | 10.7%) for men and 30 to 34 Years (260 | 12.9%) for women.
| Age Bracket | Male | Female |
| Under 5 Years | 143 (7.3%) | 108 (5.4%) |
| 5 to 9 Years | 210 (10.7%) | 123 (6.1%) |
| 10 to 14 Years | 177 (9.0%) | 110 (5.5%) |
| 15 to 19 Years | 132 (6.7%) | 116 (5.8%) |
| 20 to 24 Years | 131 (6.7%) | 137 (6.8%) |
| 25 to 29 Years | 195 (9.9%) | 130 (6.5%) |
| 30 to 34 Years | 127 (6.5%) | 260 (12.9%) |
| 35 to 39 Years | 138 (7.0%) | 107 (5.3%) |
| 40 to 44 Years | 93 (4.7%) | 90 (4.5%) |
| 45 to 49 Years | 115 (5.9%) | 106 (5.3%) |
| 50 to 54 Years | 187 (9.5%) | 73 (3.6%) |
| 55 to 59 Years | 59 (3.0%) | 184 (9.1%) |
| 60 to 64 Years | 75 (3.8%) | 118 (5.9%) |
| 65 to 69 Years | 71 (3.6%) | 97 (4.8%) |
| 70 to 74 Years | 29 (1.5%) | 41 (2.0%) |
| 75 to 79 Years | 31 (1.6%) | 81 (4.0%) |
| 80 to 84 Years | 9 (0.5%) | 92 (4.6%) |
| 85 Years and over | 44 (2.2%) | 40 (2.0%) |
| Total | 1,966 (100.0%) | 2,013 (100.0%) |
Families and Households in Camdenton
Median Family Size in Camdenton
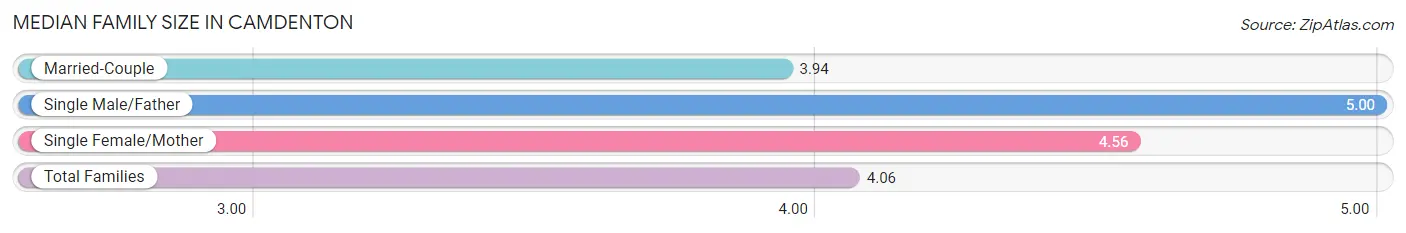
The median family size in Camdenton is 4.06 persons per family, with single male/father families (24 | 3.2%) accounting for the largest median family size of 5 persons per family. On the other hand, married-couple families (624 | 83.1%) represent the smallest median family size with 3.94 persons per family.
| Family Type | # Families | Family Size |
| Married-Couple | 624 (83.1%) | 3.94 |
| Single Male/Father | 24 (3.2%) | 5.00 |
| Single Female/Mother | 103 (13.7%) | 4.56 |
| Total Families | 751 (100.0%) | 4.06 |
Median Household Size in Camdenton
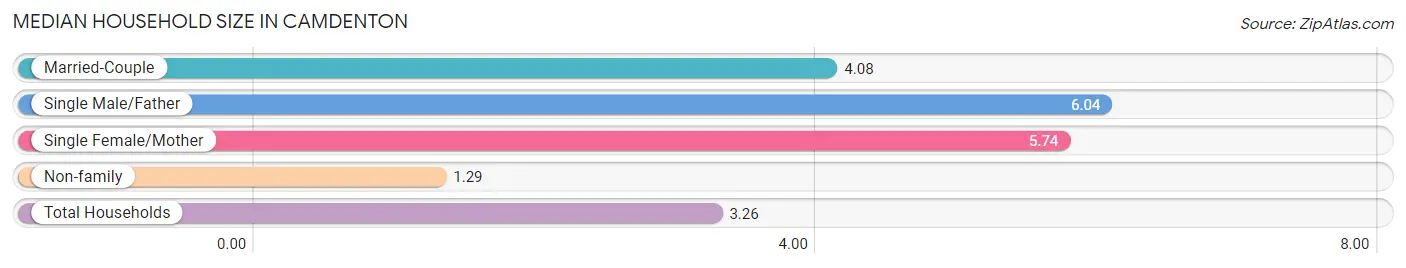
The median household size in Camdenton is 3.26 persons per household, with single male/father households (24 | 2.0%) accounting for the largest median household size of 6.04 persons per household. non-family households (425 | 36.1%) represent the smallest median household size with 1.29 persons per household.
| Household Type | # Households | Household Size |
| Married-Couple | 624 (53.1%) | 4.08 |
| Single Male/Father | 24 (2.0%) | 6.04 |
| Single Female/Mother | 103 (8.8%) | 5.74 |
| Non-family | 425 (36.1%) | 1.29 |
| Total Households | 1,176 (100.0%) | 3.26 |
Household Size by Marriage Status in Camdenton
Out of a total of 1,176 households in Camdenton, 751 (63.9%) are family households, while 425 (36.1%) are nonfamily households. The most numerous type of family households are 2-person households, comprising 253, and the most common type of nonfamily households are 1-person households, comprising 397.
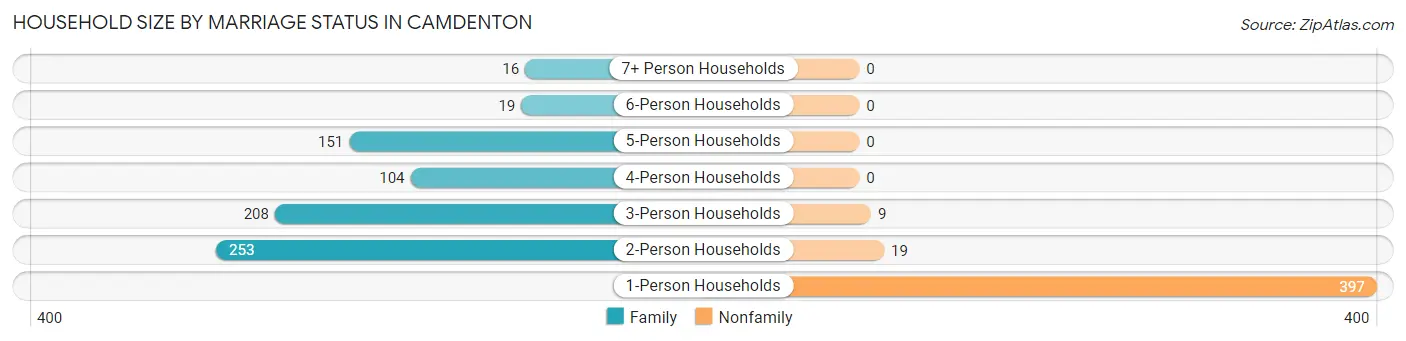
| Household Size | Family Households | Nonfamily Households |
| 1-Person Households | - | 397 (33.8%) |
| 2-Person Households | 253 (21.5%) | 19 (1.6%) |
| 3-Person Households | 208 (17.7%) | 9 (0.8%) |
| 4-Person Households | 104 (8.8%) | 0 (0.0%) |
| 5-Person Households | 151 (12.8%) | 0 (0.0%) |
| 6-Person Households | 19 (1.6%) | 0 (0.0%) |
| 7+ Person Households | 16 (1.4%) | 0 (0.0%) |
| Total | 751 (63.9%) | 425 (36.1%) |
Female Fertility in Camdenton
Fertility by Age in Camdenton
Average fertility rate in Camdenton is 36.0 births per 1,000 women. Women in the age bracket of 20 to 34 years have the highest fertility rate with 66.0 births per 1,000 women. Women in the age bracket of 20 to 34 years acount for 100.0% of all women with births.
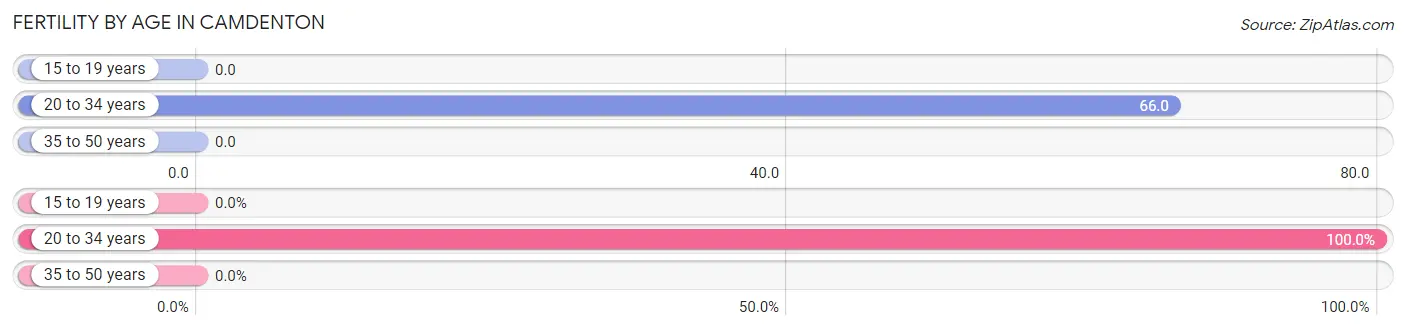
| Age Bracket | Women with Births | Births / 1,000 Women |
| 15 to 19 years | 0 (0.0%) | 0.0 |
| 20 to 34 years | 35 (100.0%) | 66.0 |
| 35 to 50 years | 0 (0.0%) | 0.0 |
| Total | 35 (100.0%) | 36.0 |
Fertility by Age by Marriage Status in Camdenton
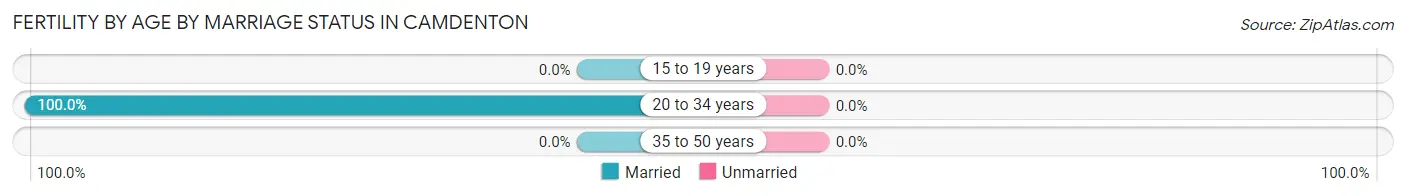
| Age Bracket | Married | Unmarried |
| 15 to 19 years | 0 (0.0%) | 0 (0.0%) |
| 20 to 34 years | 35 (100.0%) | 0 (0.0%) |
| 35 to 50 years | 0 (0.0%) | 0 (0.0%) |
| Total | 35 (100.0%) | 0 (0.0%) |
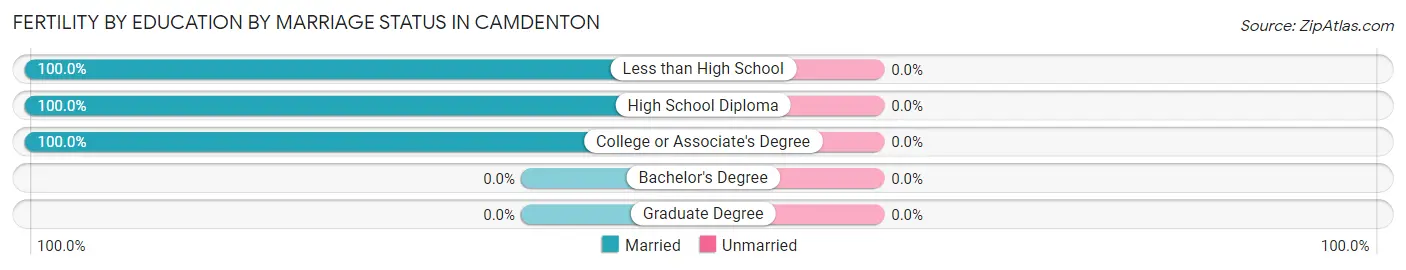
Fertility by Education in Camdenton
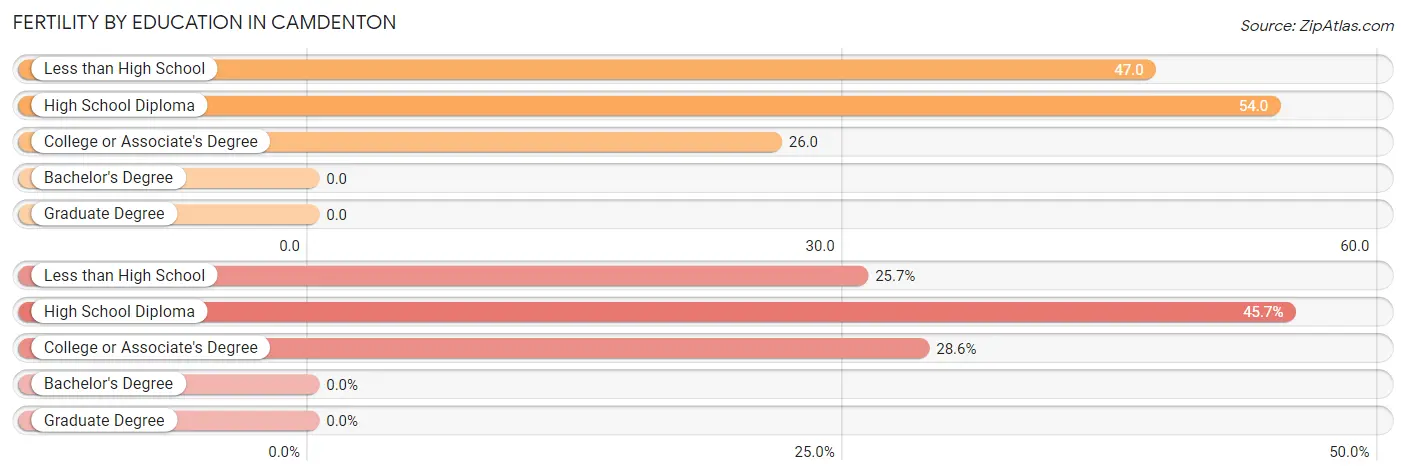
| Educational Attainment | Women with Births | Births / 1,000 Women |
| Less than High School | 9 (25.7%) | 47.0 |
| High School Diploma | 16 (45.7%) | 54.0 |
| College or Associate's Degree | 10 (28.6%) | 26.0 |
| Bachelor's Degree | 0 (0.0%) | 0.0 |
| Graduate Degree | 0 (0.0%) | 0.0 |
| Total | 35 (100.0%) | 36.0 |
Fertility by Education by Marriage Status in Camdenton
| Educational Attainment | Married | Unmarried |
| Less than High School | 9 (100.0%) | 0 (0.0%) |
| High School Diploma | 16 (100.0%) | 0 (0.0%) |
| College or Associate's Degree | 10 (100.0%) | 0 (0.0%) |
| Bachelor's Degree | 0 (0.0%) | 0 (0.0%) |
| Graduate Degree | 0 (0.0%) | 0 (0.0%) |
| Total | 35 (100.0%) | 0 (0.0%) |
Employment Characteristics in Camdenton
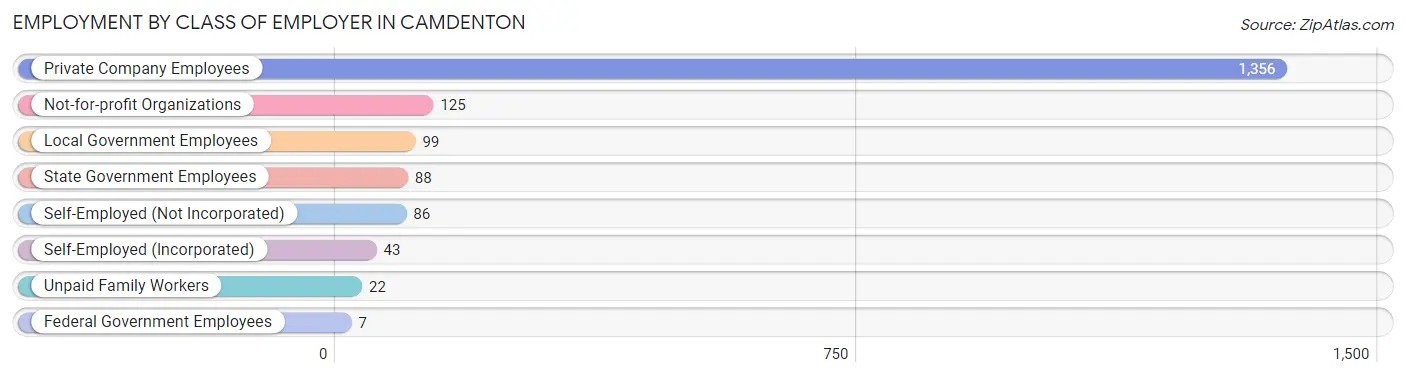
Employment by Class of Employer in Camdenton
Among the 1,826 employed individuals in Camdenton, private company employees (1,356 | 74.3%), not-for-profit organizations (125 | 6.9%), and local government employees (99 | 5.4%) make up the most common classes of employment.
| Employer Class | # Employees | % Employees |
| Private Company Employees | 1,356 | 74.3% |
| Self-Employed (Incorporated) | 43 | 2.4% |
| Self-Employed (Not Incorporated) | 86 | 4.7% |
| Not-for-profit Organizations | 125 | 6.9% |
| Local Government Employees | 99 | 5.4% |
| State Government Employees | 88 | 4.8% |
| Federal Government Employees | 7 | 0.4% |
| Unpaid Family Workers | 22 | 1.2% |
| Total | 1,826 | 100.0% |
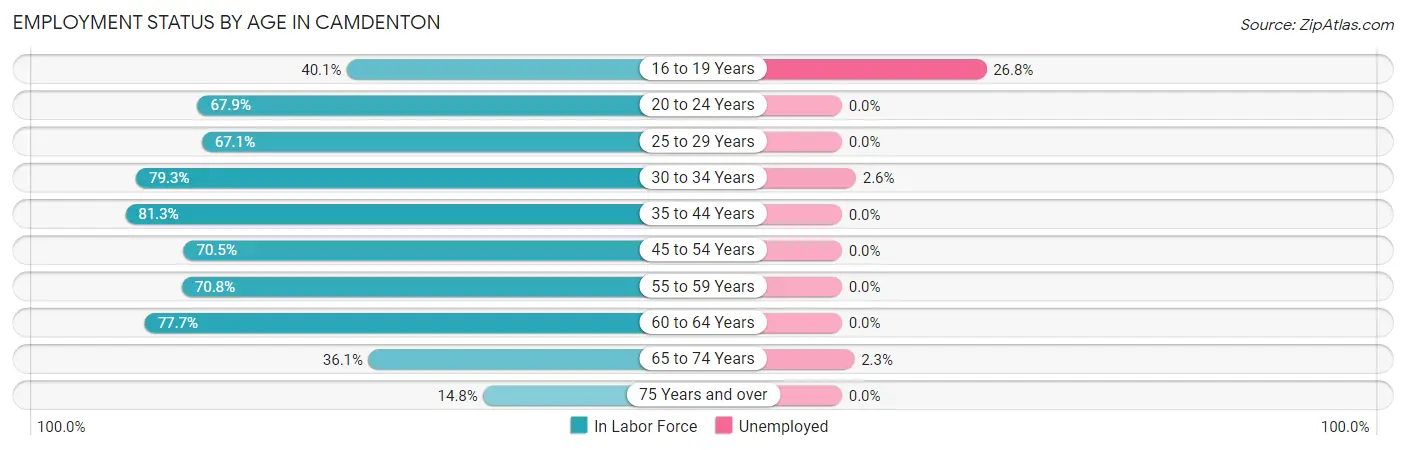
Employment Status by Age in Camdenton
According to the labor force statistics for Camdenton, out of the total population over 16 years of age (3,037), 63.1% or 1,916 individuals are in the labor force, with 1.5% or 29 of them unemployed. The age group with the highest labor force participation rate is 35 to 44 years, with 81.3% or 348 individuals in the labor force. Within the labor force, the 16 to 19 years age range has the highest percentage of unemployed individuals, with 26.8% or 19 of them being unemployed.
| Age Bracket | In Labor Force | Unemployed |
| 16 to 19 Years | 71 (40.1%) | 19 (26.8%) |
| 20 to 24 Years | 182 (67.9%) | 0 (0.0%) |
| 25 to 29 Years | 218 (67.1%) | 0 (0.0%) |
| 30 to 34 Years | 307 (79.3%) | 8 (2.6%) |
| 35 to 44 Years | 348 (81.3%) | 0 (0.0%) |
| 45 to 54 Years | 339 (70.5%) | 0 (0.0%) |
| 55 to 59 Years | 172 (70.8%) | 0 (0.0%) |
| 60 to 64 Years | 150 (77.7%) | 0 (0.0%) |
| 65 to 74 Years | 86 (36.1%) | 2 (2.3%) |
| 75 Years and over | 44 (14.8%) | 0 (0.0%) |
| Total | 1,916 (63.1%) | 29 (1.5%) |
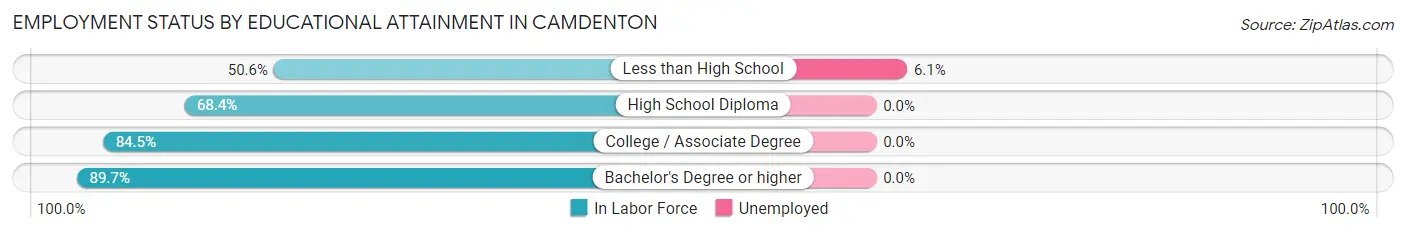
Employment Status by Educational Attainment in Camdenton
According to labor force statistics for Camdenton, 74.6% of individuals (1,535) out of the total population between 25 and 64 years of age (2,057) are in the labor force, with 0.5% or 8 of them being unemployed. The group with the highest labor force participation rate are those with the educational attainment of bachelor's degree or higher, with 89.7% or 208 individuals in the labor force. Within the labor force, individuals with less than high school education have the highest percentage of unemployment, with 6.1% or 8 of them being unemployed.
| Educational Attainment | In Labor Force | Unemployed |
| Less than High School | 131 (50.6%) | 16 (6.1%) |
| High School Diploma | 546 (68.4%) | 0 (0.0%) |
| College / Associate Degree | 649 (84.5%) | 0 (0.0%) |
| Bachelor's Degree or higher | 208 (89.7%) | 0 (0.0%) |
| Total | 1,535 (74.6%) | 10 (0.5%) |
Employment Occupations by Sex in Camdenton
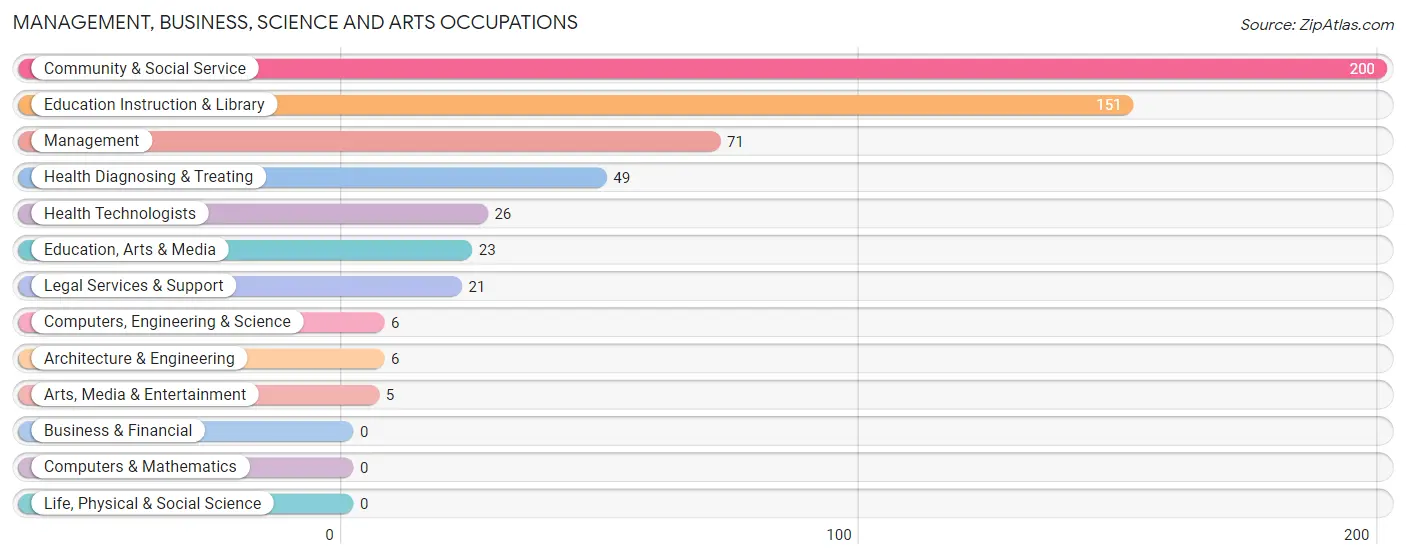
Management, Business, Science and Arts Occupations
The most common Management, Business, Science and Arts occupations in Camdenton are Community & Social Service (200 | 10.6%), Education Instruction & Library (151 | 8.0%), Management (71 | 3.8%), Health Diagnosing & Treating (49 | 2.6%), and Health Technologists (26 | 1.4%).
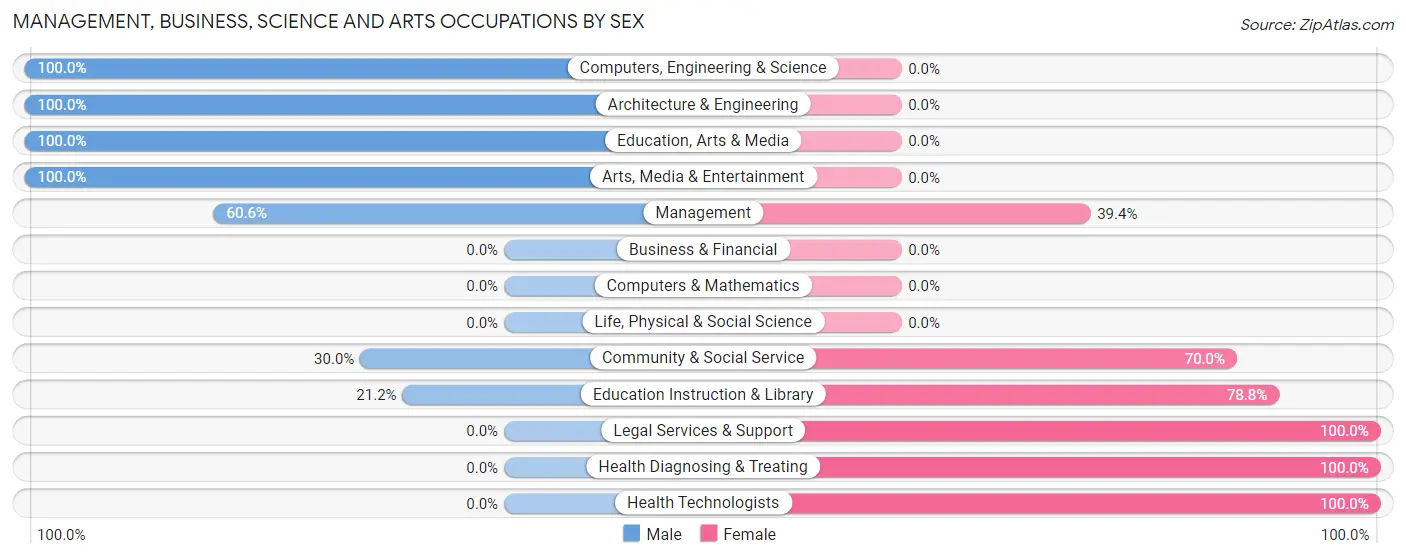
Management, Business, Science and Arts Occupations by Sex
Within the Management, Business, Science and Arts occupations in Camdenton, the most male-oriented occupations are Computers, Engineering & Science (100.0%), Architecture & Engineering (100.0%), and Education, Arts & Media (100.0%), while the most female-oriented occupations are Legal Services & Support (100.0%), Health Diagnosing & Treating (100.0%), and Health Technologists (100.0%).
| Occupation | Male | Female |
| Management | 43 (60.6%) | 28 (39.4%) |
| Business & Financial | 0 (0.0%) | 0 (0.0%) |
| Computers, Engineering & Science | 6 (100.0%) | 0 (0.0%) |
| Computers & Mathematics | 0 (0.0%) | 0 (0.0%) |
| Architecture & Engineering | 6 (100.0%) | 0 (0.0%) |
| Life, Physical & Social Science | 0 (0.0%) | 0 (0.0%) |
| Community & Social Service | 60 (30.0%) | 140 (70.0%) |
| Education, Arts & Media | 23 (100.0%) | 0 (0.0%) |
| Legal Services & Support | 0 (0.0%) | 21 (100.0%) |
| Education Instruction & Library | 32 (21.2%) | 119 (78.8%) |
| Arts, Media & Entertainment | 5 (100.0%) | 0 (0.0%) |
| Health Diagnosing & Treating | 0 (0.0%) | 49 (100.0%) |
| Health Technologists | 0 (0.0%) | 26 (100.0%) |
| Total (Category) | 109 (33.4%) | 217 (66.6%) |
| Total (Overall) | 892 (47.2%) | 996 (52.7%) |
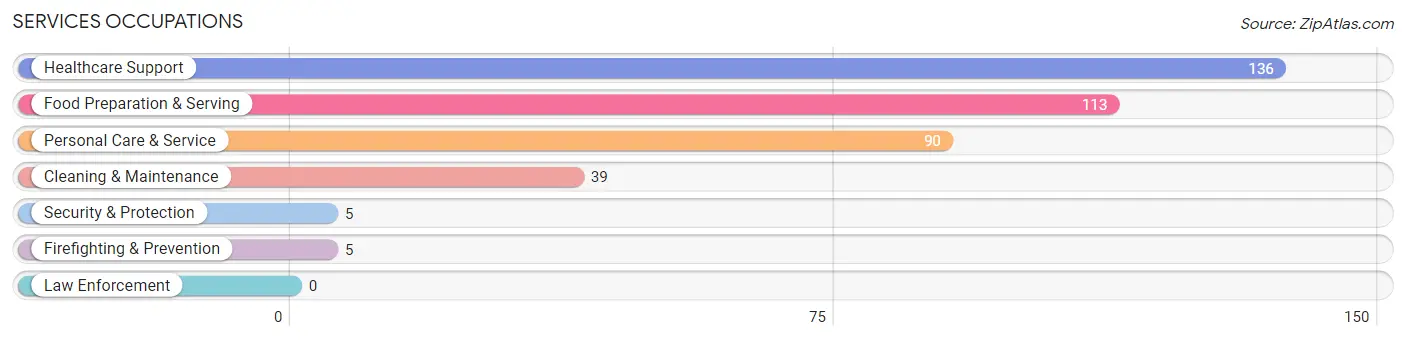
Services Occupations
The most common Services occupations in Camdenton are Healthcare Support (136 | 7.2%), Food Preparation & Serving (113 | 6.0%), Personal Care & Service (90 | 4.8%), Cleaning & Maintenance (39 | 2.1%), and Security & Protection (5 | 0.3%).
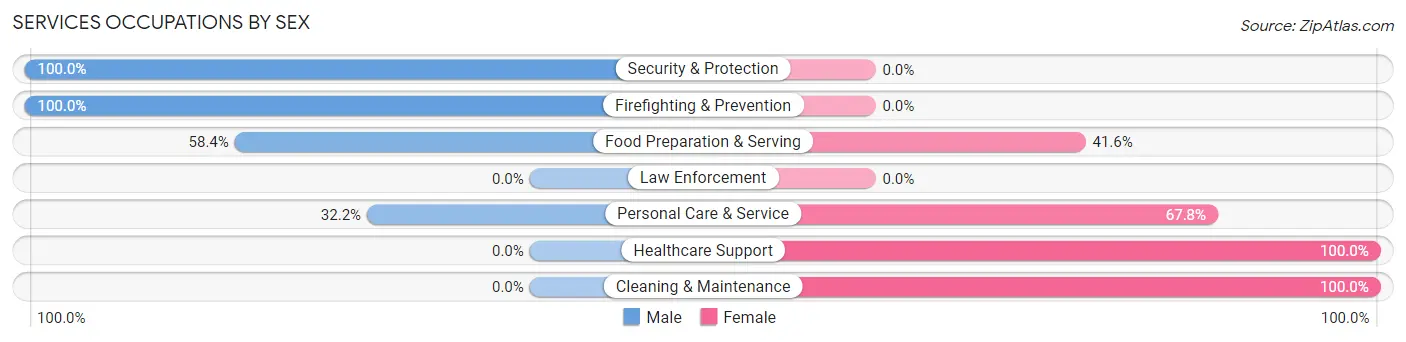
Services Occupations by Sex
Within the Services occupations in Camdenton, the most male-oriented occupations are Security & Protection (100.0%), Firefighting & Prevention (100.0%), and Food Preparation & Serving (58.4%), while the most female-oriented occupations are Healthcare Support (100.0%), Cleaning & Maintenance (100.0%), and Personal Care & Service (67.8%).
| Occupation | Male | Female |
| Healthcare Support | 0 (0.0%) | 136 (100.0%) |
| Security & Protection | 5 (100.0%) | 0 (0.0%) |
| Firefighting & Prevention | 5 (100.0%) | 0 (0.0%) |
| Law Enforcement | 0 (0.0%) | 0 (0.0%) |
| Food Preparation & Serving | 66 (58.4%) | 47 (41.6%) |
| Cleaning & Maintenance | 0 (0.0%) | 39 (100.0%) |
| Personal Care & Service | 29 (32.2%) | 61 (67.8%) |
| Total (Category) | 100 (26.1%) | 283 (73.9%) |
| Total (Overall) | 892 (47.2%) | 996 (52.7%) |
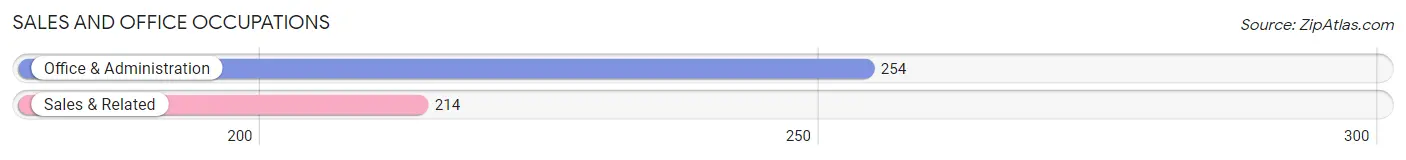
Sales and Office Occupations
The most common Sales and Office occupations in Camdenton are Office & Administration (254 | 13.5%), and Sales & Related (214 | 11.3%).
Sales and Office Occupations by Sex
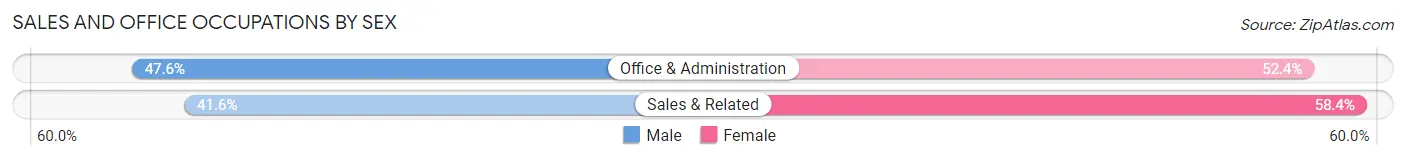
| Occupation | Male | Female |
| Sales & Related | 89 (41.6%) | 125 (58.4%) |
| Office & Administration | 121 (47.6%) | 133 (52.4%) |
| Total (Category) | 210 (44.9%) | 258 (55.1%) |
| Total (Overall) | 892 (47.2%) | 996 (52.7%) |
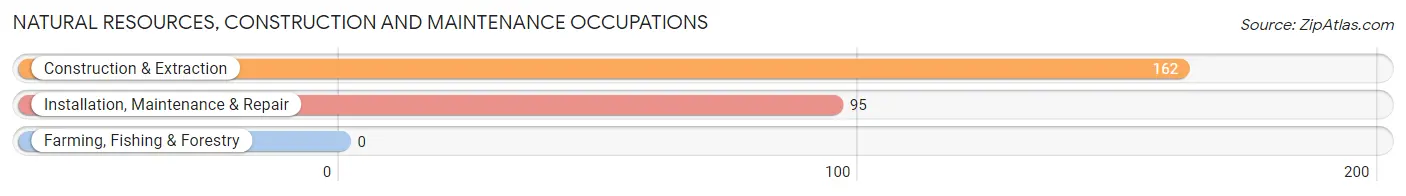
Natural Resources, Construction and Maintenance Occupations
The most common Natural Resources, Construction and Maintenance occupations in Camdenton are Construction & Extraction (162 | 8.6%), and Installation, Maintenance & Repair (95 | 5.0%).
Natural Resources, Construction and Maintenance Occupations by Sex
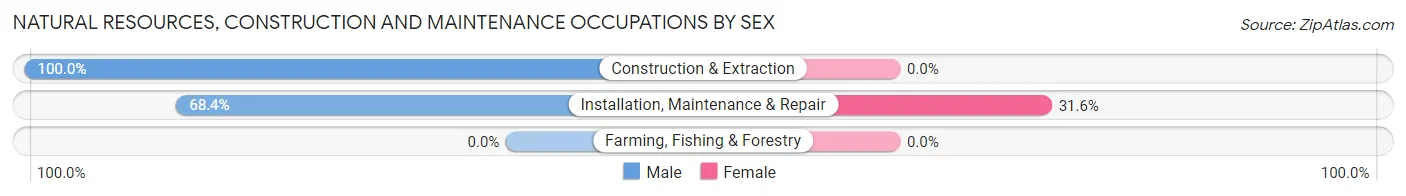
| Occupation | Male | Female |
| Farming, Fishing & Forestry | 0 (0.0%) | 0 (0.0%) |
| Construction & Extraction | 162 (100.0%) | 0 (0.0%) |
| Installation, Maintenance & Repair | 65 (68.4%) | 30 (31.6%) |
| Total (Category) | 227 (88.3%) | 30 (11.7%) |
| Total (Overall) | 892 (47.2%) | 996 (52.7%) |
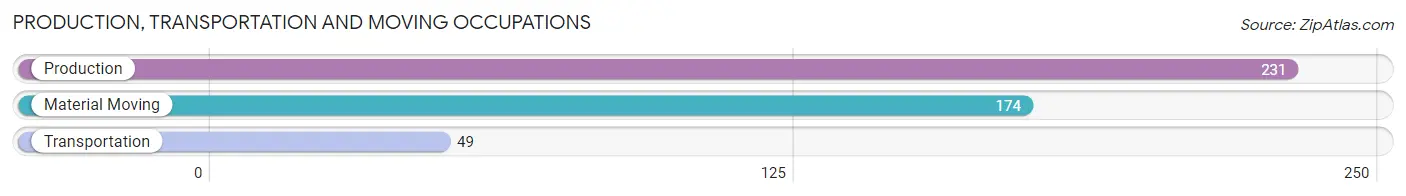
Production, Transportation and Moving Occupations
The most common Production, Transportation and Moving occupations in Camdenton are Production (231 | 12.2%), Material Moving (174 | 9.2%), and Transportation (49 | 2.6%).
Production, Transportation and Moving Occupations by Sex
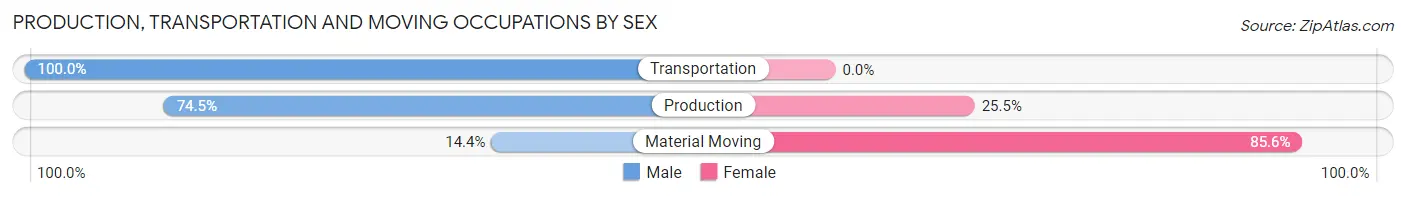
| Occupation | Male | Female |
| Production | 172 (74.5%) | 59 (25.5%) |
| Transportation | 49 (100.0%) | 0 (0.0%) |
| Material Moving | 25 (14.4%) | 149 (85.6%) |
| Total (Category) | 246 (54.2%) | 208 (45.8%) |
| Total (Overall) | 892 (47.2%) | 996 (52.7%) |
Employment Industries by Sex in Camdenton
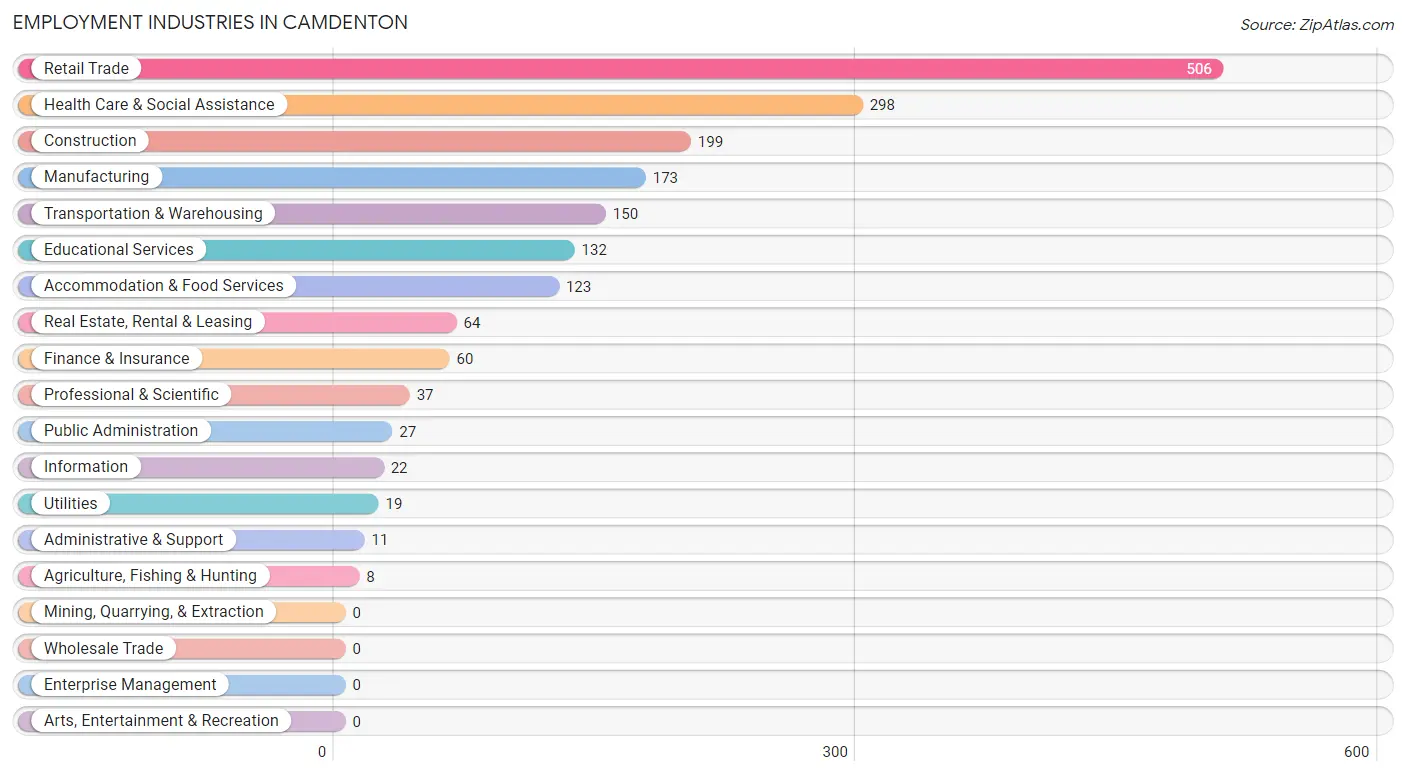
Employment Industries in Camdenton
The major employment industries in Camdenton include Retail Trade (506 | 26.8%), Health Care & Social Assistance (298 | 15.8%), Construction (199 | 10.5%), Manufacturing (173 | 9.2%), and Transportation & Warehousing (150 | 7.9%).
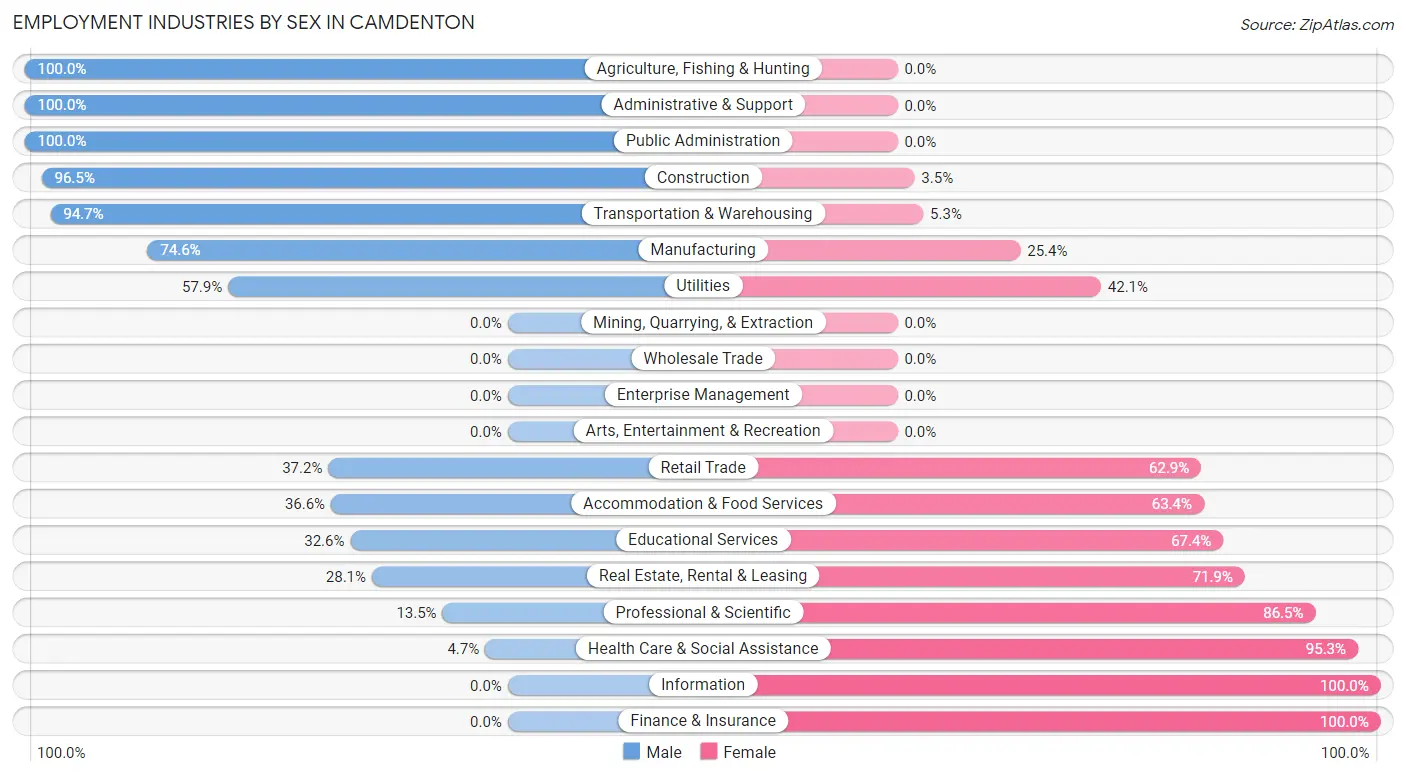
Employment Industries by Sex in Camdenton
The Camdenton industries that see more men than women are Agriculture, Fishing & Hunting (100.0%), Administrative & Support (100.0%), and Public Administration (100.0%), whereas the industries that tend to have a higher number of women are Information (100.0%), Finance & Insurance (100.0%), and Health Care & Social Assistance (95.3%).
| Industry | Male | Female |
| Agriculture, Fishing & Hunting | 8 (100.0%) | 0 (0.0%) |
| Mining, Quarrying, & Extraction | 0 (0.0%) | 0 (0.0%) |
| Construction | 192 (96.5%) | 7 (3.5%) |
| Manufacturing | 129 (74.6%) | 44 (25.4%) |
| Wholesale Trade | 0 (0.0%) | 0 (0.0%) |
| Retail Trade | 188 (37.1%) | 318 (62.8%) |
| Transportation & Warehousing | 142 (94.7%) | 8 (5.3%) |
| Utilities | 11 (57.9%) | 8 (42.1%) |
| Information | 0 (0.0%) | 22 (100.0%) |
| Finance & Insurance | 0 (0.0%) | 60 (100.0%) |
| Real Estate, Rental & Leasing | 18 (28.1%) | 46 (71.9%) |
| Professional & Scientific | 5 (13.5%) | 32 (86.5%) |
| Enterprise Management | 0 (0.0%) | 0 (0.0%) |
| Administrative & Support | 11 (100.0%) | 0 (0.0%) |
| Educational Services | 43 (32.6%) | 89 (67.4%) |
| Health Care & Social Assistance | 14 (4.7%) | 284 (95.3%) |
| Arts, Entertainment & Recreation | 0 (0.0%) | 0 (0.0%) |
| Accommodation & Food Services | 45 (36.6%) | 78 (63.4%) |
| Public Administration | 27 (100.0%) | 0 (0.0%) |
| Total | 892 (47.2%) | 996 (52.7%) |
Education in Camdenton
School Enrollment in Camdenton
The most common levels of schooling among the 891 students in Camdenton are elementary school (214 | 24.0%), high school (175 | 19.6%), and middle school (168 | 18.9%).
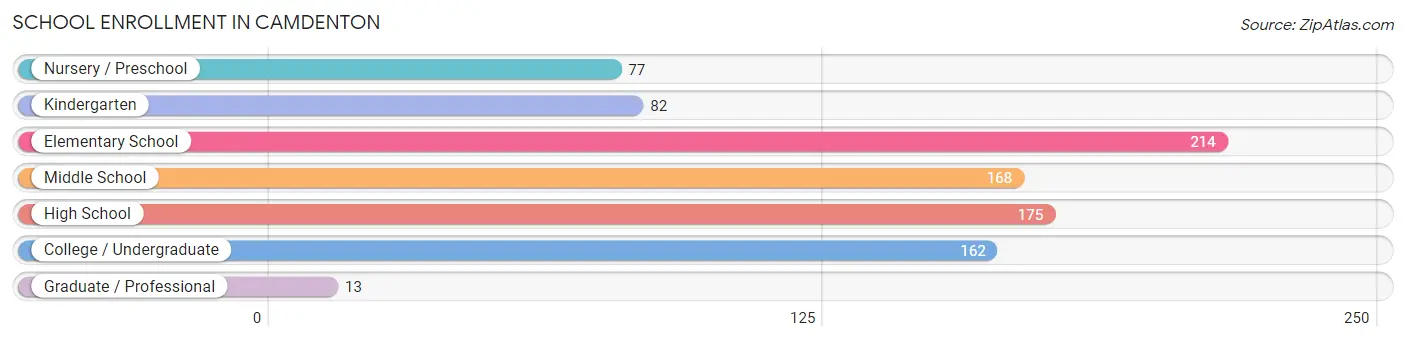
| School Level | # Students | % Students |
| Nursery / Preschool | 77 | 8.6% |
| Kindergarten | 82 | 9.2% |
| Elementary School | 214 | 24.0% |
| Middle School | 168 | 18.9% |
| High School | 175 | 19.6% |
| College / Undergraduate | 162 | 18.2% |
| Graduate / Professional | 13 | 1.5% |
| Total | 891 | 100.0% |
School Enrollment by Age by Funding Source in Camdenton
Out of a total of 891 students who are enrolled in schools in Camdenton, 81 (9.1%) attend a private institution, while the remaining 810 (90.9%) are enrolled in public schools. The age group of 25 to 34 year olds has the highest likelihood of being enrolled in private schools, with 14 (35.9% in the age bracket) enrolled. Conversely, the age group of 3 to 4 year olds has the lowest likelihood of being enrolled in a private school, with 47 (100.0% in the age bracket) attending a public institution.
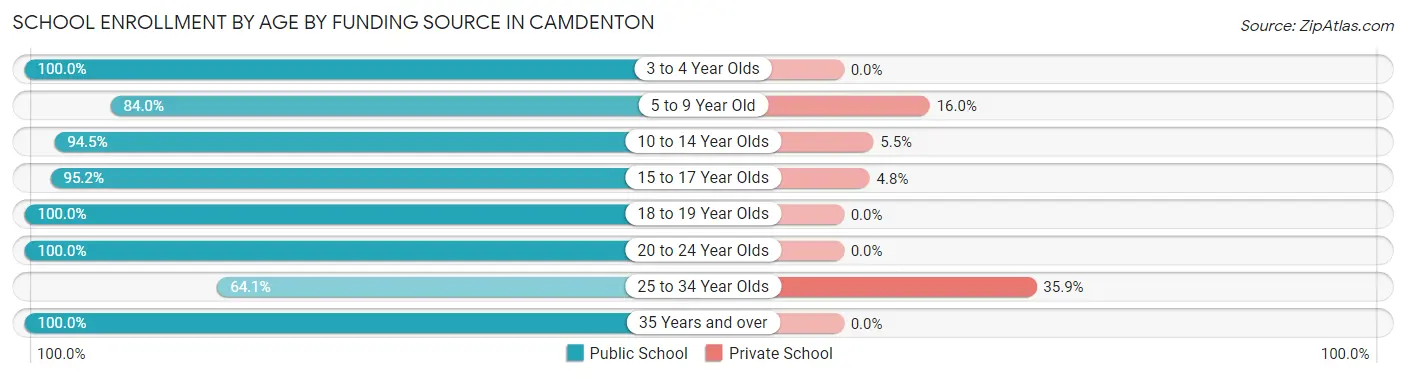
| Age Bracket | Public School | Private School |
| 3 to 4 Year Olds | 47 (100.0%) | 0 (0.0%) |
| 5 to 9 Year Old | 262 (84.0%) | 50 (16.0%) |
| 10 to 14 Year Olds | 239 (94.5%) | 14 (5.5%) |
| 15 to 17 Year Olds | 59 (95.2%) | 3 (4.8%) |
| 18 to 19 Year Olds | 78 (100.0%) | 0 (0.0%) |
| 20 to 24 Year Olds | 95 (100.0%) | 0 (0.0%) |
| 25 to 34 Year Olds | 25 (64.1%) | 14 (35.9%) |
| 35 Years and over | 5 (100.0%) | 0 (0.0%) |
| Total | 810 (90.9%) | 81 (9.1%) |
Educational Attainment by Field of Study in Camdenton
Education (129 | 31.9%), business (84 | 20.8%), science & technology (38 | 9.4%), bio, nature & agricultural (34 | 8.4%), and arts & humanities (27 | 6.7%) are the most common fields of study among 404 individuals in Camdenton who have obtained a bachelor's degree or higher.
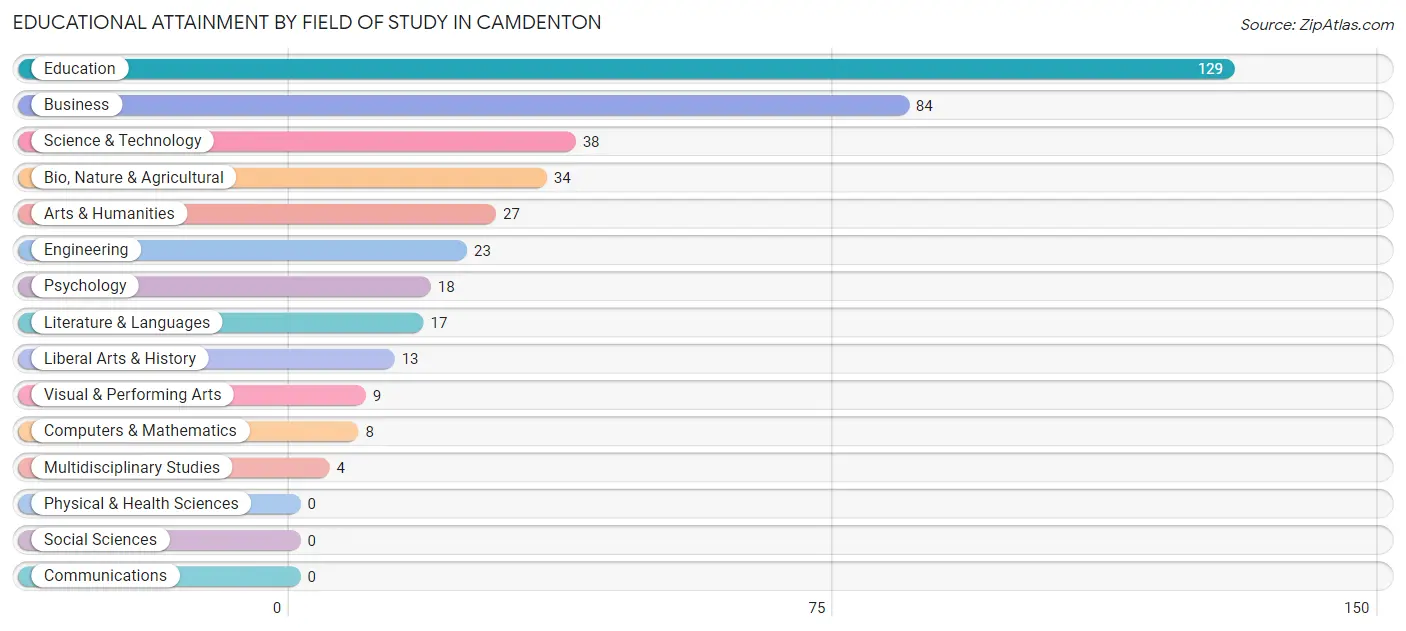
| Field of Study | # Graduates | % Graduates |
| Computers & Mathematics | 8 | 2.0% |
| Bio, Nature & Agricultural | 34 | 8.4% |
| Physical & Health Sciences | 0 | 0.0% |
| Psychology | 18 | 4.5% |
| Social Sciences | 0 | 0.0% |
| Engineering | 23 | 5.7% |
| Multidisciplinary Studies | 4 | 1.0% |
| Science & Technology | 38 | 9.4% |
| Business | 84 | 20.8% |
| Education | 129 | 31.9% |
| Literature & Languages | 17 | 4.2% |
| Liberal Arts & History | 13 | 3.2% |
| Visual & Performing Arts | 9 | 2.2% |
| Communications | 0 | 0.0% |
| Arts & Humanities | 27 | 6.7% |
| Total | 404 | 100.0% |
Transportation & Commute in Camdenton
Vehicle Availability by Sex in Camdenton
The most prevalent vehicle ownership categories in Camdenton are males with 2 vehicles (322, accounting for 37.9%) and females with 2 vehicles (317, making up 33.0%).
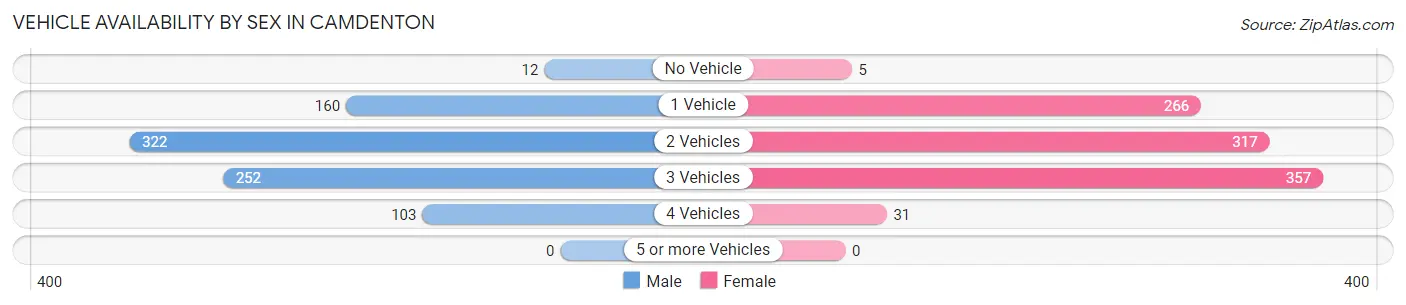
| Vehicles Available | Male | Female |
| No Vehicle | 12 (1.4%) | 5 (0.5%) |
| 1 Vehicle | 160 (18.9%) | 266 (27.3%) |
| 2 Vehicles | 322 (37.9%) | 317 (32.5%) |
| 3 Vehicles | 252 (29.7%) | 357 (36.6%) |
| 4 Vehicles | 103 (12.1%) | 31 (3.2%) |
| 5 or more Vehicles | 0 (0.0%) | 0 (0.0%) |
| Total | 849 (100.0%) | 976 (100.0%) |
Commute Time in Camdenton
The most frequently occuring commute durations in Camdenton are 5 to 9 minutes (528 commuters, 30.1%), 10 to 14 minutes (276 commuters, 15.8%), and 20 to 24 minutes (233 commuters, 13.3%).
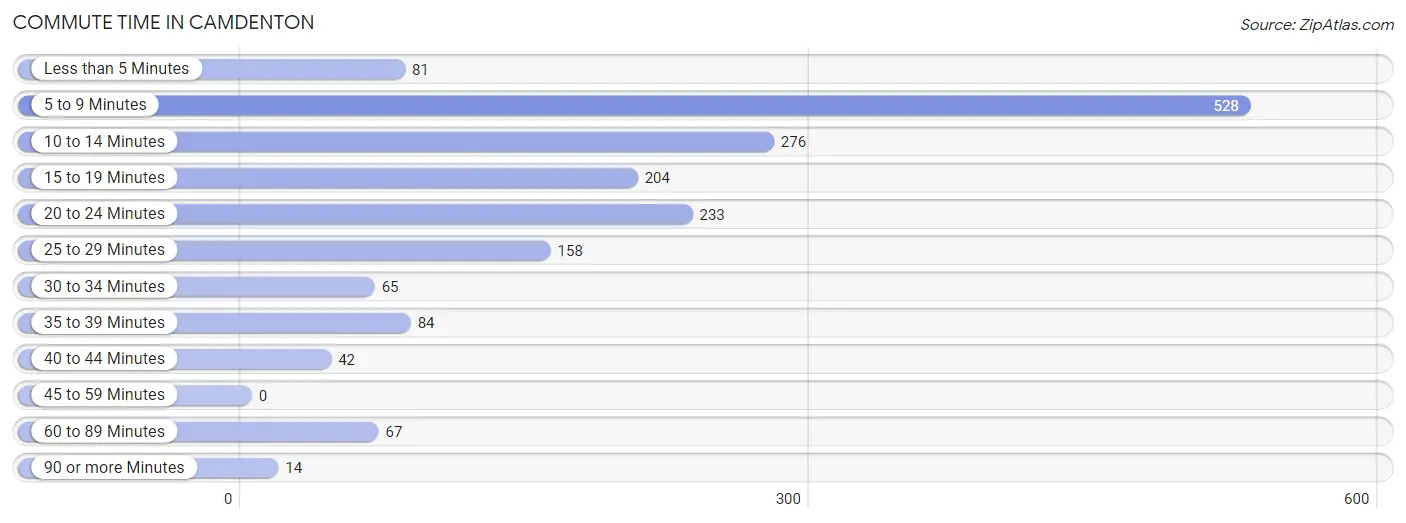
| Commute Time | # Commuters | % Commuters |
| Less than 5 Minutes | 81 | 4.6% |
| 5 to 9 Minutes | 528 | 30.1% |
| 10 to 14 Minutes | 276 | 15.8% |
| 15 to 19 Minutes | 204 | 11.6% |
| 20 to 24 Minutes | 233 | 13.3% |
| 25 to 29 Minutes | 158 | 9.0% |
| 30 to 34 Minutes | 65 | 3.7% |
| 35 to 39 Minutes | 84 | 4.8% |
| 40 to 44 Minutes | 42 | 2.4% |
| 45 to 59 Minutes | 0 | 0.0% |
| 60 to 89 Minutes | 67 | 3.8% |
| 90 or more Minutes | 14 | 0.8% |
Commute Time by Sex in Camdenton
The most common commute times in Camdenton are 5 to 9 minutes (204 commuters, 24.2%) for males and 5 to 9 minutes (324 commuters, 35.7%) for females.
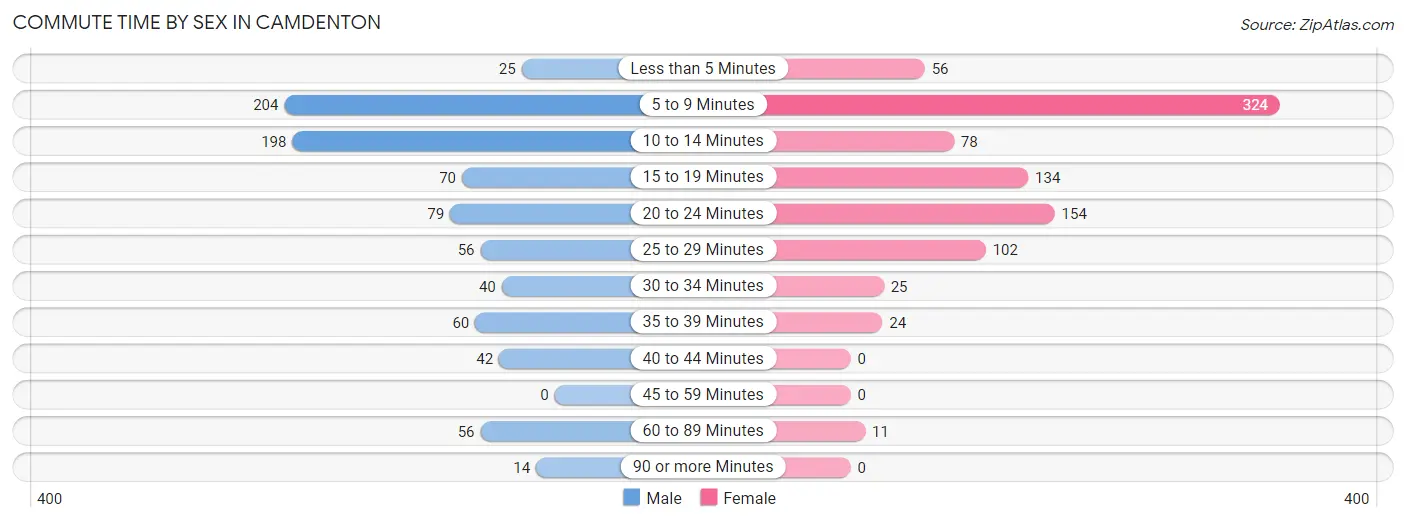
| Commute Time | Male | Female |
| Less than 5 Minutes | 25 (3.0%) | 56 (6.2%) |
| 5 to 9 Minutes | 204 (24.2%) | 324 (35.7%) |
| 10 to 14 Minutes | 198 (23.5%) | 78 (8.6%) |
| 15 to 19 Minutes | 70 (8.3%) | 134 (14.8%) |
| 20 to 24 Minutes | 79 (9.4%) | 154 (17.0%) |
| 25 to 29 Minutes | 56 (6.6%) | 102 (11.2%) |
| 30 to 34 Minutes | 40 (4.7%) | 25 (2.8%) |
| 35 to 39 Minutes | 60 (7.1%) | 24 (2.6%) |
| 40 to 44 Minutes | 42 (5.0%) | 0 (0.0%) |
| 45 to 59 Minutes | 0 (0.0%) | 0 (0.0%) |
| 60 to 89 Minutes | 56 (6.6%) | 11 (1.2%) |
| 90 or more Minutes | 14 (1.7%) | 0 (0.0%) |
Time of Departure to Work by Sex in Camdenton
The most frequent times of departure to work in Camdenton are 7:00 AM to 7:29 AM (271, 32.1%) for males and 7:00 AM to 7:29 AM (207, 22.8%) for females.
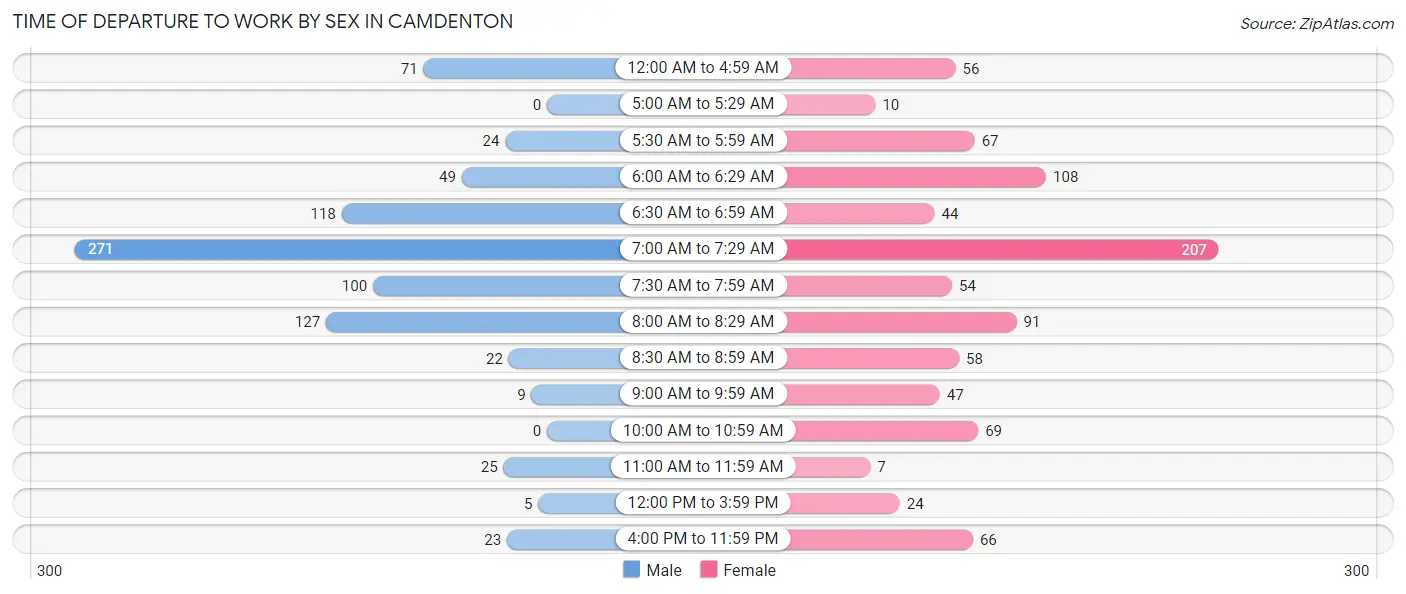
| Time of Departure | Male | Female |
| 12:00 AM to 4:59 AM | 71 (8.4%) | 56 (6.2%) |
| 5:00 AM to 5:29 AM | 0 (0.0%) | 10 (1.1%) |
| 5:30 AM to 5:59 AM | 24 (2.8%) | 67 (7.4%) |
| 6:00 AM to 6:29 AM | 49 (5.8%) | 108 (11.9%) |
| 6:30 AM to 6:59 AM | 118 (14.0%) | 44 (4.9%) |
| 7:00 AM to 7:29 AM | 271 (32.1%) | 207 (22.8%) |
| 7:30 AM to 7:59 AM | 100 (11.8%) | 54 (5.9%) |
| 8:00 AM to 8:29 AM | 127 (15.0%) | 91 (10.0%) |
| 8:30 AM to 8:59 AM | 22 (2.6%) | 58 (6.4%) |
| 9:00 AM to 9:59 AM | 9 (1.1%) | 47 (5.2%) |
| 10:00 AM to 10:59 AM | 0 (0.0%) | 69 (7.6%) |
| 11:00 AM to 11:59 AM | 25 (3.0%) | 7 (0.8%) |
| 12:00 PM to 3:59 PM | 5 (0.6%) | 24 (2.6%) |
| 4:00 PM to 11:59 PM | 23 (2.7%) | 66 (7.3%) |
| Total | 844 (100.0%) | 908 (100.0%) |
Housing Occupancy in Camdenton
Occupancy by Ownership in Camdenton
Of the total 1,176 dwellings in Camdenton, owner-occupied units account for 639 (54.3%), while renter-occupied units make up 537 (45.7%).
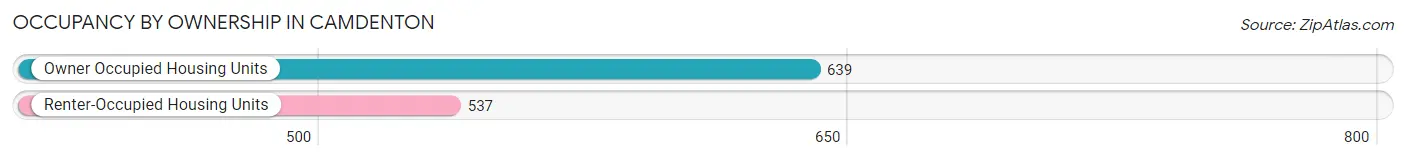
| Occupancy | # Housing Units | % Housing Units |
| Owner Occupied Housing Units | 639 | 54.3% |
| Renter-Occupied Housing Units | 537 | 45.7% |
| Total Occupied Housing Units | 1,176 | 100.0% |
Occupancy by Household Size in Camdenton
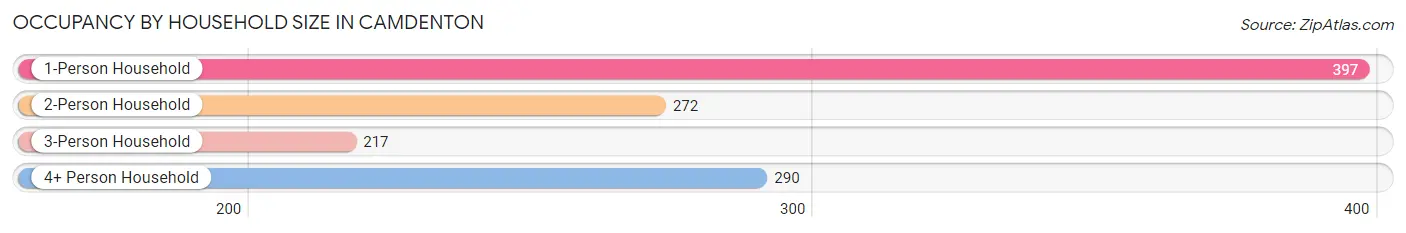
| Household Size | # Housing Units | % Housing Units |
| 1-Person Household | 397 | 33.8% |
| 2-Person Household | 272 | 23.1% |
| 3-Person Household | 217 | 18.4% |
| 4+ Person Household | 290 | 24.7% |
| Total Housing Units | 1,176 | 100.0% |
Occupancy by Ownership by Household Size in Camdenton
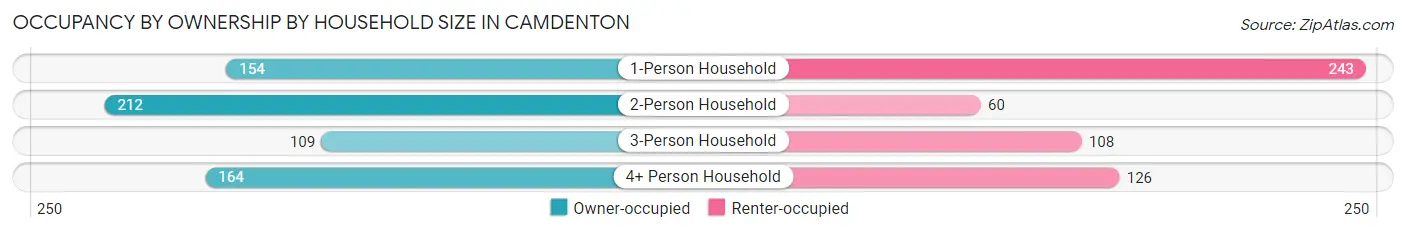
| Household Size | Owner-occupied | Renter-occupied |
| 1-Person Household | 154 (38.8%) | 243 (61.2%) |
| 2-Person Household | 212 (77.9%) | 60 (22.1%) |
| 3-Person Household | 109 (50.2%) | 108 (49.8%) |
| 4+ Person Household | 164 (56.6%) | 126 (43.4%) |
| Total Housing Units | 639 (54.3%) | 537 (45.7%) |
Occupancy by Educational Attainment in Camdenton
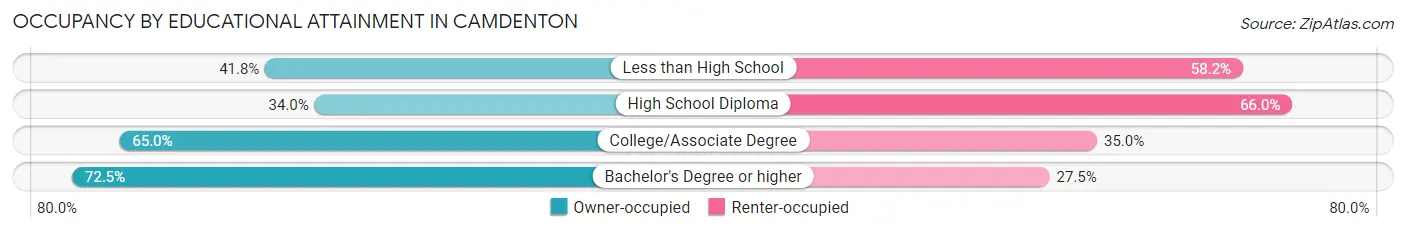
| Household Size | Owner-occupied | Renter-occupied |
| Less than High School | 59 (41.8%) | 82 (58.2%) |
| High School Diploma | 118 (34.0%) | 229 (66.0%) |
| College/Associate Degree | 317 (65.0%) | 171 (35.0%) |
| Bachelor's Degree or higher | 145 (72.5%) | 55 (27.5%) |
Occupancy by Age of Householder in Camdenton
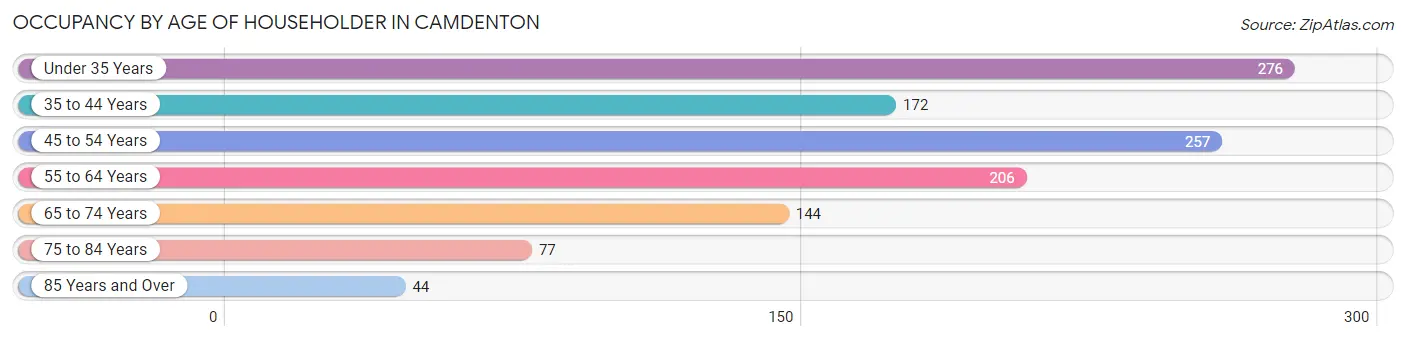
| Age Bracket | # Households | % Households |
| Under 35 Years | 276 | 23.5% |
| 35 to 44 Years | 172 | 14.6% |
| 45 to 54 Years | 257 | 21.8% |
| 55 to 64 Years | 206 | 17.5% |
| 65 to 74 Years | 144 | 12.2% |
| 75 to 84 Years | 77 | 6.6% |
| 85 Years and Over | 44 | 3.7% |
| Total | 1,176 | 100.0% |
Housing Finances in Camdenton
Median Income by Occupancy in Camdenton
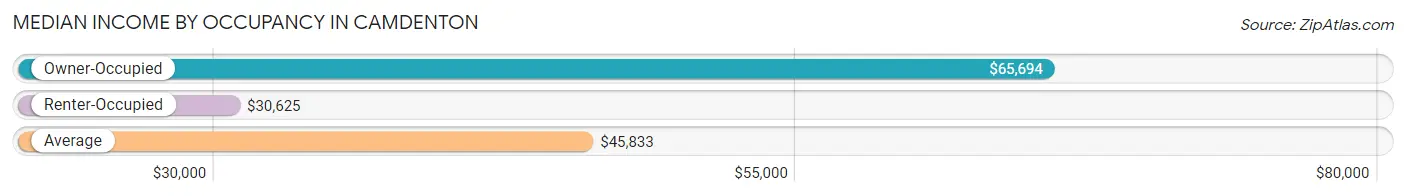
| Occupancy Type | # Households | Median Income |
| Owner-Occupied | 639 (54.3%) | $65,694 |
| Renter-Occupied | 537 (45.7%) | $30,625 |
| Average | 1,176 (100.0%) | $45,833 |
Occupancy by Householder Income Bracket in Camdenton
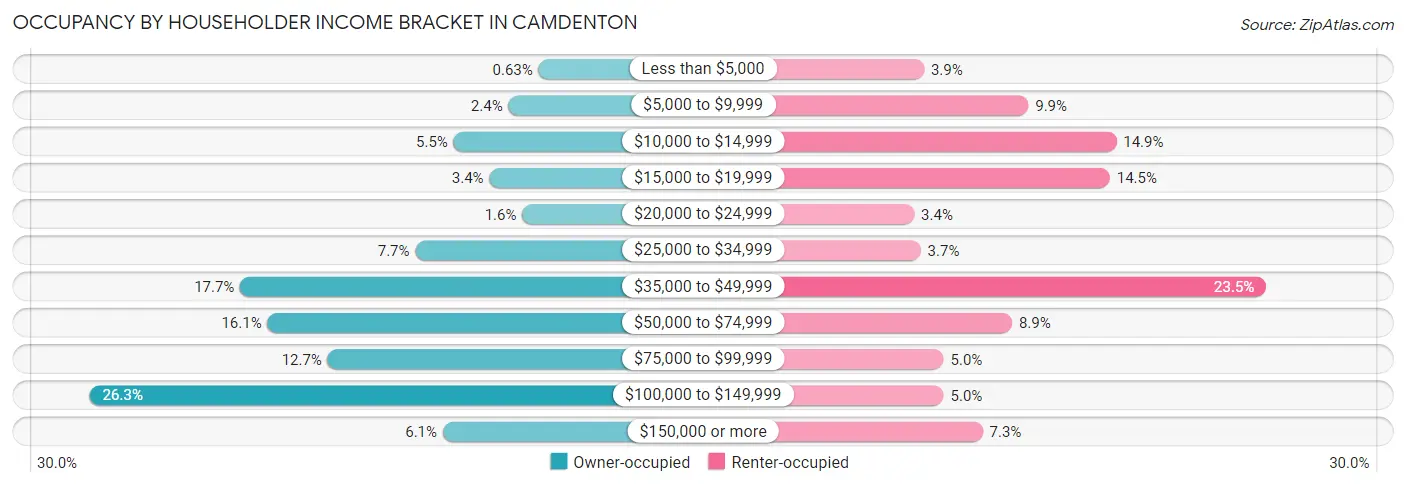
| Income Bracket | Owner-occupied | Renter-occupied |
| Less than $5,000 | 4 (0.6%) | 21 (3.9%) |
| $5,000 to $9,999 | 15 (2.4%) | 53 (9.9%) |
| $10,000 to $14,999 | 35 (5.5%) | 80 (14.9%) |
| $15,000 to $19,999 | 22 (3.4%) | 78 (14.5%) |
| $20,000 to $24,999 | 10 (1.6%) | 18 (3.4%) |
| $25,000 to $34,999 | 49 (7.7%) | 20 (3.7%) |
| $35,000 to $49,999 | 113 (17.7%) | 126 (23.5%) |
| $50,000 to $74,999 | 103 (16.1%) | 48 (8.9%) |
| $75,000 to $99,999 | 81 (12.7%) | 27 (5.0%) |
| $100,000 to $149,999 | 168 (26.3%) | 27 (5.0%) |
| $150,000 or more | 39 (6.1%) | 39 (7.3%) |
| Total | 639 (100.0%) | 537 (100.0%) |
Monthly Housing Cost Tiers in Camdenton
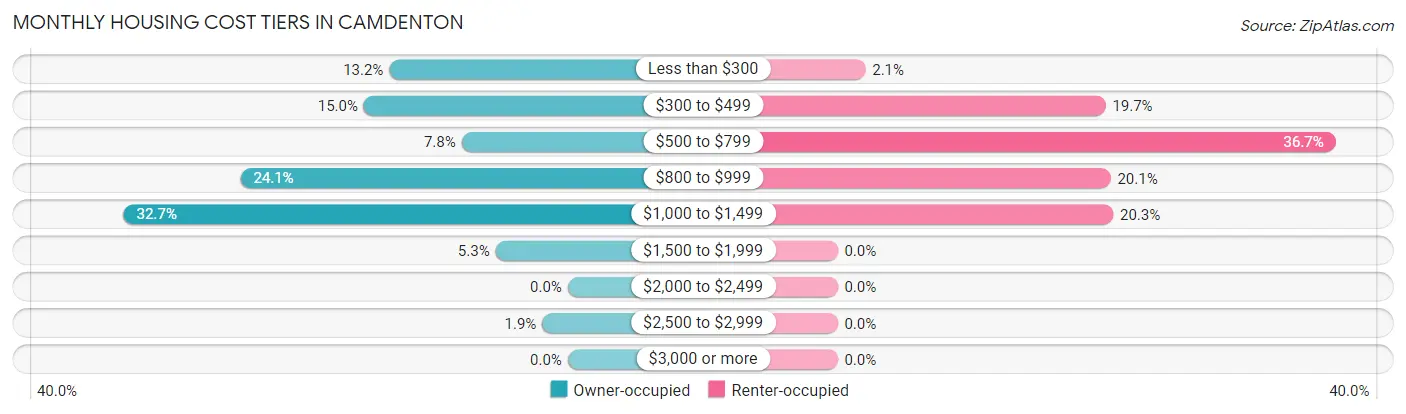
| Monthly Cost | Owner-occupied | Renter-occupied |
| Less than $300 | 84 (13.2%) | 11 (2.1%) |
| $300 to $499 | 96 (15.0%) | 106 (19.7%) |
| $500 to $799 | 50 (7.8%) | 197 (36.7%) |
| $800 to $999 | 154 (24.1%) | 108 (20.1%) |
| $1,000 to $1,499 | 209 (32.7%) | 109 (20.3%) |
| $1,500 to $1,999 | 34 (5.3%) | 0 (0.0%) |
| $2,000 to $2,499 | 0 (0.0%) | 0 (0.0%) |
| $2,500 to $2,999 | 12 (1.9%) | 0 (0.0%) |
| $3,000 or more | 0 (0.0%) | 0 (0.0%) |
| Total | 639 (100.0%) | 537 (100.0%) |
Physical Housing Characteristics in Camdenton
Housing Structures in Camdenton
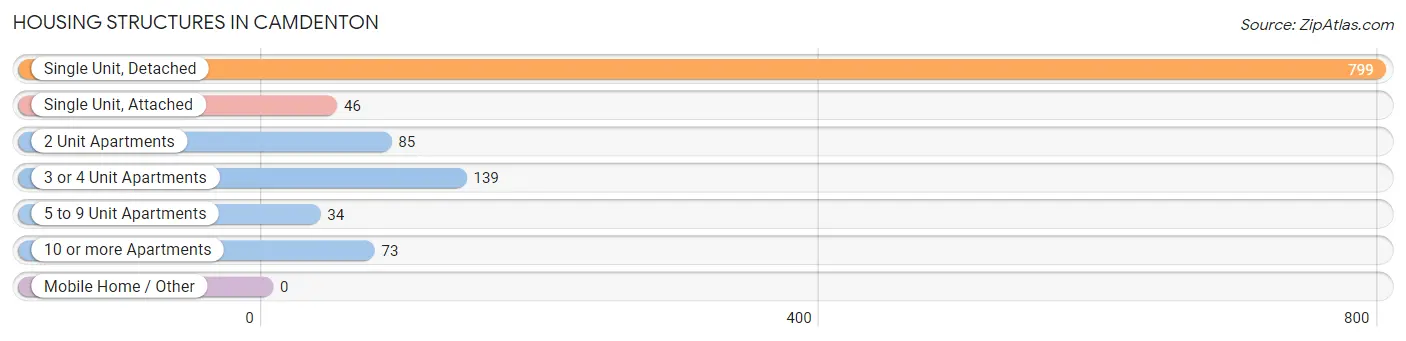
| Structure Type | # Housing Units | % Housing Units |
| Single Unit, Detached | 799 | 67.9% |
| Single Unit, Attached | 46 | 3.9% |
| 2 Unit Apartments | 85 | 7.2% |
| 3 or 4 Unit Apartments | 139 | 11.8% |
| 5 to 9 Unit Apartments | 34 | 2.9% |
| 10 or more Apartments | 73 | 6.2% |
| Mobile Home / Other | 0 | 0.0% |
| Total | 1,176 | 100.0% |
Housing Structures by Occupancy in Camdenton
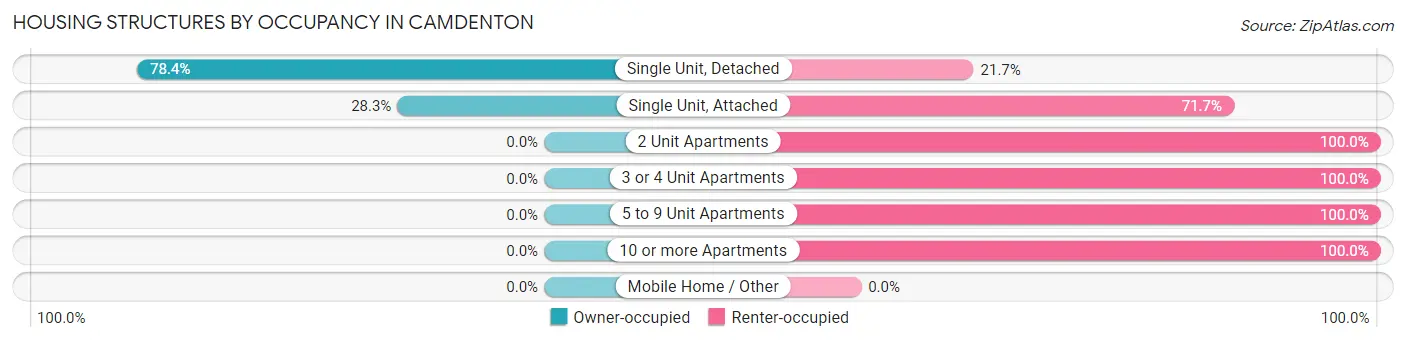
| Structure Type | Owner-occupied | Renter-occupied |
| Single Unit, Detached | 626 (78.3%) | 173 (21.6%) |
| Single Unit, Attached | 13 (28.3%) | 33 (71.7%) |
| 2 Unit Apartments | 0 (0.0%) | 85 (100.0%) |
| 3 or 4 Unit Apartments | 0 (0.0%) | 139 (100.0%) |
| 5 to 9 Unit Apartments | 0 (0.0%) | 34 (100.0%) |
| 10 or more Apartments | 0 (0.0%) | 73 (100.0%) |
| Mobile Home / Other | 0 (0.0%) | 0 (0.0%) |
| Total | 639 (54.3%) | 537 (45.7%) |
Housing Structures by Number of Rooms in Camdenton
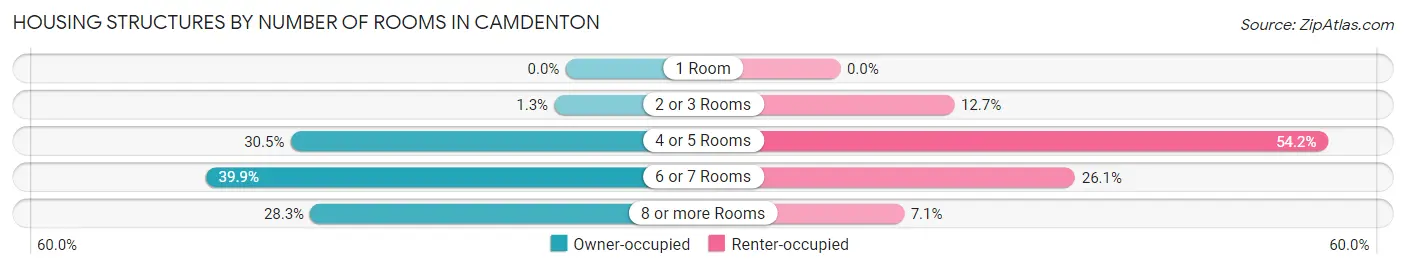
| Number of Rooms | Owner-occupied | Renter-occupied |
| 1 Room | 0 (0.0%) | 0 (0.0%) |
| 2 or 3 Rooms | 8 (1.3%) | 68 (12.7%) |
| 4 or 5 Rooms | 195 (30.5%) | 291 (54.2%) |
| 6 or 7 Rooms | 255 (39.9%) | 140 (26.1%) |
| 8 or more Rooms | 181 (28.3%) | 38 (7.1%) |
| Total | 639 (100.0%) | 537 (100.0%) |
Housing Structure by Heating Type in Camdenton
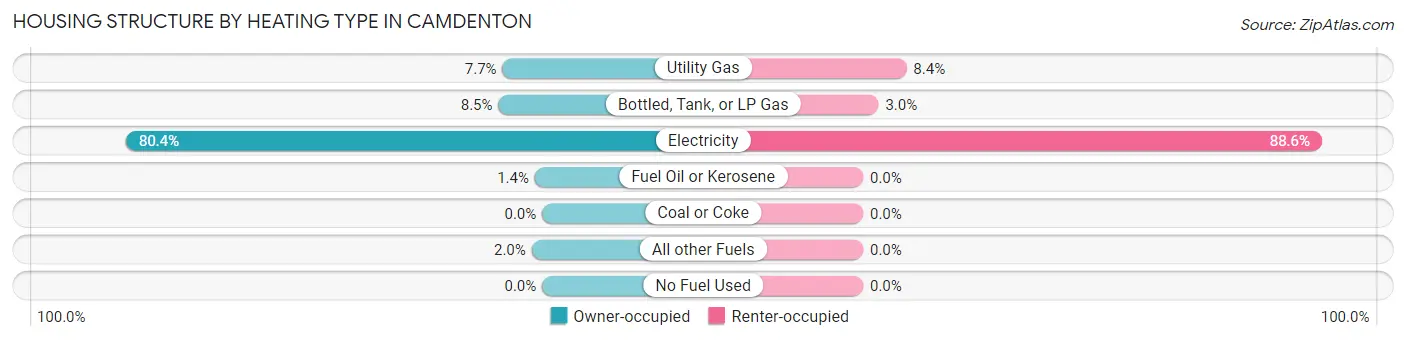
| Heating Type | Owner-occupied | Renter-occupied |
| Utility Gas | 49 (7.7%) | 45 (8.4%) |
| Bottled, Tank, or LP Gas | 54 (8.5%) | 16 (3.0%) |
| Electricity | 514 (80.4%) | 476 (88.6%) |
| Fuel Oil or Kerosene | 9 (1.4%) | 0 (0.0%) |
| Coal or Coke | 0 (0.0%) | 0 (0.0%) |
| All other Fuels | 13 (2.0%) | 0 (0.0%) |
| No Fuel Used | 0 (0.0%) | 0 (0.0%) |
| Total | 639 (100.0%) | 537 (100.0%) |
Household Vehicle Usage in Camdenton
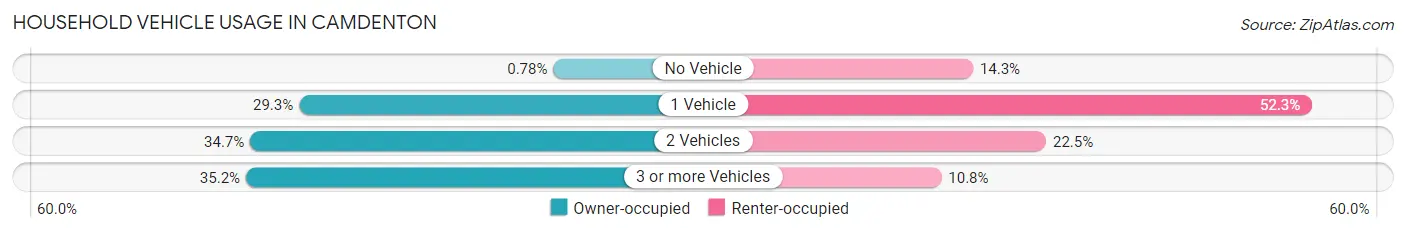
| Vehicles per Household | Owner-occupied | Renter-occupied |
| No Vehicle | 5 (0.8%) | 77 (14.3%) |
| 1 Vehicle | 187 (29.3%) | 281 (52.3%) |
| 2 Vehicles | 222 (34.7%) | 121 (22.5%) |
| 3 or more Vehicles | 225 (35.2%) | 58 (10.8%) |
| Total | 639 (100.0%) | 537 (100.0%) |
Real Estate & Mortgages in Camdenton
Real Estate and Mortgage Overview in Camdenton
| Characteristic | Without Mortgage | With Mortgage |
| Housing Units | 214 | 425 |
| Median Property Value | $137,200 | $170,000 |
| Median Household Income | $32,500 | $29 |
| Monthly Housing Costs | $338 | $0 |
| Real Estate Taxes | $756 | $0 |
Property Value by Mortgage Status in Camdenton
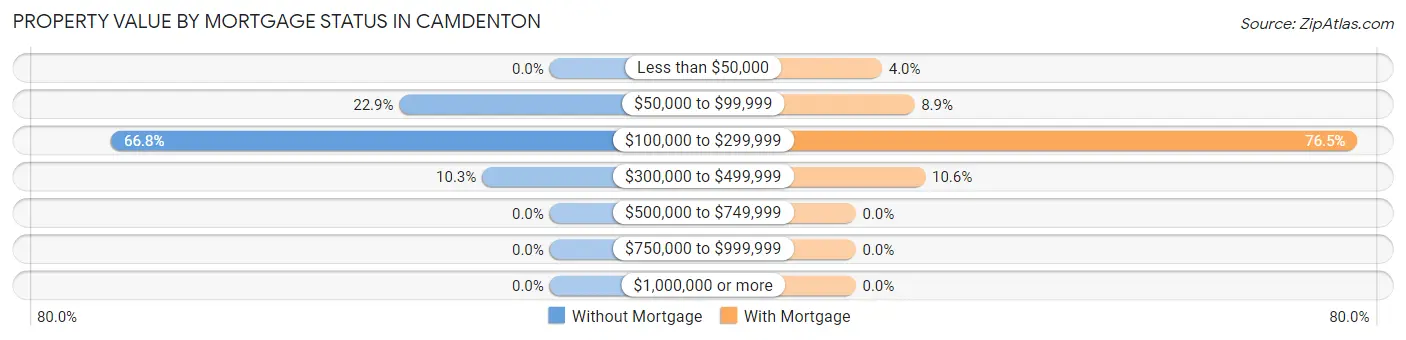
| Property Value | Without Mortgage | With Mortgage |
| Less than $50,000 | 0 (0.0%) | 17 (4.0%) |
| $50,000 to $99,999 | 49 (22.9%) | 38 (8.9%) |
| $100,000 to $299,999 | 143 (66.8%) | 325 (76.5%) |
| $300,000 to $499,999 | 22 (10.3%) | 45 (10.6%) |
| $500,000 to $749,999 | 0 (0.0%) | 0 (0.0%) |
| $750,000 to $999,999 | 0 (0.0%) | 0 (0.0%) |
| $1,000,000 or more | 0 (0.0%) | 0 (0.0%) |
| Total | 214 (100.0%) | 425 (100.0%) |
Household Income by Mortgage Status in Camdenton
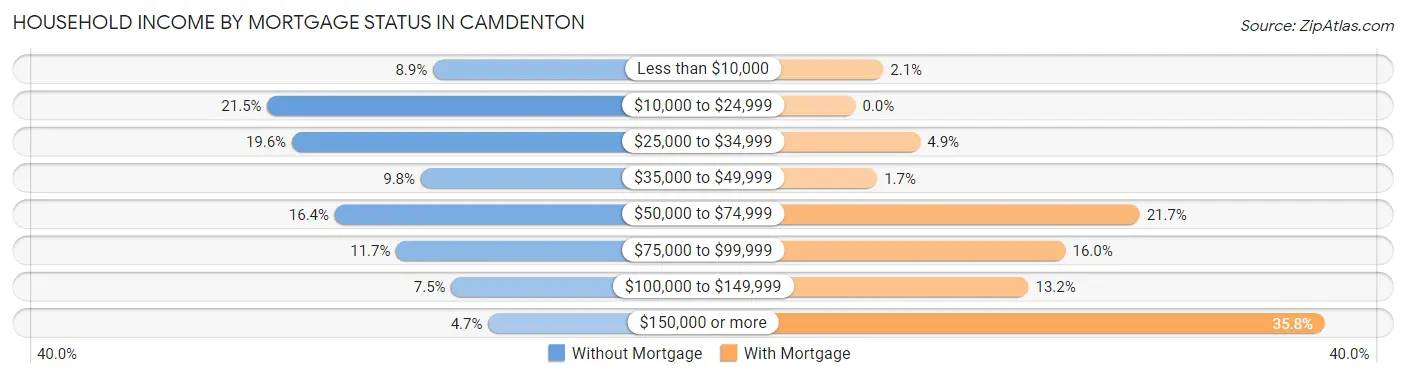
| Household Income | Without Mortgage | With Mortgage |
| Less than $10,000 | 19 (8.9%) | 9 (2.1%) |
| $10,000 to $24,999 | 46 (21.5%) | 0 (0.0%) |
| $25,000 to $34,999 | 42 (19.6%) | 21 (4.9%) |
| $35,000 to $49,999 | 21 (9.8%) | 7 (1.7%) |
| $50,000 to $74,999 | 35 (16.4%) | 92 (21.6%) |
| $75,000 to $99,999 | 25 (11.7%) | 68 (16.0%) |
| $100,000 to $149,999 | 16 (7.5%) | 56 (13.2%) |
| $150,000 or more | 10 (4.7%) | 152 (35.8%) |
| Total | 214 (100.0%) | 425 (100.0%) |
Property Value to Household Income Ratio in Camdenton
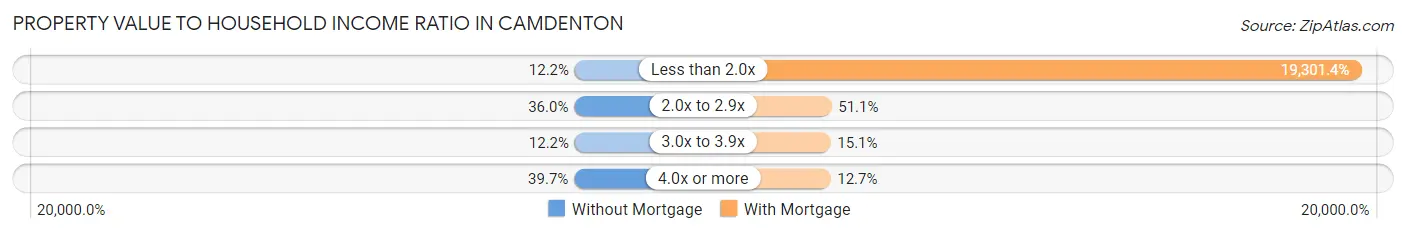
| Value-to-Income Ratio | Without Mortgage | With Mortgage |
| Less than 2.0x | 26 (12.1%) | 82,031 (19,301.4%) |
| 2.0x to 2.9x | 77 (36.0%) | 217 (51.1%) |
| 3.0x to 3.9x | 26 (12.1%) | 64 (15.1%) |
| 4.0x or more | 85 (39.7%) | 54 (12.7%) |
| Total | 214 (100.0%) | 425 (100.0%) |
Real Estate Taxes by Mortgage Status in Camdenton
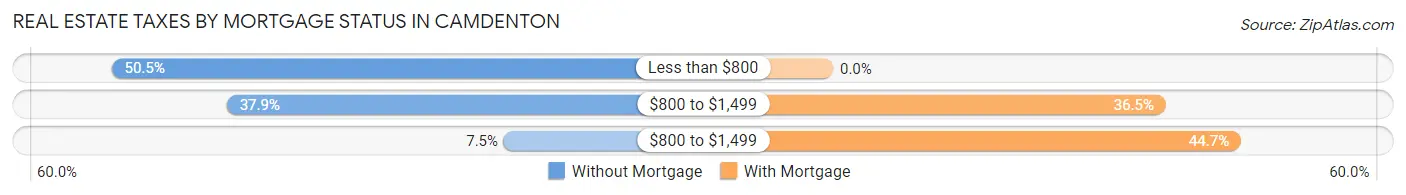
| Property Taxes | Without Mortgage | With Mortgage |
| Less than $800 | 108 (50.5%) | 0 (0.0%) |
| $800 to $1,499 | 81 (37.9%) | 155 (36.5%) |
| $800 to $1,499 | 16 (7.5%) | 190 (44.7%) |
| Total | 214 (100.0%) | 425 (100.0%) |
Health & Disability in Camdenton
Health Insurance Coverage by Age in Camdenton
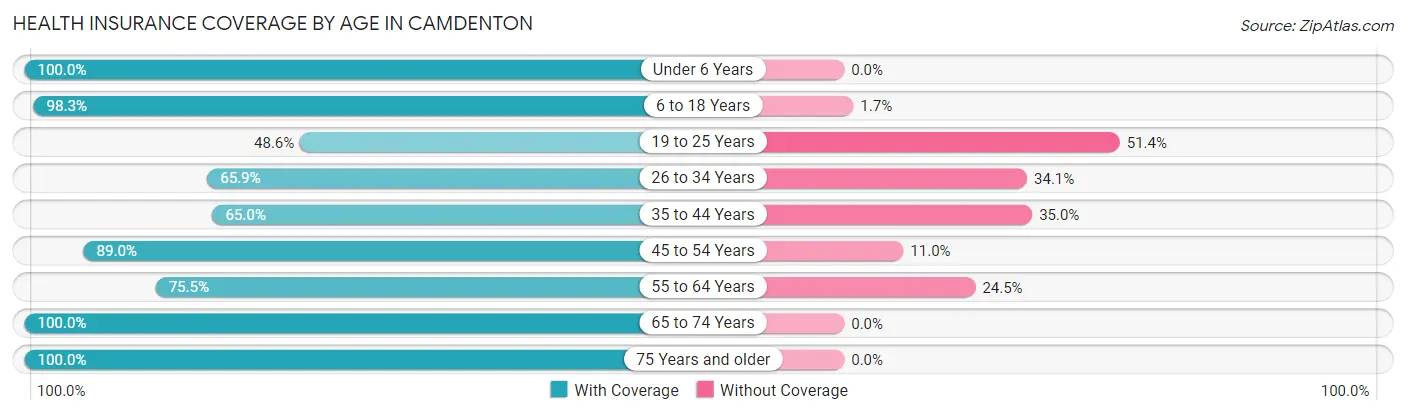
| Age Bracket | With Coverage | Without Coverage |
| Under 6 Years | 374 (100.0%) | 0 (0.0%) |
| 6 to 18 Years | 637 (98.3%) | 11 (1.7%) |
| 19 to 25 Years | 176 (48.6%) | 186 (51.4%) |
| 26 to 34 Years | 435 (65.9%) | 225 (34.1%) |
| 35 to 44 Years | 254 (65.0%) | 137 (35.0%) |
| 45 to 54 Years | 428 (89.0%) | 53 (11.0%) |
| 55 to 64 Years | 315 (75.5%) | 102 (24.5%) |
| 65 to 74 Years | 238 (100.0%) | 0 (0.0%) |
| 75 Years and older | 266 (100.0%) | 0 (0.0%) |
| Total | 3,123 (81.4%) | 714 (18.6%) |
Health Insurance Coverage by Citizenship Status in Camdenton
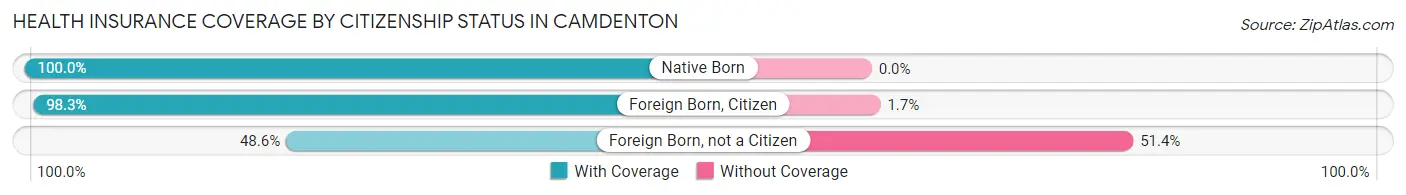
| Citizenship Status | With Coverage | Without Coverage |
| Native Born | 374 (100.0%) | 0 (0.0%) |
| Foreign Born, Citizen | 637 (98.3%) | 11 (1.7%) |
| Foreign Born, not a Citizen | 176 (48.6%) | 186 (51.4%) |
Health Insurance Coverage by Household Income in Camdenton
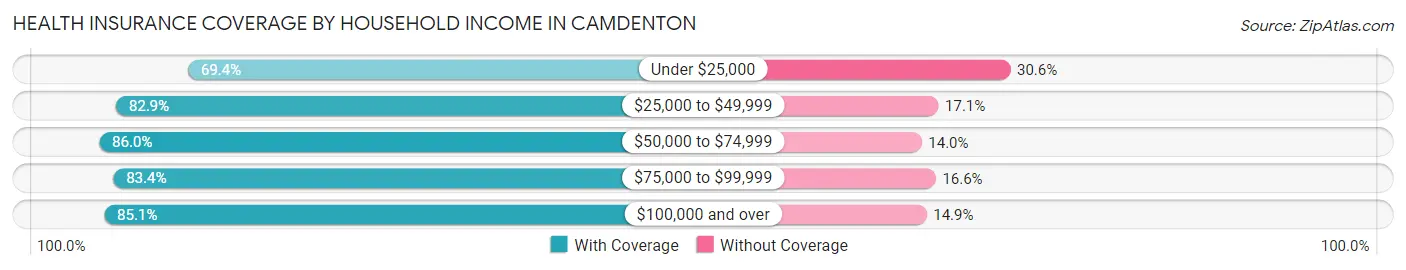
| Household Income | With Coverage | Without Coverage |
| Under $25,000 | 513 (69.4%) | 226 (30.6%) |
| $25,000 to $49,999 | 964 (82.9%) | 199 (17.1%) |
| $50,000 to $74,999 | 468 (86.0%) | 76 (14.0%) |
| $75,000 to $99,999 | 251 (83.4%) | 50 (16.6%) |
| $100,000 and over | 925 (85.1%) | 162 (14.9%) |
Public vs Private Health Insurance Coverage by Age in Camdenton
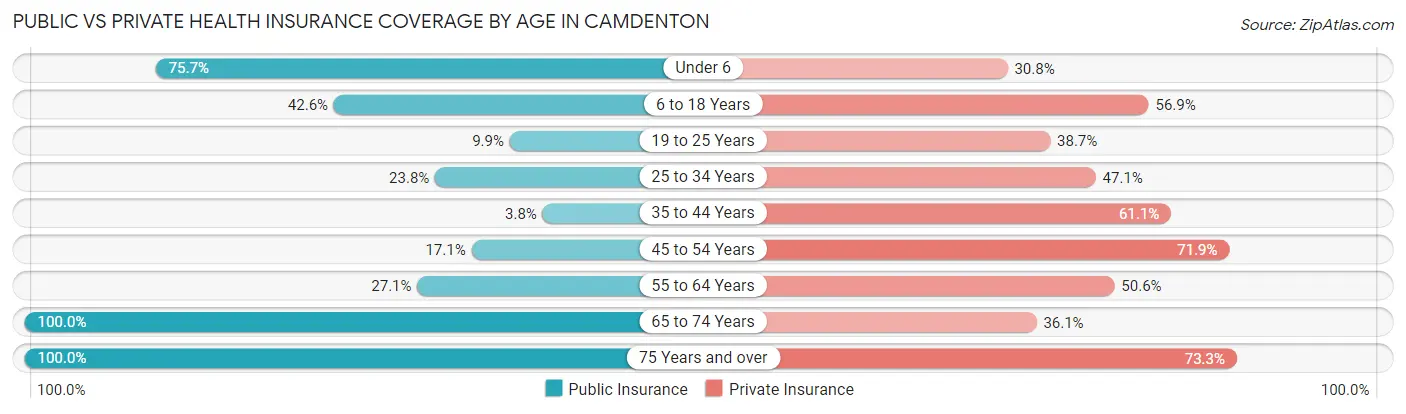
| Age Bracket | Public Insurance | Private Insurance |
| Under 6 | 283 (75.7%) | 115 (30.7%) |
| 6 to 18 Years | 276 (42.6%) | 369 (56.9%) |
| 19 to 25 Years | 36 (9.9%) | 140 (38.7%) |
| 25 to 34 Years | 157 (23.8%) | 311 (47.1%) |
| 35 to 44 Years | 15 (3.8%) | 239 (61.1%) |
| 45 to 54 Years | 82 (17.1%) | 346 (71.9%) |
| 55 to 64 Years | 113 (27.1%) | 211 (50.6%) |
| 65 to 74 Years | 238 (100.0%) | 86 (36.1%) |
| 75 Years and over | 266 (100.0%) | 195 (73.3%) |
| Total | 1,466 (38.2%) | 2,012 (52.4%) |
Disability Status by Sex by Age in Camdenton
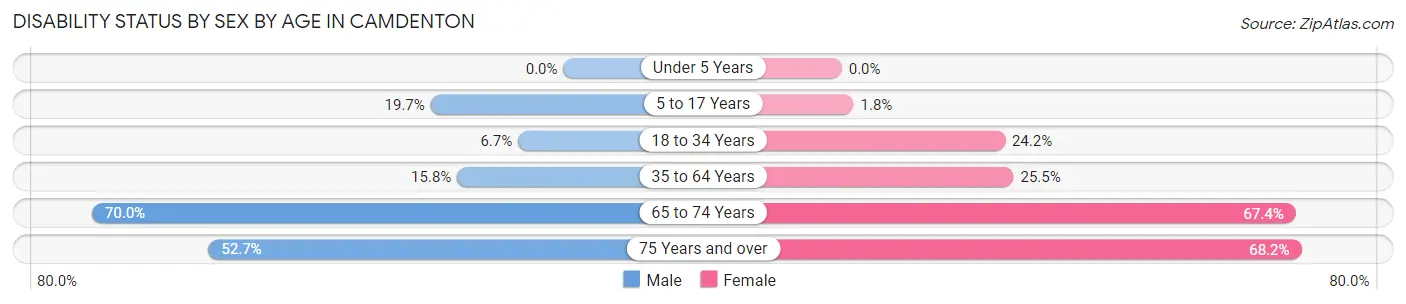
| Age Bracket | Male | Female |
| Under 5 Years | 0 (0.0%) | 0 (0.0%) |
| 5 to 17 Years | 83 (19.7%) | 5 (1.8%) |
| 18 to 34 Years | 34 (6.7%) | 141 (24.2%) |
| 35 to 64 Years | 100 (15.8%) | 167 (25.5%) |
| 65 to 74 Years | 70 (70.0%) | 93 (67.4%) |
| 75 Years and over | 39 (52.7%) | 131 (68.2%) |
Disability Class by Sex by Age in Camdenton
Disability Class: Hearing Difficulty
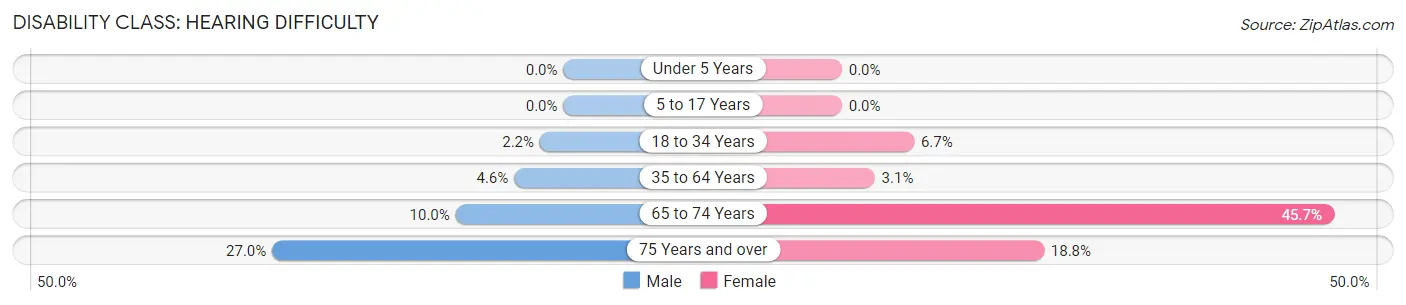
| Age Bracket | Male | Female |
| Under 5 Years | 0 (0.0%) | 0 (0.0%) |
| 5 to 17 Years | 0 (0.0%) | 0 (0.0%) |
| 18 to 34 Years | 11 (2.2%) | 39 (6.7%) |
| 35 to 64 Years | 29 (4.6%) | 20 (3.0%) |
| 65 to 74 Years | 10 (10.0%) | 63 (45.7%) |
| 75 Years and over | 20 (27.0%) | 36 (18.8%) |
Disability Class: Vision Difficulty
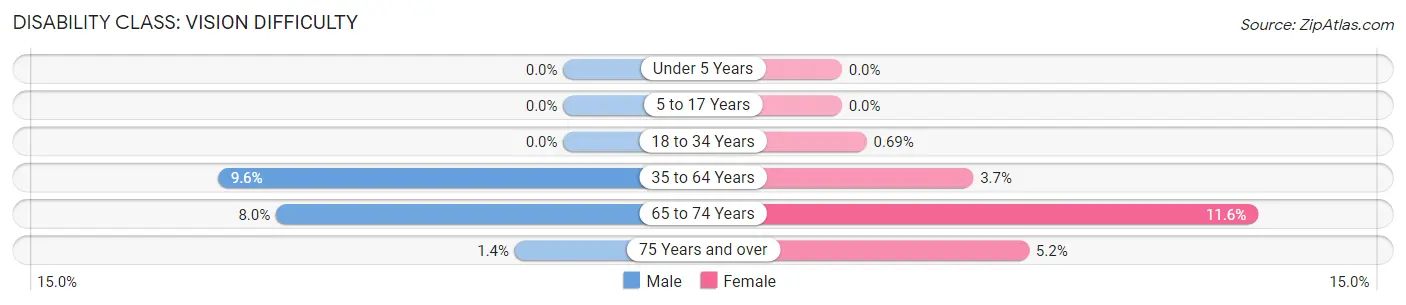
| Age Bracket | Male | Female |
| Under 5 Years | 0 (0.0%) | 0 (0.0%) |
| 5 to 17 Years | 0 (0.0%) | 0 (0.0%) |
| 18 to 34 Years | 0 (0.0%) | 4 (0.7%) |
| 35 to 64 Years | 61 (9.6%) | 24 (3.7%) |
| 65 to 74 Years | 8 (8.0%) | 16 (11.6%) |
| 75 Years and over | 1 (1.3%) | 10 (5.2%) |
Disability Class: Cognitive Difficulty
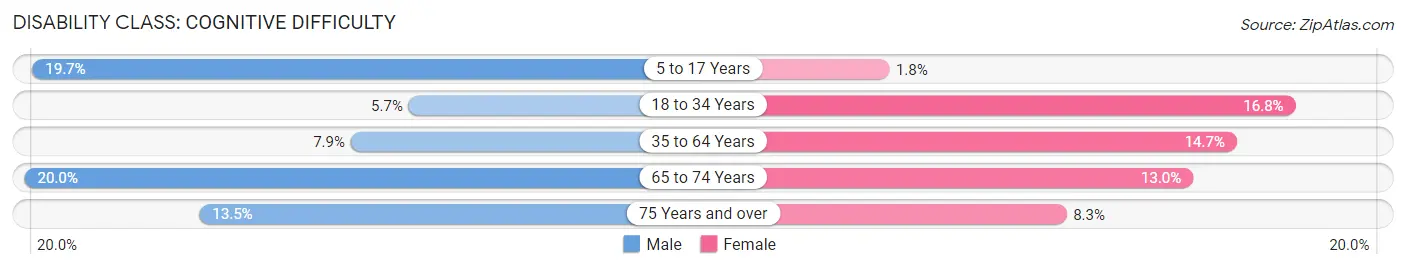
| Age Bracket | Male | Female |
| 5 to 17 Years | 83 (19.7%) | 5 (1.8%) |
| 18 to 34 Years | 29 (5.7%) | 98 (16.8%) |
| 35 to 64 Years | 50 (7.9%) | 96 (14.7%) |
| 65 to 74 Years | 20 (20.0%) | 18 (13.0%) |
| 75 Years and over | 10 (13.5%) | 16 (8.3%) |
Disability Class: Ambulatory Difficulty
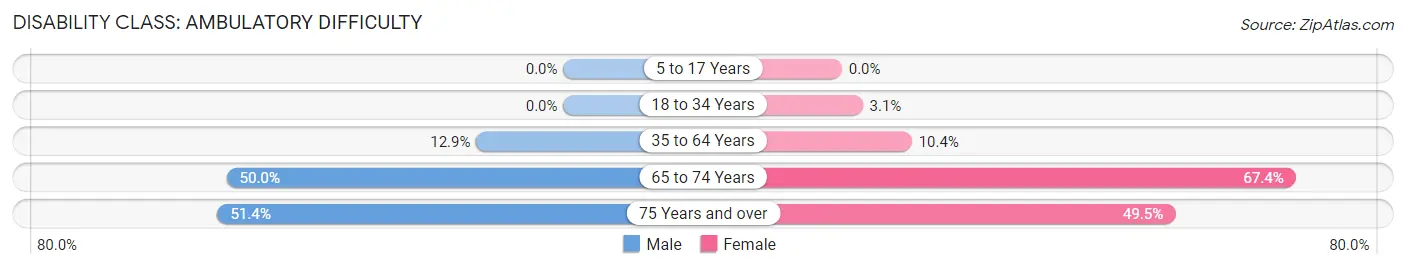
| Age Bracket | Male | Female |
| 5 to 17 Years | 0 (0.0%) | 0 (0.0%) |
| 18 to 34 Years | 0 (0.0%) | 18 (3.1%) |
| 35 to 64 Years | 82 (12.9%) | 68 (10.4%) |
| 65 to 74 Years | 50 (50.0%) | 93 (67.4%) |
| 75 Years and over | 38 (51.3%) | 95 (49.5%) |
Disability Class: Self-Care Difficulty
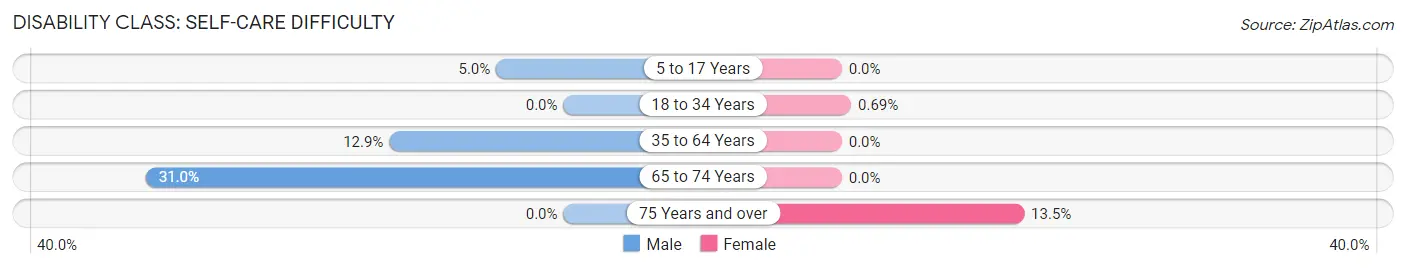
| Age Bracket | Male | Female |
| 5 to 17 Years | 21 (5.0%) | 0 (0.0%) |
| 18 to 34 Years | 0 (0.0%) | 4 (0.7%) |
| 35 to 64 Years | 82 (12.9%) | 0 (0.0%) |
| 65 to 74 Years | 31 (31.0%) | 0 (0.0%) |
| 75 Years and over | 0 (0.0%) | 26 (13.5%) |
Technology Access in Camdenton
Computing Device Access in Camdenton
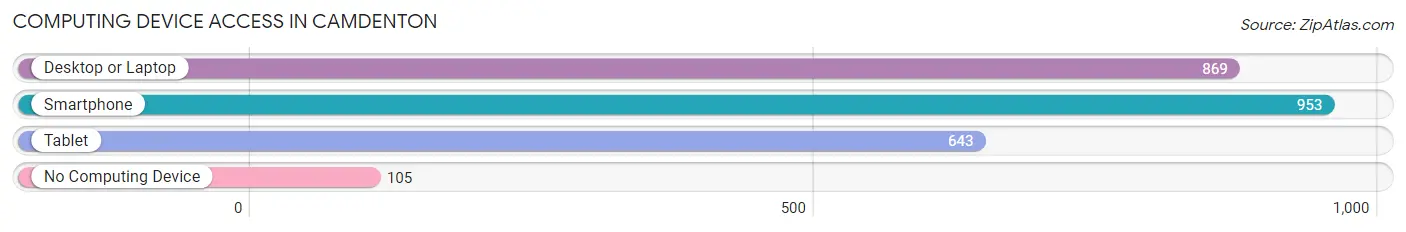
| Device Type | # Households | % Households |
| Desktop or Laptop | 869 | 73.9% |
| Smartphone | 953 | 81.0% |
| Tablet | 643 | 54.7% |
| No Computing Device | 105 | 8.9% |
| Total | 1,176 | 100.0% |
Internet Access in Camdenton
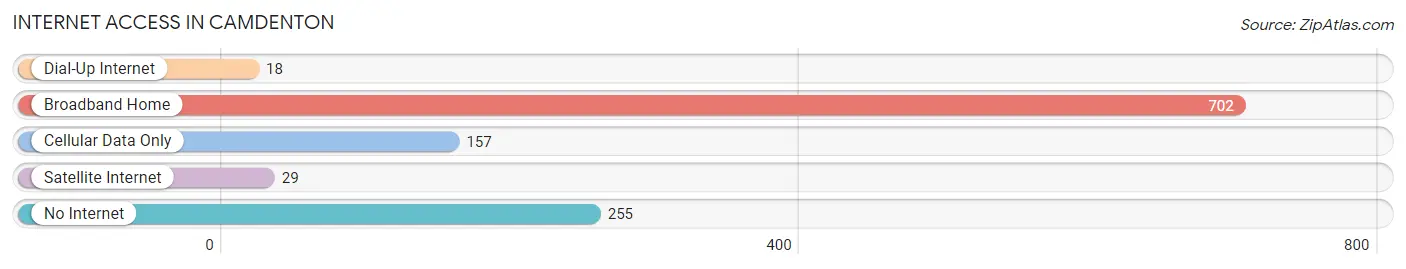
| Internet Type | # Households | % Households |
| Dial-Up Internet | 18 | 1.5% |
| Broadband Home | 702 | 59.7% |
| Cellular Data Only | 157 | 13.4% |
| Satellite Internet | 29 | 2.5% |
| No Internet | 255 | 21.7% |
| Total | 1,176 | 100.0% |
Camdenton Summary
Camdenton, Missouri is a small city located in Camden County, Missouri. It is situated on the banks of the Lake of the Ozarks, and is the county seat of Camden County. The city has a population of 4,741 as of the 2010 census.
History
The area that is now Camdenton was first settled in the early 1800s by settlers from Kentucky and Tennessee. The first post office was established in 1837, and the town was officially incorporated in 1855. The city was named after a local settler, John Camden, who had a large farm in the area.
The city was a popular tourist destination in the late 19th and early 20th centuries, and was home to several resorts and hotels. The city was also home to a large number of summer homes, many of which are still standing today.
Geography
Camdenton is located in the Ozark Mountains region of Missouri. The city is situated on the banks of the Lake of the Ozarks, and is surrounded by rolling hills and forests. The city is located approximately 80 miles south of St. Louis and 60 miles north of Springfield.
The climate in Camdenton is humid subtropical, with hot, humid summers and mild winters. The average annual temperature is around 57 degrees Fahrenheit, and the average annual precipitation is around 40 inches.
Economy
The economy of Camdenton is largely based on tourism and recreation. The city is home to several resorts and hotels, as well as a number of marinas and boat docks. The city is also home to several manufacturing companies, including a large furniture factory.
The city is also home to several retail stores, restaurants, and other businesses. The city is served by the Camdenton Municipal Airport, which offers flights to St. Louis and other nearby cities.
Demographics
As of the 2010 census, the population of Camdenton was 4,741. The racial makeup of the city was 95.3% White, 0.7% African American, 0.3% Native American, 0.7% Asian, 0.1% Pacific Islander, 0.7% from other races, and 2.0% from two or more races. Hispanic or Latino of any race were 2.2% of the population.
The median income for a household in the city was $37,917, and the median income for a family was $45,938. The per capita income for the city was $20,945. About 11.2% of families and 14.2% of the population were below the poverty line, including 19.2% of those under age 18 and 8.2% of those age 65 or over.
Common Questions
What is Per Capita Income in Camdenton?
Per Capita income in Camdenton is $24,186.
What is the Median Family Income in Camdenton?
Median Family Income in Camdenton is $56,250.
What is the Median Household income in Camdenton?
Median Household Income in Camdenton is $45,833.
What is Income or Wage Gap in Camdenton?
Income or Wage Gap in Camdenton is 41.9%.
Women in Camdenton earn 58.1 cents for every dollar earned by a man.
What is Inequality or Gini Index in Camdenton?
Inequality or Gini Index in Camdenton is 0.45.
What is the Total Population of Camdenton?
Total Population of Camdenton is 3,979.
What is the Total Male Population of Camdenton?
Total Male Population of Camdenton is 1,966.
What is the Total Female Population of Camdenton?
Total Female Population of Camdenton is 2,013.
What is the Ratio of Males per 100 Females in Camdenton?
There are 97.67 Males per 100 Females in Camdenton.
What is the Ratio of Females per 100 Males in Camdenton?
There are 102.39 Females per 100 Males in Camdenton.
What is the Median Population Age in Camdenton?
Median Population Age in Camdenton is 32.8 Years.
What is the Average Family Size in Camdenton
Average Family Size in Camdenton is 4.1 People.
What is the Average Household Size in Camdenton
Average Household Size in Camdenton is 3.3 People.
How Large is the Labor Force in Camdenton?
There are 1,916 People in the Labor Forcein in Camdenton.
What is the Percentage of People in the Labor Force in Camdenton?
63.1% of People are in the Labor Force in Camdenton.
What is the Unemployment Rate in Camdenton?
Unemployment Rate in Camdenton is 1.5%.