Cairo, MO Map & Demographics
Cairo Map
Cairo Overview
$30,034
PER CAPITA INCOME
$58,125
AVG FAMILY INCOME
$57,000
AVG HOUSEHOLD INCOME
26.2%
WAGE / INCOME GAP [ % ]
73.8¢/ $1
WAGE / INCOME GAP [ $ ]
0.32
INEQUALITY / GINI INDEX
242
TOTAL POPULATION
108
MALE POPULATION
134
FEMALE POPULATION
80.60
MALES / 100 FEMALES
124.07
FEMALES / 100 MALES
55.8
MEDIAN AGE
2.4
AVG FAMILY SIZE
2.1
AVG HOUSEHOLD SIZE
105
LABOR FORCE [ PEOPLE ]
49.5%
PERCENT IN LABOR FORCE
2.9%
UNEMPLOYMENT RATE
Cairo Zip Codes
Income in Cairo
Income Overview in Cairo
Per Capita Income in Cairo is $30,034, while median incomes of families and households are $58,125 and $57,000 respectively.
| Characteristic | Number | Measure |
| Per Capita Income | 242 | $30,034 |
| Median Family Income | 80 | $58,125 |
| Mean Family Income | 80 | $69,535 |
| Median Household Income | 116 | $57,000 |
| Mean Household Income | 116 | $62,672 |
| Income Deficit | 80 | $0 |
| Wage / Income Gap (%) | 242 | 26.21% |
| Wage / Income Gap ($) | 242 | 73.79¢ per $1 |
| Gini / Inequality Index | 242 | 0.32 |
Earnings by Sex in Cairo
Average Earnings in Cairo are $37,083, $41,786 for men and $30,833 for women, a difference of 26.2%.
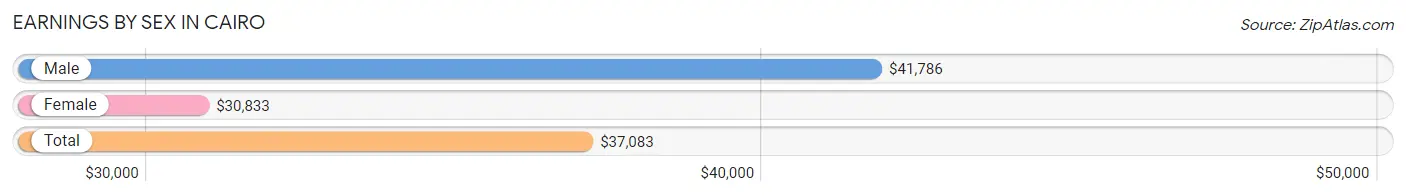
| Sex | Number | Average Earnings |
| Male | 52 (47.3%) | $41,786 |
| Female | 58 (52.7%) | $30,833 |
| Total | 110 (100.0%) | $37,083 |
Earnings by Sex by Income Bracket in Cairo
The most common earnings brackets in Cairo are $65,000 to $74,999 for men (10 | 19.2%) and $2,500 to $4,999 for women (9 | 15.5%).
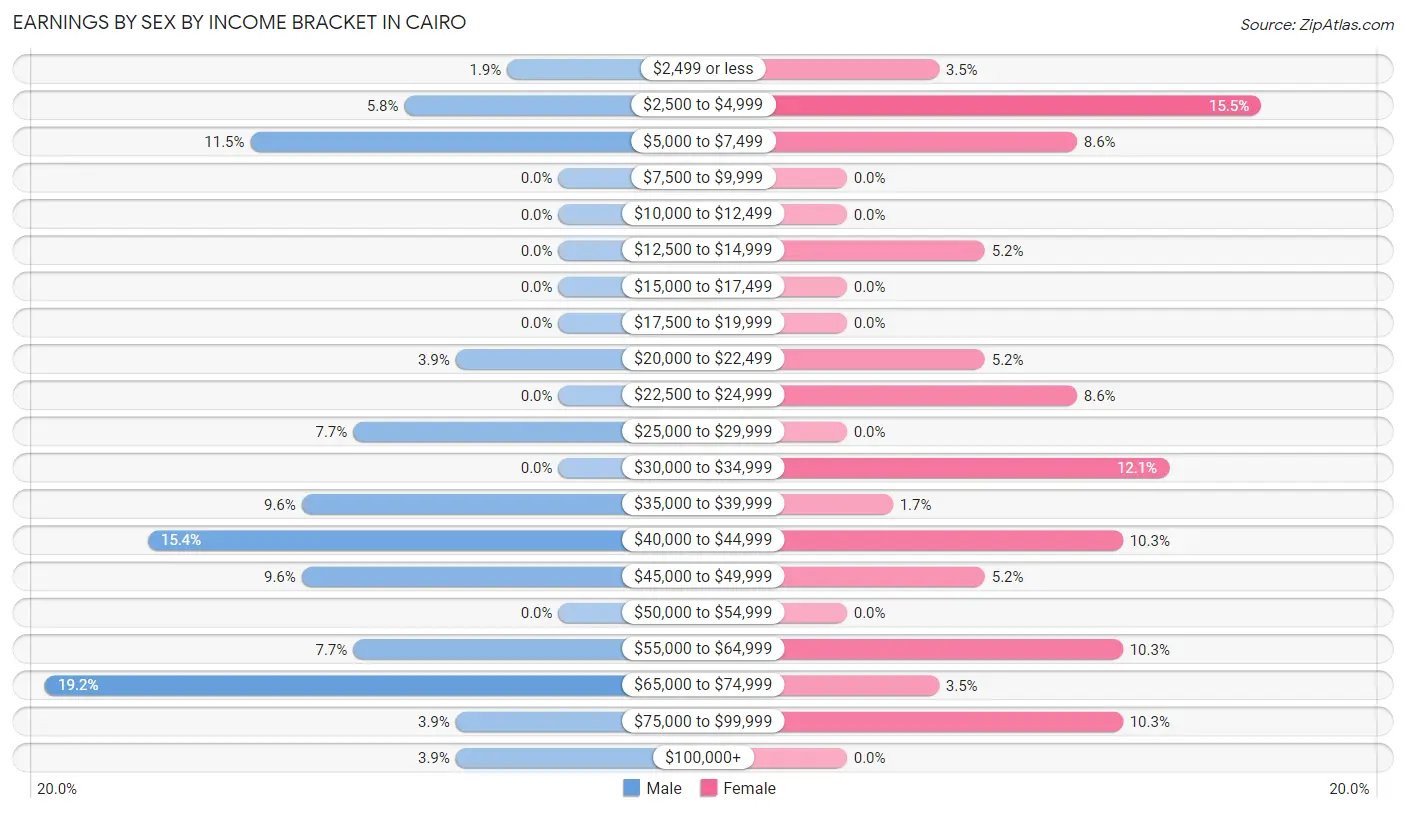
| Income | Male | Female |
| $2,499 or less | 1 (1.9%) | 2 (3.5%) |
| $2,500 to $4,999 | 3 (5.8%) | 9 (15.5%) |
| $5,000 to $7,499 | 6 (11.5%) | 5 (8.6%) |
| $7,500 to $9,999 | 0 (0.0%) | 0 (0.0%) |
| $10,000 to $12,499 | 0 (0.0%) | 0 (0.0%) |
| $12,500 to $14,999 | 0 (0.0%) | 3 (5.2%) |
| $15,000 to $17,499 | 0 (0.0%) | 0 (0.0%) |
| $17,500 to $19,999 | 0 (0.0%) | 0 (0.0%) |
| $20,000 to $22,499 | 2 (3.8%) | 3 (5.2%) |
| $22,500 to $24,999 | 0 (0.0%) | 5 (8.6%) |
| $25,000 to $29,999 | 4 (7.7%) | 0 (0.0%) |
| $30,000 to $34,999 | 0 (0.0%) | 7 (12.1%) |
| $35,000 to $39,999 | 5 (9.6%) | 1 (1.7%) |
| $40,000 to $44,999 | 8 (15.4%) | 6 (10.3%) |
| $45,000 to $49,999 | 5 (9.6%) | 3 (5.2%) |
| $50,000 to $54,999 | 0 (0.0%) | 0 (0.0%) |
| $55,000 to $64,999 | 4 (7.7%) | 6 (10.3%) |
| $65,000 to $74,999 | 10 (19.2%) | 2 (3.5%) |
| $75,000 to $99,999 | 2 (3.8%) | 6 (10.3%) |
| $100,000+ | 2 (3.8%) | 0 (0.0%) |
| Total | 52 (100.0%) | 58 (100.0%) |
Earnings by Sex by Educational Attainment in Cairo
Average earnings in Cairo are $41,607 for men and $40,000 for women, a difference of 3.9%. Men with an educational attainment of college or associate's degree enjoy the highest average annual earnings of $41,964, while those with high school diploma education earn the least with $36,500. Women with an educational attainment of high school diploma earn the most with the average annual earnings of $43,750, while those with college or associate's degree education have the smallest earnings of $31,250.
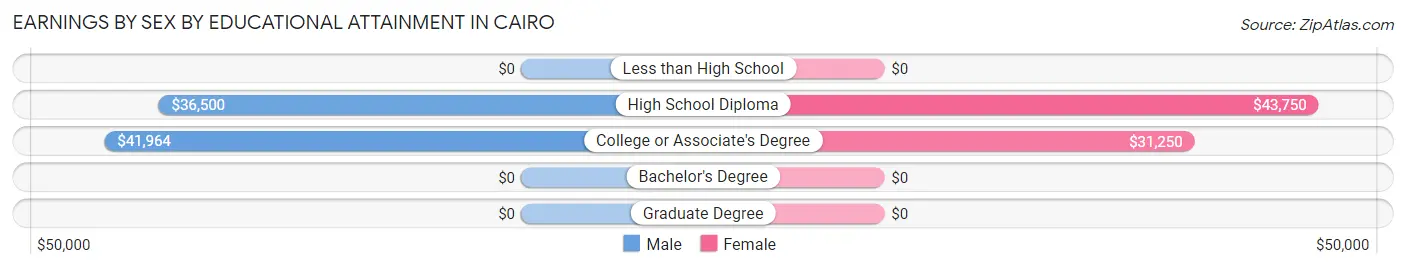
| Educational Attainment | Male Income | Female Income |
| Less than High School | - | - |
| High School Diploma | $36,500 | $43,750 |
| College or Associate's Degree | $41,964 | $31,250 |
| Bachelor's Degree | - | - |
| Graduate Degree | - | - |
| Total | $41,607 | $40,000 |
Family Income in Cairo
Family Income Brackets in Cairo
According to the Cairo family income data, there are 22 families falling into the $50,000 to $74,999 income range, which is the most common income bracket and makes up 27.5% of all families.
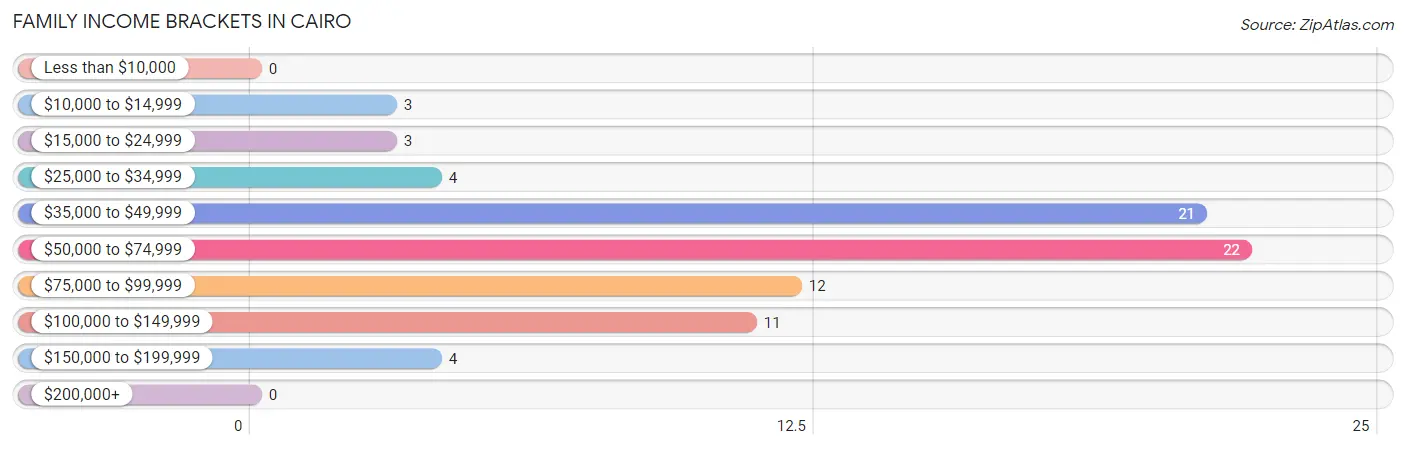
| Income Bracket | # Families | % Families |
| Less than $10,000 | 0 | 0.0% |
| $10,000 to $14,999 | 3 | 3.8% |
| $15,000 to $24,999 | 3 | 3.8% |
| $25,000 to $34,999 | 4 | 5.0% |
| $35,000 to $49,999 | 21 | 26.3% |
| $50,000 to $74,999 | 22 | 27.5% |
| $75,000 to $99,999 | 12 | 15.0% |
| $100,000 to $149,999 | 11 | 13.8% |
| $150,000 to $199,999 | 4 | 5.0% |
| $200,000+ | 0 | 0.0% |
Family Income by Famaliy Size in Cairo
2-person families (65 | 81.2%) account for the highest median family income in Cairo with $55,750 per family, while 2-person families (65 | 81.2%) have the highest median income of $27,875 per family member.
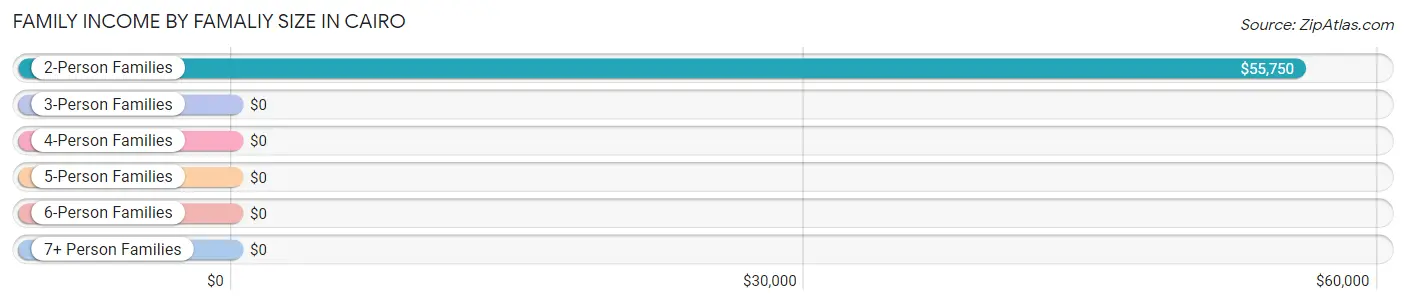
| Income Bracket | # Families | Median Income |
| 2-Person Families | 65 (81.2%) | $55,750 |
| 3-Person Families | 4 (5.0%) | $0 |
| 4-Person Families | 4 (5.0%) | $0 |
| 5-Person Families | 7 (8.7%) | $0 |
| 6-Person Families | 0 (0.0%) | $0 |
| 7+ Person Families | 0 (0.0%) | $0 |
| Total | 80 (100.0%) | $58,125 |
Family Income by Number of Earners in Cairo
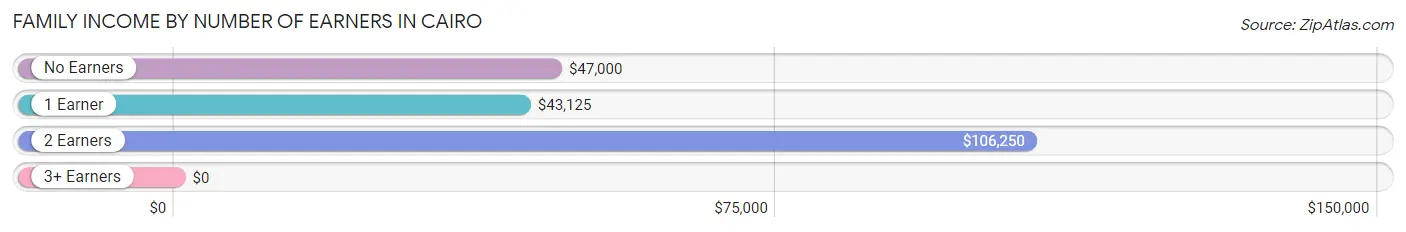
| Number of Earners | # Families | Median Income |
| No Earners | 28 (35.0%) | $47,000 |
| 1 Earner | 16 (20.0%) | $43,125 |
| 2 Earners | 29 (36.2%) | $106,250 |
| 3+ Earners | 7 (8.7%) | $0 |
| Total | 80 (100.0%) | $58,125 |
Household Income in Cairo
Household Income Brackets in Cairo
With 28 households falling in the category, the $50,000 to $74,999 income range is the most frequent in Cairo, accounting for 24.1% of all households.
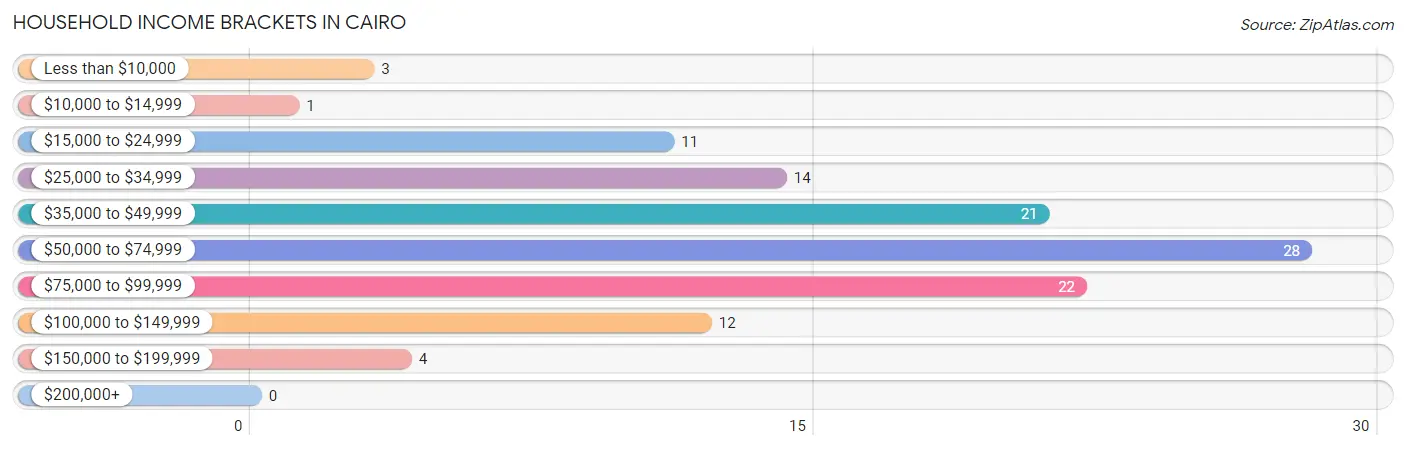
| Income Bracket | # Households | % Households |
| Less than $10,000 | 3 | 2.6% |
| $10,000 to $14,999 | 1 | 0.9% |
| $15,000 to $24,999 | 11 | 9.5% |
| $25,000 to $34,999 | 14 | 12.1% |
| $35,000 to $49,999 | 21 | 18.1% |
| $50,000 to $74,999 | 28 | 24.1% |
| $75,000 to $99,999 | 22 | 19.0% |
| $100,000 to $149,999 | 12 | 10.3% |
| $150,000 to $199,999 | 4 | 3.4% |
| $200,000+ | 0 | 0.0% |
Household Income by Householder Age in Cairo
The median household income in Cairo is $57,000, with the highest median household income of $70,625 found in the 45 to 64 years age bracket for the primary householder. A total of 58 households (50.0%) fall into this category. Meanwhile, the 15 to 24 years age bracket for the primary householder has the lowest median household income of $0, with 2 households (1.7%) in this group.
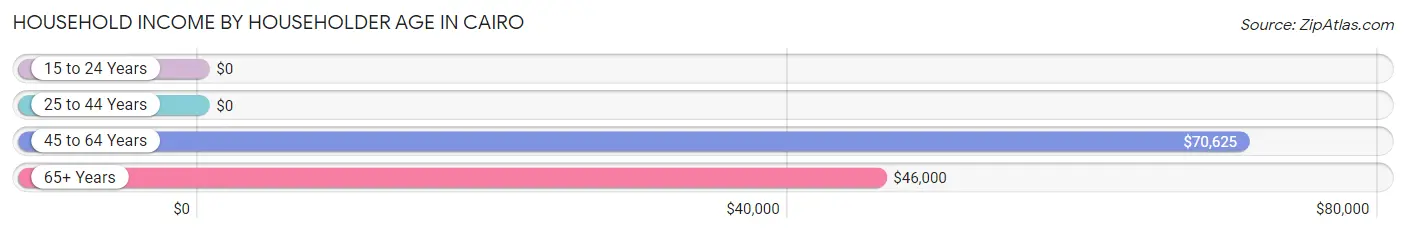
| Income Bracket | # Households | Median Income |
| 15 to 24 Years | 2 (1.7%) | $0 |
| 25 to 44 Years | 14 (12.1%) | $0 |
| 45 to 64 Years | 58 (50.0%) | $70,625 |
| 65+ Years | 42 (36.2%) | $46,000 |
| Total | 116 (100.0%) | $57,000 |
Poverty in Cairo
Income Below Poverty by Sex and Age in Cairo
With 3.7% poverty level for males and 9.0% for females among the residents of Cairo, 45 to 54 year old males and 6 to 11 year old females are the most vulnerable to poverty, with 4 males (16.7%) and 2 females (100.0%) in their respective age groups living below the poverty level.
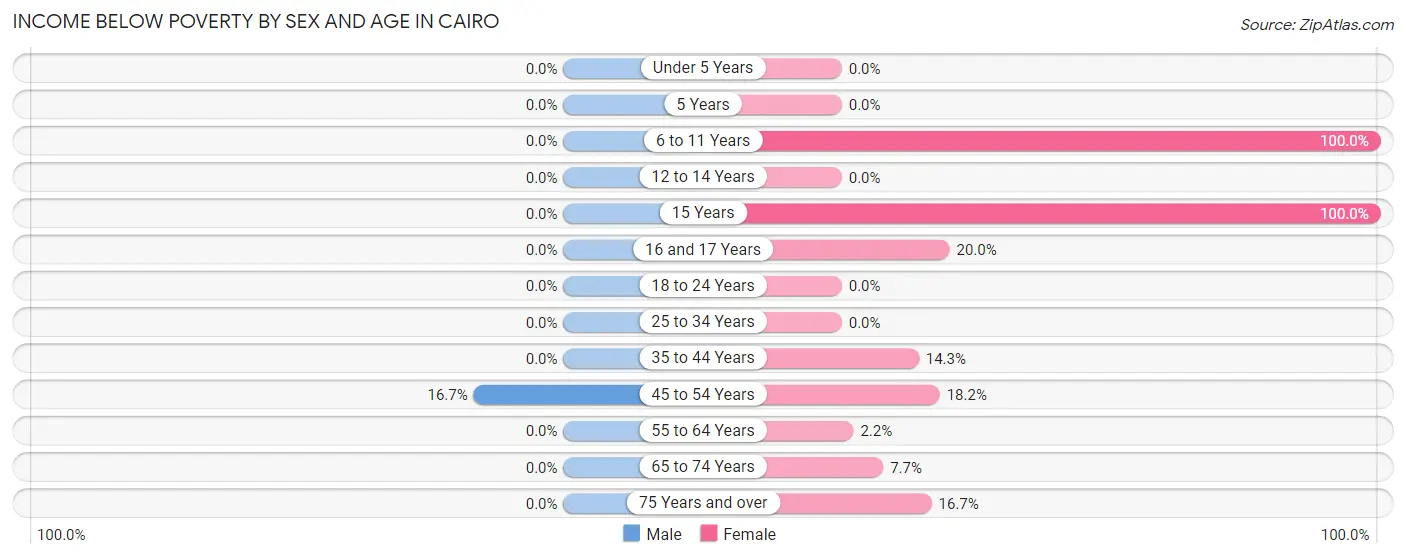
| Age Bracket | Male | Female |
| Under 5 Years | 0 (0.0%) | 0 (0.0%) |
| 5 Years | 0 (0.0%) | 0 (0.0%) |
| 6 to 11 Years | 0 (0.0%) | 2 (100.0%) |
| 12 to 14 Years | 0 (0.0%) | 0 (0.0%) |
| 15 Years | 0 (0.0%) | 1 (100.0%) |
| 16 and 17 Years | 0 (0.0%) | 2 (20.0%) |
| 18 to 24 Years | 0 (0.0%) | 0 (0.0%) |
| 25 to 34 Years | 0 (0.0%) | 0 (0.0%) |
| 35 to 44 Years | 0 (0.0%) | 1 (14.3%) |
| 45 to 54 Years | 4 (16.7%) | 2 (18.2%) |
| 55 to 64 Years | 0 (0.0%) | 1 (2.2%) |
| 65 to 74 Years | 0 (0.0%) | 1 (7.7%) |
| 75 Years and over | 0 (0.0%) | 2 (16.7%) |
| Total | 4 (3.7%) | 12 (9.0%) |
Income Above Poverty by Sex and Age in Cairo
According to the poverty statistics in Cairo, males aged under 5 years and females aged under 5 years are the age groups that are most secure financially, with 100.0% of males and 100.0% of females in these age groups living above the poverty line.
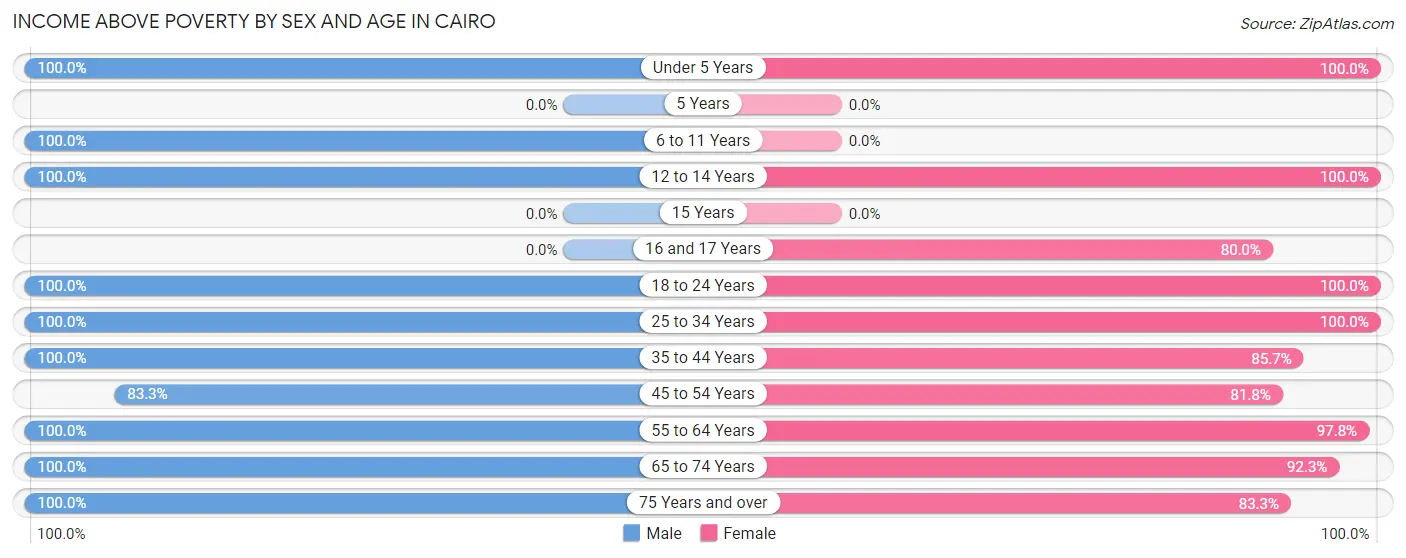
| Age Bracket | Male | Female |
| Under 5 Years | 6 (100.0%) | 7 (100.0%) |
| 5 Years | 0 (0.0%) | 0 (0.0%) |
| 6 to 11 Years | 5 (100.0%) | 0 (0.0%) |
| 12 to 14 Years | 3 (100.0%) | 6 (100.0%) |
| 15 Years | 0 (0.0%) | 0 (0.0%) |
| 16 and 17 Years | 0 (0.0%) | 8 (80.0%) |
| 18 to 24 Years | 5 (100.0%) | 11 (100.0%) |
| 25 to 34 Years | 1 (100.0%) | 8 (100.0%) |
| 35 to 44 Years | 6 (100.0%) | 6 (85.7%) |
| 45 to 54 Years | 20 (83.3%) | 9 (81.8%) |
| 55 to 64 Years | 26 (100.0%) | 45 (97.8%) |
| 65 to 74 Years | 21 (100.0%) | 12 (92.3%) |
| 75 Years and over | 11 (100.0%) | 10 (83.3%) |
| Total | 104 (96.3%) | 122 (91.0%) |
Income Below Poverty Among Married-Couple Families in Cairo
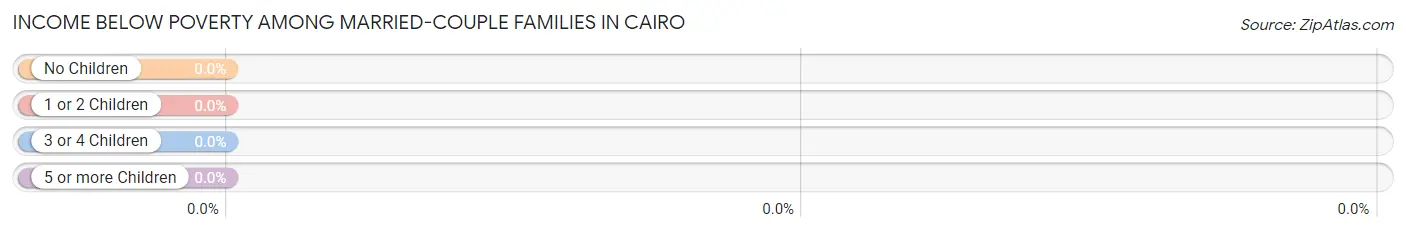
| Children | Above Poverty | Below Poverty |
| No Children | 54 (100.0%) | 0 (0.0%) |
| 1 or 2 Children | 6 (100.0%) | 0 (0.0%) |
| 3 or 4 Children | 0 (0.0%) | 0 (0.0%) |
| 5 or more Children | 0 (0.0%) | 0 (0.0%) |
| Total | 60 (100.0%) | 0 (0.0%) |
Income Below Poverty Among Single-Parent Households in Cairo
According to the poverty data in Cairo, 27.3% or 3 single-father households and 11.1% or 1 single-mother households are living below the poverty line. Among single-father households, those with 1 or 2 children have the highest poverty rate, with 3 households (75.0%) experiencing poverty. Likewise, among single-mother households, those with 3 or 4 children have the highest poverty rate, with 1 households (100.0%) falling below the poverty line.
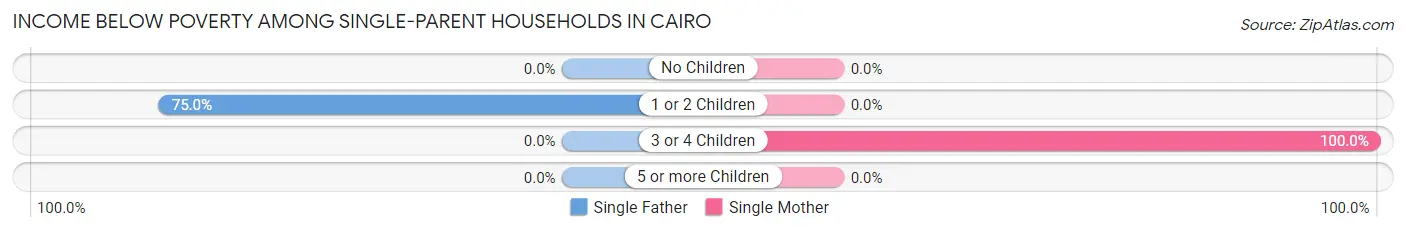
| Children | Single Father | Single Mother |
| No Children | 0 (0.0%) | 0 (0.0%) |
| 1 or 2 Children | 3 (75.0%) | 0 (0.0%) |
| 3 or 4 Children | 0 (0.0%) | 1 (100.0%) |
| 5 or more Children | 0 (0.0%) | 0 (0.0%) |
| Total | 3 (27.3%) | 1 (11.1%) |
Income Below Poverty Among Married-Couple vs Single-Parent Households in Cairo
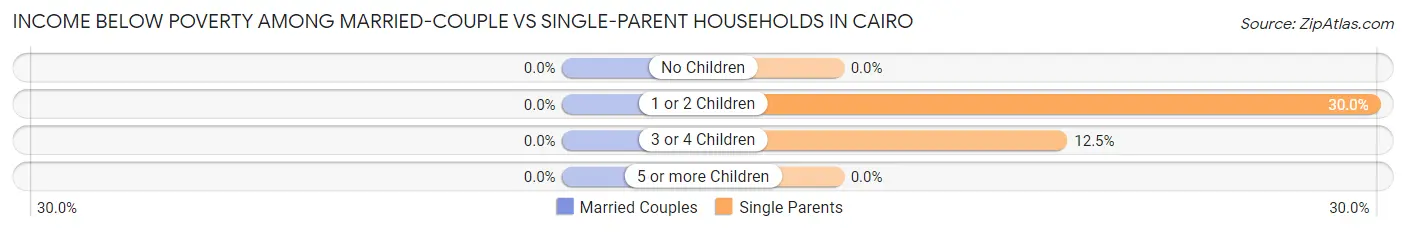
| Children | Married-Couple Families | Single-Parent Households |
| No Children | 0 (0.0%) | 0 (0.0%) |
| 1 or 2 Children | 0 (0.0%) | 3 (30.0%) |
| 3 or 4 Children | 0 (0.0%) | 1 (12.5%) |
| 5 or more Children | 0 (0.0%) | 0 (0.0%) |
| Total | 0 (0.0%) | 4 (20.0%) |
Race in Cairo
The most populous races in Cairo are White / Caucasian (237 | 97.9%), and Two or more Races (5 | 2.1%).
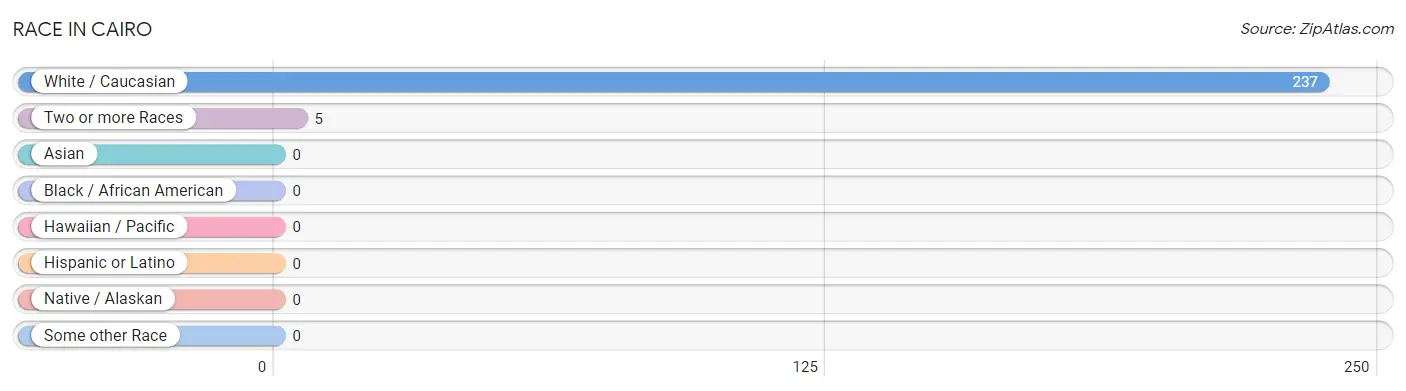
| Race | # Population | % Population |
| Asian | 0 | 0.0% |
| Black / African American | 0 | 0.0% |
| Hawaiian / Pacific | 0 | 0.0% |
| Hispanic or Latino | 0 | 0.0% |
| Native / Alaskan | 0 | 0.0% |
| White / Caucasian | 237 | 97.9% |
| Two or more Races | 5 | 2.1% |
| Some other Race | 0 | 0.0% |
| Total | 242 | 100.0% |
Ancestry in Cairo
The most populous ancestries reported in Cairo are English (57 | 23.5%), Dutch (45 | 18.6%), German (43 | 17.8%), Scottish (34 | 14.1%), and Irish (25 | 10.3%), together accounting for 84.3% of all Cairo residents.
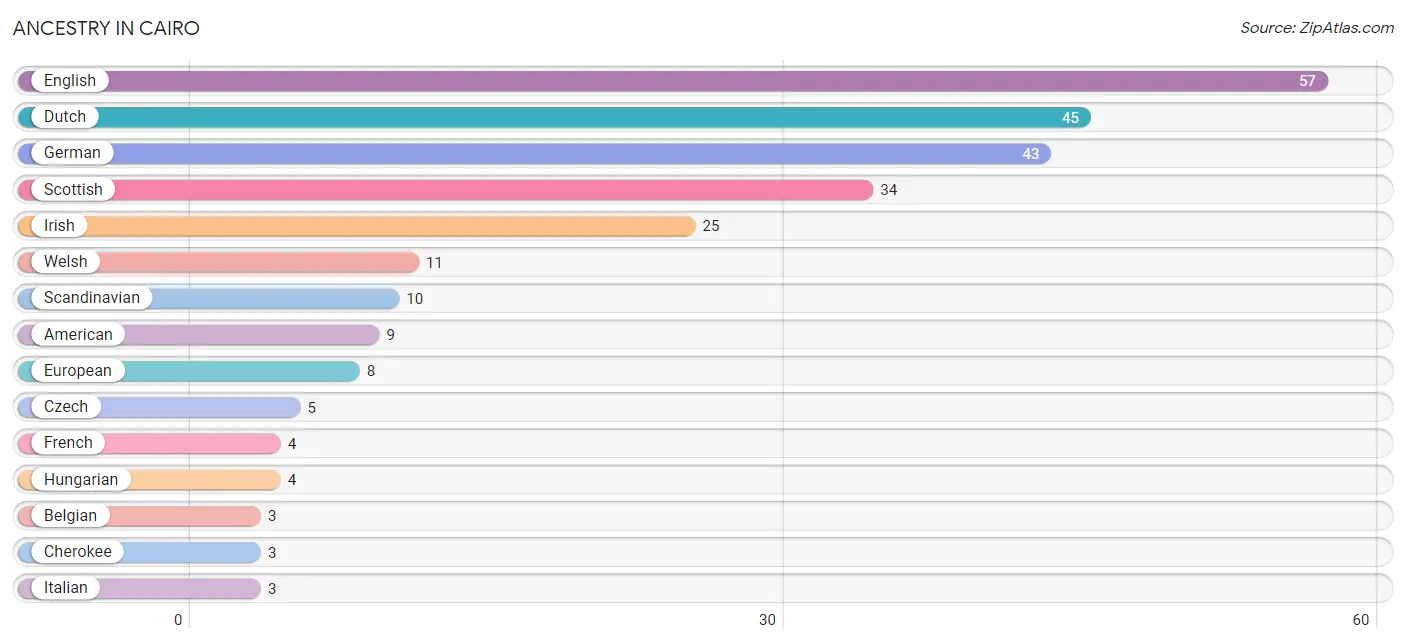
| Ancestry | # Population | % Population |
| American | 9 | 3.7% |
| Belgian | 3 | 1.2% |
| Cherokee | 3 | 1.2% |
| Czech | 5 | 2.1% |
| Dutch | 45 | 18.6% |
| English | 57 | 23.5% |
| European | 8 | 3.3% |
| French | 4 | 1.7% |
| German | 43 | 17.8% |
| Hungarian | 4 | 1.7% |
| Irish | 25 | 10.3% |
| Italian | 3 | 1.2% |
| Polish | 2 | 0.8% |
| Potawatomi | 2 | 0.8% |
| Scandinavian | 10 | 4.1% |
| Scotch-Irish | 3 | 1.2% |
| Scottish | 34 | 14.1% |
| Welsh | 11 | 4.5% | View All 18 Rows |
Immigrants in Cairo

| Immigration Origin | # Population | % Population | View All 0 Rows |
Sex and Age in Cairo
Sex and Age in Cairo
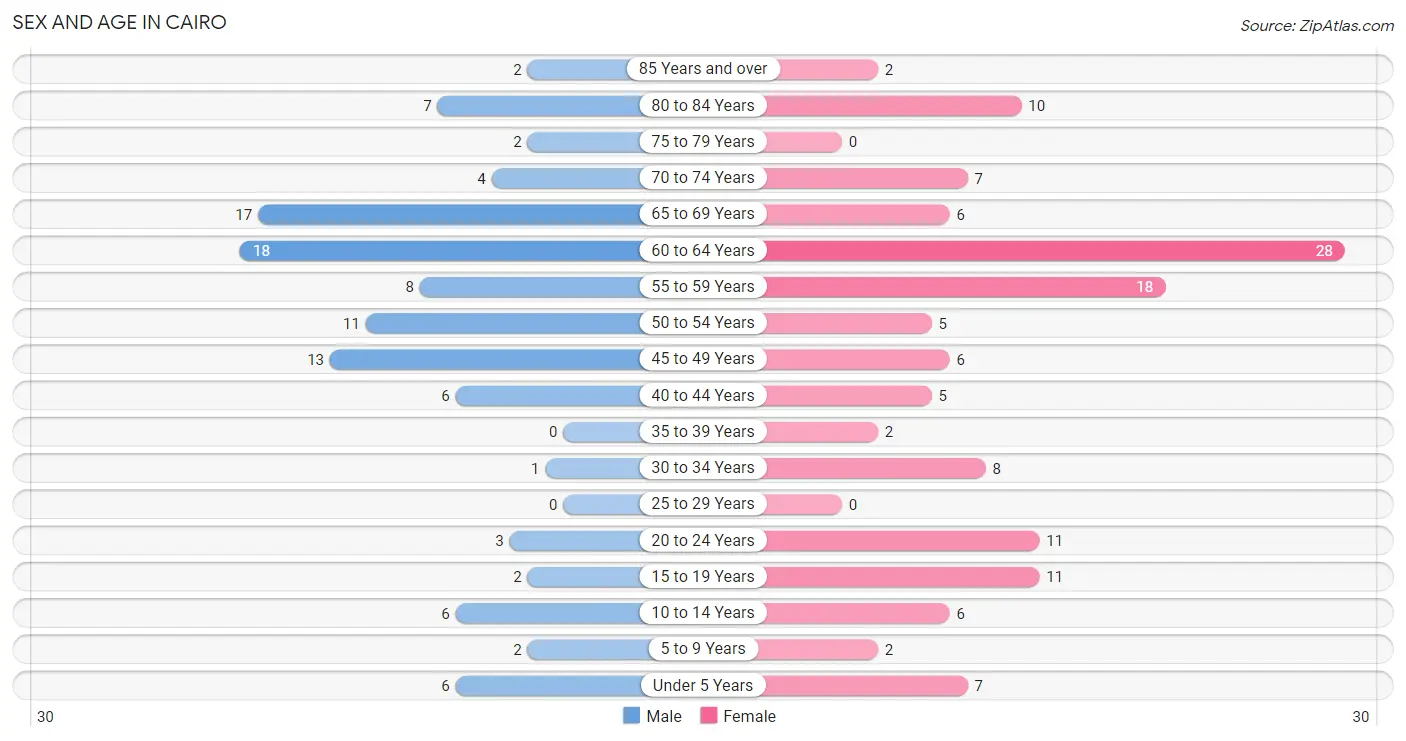
The most populous age groups in Cairo are 60 to 64 Years (18 | 16.7%) for men and 60 to 64 Years (28 | 20.9%) for women.
| Age Bracket | Male | Female |
| Under 5 Years | 6 (5.6%) | 7 (5.2%) |
| 5 to 9 Years | 2 (1.8%) | 2 (1.5%) |
| 10 to 14 Years | 6 (5.6%) | 6 (4.5%) |
| 15 to 19 Years | 2 (1.8%) | 11 (8.2%) |
| 20 to 24 Years | 3 (2.8%) | 11 (8.2%) |
| 25 to 29 Years | 0 (0.0%) | 0 (0.0%) |
| 30 to 34 Years | 1 (0.9%) | 8 (6.0%) |
| 35 to 39 Years | 0 (0.0%) | 2 (1.5%) |
| 40 to 44 Years | 6 (5.6%) | 5 (3.7%) |
| 45 to 49 Years | 13 (12.0%) | 6 (4.5%) |
| 50 to 54 Years | 11 (10.2%) | 5 (3.7%) |
| 55 to 59 Years | 8 (7.4%) | 18 (13.4%) |
| 60 to 64 Years | 18 (16.7%) | 28 (20.9%) |
| 65 to 69 Years | 17 (15.7%) | 6 (4.5%) |
| 70 to 74 Years | 4 (3.7%) | 7 (5.2%) |
| 75 to 79 Years | 2 (1.8%) | 0 (0.0%) |
| 80 to 84 Years | 7 (6.5%) | 10 (7.5%) |
| 85 Years and over | 2 (1.8%) | 2 (1.5%) |
| Total | 108 (100.0%) | 134 (100.0%) |
Families and Households in Cairo
Median Family Size in Cairo
The median family size in Cairo is 2.40 persons per family, with single male/father families (11 | 13.8%) accounting for the largest median family size of 4.09 persons per family. On the other hand, single female/mother families (9 | 11.3%) represent the smallest median family size with 2.11 persons per family.
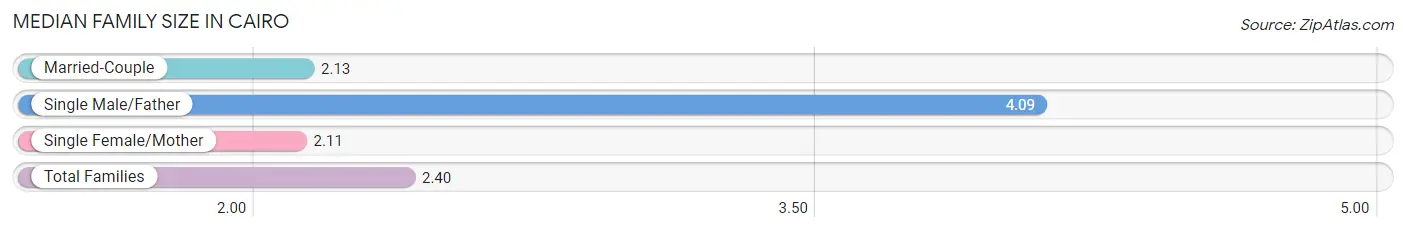
| Family Type | # Families | Family Size |
| Married-Couple | 60 (75.0%) | 2.13 |
| Single Male/Father | 11 (13.8%) | 4.09 |
| Single Female/Mother | 9 (11.3%) | 2.11 |
| Total Families | 80 (100.0%) | 2.40 |
Median Household Size in Cairo
The median household size in Cairo is 2.09 persons per household, with single male/father households (11 | 9.5%) accounting for the largest median household size of 4.27 persons per household. non-family households (36 | 31.0%) represent the smallest median household size with 1.31 persons per household.
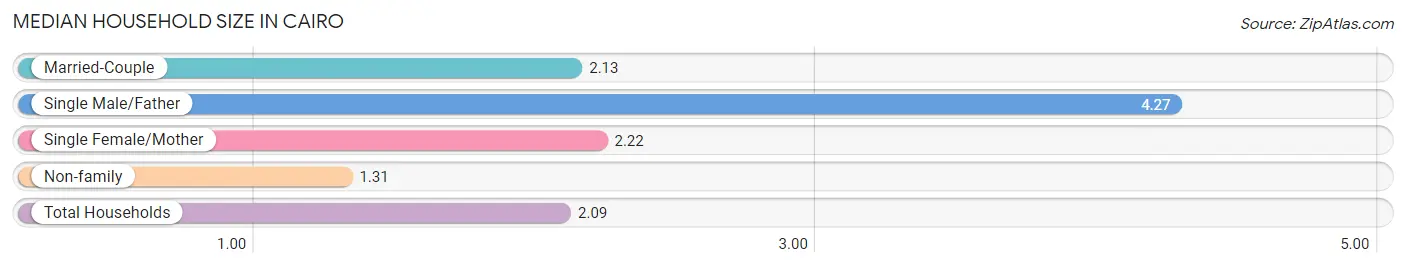
| Household Type | # Households | Household Size |
| Married-Couple | 60 (51.7%) | 2.13 |
| Single Male/Father | 11 (9.5%) | 4.27 |
| Single Female/Mother | 9 (7.8%) | 2.22 |
| Non-family | 36 (31.0%) | 1.31 |
| Total Households | 116 (100.0%) | 2.09 |
Household Size by Marriage Status in Cairo
Out of a total of 116 households in Cairo, 80 (69.0%) are family households, while 36 (31.0%) are nonfamily households. The most numerous type of family households are 2-person households, comprising 62, and the most common type of nonfamily households are 1-person households, comprising 25.
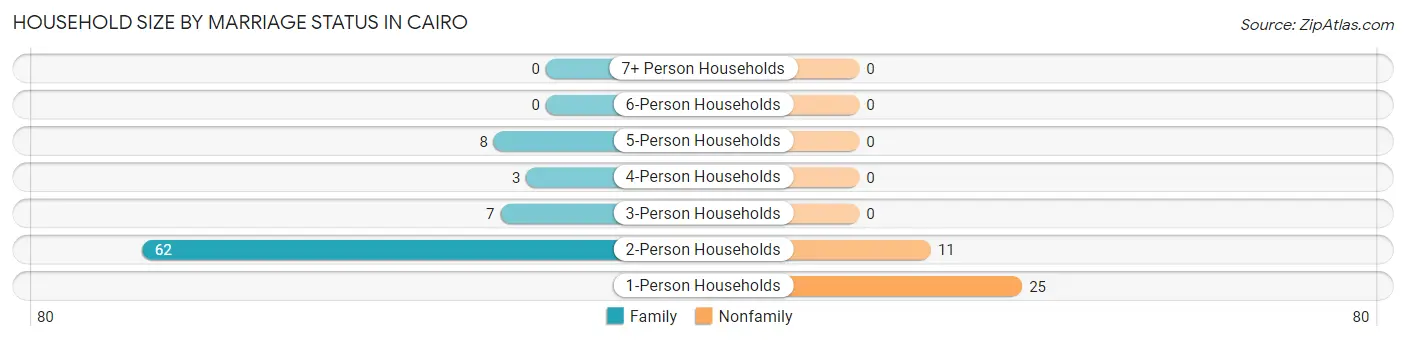
| Household Size | Family Households | Nonfamily Households |
| 1-Person Households | - | 25 (21.5%) |
| 2-Person Households | 62 (53.4%) | 11 (9.5%) |
| 3-Person Households | 7 (6.0%) | 0 (0.0%) |
| 4-Person Households | 3 (2.6%) | 0 (0.0%) |
| 5-Person Households | 8 (6.9%) | 0 (0.0%) |
| 6-Person Households | 0 (0.0%) | 0 (0.0%) |
| 7+ Person Households | 0 (0.0%) | 0 (0.0%) |
| Total | 80 (69.0%) | 36 (31.0%) |
Female Fertility in Cairo
Fertility by Age in Cairo
| Age Bracket | Women with Births | Births / 1,000 Women |
| 15 to 19 years | 0 (0.0%) | 0.0 |
| 20 to 34 years | 0 (0.0%) | 0.0 |
| 35 to 50 years | 0 (0.0%) | 0.0 |
| Total | 0 (0.0%) | 0.0 |
Fertility by Age by Marriage Status in Cairo
| Age Bracket | Married | Unmarried |
| 15 to 19 years | 0 (0.0%) | 0 (0.0%) |
| 20 to 34 years | 0 (0.0%) | 0 (0.0%) |
| 35 to 50 years | 0 (0.0%) | 0 (0.0%) |
| Total | 0 (0.0%) | 0 (0.0%) |
Fertility by Education in Cairo
| Educational Attainment | Women with Births | Births / 1,000 Women |
| Less than High School | 0 (0.0%) | 0.0 |
| High School Diploma | 0 (0.0%) | 0.0 |
| College or Associate's Degree | 0 (0.0%) | 0.0 |
| Bachelor's Degree | 0 (0.0%) | 0.0 |
| Graduate Degree | 0 (0.0%) | 0.0 |
| Total | 0 (0.0%) | 0.0 |
Fertility by Education by Marriage Status in Cairo
| Educational Attainment | Married | Unmarried |
| Less than High School | 0 (0.0%) | 0 (0.0%) |
| High School Diploma | 0 (0.0%) | 0 (0.0%) |
| College or Associate's Degree | 0 (0.0%) | 0 (0.0%) |
| Bachelor's Degree | 0 (0.0%) | 0 (0.0%) |
| Graduate Degree | 0 (0.0%) | 0 (0.0%) |
| Total | 0 (0.0%) | 0 (0.0%) |
Employment Characteristics in Cairo
Employment by Class of Employer in Cairo
Among the 102 employed individuals in Cairo, private company employees (69 | 67.6%), not-for-profit organizations (10 | 9.8%), and local government employees (10 | 9.8%) make up the most common classes of employment.
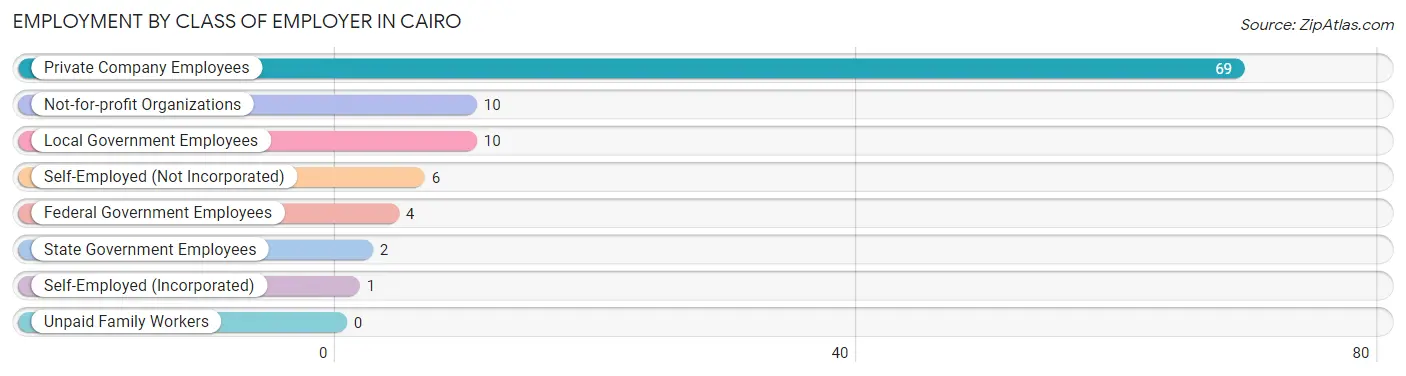
| Employer Class | # Employees | % Employees |
| Private Company Employees | 69 | 67.6% |
| Self-Employed (Incorporated) | 1 | 1.0% |
| Self-Employed (Not Incorporated) | 6 | 5.9% |
| Not-for-profit Organizations | 10 | 9.8% |
| Local Government Employees | 10 | 9.8% |
| State Government Employees | 2 | 2.0% |
| Federal Government Employees | 4 | 3.9% |
| Unpaid Family Workers | 0 | 0.0% |
| Total | 102 | 100.0% |
Employment Status by Age in Cairo
According to the labor force statistics for Cairo, out of the total population over 16 years of age (212), 49.5% or 105 individuals are in the labor force, with 2.9% or 3 of them unemployed. The age group with the highest labor force participation rate is 20 to 24 years, with 100.0% or 14 individuals in the labor force. Within the labor force, the 65 to 74 years age range has the highest percentage of unemployed individuals, with 33.3% or 2 of them being unemployed.
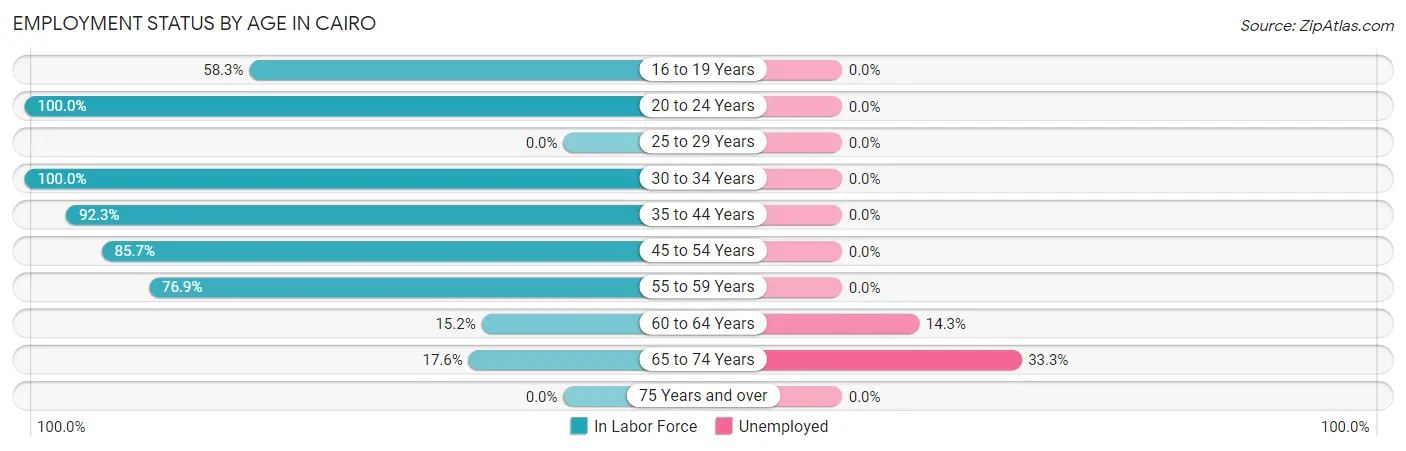
| Age Bracket | In Labor Force | Unemployed |
| 16 to 19 Years | 7 (58.3%) | 0 (0.0%) |
| 20 to 24 Years | 14 (100.0%) | 0 (0.0%) |
| 25 to 29 Years | 0 (0.0%) | 0 (0.0%) |
| 30 to 34 Years | 9 (100.0%) | 0 (0.0%) |
| 35 to 44 Years | 12 (92.3%) | 0 (0.0%) |
| 45 to 54 Years | 30 (85.7%) | 0 (0.0%) |
| 55 to 59 Years | 20 (76.9%) | 0 (0.0%) |
| 60 to 64 Years | 7 (15.2%) | 1 (14.3%) |
| 65 to 74 Years | 6 (17.6%) | 2 (33.3%) |
| 75 Years and over | 0 (0.0%) | 0 (0.0%) |
| Total | 105 (49.5%) | 3 (2.9%) |
Employment Status by Educational Attainment in Cairo
According to labor force statistics for Cairo, 60.5% of individuals (78) out of the total population between 25 and 64 years of age (129) are in the labor force, with 1.3% or 1 of them being unemployed. The group with the highest labor force participation rate are those with the educational attainment of high school diploma, with 69.4% or 25 individuals in the labor force. Within the labor force, individuals with college / associate degree education have the highest percentage of unemployment, with 3.4% or 1 of them being unemployed.
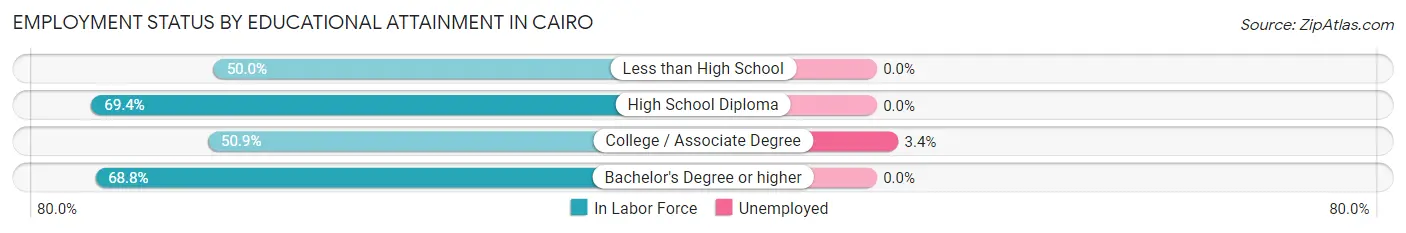
| Educational Attainment | In Labor Force | Unemployed |
| Less than High School | 2 (50.0%) | 0 (0.0%) |
| High School Diploma | 25 (69.4%) | 0 (0.0%) |
| College / Associate Degree | 29 (50.9%) | 2 (3.4%) |
| Bachelor's Degree or higher | 22 (68.8%) | 0 (0.0%) |
| Total | 78 (60.5%) | 2 (1.3%) |
Employment Occupations by Sex in Cairo
Management, Business, Science and Arts Occupations
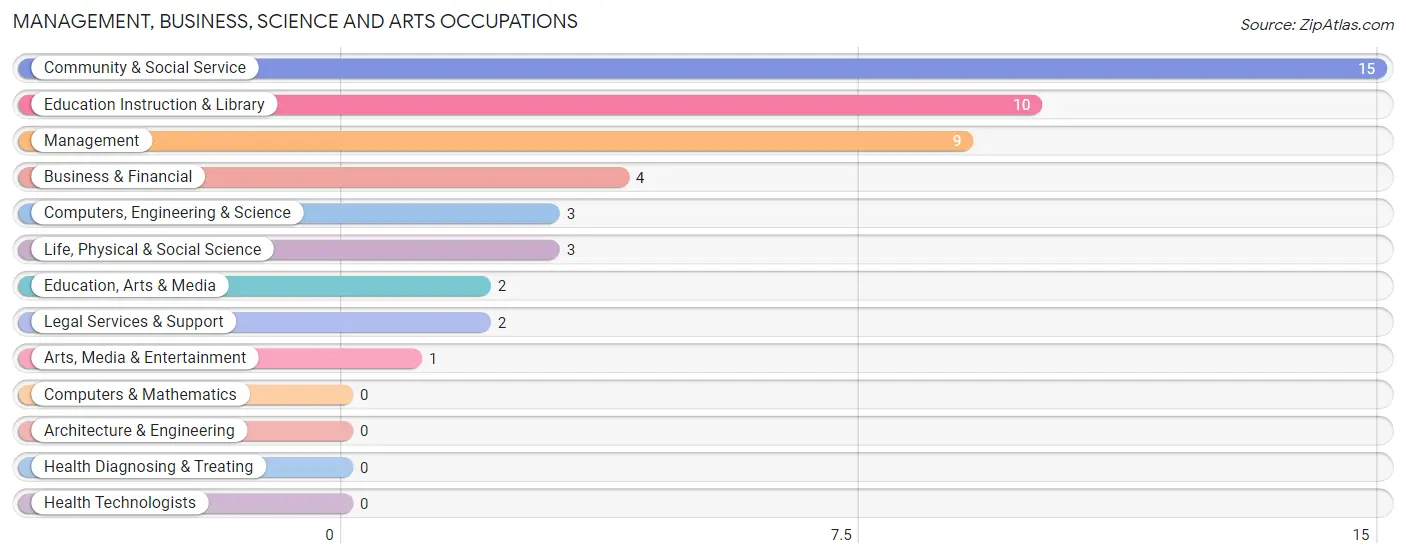
The most common Management, Business, Science and Arts occupations in Cairo are Community & Social Service (15 | 14.7%), Education Instruction & Library (10 | 9.8%), Management (9 | 8.8%), Business & Financial (4 | 3.9%), and Computers, Engineering & Science (3 | 2.9%).
Management, Business, Science and Arts Occupations by Sex
Within the Management, Business, Science and Arts occupations in Cairo, the most male-oriented occupations are Education Instruction & Library (40.0%), Management (33.3%), and Community & Social Service (26.7%), while the most female-oriented occupations are Business & Financial (100.0%), Computers, Engineering & Science (100.0%), and Life, Physical & Social Science (100.0%).
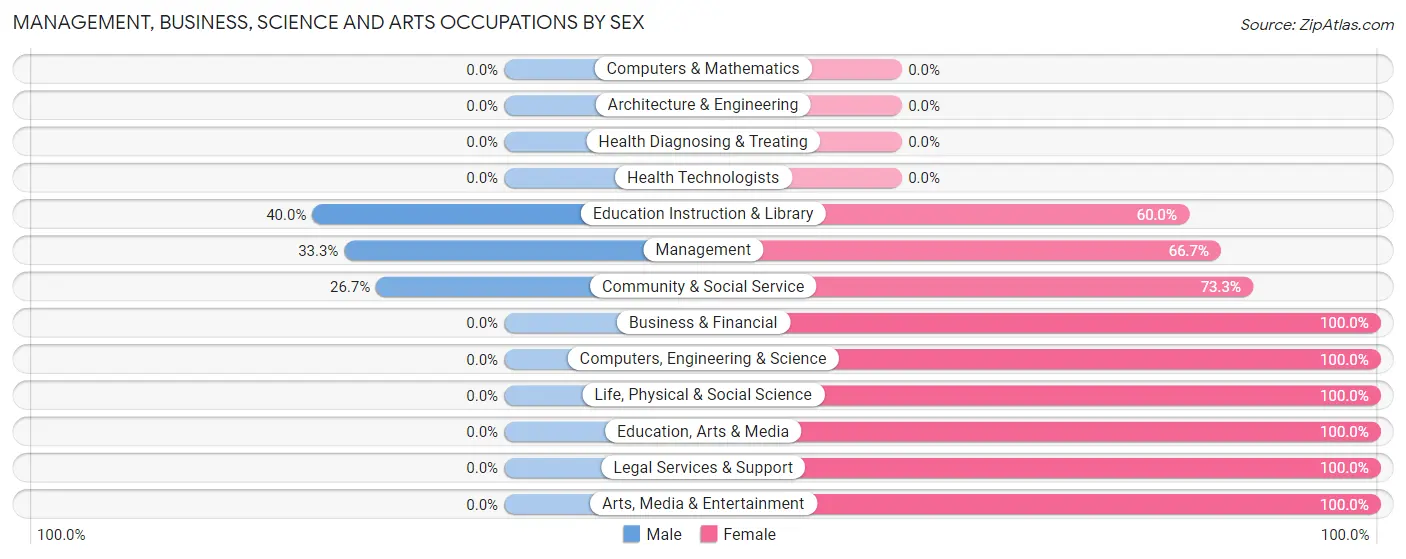
| Occupation | Male | Female |
| Management | 3 (33.3%) | 6 (66.7%) |
| Business & Financial | 0 (0.0%) | 4 (100.0%) |
| Computers, Engineering & Science | 0 (0.0%) | 3 (100.0%) |
| Computers & Mathematics | 0 (0.0%) | 0 (0.0%) |
| Architecture & Engineering | 0 (0.0%) | 0 (0.0%) |
| Life, Physical & Social Science | 0 (0.0%) | 3 (100.0%) |
| Community & Social Service | 4 (26.7%) | 11 (73.3%) |
| Education, Arts & Media | 0 (0.0%) | 2 (100.0%) |
| Legal Services & Support | 0 (0.0%) | 2 (100.0%) |
| Education Instruction & Library | 4 (40.0%) | 6 (60.0%) |
| Arts, Media & Entertainment | 0 (0.0%) | 1 (100.0%) |
| Health Diagnosing & Treating | 0 (0.0%) | 0 (0.0%) |
| Health Technologists | 0 (0.0%) | 0 (0.0%) |
| Total (Category) | 7 (22.6%) | 24 (77.4%) |
| Total (Overall) | 46 (45.1%) | 56 (54.9%) |
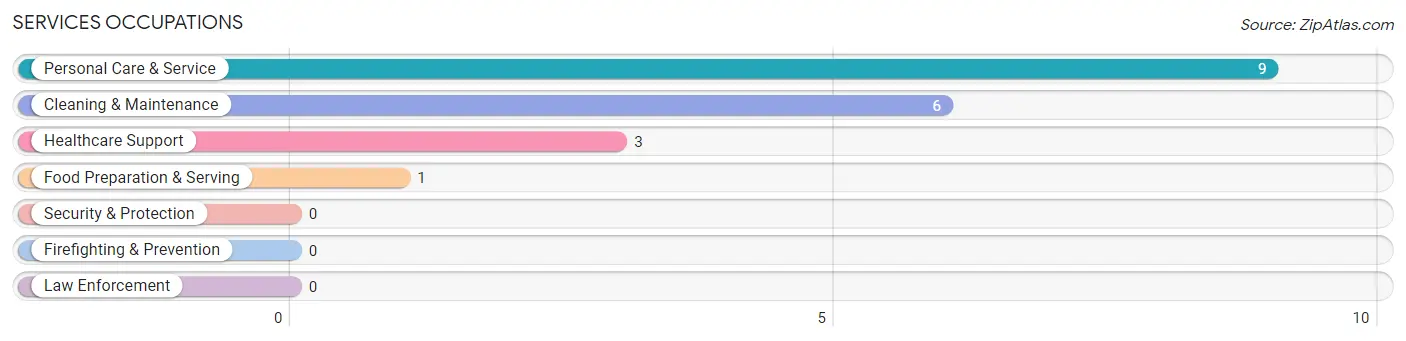
Services Occupations
The most common Services occupations in Cairo are Personal Care & Service (9 | 8.8%), Cleaning & Maintenance (6 | 5.9%), Healthcare Support (3 | 2.9%), and Food Preparation & Serving (1 | 1.0%).
Services Occupations by Sex
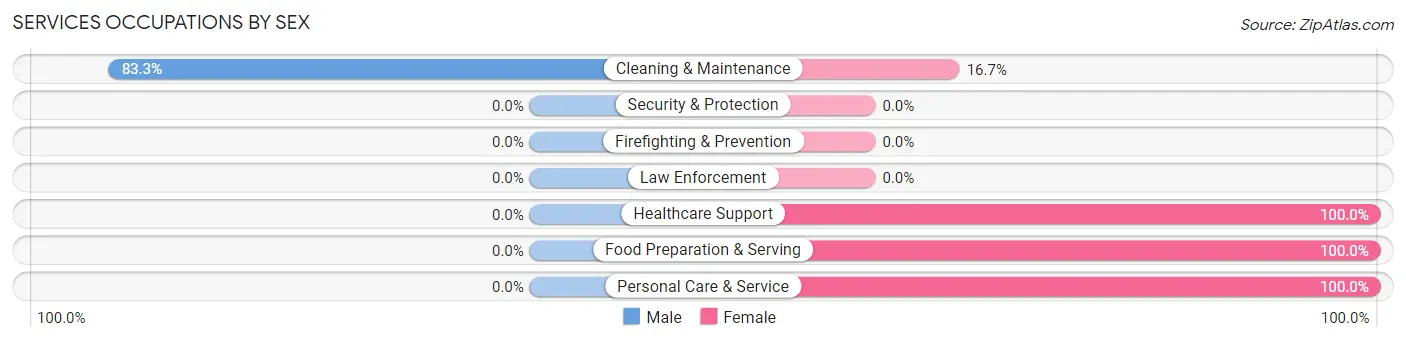
| Occupation | Male | Female |
| Healthcare Support | 0 (0.0%) | 3 (100.0%) |
| Security & Protection | 0 (0.0%) | 0 (0.0%) |
| Firefighting & Prevention | 0 (0.0%) | 0 (0.0%) |
| Law Enforcement | 0 (0.0%) | 0 (0.0%) |
| Food Preparation & Serving | 0 (0.0%) | 1 (100.0%) |
| Cleaning & Maintenance | 5 (83.3%) | 1 (16.7%) |
| Personal Care & Service | 0 (0.0%) | 9 (100.0%) |
| Total (Category) | 5 (26.3%) | 14 (73.7%) |
| Total (Overall) | 46 (45.1%) | 56 (54.9%) |
Sales and Office Occupations
The most common Sales and Office occupations in Cairo are , and Office & Administration (19 | 18.6%).
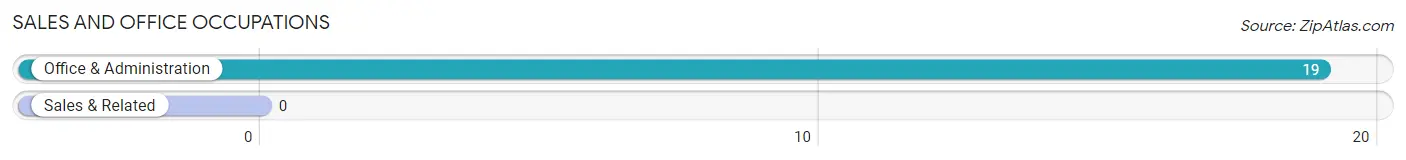
Sales and Office Occupations by Sex
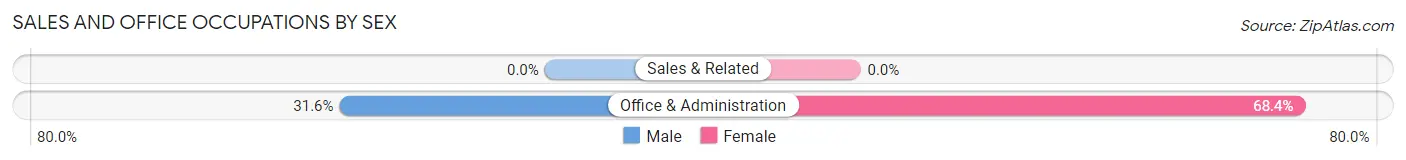
| Occupation | Male | Female |
| Sales & Related | 0 (0.0%) | 0 (0.0%) |
| Office & Administration | 6 (31.6%) | 13 (68.4%) |
| Total (Category) | 6 (31.6%) | 13 (68.4%) |
| Total (Overall) | 46 (45.1%) | 56 (54.9%) |
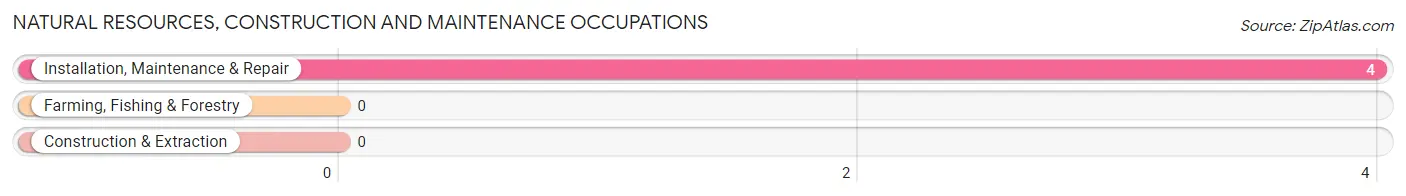
Natural Resources, Construction and Maintenance Occupations
The most common Natural Resources, Construction and Maintenance occupations in Cairo are , and Installation, Maintenance & Repair (4 | 3.9%).
Natural Resources, Construction and Maintenance Occupations by Sex
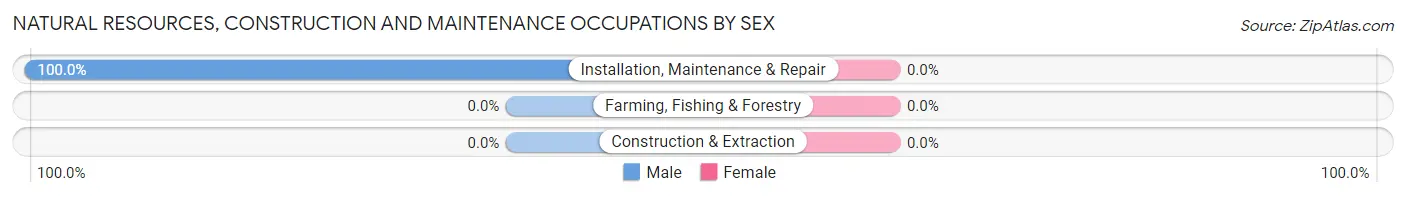
| Occupation | Male | Female |
| Farming, Fishing & Forestry | 0 (0.0%) | 0 (0.0%) |
| Construction & Extraction | 0 (0.0%) | 0 (0.0%) |
| Installation, Maintenance & Repair | 4 (100.0%) | 0 (0.0%) |
| Total (Category) | 4 (100.0%) | 0 (0.0%) |
| Total (Overall) | 46 (45.1%) | 56 (54.9%) |
Production, Transportation and Moving Occupations
The most common Production, Transportation and Moving occupations in Cairo are Production (18 | 17.6%), Transportation (7 | 6.9%), and Material Moving (4 | 3.9%).
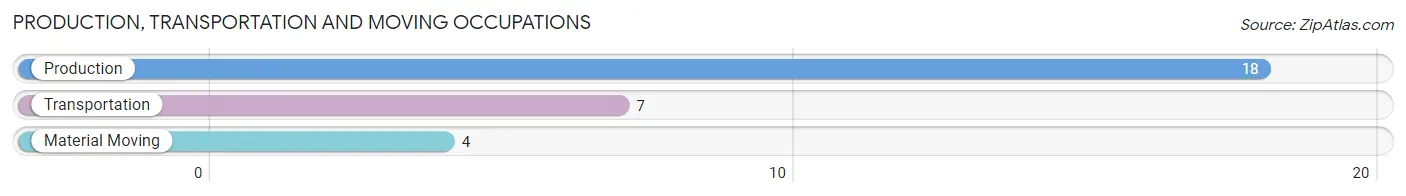
Production, Transportation and Moving Occupations by Sex
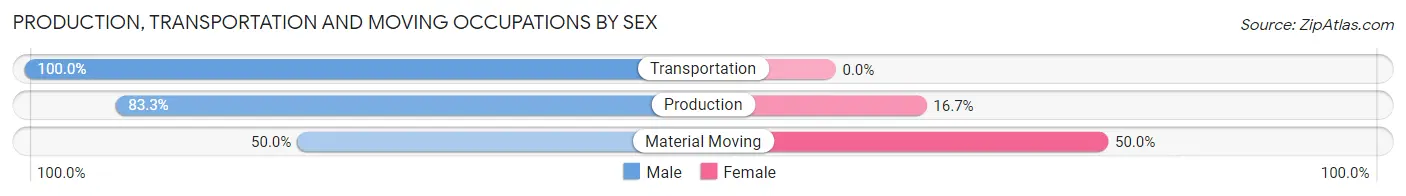
| Occupation | Male | Female |
| Production | 15 (83.3%) | 3 (16.7%) |
| Transportation | 7 (100.0%) | 0 (0.0%) |
| Material Moving | 2 (50.0%) | 2 (50.0%) |
| Total (Category) | 24 (82.8%) | 5 (17.2%) |
| Total (Overall) | 46 (45.1%) | 56 (54.9%) |
Employment Industries by Sex in Cairo
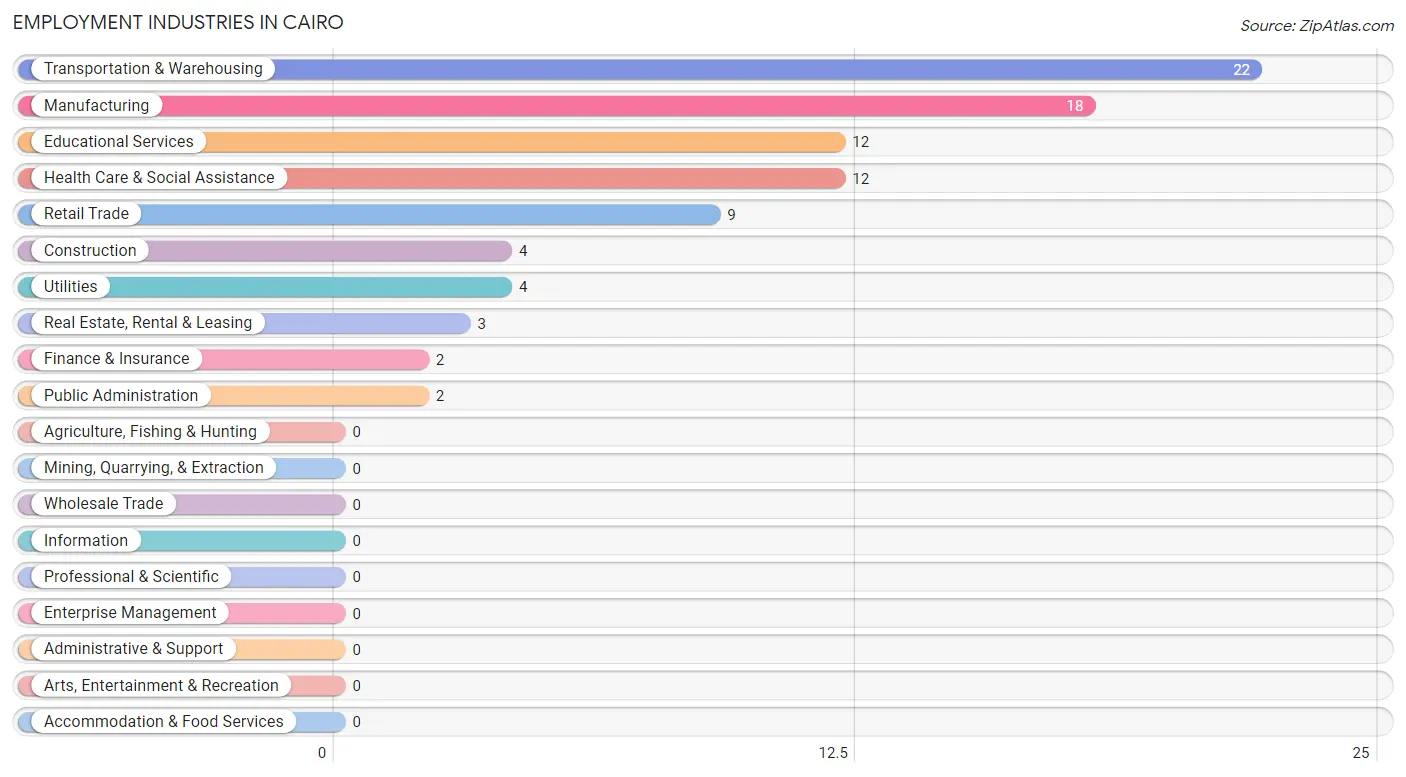
Employment Industries in Cairo
The major employment industries in Cairo include Transportation & Warehousing (22 | 21.6%), Manufacturing (18 | 17.6%), Educational Services (12 | 11.8%), Health Care & Social Assistance (12 | 11.8%), and Retail Trade (9 | 8.8%).
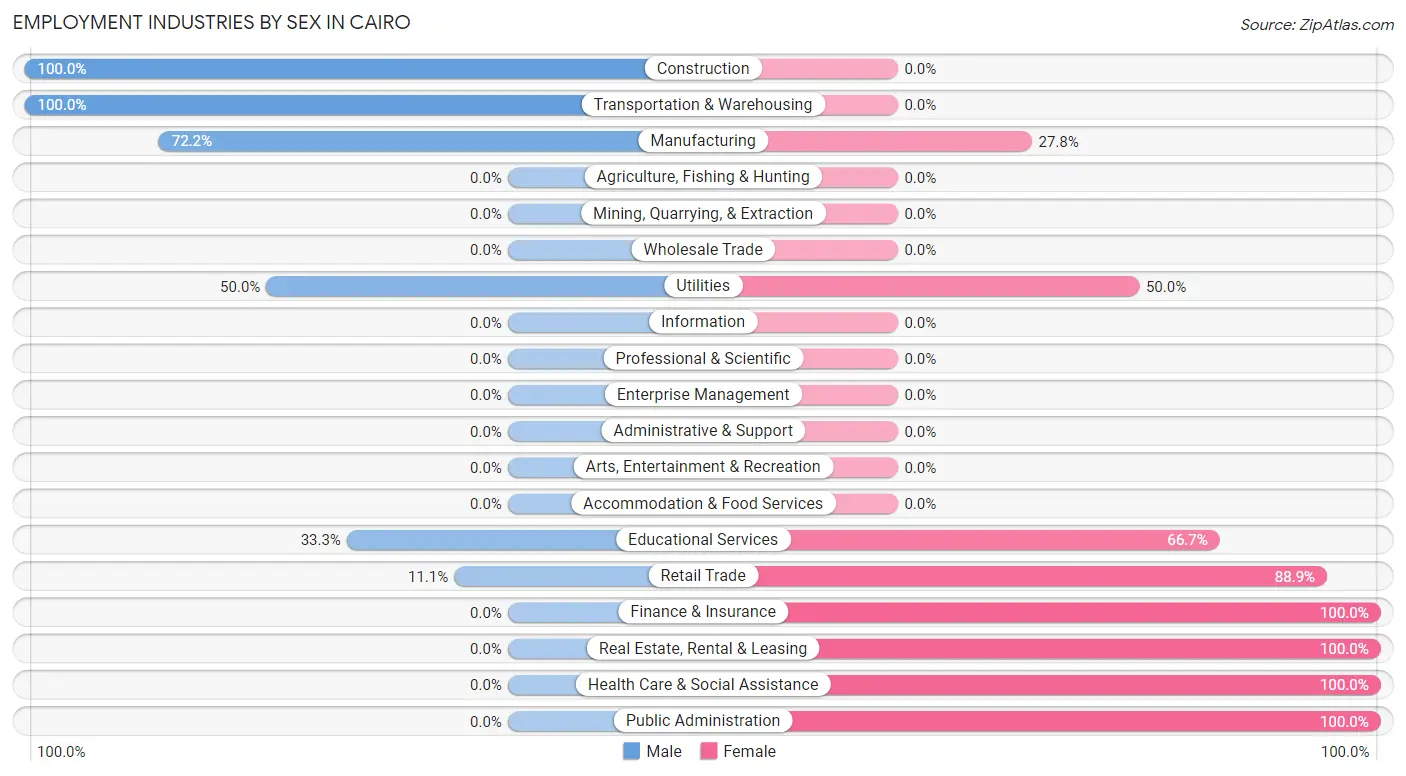
Employment Industries by Sex in Cairo
The Cairo industries that see more men than women are Construction (100.0%), Transportation & Warehousing (100.0%), and Manufacturing (72.2%), whereas the industries that tend to have a higher number of women are Finance & Insurance (100.0%), Real Estate, Rental & Leasing (100.0%), and Health Care & Social Assistance (100.0%).
| Industry | Male | Female |
| Agriculture, Fishing & Hunting | 0 (0.0%) | 0 (0.0%) |
| Mining, Quarrying, & Extraction | 0 (0.0%) | 0 (0.0%) |
| Construction | 4 (100.0%) | 0 (0.0%) |
| Manufacturing | 13 (72.2%) | 5 (27.8%) |
| Wholesale Trade | 0 (0.0%) | 0 (0.0%) |
| Retail Trade | 1 (11.1%) | 8 (88.9%) |
| Transportation & Warehousing | 22 (100.0%) | 0 (0.0%) |
| Utilities | 2 (50.0%) | 2 (50.0%) |
| Information | 0 (0.0%) | 0 (0.0%) |
| Finance & Insurance | 0 (0.0%) | 2 (100.0%) |
| Real Estate, Rental & Leasing | 0 (0.0%) | 3 (100.0%) |
| Professional & Scientific | 0 (0.0%) | 0 (0.0%) |
| Enterprise Management | 0 (0.0%) | 0 (0.0%) |
| Administrative & Support | 0 (0.0%) | 0 (0.0%) |
| Educational Services | 4 (33.3%) | 8 (66.7%) |
| Health Care & Social Assistance | 0 (0.0%) | 12 (100.0%) |
| Arts, Entertainment & Recreation | 0 (0.0%) | 0 (0.0%) |
| Accommodation & Food Services | 0 (0.0%) | 0 (0.0%) |
| Public Administration | 0 (0.0%) | 2 (100.0%) |
| Total | 46 (45.1%) | 56 (54.9%) |
Education in Cairo
School Enrollment in Cairo
The most common levels of schooling among the 34 students in Cairo are high school (12 | 35.3%), middle school (11 | 32.4%), and nursery / preschool (7 | 20.6%).
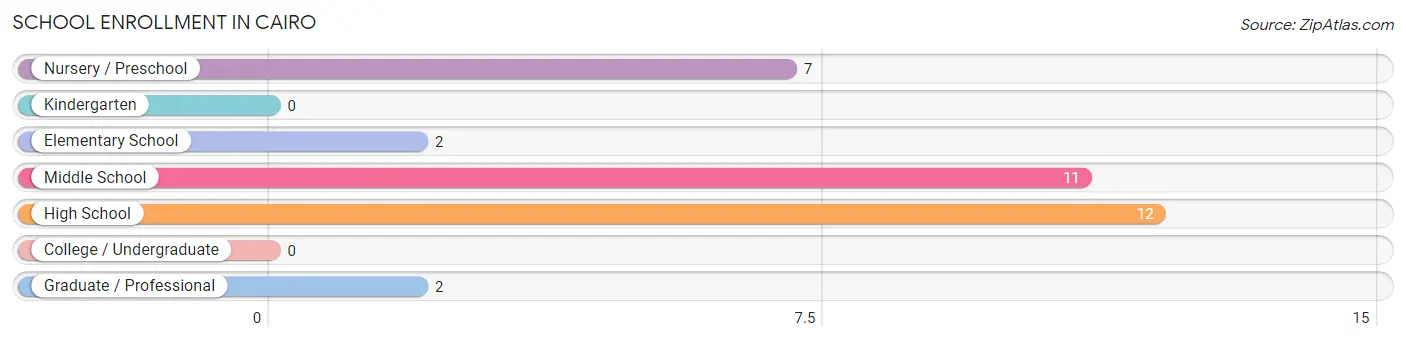
| School Level | # Students | % Students |
| Nursery / Preschool | 7 | 20.6% |
| Kindergarten | 0 | 0.0% |
| Elementary School | 2 | 5.9% |
| Middle School | 11 | 32.4% |
| High School | 12 | 35.3% |
| College / Undergraduate | 0 | 0.0% |
| Graduate / Professional | 2 | 5.9% |
| Total | 34 | 100.0% |
School Enrollment by Age by Funding Source in Cairo
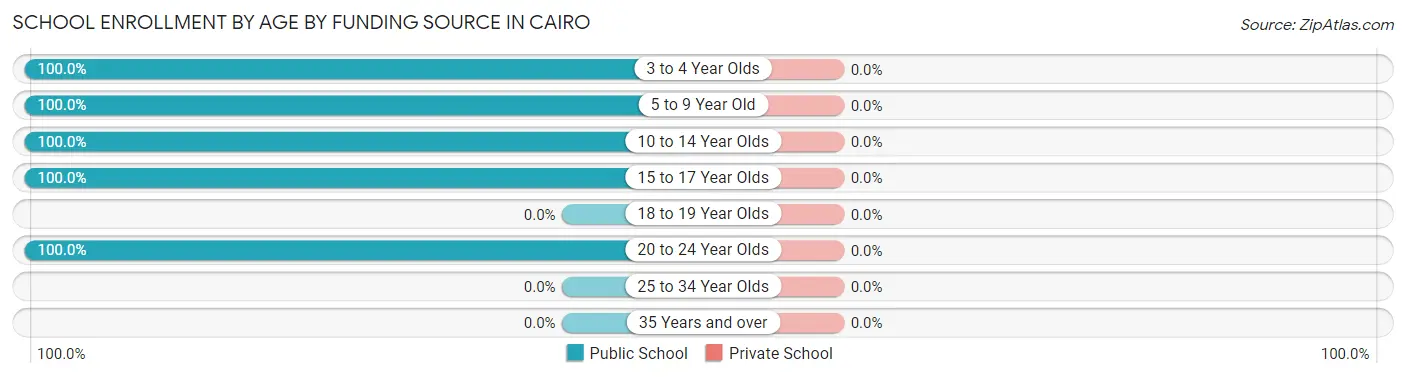
| Age Bracket | Public School | Private School |
| 3 to 4 Year Olds | 7 (100.0%) | 0 (0.0%) |
| 5 to 9 Year Old | 2 (100.0%) | 0 (0.0%) |
| 10 to 14 Year Olds | 12 (100.0%) | 0 (0.0%) |
| 15 to 17 Year Olds | 11 (100.0%) | 0 (0.0%) |
| 18 to 19 Year Olds | 0 (0.0%) | 0 (0.0%) |
| 20 to 24 Year Olds | 2 (100.0%) | 0 (0.0%) |
| 25 to 34 Year Olds | 0 (0.0%) | 0 (0.0%) |
| 35 Years and over | 0 (0.0%) | 0 (0.0%) |
| Total | 34 (100.0%) | 0 (0.0%) |
Educational Attainment by Field of Study in Cairo
Education (20 | 43.5%), business (15 | 32.6%), liberal arts & history (4 | 8.7%), arts & humanities (3 | 6.5%), and psychology (2 | 4.3%) are the most common fields of study among 46 individuals in Cairo who have obtained a bachelor's degree or higher.
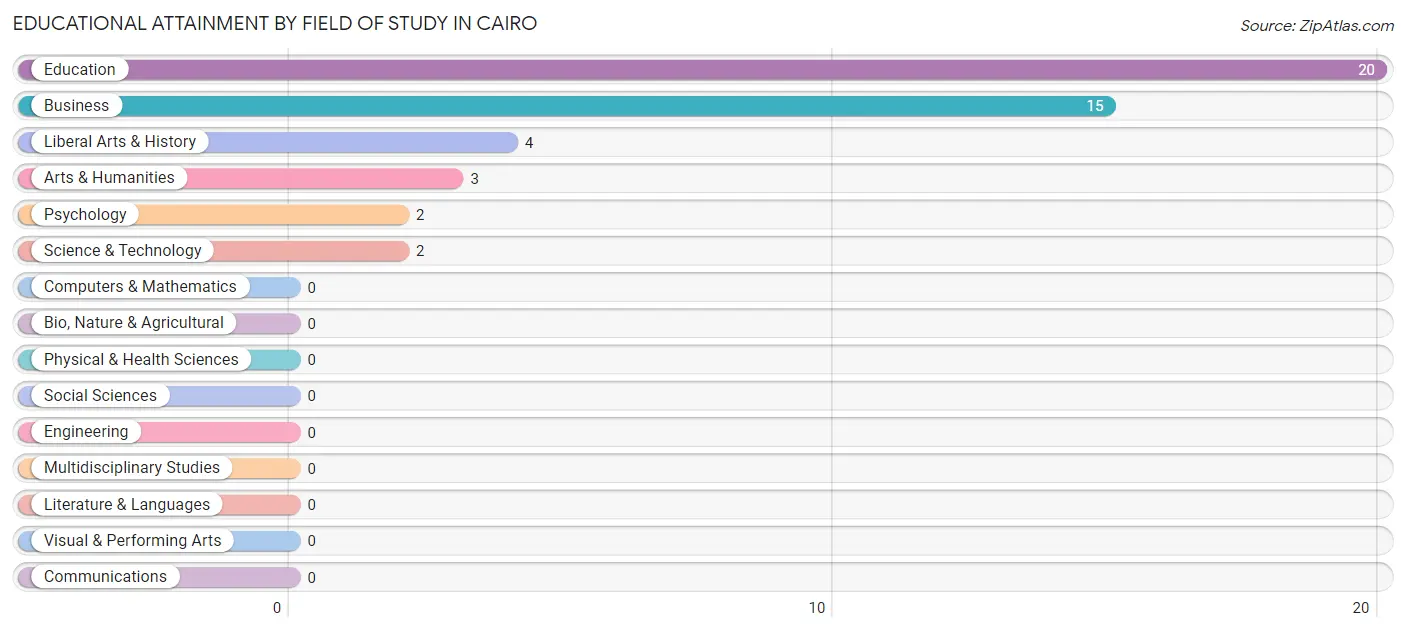
| Field of Study | # Graduates | % Graduates |
| Computers & Mathematics | 0 | 0.0% |
| Bio, Nature & Agricultural | 0 | 0.0% |
| Physical & Health Sciences | 0 | 0.0% |
| Psychology | 2 | 4.3% |
| Social Sciences | 0 | 0.0% |
| Engineering | 0 | 0.0% |
| Multidisciplinary Studies | 0 | 0.0% |
| Science & Technology | 2 | 4.3% |
| Business | 15 | 32.6% |
| Education | 20 | 43.5% |
| Literature & Languages | 0 | 0.0% |
| Liberal Arts & History | 4 | 8.7% |
| Visual & Performing Arts | 0 | 0.0% |
| Communications | 0 | 0.0% |
| Arts & Humanities | 3 | 6.5% |
| Total | 46 | 100.0% |
Transportation & Commute in Cairo
Vehicle Availability by Sex in Cairo
The most prevalent vehicle ownership categories in Cairo are males with 3 vehicles (18, accounting for 39.1%) and females with 3 vehicles (14, making up 32.1%).
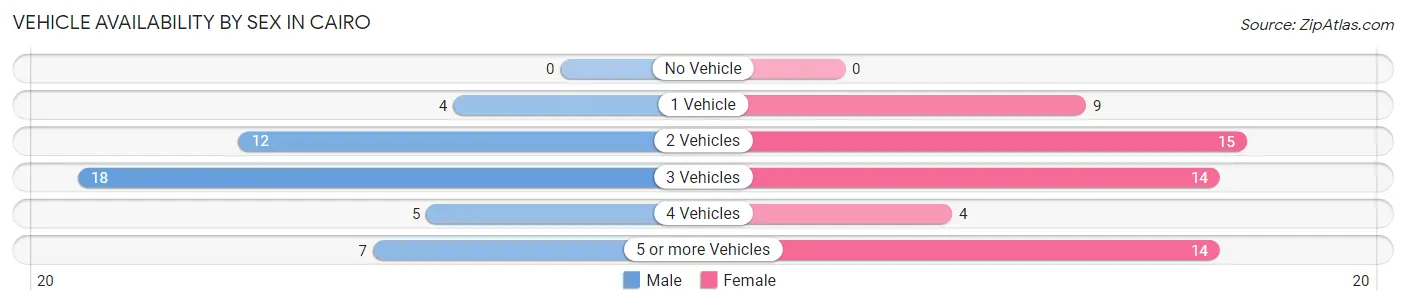
| Vehicles Available | Male | Female |
| No Vehicle | 0 (0.0%) | 0 (0.0%) |
| 1 Vehicle | 4 (8.7%) | 9 (16.1%) |
| 2 Vehicles | 12 (26.1%) | 15 (26.8%) |
| 3 Vehicles | 18 (39.1%) | 14 (25.0%) |
| 4 Vehicles | 5 (10.9%) | 4 (7.1%) |
| 5 or more Vehicles | 7 (15.2%) | 14 (25.0%) |
| Total | 46 (100.0%) | 56 (100.0%) |
Commute Time in Cairo
The most frequently occuring commute durations in Cairo are 15 to 19 minutes (35 commuters, 35.0%), 10 to 14 minutes (33 commuters, 33.0%), and 20 to 24 minutes (11 commuters, 11.0%).
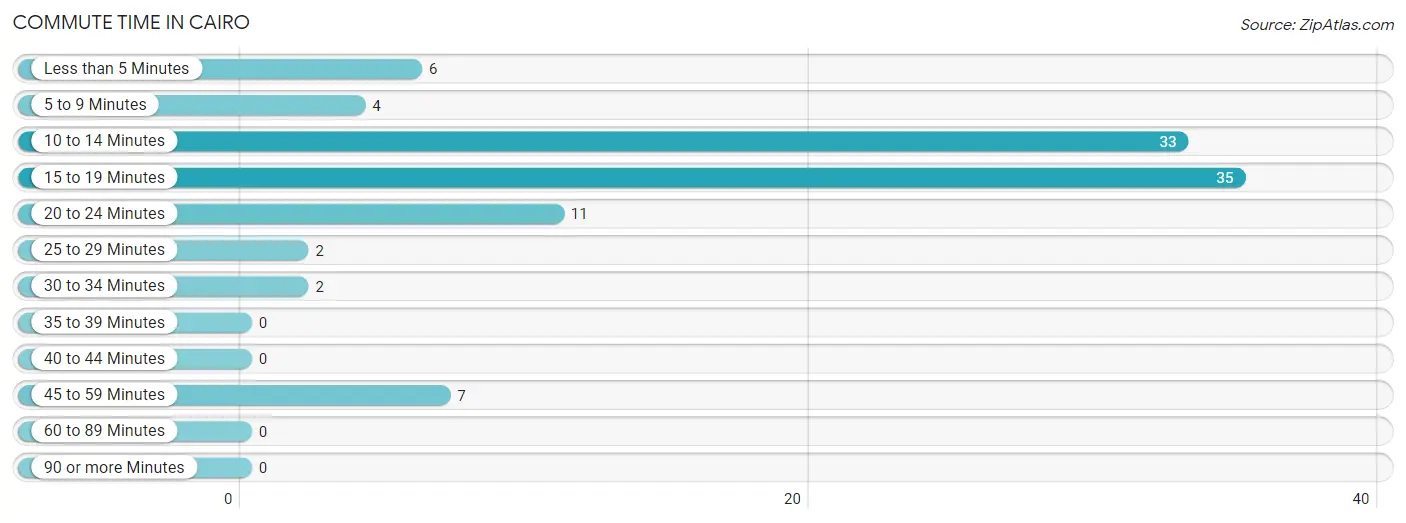
| Commute Time | # Commuters | % Commuters |
| Less than 5 Minutes | 6 | 6.0% |
| 5 to 9 Minutes | 4 | 4.0% |
| 10 to 14 Minutes | 33 | 33.0% |
| 15 to 19 Minutes | 35 | 35.0% |
| 20 to 24 Minutes | 11 | 11.0% |
| 25 to 29 Minutes | 2 | 2.0% |
| 30 to 34 Minutes | 2 | 2.0% |
| 35 to 39 Minutes | 0 | 0.0% |
| 40 to 44 Minutes | 0 | 0.0% |
| 45 to 59 Minutes | 7 | 7.0% |
| 60 to 89 Minutes | 0 | 0.0% |
| 90 or more Minutes | 0 | 0.0% |
Commute Time by Sex in Cairo
The most common commute times in Cairo are 15 to 19 minutes (17 commuters, 37.0%) for males and 10 to 14 minutes (19 commuters, 35.2%) for females.
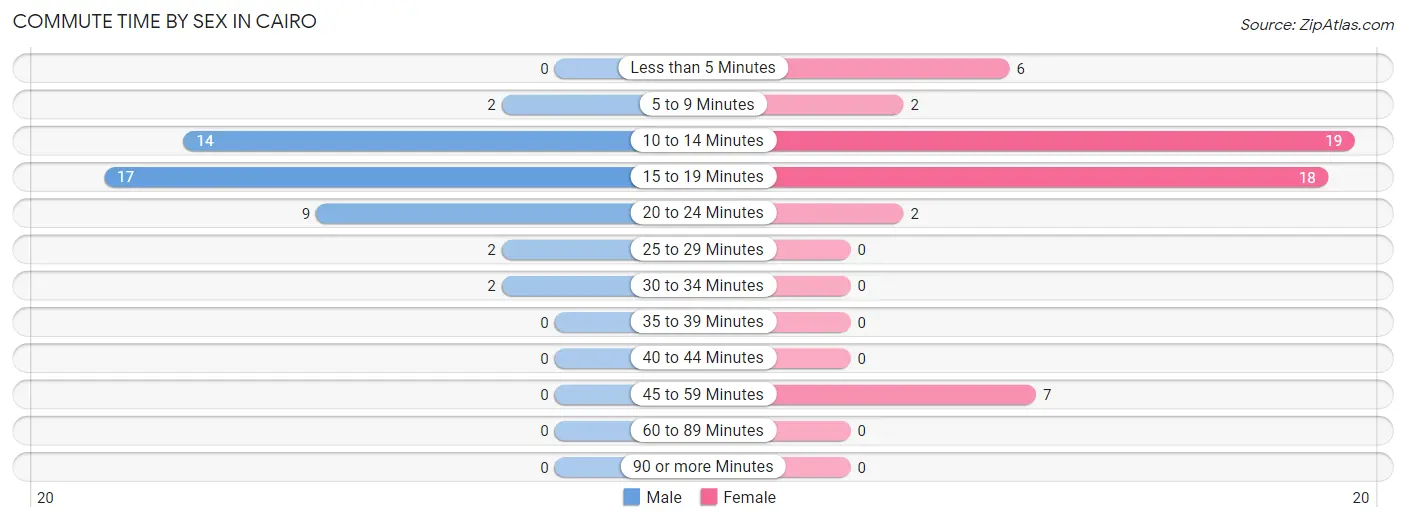
| Commute Time | Male | Female |
| Less than 5 Minutes | 0 (0.0%) | 6 (11.1%) |
| 5 to 9 Minutes | 2 (4.3%) | 2 (3.7%) |
| 10 to 14 Minutes | 14 (30.4%) | 19 (35.2%) |
| 15 to 19 Minutes | 17 (37.0%) | 18 (33.3%) |
| 20 to 24 Minutes | 9 (19.6%) | 2 (3.7%) |
| 25 to 29 Minutes | 2 (4.3%) | 0 (0.0%) |
| 30 to 34 Minutes | 2 (4.3%) | 0 (0.0%) |
| 35 to 39 Minutes | 0 (0.0%) | 0 (0.0%) |
| 40 to 44 Minutes | 0 (0.0%) | 0 (0.0%) |
| 45 to 59 Minutes | 0 (0.0%) | 7 (13.0%) |
| 60 to 89 Minutes | 0 (0.0%) | 0 (0.0%) |
| 90 or more Minutes | 0 (0.0%) | 0 (0.0%) |
Time of Departure to Work by Sex in Cairo
The most frequent times of departure to work in Cairo are 7:30 AM to 7:59 AM (11, 23.9%) for males and 6:30 AM to 6:59 AM (9, 16.7%) for females.
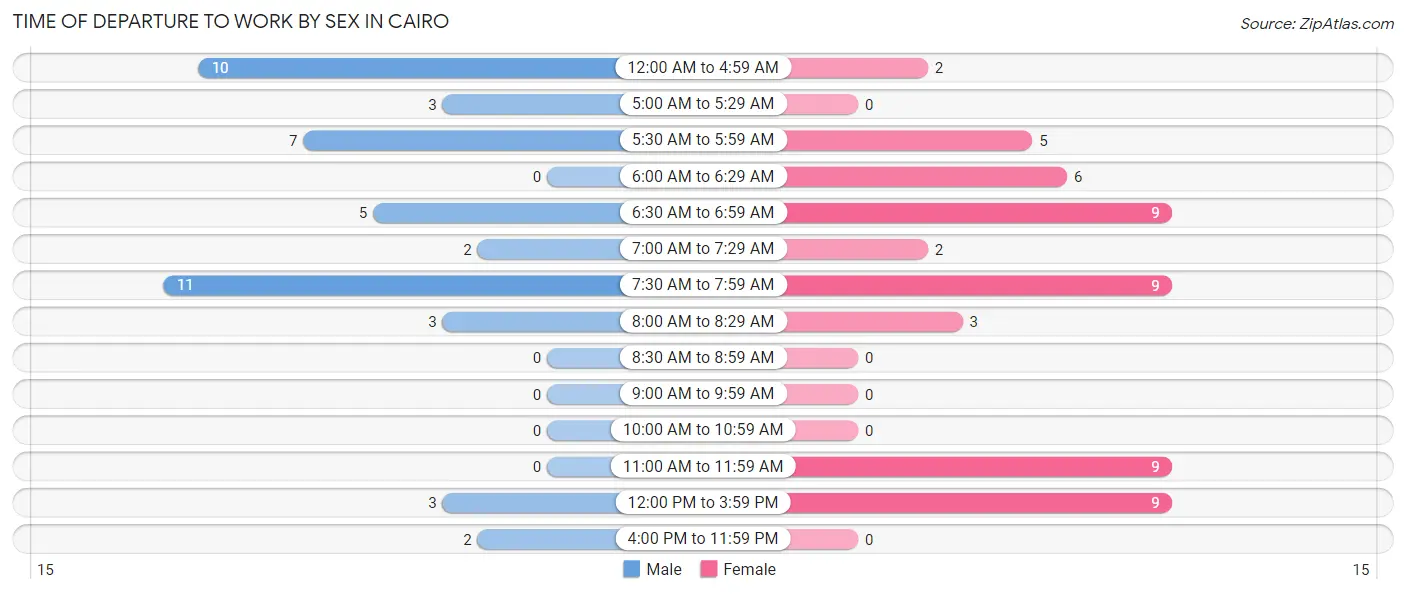
| Time of Departure | Male | Female |
| 12:00 AM to 4:59 AM | 10 (21.7%) | 2 (3.7%) |
| 5:00 AM to 5:29 AM | 3 (6.5%) | 0 (0.0%) |
| 5:30 AM to 5:59 AM | 7 (15.2%) | 5 (9.3%) |
| 6:00 AM to 6:29 AM | 0 (0.0%) | 6 (11.1%) |
| 6:30 AM to 6:59 AM | 5 (10.9%) | 9 (16.7%) |
| 7:00 AM to 7:29 AM | 2 (4.3%) | 2 (3.7%) |
| 7:30 AM to 7:59 AM | 11 (23.9%) | 9 (16.7%) |
| 8:00 AM to 8:29 AM | 3 (6.5%) | 3 (5.6%) |
| 8:30 AM to 8:59 AM | 0 (0.0%) | 0 (0.0%) |
| 9:00 AM to 9:59 AM | 0 (0.0%) | 0 (0.0%) |
| 10:00 AM to 10:59 AM | 0 (0.0%) | 0 (0.0%) |
| 11:00 AM to 11:59 AM | 0 (0.0%) | 9 (16.7%) |
| 12:00 PM to 3:59 PM | 3 (6.5%) | 9 (16.7%) |
| 4:00 PM to 11:59 PM | 2 (4.3%) | 0 (0.0%) |
| Total | 46 (100.0%) | 54 (100.0%) |
Housing Occupancy in Cairo
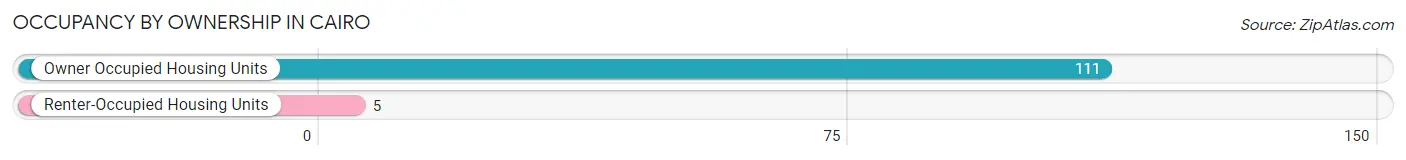
Occupancy by Ownership in Cairo
Of the total 116 dwellings in Cairo, owner-occupied units account for 111 (95.7%), while renter-occupied units make up 5 (4.3%).
| Occupancy | # Housing Units | % Housing Units |
| Owner Occupied Housing Units | 111 | 95.7% |
| Renter-Occupied Housing Units | 5 | 4.3% |
| Total Occupied Housing Units | 116 | 100.0% |
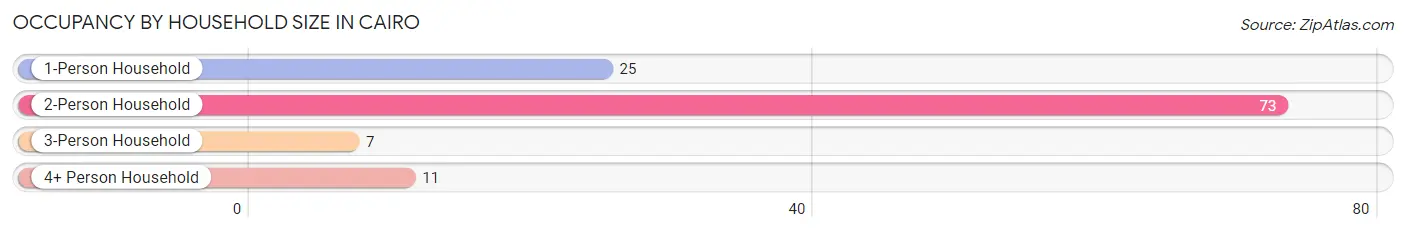
Occupancy by Household Size in Cairo
| Household Size | # Housing Units | % Housing Units |
| 1-Person Household | 25 | 21.5% |
| 2-Person Household | 73 | 62.9% |
| 3-Person Household | 7 | 6.0% |
| 4+ Person Household | 11 | 9.5% |
| Total Housing Units | 116 | 100.0% |
Occupancy by Ownership by Household Size in Cairo
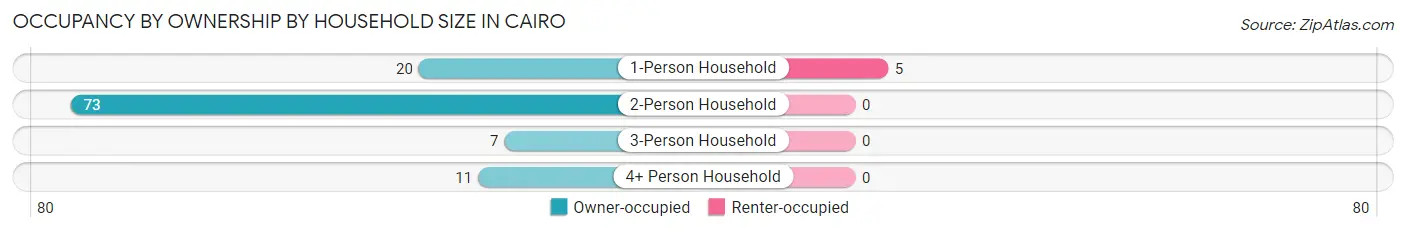
| Household Size | Owner-occupied | Renter-occupied |
| 1-Person Household | 20 (80.0%) | 5 (20.0%) |
| 2-Person Household | 73 (100.0%) | 0 (0.0%) |
| 3-Person Household | 7 (100.0%) | 0 (0.0%) |
| 4+ Person Household | 11 (100.0%) | 0 (0.0%) |
| Total Housing Units | 111 (95.7%) | 5 (4.3%) |
Occupancy by Educational Attainment in Cairo
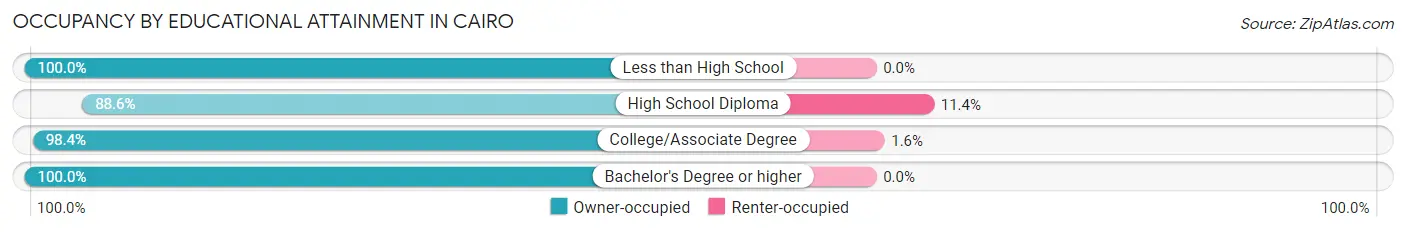
| Household Size | Owner-occupied | Renter-occupied |
| Less than High School | 2 (100.0%) | 0 (0.0%) |
| High School Diploma | 31 (88.6%) | 4 (11.4%) |
| College/Associate Degree | 61 (98.4%) | 1 (1.6%) |
| Bachelor's Degree or higher | 17 (100.0%) | 0 (0.0%) |
Occupancy by Age of Householder in Cairo
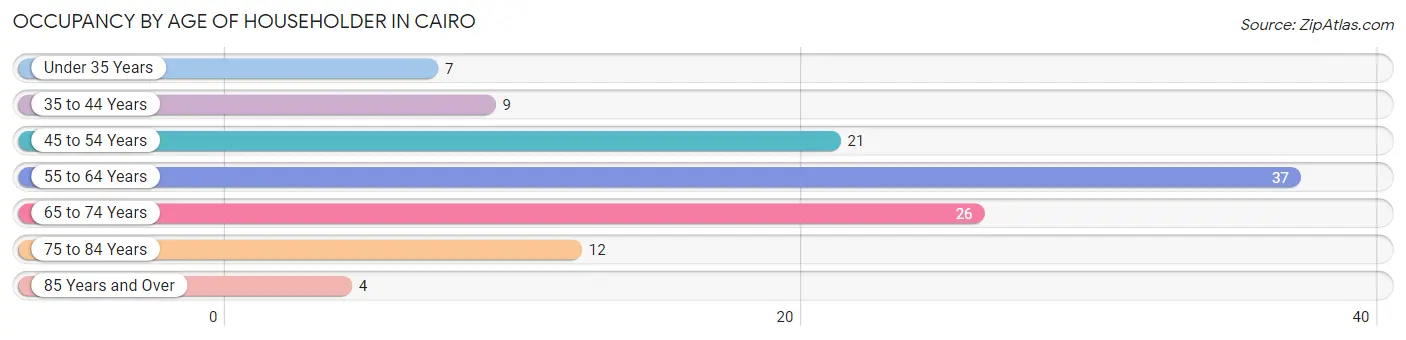
| Age Bracket | # Households | % Households |
| Under 35 Years | 7 | 6.0% |
| 35 to 44 Years | 9 | 7.8% |
| 45 to 54 Years | 21 | 18.1% |
| 55 to 64 Years | 37 | 31.9% |
| 65 to 74 Years | 26 | 22.4% |
| 75 to 84 Years | 12 | 10.3% |
| 85 Years and Over | 4 | 3.5% |
| Total | 116 | 100.0% |
Housing Finances in Cairo
Median Income by Occupancy in Cairo
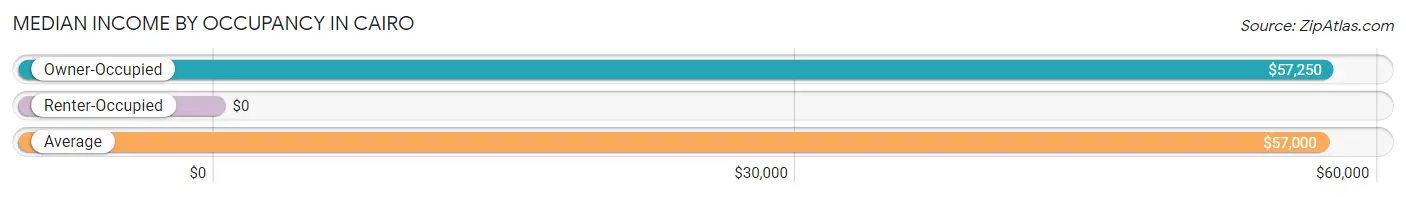
| Occupancy Type | # Households | Median Income |
| Owner-Occupied | 111 (95.7%) | $57,250 |
| Renter-Occupied | 5 (4.3%) | $0 |
| Average | 116 (100.0%) | $57,000 |
Occupancy by Householder Income Bracket in Cairo
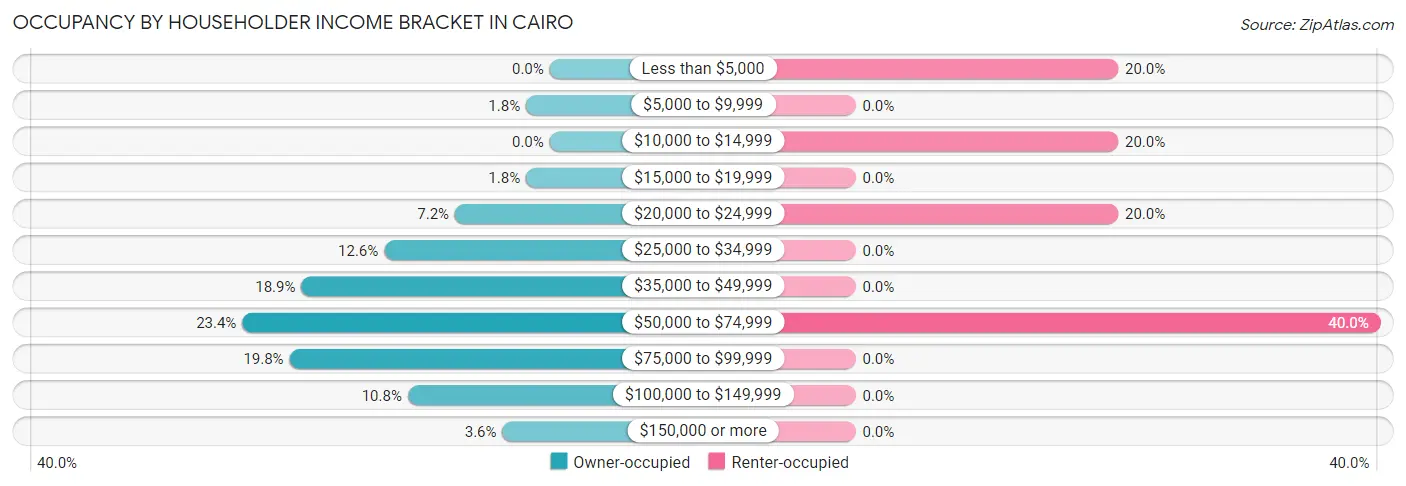
| Income Bracket | Owner-occupied | Renter-occupied |
| Less than $5,000 | 0 (0.0%) | 1 (20.0%) |
| $5,000 to $9,999 | 2 (1.8%) | 0 (0.0%) |
| $10,000 to $14,999 | 0 (0.0%) | 1 (20.0%) |
| $15,000 to $19,999 | 2 (1.8%) | 0 (0.0%) |
| $20,000 to $24,999 | 8 (7.2%) | 1 (20.0%) |
| $25,000 to $34,999 | 14 (12.6%) | 0 (0.0%) |
| $35,000 to $49,999 | 21 (18.9%) | 0 (0.0%) |
| $50,000 to $74,999 | 26 (23.4%) | 2 (40.0%) |
| $75,000 to $99,999 | 22 (19.8%) | 0 (0.0%) |
| $100,000 to $149,999 | 12 (10.8%) | 0 (0.0%) |
| $150,000 or more | 4 (3.6%) | 0 (0.0%) |
| Total | 111 (100.0%) | 5 (100.0%) |
Monthly Housing Cost Tiers in Cairo
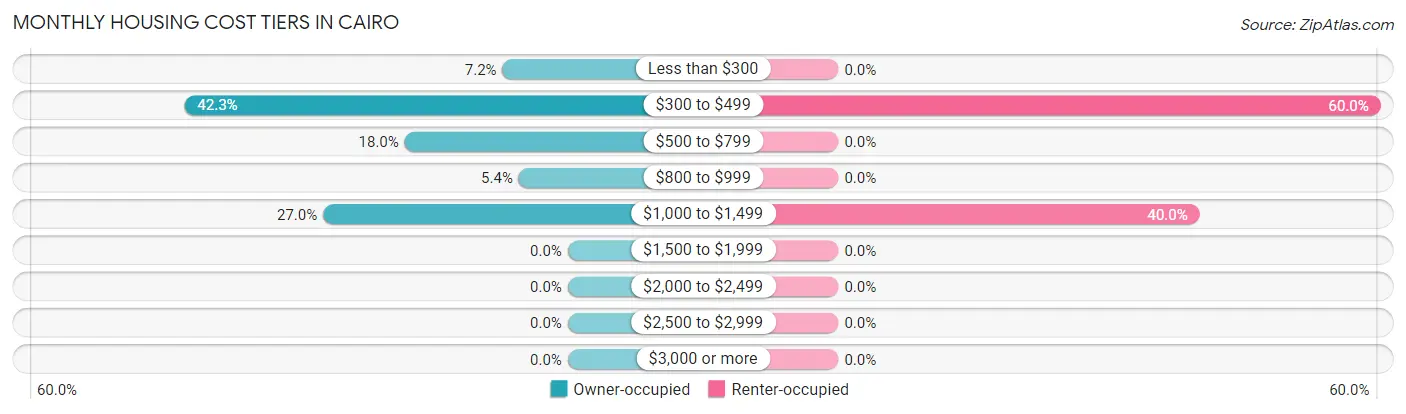
| Monthly Cost | Owner-occupied | Renter-occupied |
| Less than $300 | 8 (7.2%) | 0 (0.0%) |
| $300 to $499 | 47 (42.3%) | 3 (60.0%) |
| $500 to $799 | 20 (18.0%) | 0 (0.0%) |
| $800 to $999 | 6 (5.4%) | 0 (0.0%) |
| $1,000 to $1,499 | 30 (27.0%) | 2 (40.0%) |
| $1,500 to $1,999 | 0 (0.0%) | 0 (0.0%) |
| $2,000 to $2,499 | 0 (0.0%) | 0 (0.0%) |
| $2,500 to $2,999 | 0 (0.0%) | 0 (0.0%) |
| $3,000 or more | 0 (0.0%) | 0 (0.0%) |
| Total | 111 (100.0%) | 5 (100.0%) |
Physical Housing Characteristics in Cairo
Housing Structures in Cairo
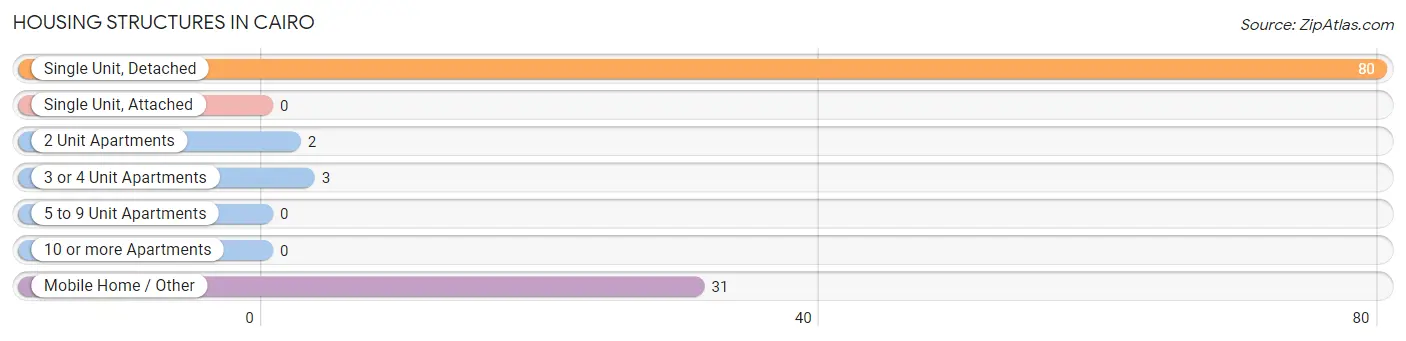
| Structure Type | # Housing Units | % Housing Units |
| Single Unit, Detached | 80 | 69.0% |
| Single Unit, Attached | 0 | 0.0% |
| 2 Unit Apartments | 2 | 1.7% |
| 3 or 4 Unit Apartments | 3 | 2.6% |
| 5 to 9 Unit Apartments | 0 | 0.0% |
| 10 or more Apartments | 0 | 0.0% |
| Mobile Home / Other | 31 | 26.7% |
| Total | 116 | 100.0% |
Housing Structures by Occupancy in Cairo
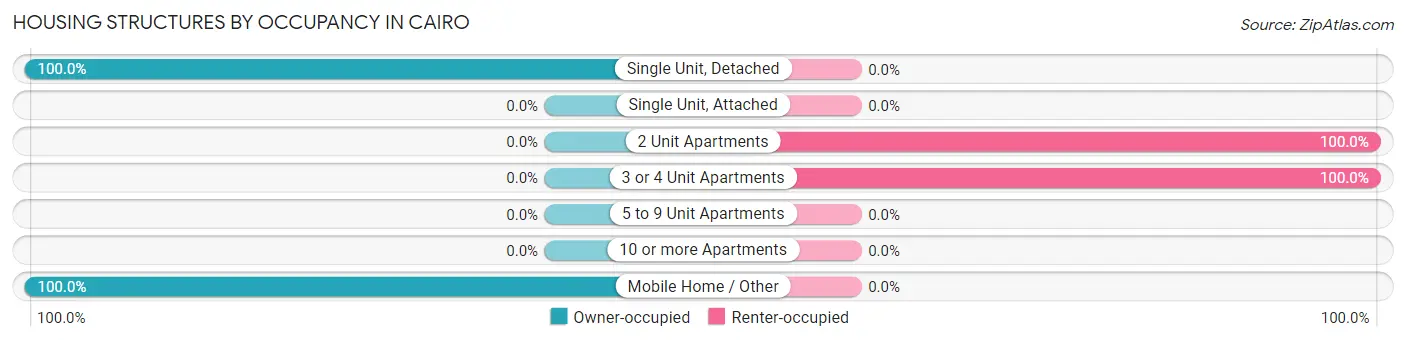
| Structure Type | Owner-occupied | Renter-occupied |
| Single Unit, Detached | 80 (100.0%) | 0 (0.0%) |
| Single Unit, Attached | 0 (0.0%) | 0 (0.0%) |
| 2 Unit Apartments | 0 (0.0%) | 2 (100.0%) |
| 3 or 4 Unit Apartments | 0 (0.0%) | 3 (100.0%) |
| 5 to 9 Unit Apartments | 0 (0.0%) | 0 (0.0%) |
| 10 or more Apartments | 0 (0.0%) | 0 (0.0%) |
| Mobile Home / Other | 31 (100.0%) | 0 (0.0%) |
| Total | 111 (95.7%) | 5 (4.3%) |
Housing Structures by Number of Rooms in Cairo
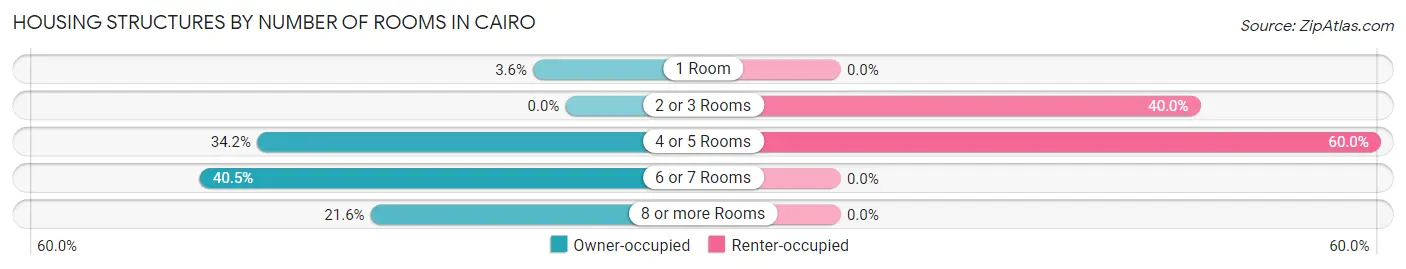
| Number of Rooms | Owner-occupied | Renter-occupied |
| 1 Room | 4 (3.6%) | 0 (0.0%) |
| 2 or 3 Rooms | 0 (0.0%) | 2 (40.0%) |
| 4 or 5 Rooms | 38 (34.2%) | 3 (60.0%) |
| 6 or 7 Rooms | 45 (40.5%) | 0 (0.0%) |
| 8 or more Rooms | 24 (21.6%) | 0 (0.0%) |
| Total | 111 (100.0%) | 5 (100.0%) |
Housing Structure by Heating Type in Cairo
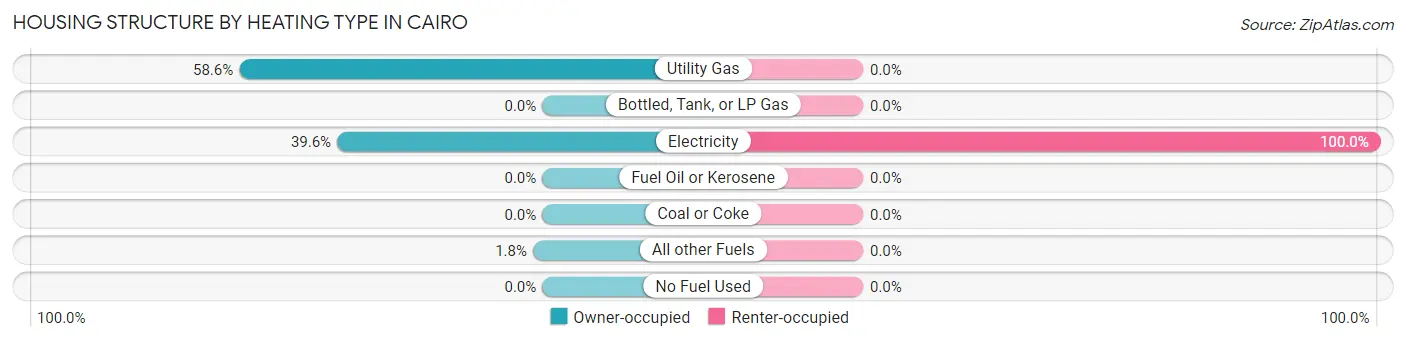
| Heating Type | Owner-occupied | Renter-occupied |
| Utility Gas | 65 (58.6%) | 0 (0.0%) |
| Bottled, Tank, or LP Gas | 0 (0.0%) | 0 (0.0%) |
| Electricity | 44 (39.6%) | 5 (100.0%) |
| Fuel Oil or Kerosene | 0 (0.0%) | 0 (0.0%) |
| Coal or Coke | 0 (0.0%) | 0 (0.0%) |
| All other Fuels | 2 (1.8%) | 0 (0.0%) |
| No Fuel Used | 0 (0.0%) | 0 (0.0%) |
| Total | 111 (100.0%) | 5 (100.0%) |
Household Vehicle Usage in Cairo
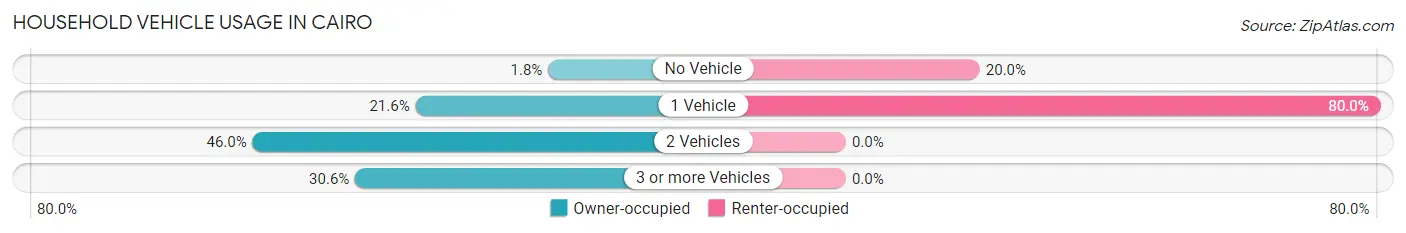
| Vehicles per Household | Owner-occupied | Renter-occupied |
| No Vehicle | 2 (1.8%) | 1 (20.0%) |
| 1 Vehicle | 24 (21.6%) | 4 (80.0%) |
| 2 Vehicles | 51 (46.0%) | 0 (0.0%) |
| 3 or more Vehicles | 34 (30.6%) | 0 (0.0%) |
| Total | 111 (100.0%) | 5 (100.0%) |
Real Estate & Mortgages in Cairo
Real Estate and Mortgage Overview in Cairo
| Characteristic | Without Mortgage | With Mortgage |
| Housing Units | 55 | 56 |
| Median Property Value | $86,300 | $116,700 |
| Median Household Income | $44,750 | $4 |
| Monthly Housing Costs | $381 | $0 |
| Real Estate Taxes | $430 | $0 |
Property Value by Mortgage Status in Cairo
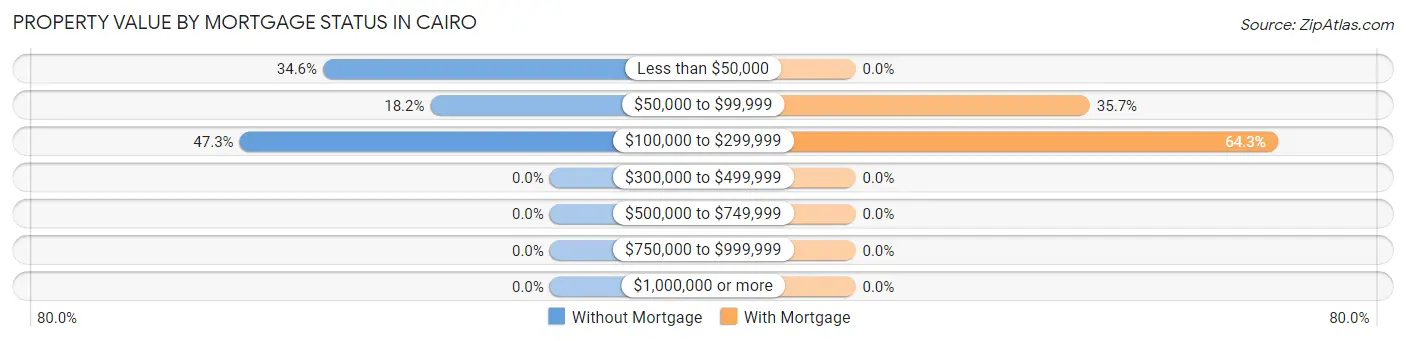
| Property Value | Without Mortgage | With Mortgage |
| Less than $50,000 | 19 (34.5%) | 0 (0.0%) |
| $50,000 to $99,999 | 10 (18.2%) | 20 (35.7%) |
| $100,000 to $299,999 | 26 (47.3%) | 36 (64.3%) |
| $300,000 to $499,999 | 0 (0.0%) | 0 (0.0%) |
| $500,000 to $749,999 | 0 (0.0%) | 0 (0.0%) |
| $750,000 to $999,999 | 0 (0.0%) | 0 (0.0%) |
| $1,000,000 or more | 0 (0.0%) | 0 (0.0%) |
| Total | 55 (100.0%) | 56 (100.0%) |
Household Income by Mortgage Status in Cairo
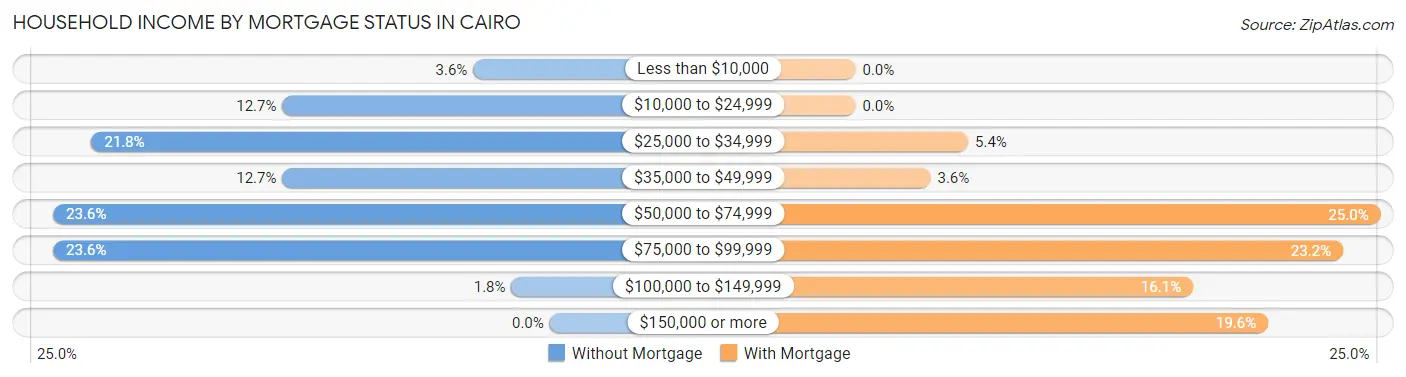
| Household Income | Without Mortgage | With Mortgage |
| Less than $10,000 | 2 (3.6%) | 0 (0.0%) |
| $10,000 to $24,999 | 7 (12.7%) | 0 (0.0%) |
| $25,000 to $34,999 | 12 (21.8%) | 3 (5.4%) |
| $35,000 to $49,999 | 7 (12.7%) | 2 (3.6%) |
| $50,000 to $74,999 | 13 (23.6%) | 14 (25.0%) |
| $75,000 to $99,999 | 13 (23.6%) | 13 (23.2%) |
| $100,000 to $149,999 | 1 (1.8%) | 9 (16.1%) |
| $150,000 or more | 0 (0.0%) | 11 (19.6%) |
| Total | 55 (100.0%) | 56 (100.0%) |
Property Value to Household Income Ratio in Cairo
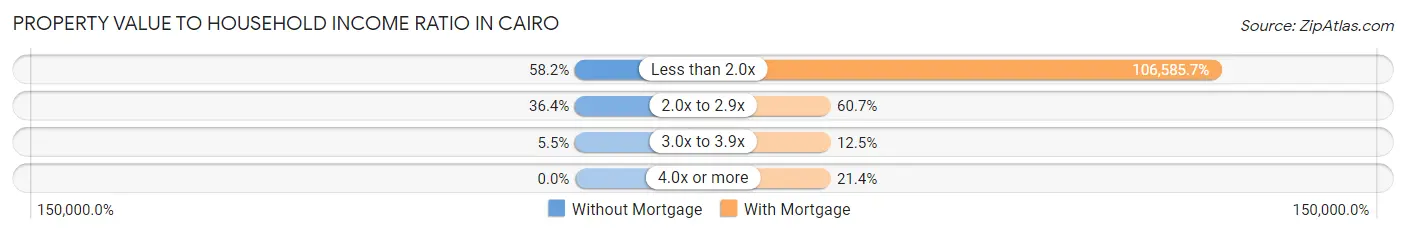
| Value-to-Income Ratio | Without Mortgage | With Mortgage |
| Less than 2.0x | 32 (58.2%) | 59,688 (106,585.7%) |
| 2.0x to 2.9x | 20 (36.4%) | 34 (60.7%) |
| 3.0x to 3.9x | 3 (5.4%) | 7 (12.5%) |
| 4.0x or more | 0 (0.0%) | 12 (21.4%) |
| Total | 55 (100.0%) | 56 (100.0%) |
Real Estate Taxes by Mortgage Status in Cairo
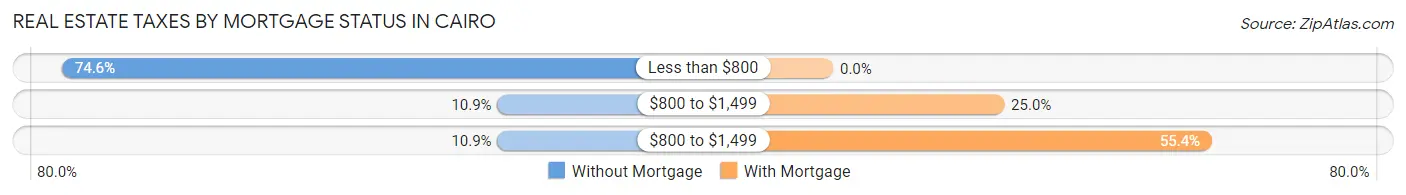
| Property Taxes | Without Mortgage | With Mortgage |
| Less than $800 | 41 (74.6%) | 0 (0.0%) |
| $800 to $1,499 | 6 (10.9%) | 14 (25.0%) |
| $800 to $1,499 | 6 (10.9%) | 31 (55.4%) |
| Total | 55 (100.0%) | 56 (100.0%) |
Health & Disability in Cairo
Health Insurance Coverage by Age in Cairo
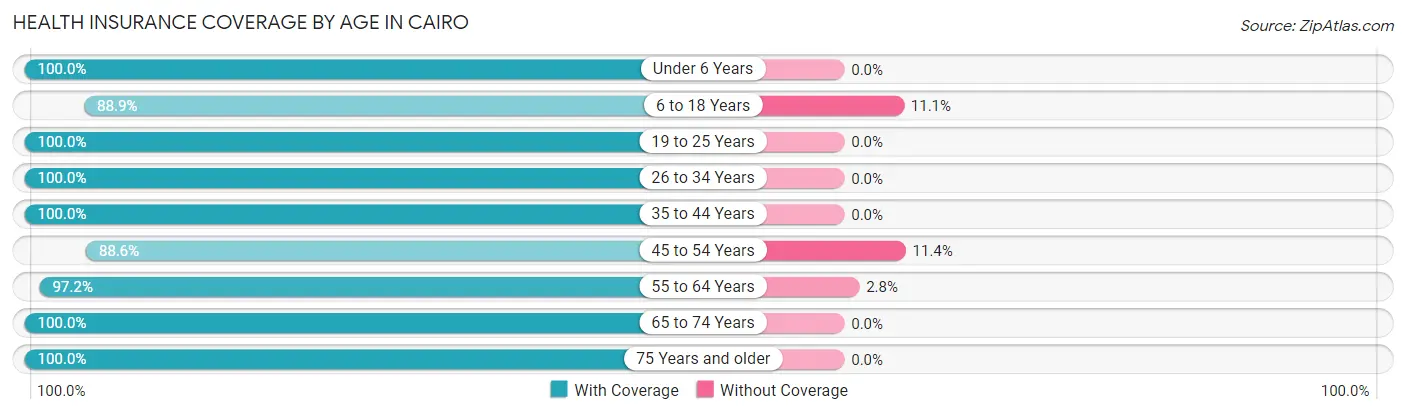
| Age Bracket | With Coverage | Without Coverage |
| Under 6 Years | 13 (100.0%) | 0 (0.0%) |
| 6 to 18 Years | 24 (88.9%) | 3 (11.1%) |
| 19 to 25 Years | 16 (100.0%) | 0 (0.0%) |
| 26 to 34 Years | 9 (100.0%) | 0 (0.0%) |
| 35 to 44 Years | 13 (100.0%) | 0 (0.0%) |
| 45 to 54 Years | 31 (88.6%) | 4 (11.4%) |
| 55 to 64 Years | 70 (97.2%) | 2 (2.8%) |
| 65 to 74 Years | 34 (100.0%) | 0 (0.0%) |
| 75 Years and older | 23 (100.0%) | 0 (0.0%) |
| Total | 233 (96.3%) | 9 (3.7%) |
Health Insurance Coverage by Citizenship Status in Cairo
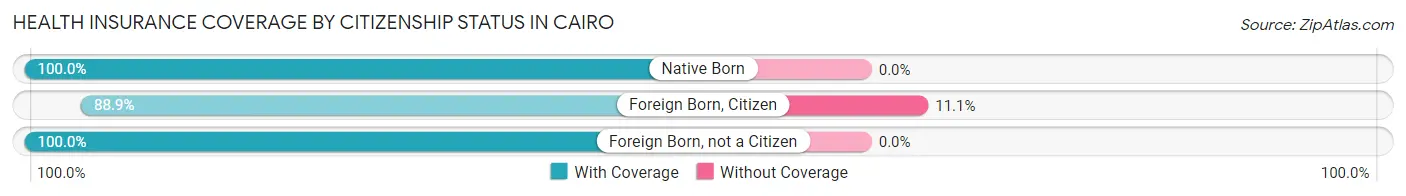
| Citizenship Status | With Coverage | Without Coverage |
| Native Born | 13 (100.0%) | 0 (0.0%) |
| Foreign Born, Citizen | 24 (88.9%) | 3 (11.1%) |
| Foreign Born, not a Citizen | 16 (100.0%) | 0 (0.0%) |
Health Insurance Coverage by Household Income in Cairo
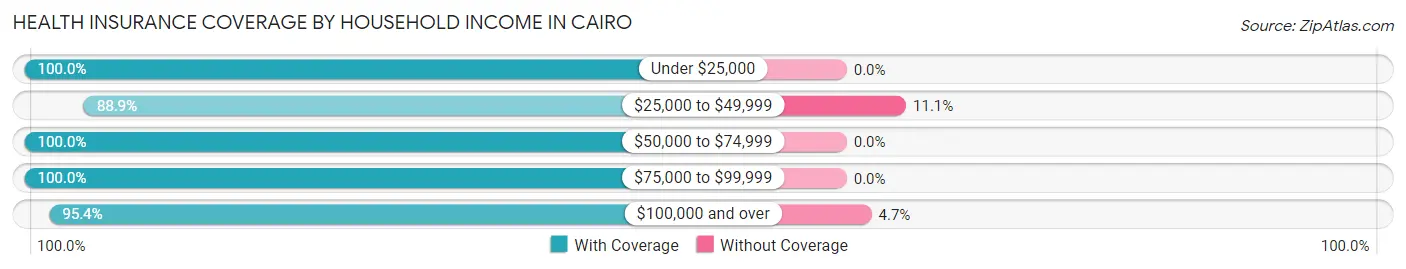
| Household Income | With Coverage | Without Coverage |
| Under $25,000 | 22 (100.0%) | 0 (0.0%) |
| $25,000 to $49,999 | 56 (88.9%) | 7 (11.1%) |
| $50,000 to $74,999 | 72 (100.0%) | 0 (0.0%) |
| $75,000 to $99,999 | 42 (100.0%) | 0 (0.0%) |
| $100,000 and over | 41 (95.4%) | 2 (4.6%) |
Public vs Private Health Insurance Coverage by Age in Cairo
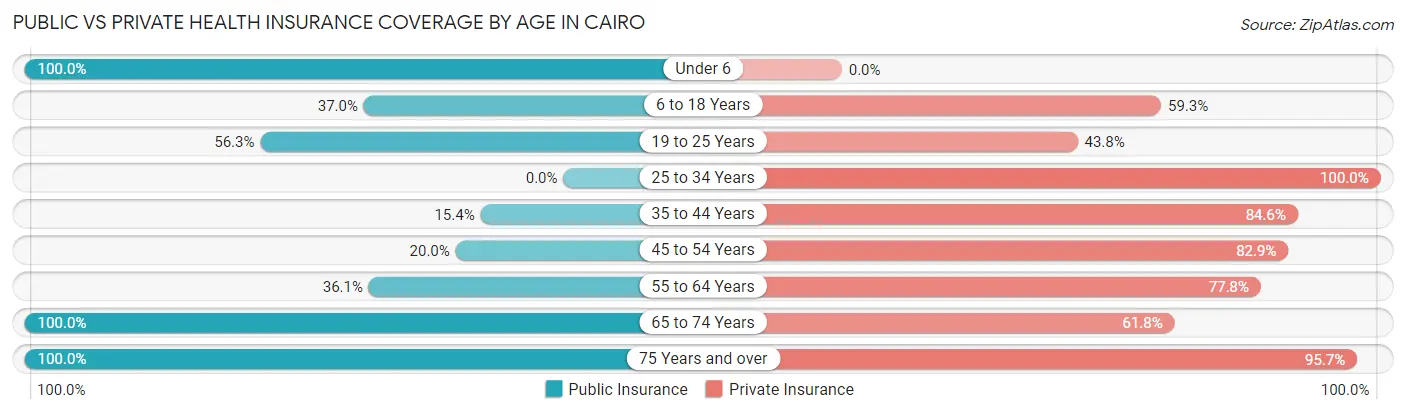
| Age Bracket | Public Insurance | Private Insurance |
| Under 6 | 13 (100.0%) | 0 (0.0%) |
| 6 to 18 Years | 10 (37.0%) | 16 (59.3%) |
| 19 to 25 Years | 9 (56.2%) | 7 (43.8%) |
| 25 to 34 Years | 0 (0.0%) | 9 (100.0%) |
| 35 to 44 Years | 2 (15.4%) | 11 (84.6%) |
| 45 to 54 Years | 7 (20.0%) | 29 (82.9%) |
| 55 to 64 Years | 26 (36.1%) | 56 (77.8%) |
| 65 to 74 Years | 34 (100.0%) | 21 (61.8%) |
| 75 Years and over | 23 (100.0%) | 22 (95.7%) |
| Total | 124 (51.2%) | 171 (70.7%) |
Disability Status by Sex by Age in Cairo
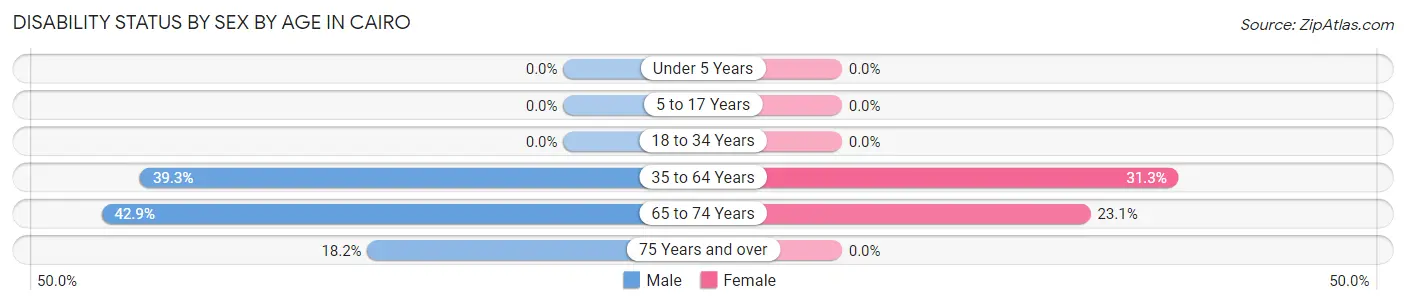
| Age Bracket | Male | Female |
| Under 5 Years | 0 (0.0%) | 0 (0.0%) |
| 5 to 17 Years | 0 (0.0%) | 0 (0.0%) |
| 18 to 34 Years | 0 (0.0%) | 0 (0.0%) |
| 35 to 64 Years | 22 (39.3%) | 20 (31.2%) |
| 65 to 74 Years | 9 (42.9%) | 3 (23.1%) |
| 75 Years and over | 2 (18.2%) | 0 (0.0%) |
Disability Class by Sex by Age in Cairo
Disability Class: Hearing Difficulty
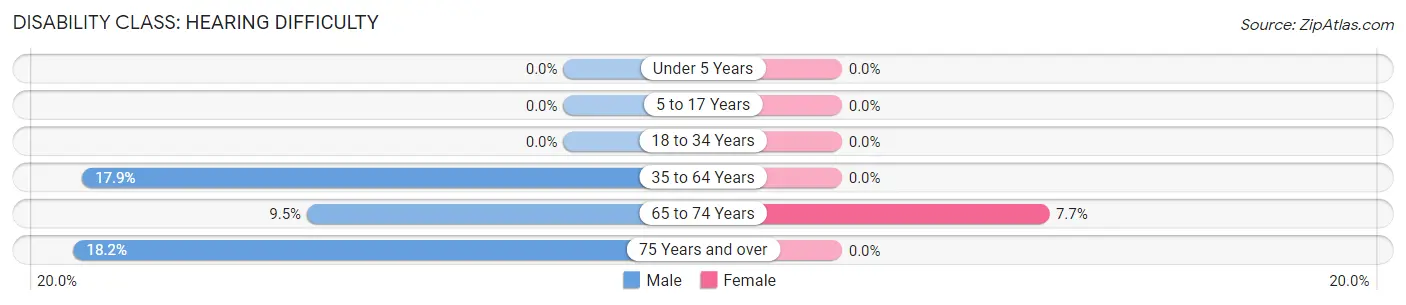
| Age Bracket | Male | Female |
| Under 5 Years | 0 (0.0%) | 0 (0.0%) |
| 5 to 17 Years | 0 (0.0%) | 0 (0.0%) |
| 18 to 34 Years | 0 (0.0%) | 0 (0.0%) |
| 35 to 64 Years | 10 (17.9%) | 0 (0.0%) |
| 65 to 74 Years | 2 (9.5%) | 1 (7.7%) |
| 75 Years and over | 2 (18.2%) | 0 (0.0%) |
Disability Class: Vision Difficulty
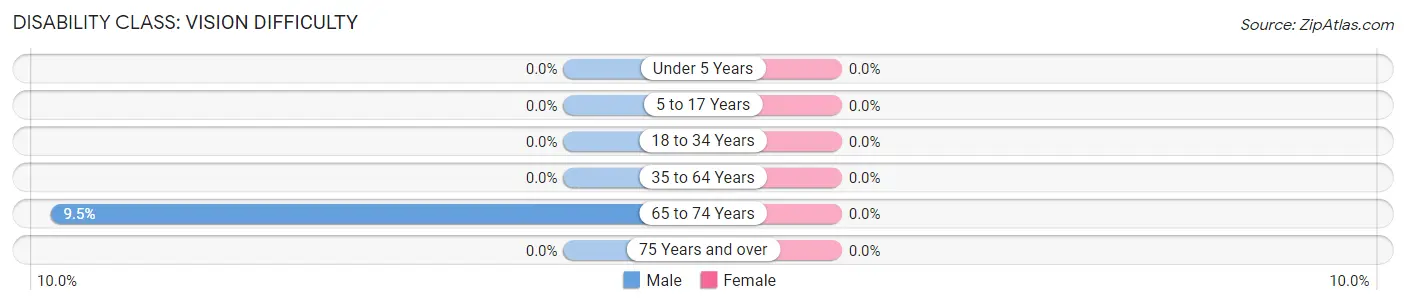
| Age Bracket | Male | Female |
| Under 5 Years | 0 (0.0%) | 0 (0.0%) |
| 5 to 17 Years | 0 (0.0%) | 0 (0.0%) |
| 18 to 34 Years | 0 (0.0%) | 0 (0.0%) |
| 35 to 64 Years | 0 (0.0%) | 0 (0.0%) |
| 65 to 74 Years | 2 (9.5%) | 0 (0.0%) |
| 75 Years and over | 0 (0.0%) | 0 (0.0%) |
Disability Class: Cognitive Difficulty
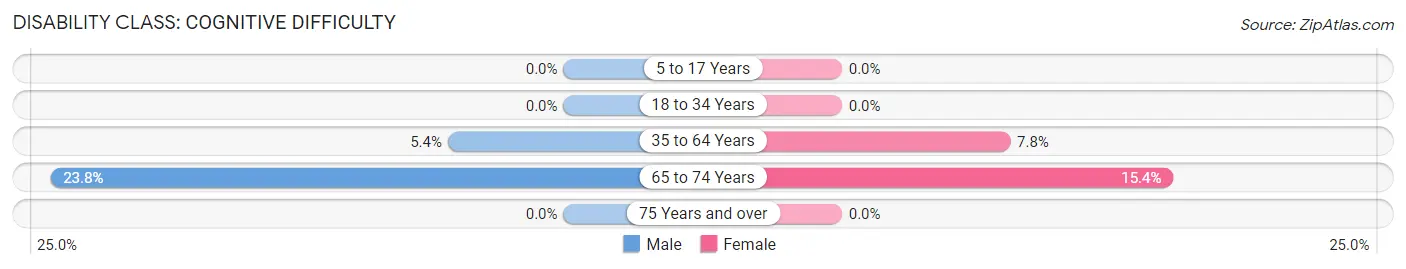
| Age Bracket | Male | Female |
| 5 to 17 Years | 0 (0.0%) | 0 (0.0%) |
| 18 to 34 Years | 0 (0.0%) | 0 (0.0%) |
| 35 to 64 Years | 3 (5.4%) | 5 (7.8%) |
| 65 to 74 Years | 5 (23.8%) | 2 (15.4%) |
| 75 Years and over | 0 (0.0%) | 0 (0.0%) |
Disability Class: Ambulatory Difficulty
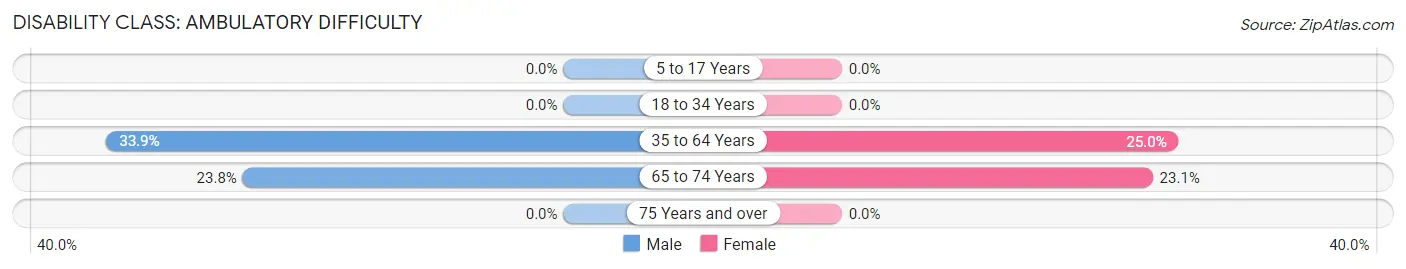
| Age Bracket | Male | Female |
| 5 to 17 Years | 0 (0.0%) | 0 (0.0%) |
| 18 to 34 Years | 0 (0.0%) | 0 (0.0%) |
| 35 to 64 Years | 19 (33.9%) | 16 (25.0%) |
| 65 to 74 Years | 5 (23.8%) | 3 (23.1%) |
| 75 Years and over | 0 (0.0%) | 0 (0.0%) |
Disability Class: Self-Care Difficulty
| Age Bracket | Male | Female |
| 5 to 17 Years | 0 (0.0%) | 0 (0.0%) |
| 18 to 34 Years | 0 (0.0%) | 0 (0.0%) |
| 35 to 64 Years | 0 (0.0%) | 0 (0.0%) |
| 65 to 74 Years | 0 (0.0%) | 0 (0.0%) |
| 75 Years and over | 0 (0.0%) | 0 (0.0%) |
Technology Access in Cairo
Computing Device Access in Cairo
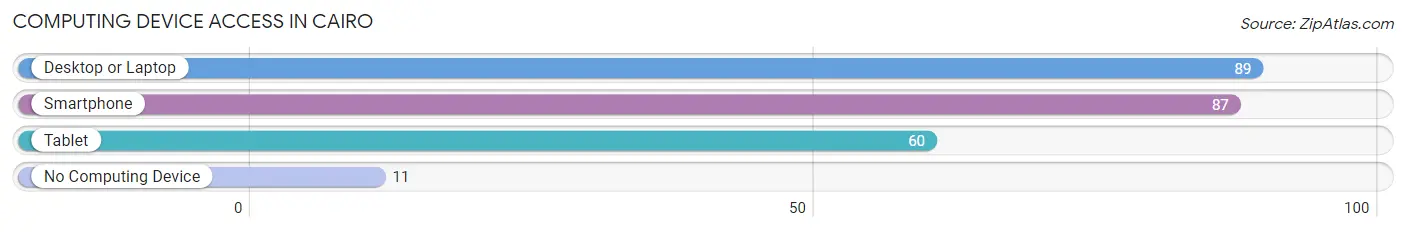
| Device Type | # Households | % Households |
| Desktop or Laptop | 89 | 76.7% |
| Smartphone | 87 | 75.0% |
| Tablet | 60 | 51.7% |
| No Computing Device | 11 | 9.5% |
| Total | 116 | 100.0% |
Internet Access in Cairo
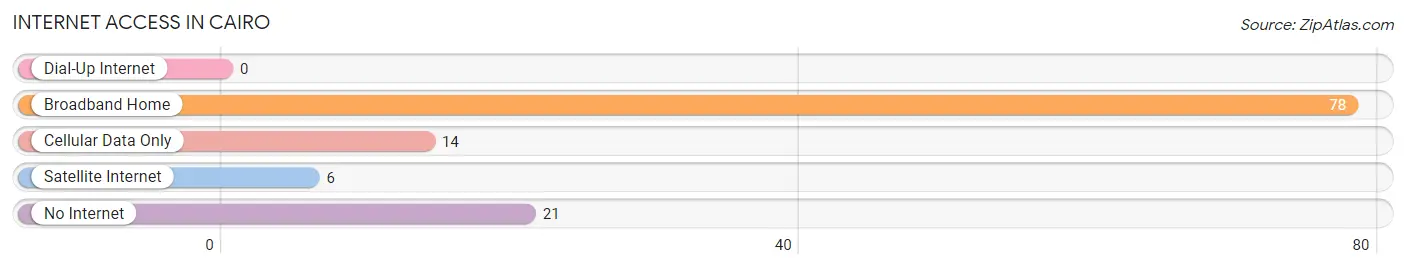
| Internet Type | # Households | % Households |
| Dial-Up Internet | 0 | 0.0% |
| Broadband Home | 78 | 67.2% |
| Cellular Data Only | 14 | 12.1% |
| Satellite Internet | 6 | 5.2% |
| No Internet | 21 | 18.1% |
| Total | 116 | 100.0% |
Cairo Summary
Cairo, Missouri is a small city located in the southeastern corner of the state, near the Mississippi River. It is the county seat of Alexander County and is part of the Cape Girardeau-Jackson, MO-IL Metropolitan Statistical Area. The city has a population of 2,831 as of the 2010 census, and is the second-largest city in the county.
History
Cairo was founded in 1837 by a group of settlers from Kentucky and Tennessee. The city was named after Cairo, Illinois, which was located across the Mississippi River. The city was originally intended to be a trading post, but it quickly grew into a thriving community. The city was incorporated in 1854 and was the county seat of Alexander County.
During the Civil War, Cairo was a major supply center for the Union Army. It was also the site of several battles, including the Battle of Belmont in 1861 and the Battle of Island Number Ten in 1862. After the war, Cairo continued to grow and by the late 19th century, it was a major port city.
Geography
Cairo is located at the confluence of the Mississippi and Ohio Rivers. It is situated on the western bank of the Mississippi River, just south of the Missouri-Illinois border. The city has a total area of 4.2 square miles, all of which is land.
The city is located in a humid subtropical climate zone, with hot, humid summers and mild winters. The average annual temperature is 61°F, with an average high of 79°F in July and an average low of 43°F in January. The average annual precipitation is 45.3 inches.
Economy
Cairo’s economy is largely based on agriculture and manufacturing. The city is home to several large agricultural operations, including grain elevators, feed mills, and livestock operations. The city is also home to several manufacturing companies, including a paper mill, a furniture factory, and a plastics plant.
The city is also home to several retail stores, restaurants, and other businesses. The city’s largest employer is the Alexander County School District, which employs over 500 people.
Demographics
As of the 2010 census, there were 2,831 people, 1,093 households, and 690 families living in the city. The population density was 676.2 people per square mile. The racial makeup of the city was 79.2% White, 17.7% African American, 0.3% Native American, 0.2% Asian, 0.1% Pacific Islander, 0.7% from other races, and 1.9% from two or more races. Hispanic or Latino of any race were 2.2% of the population.
The median income for a household in the city was $25,938, and the median income for a family was $32,813. The per capita income for the city was $14,845. About 22.2% of families and 25.3% of the population were below the poverty line, including 36.2% of those under age 18 and 16.2% of those age 65 or over.
Common Questions
What is Per Capita Income in Cairo?
Per Capita income in Cairo is $30,034.
What is the Median Family Income in Cairo?
Median Family Income in Cairo is $58,125.
What is the Median Household income in Cairo?
Median Household Income in Cairo is $57,000.
What is Income or Wage Gap in Cairo?
Income or Wage Gap in Cairo is 26.2%.
Women in Cairo earn 73.8 cents for every dollar earned by a man.
What is Inequality or Gini Index in Cairo?
Inequality or Gini Index in Cairo is 0.32.
What is the Total Population of Cairo?
Total Population of Cairo is 242.
What is the Total Male Population of Cairo?
Total Male Population of Cairo is 108.
What is the Total Female Population of Cairo?
Total Female Population of Cairo is 134.
What is the Ratio of Males per 100 Females in Cairo?
There are 80.60 Males per 100 Females in Cairo.
What is the Ratio of Females per 100 Males in Cairo?
There are 124.07 Females per 100 Males in Cairo.
What is the Median Population Age in Cairo?
Median Population Age in Cairo is 55.8 Years.
What is the Average Family Size in Cairo
Average Family Size in Cairo is 2.4 People.
What is the Average Household Size in Cairo
Average Household Size in Cairo is 2.1 People.
How Large is the Labor Force in Cairo?
There are 105 People in the Labor Forcein in Cairo.
What is the Percentage of People in the Labor Force in Cairo?
49.5% of People are in the Labor Force in Cairo.
What is the Unemployment Rate in Cairo?
Unemployment Rate in Cairo is 2.9%.