Bunceton, MO Map & Demographics
Bunceton Map
Bunceton Overview
$23,755
PER CAPITA INCOME
$49,375
AVG FAMILY INCOME
$46,250
AVG HOUSEHOLD INCOME
21.7%
WAGE / INCOME GAP [ % ]
78.3¢/ $1
WAGE / INCOME GAP [ $ ]
0.35
INEQUALITY / GINI INDEX
298
TOTAL POPULATION
135
MALE POPULATION
163
FEMALE POPULATION
82.82
MALES / 100 FEMALES
120.74
FEMALES / 100 MALES
37.7
MEDIAN AGE
2.9
AVG FAMILY SIZE
2.5
AVG HOUSEHOLD SIZE
169
LABOR FORCE [ PEOPLE ]
70.7%
PERCENT IN LABOR FORCE
1.8%
UNEMPLOYMENT RATE
Bunceton Zip Codes
Bunceton Area Codes
Income in Bunceton
Income Overview in Bunceton
Per Capita Income in Bunceton is $23,755, while median incomes of families and households are $49,375 and $46,250 respectively.
| Characteristic | Number | Measure |
| Per Capita Income | 298 | $23,755 |
| Median Family Income | 79 | $49,375 |
| Mean Family Income | 79 | $55,538 |
| Median Household Income | 120 | $46,250 |
| Mean Household Income | 120 | $59,307 |
| Income Deficit | 79 | $0 |
| Wage / Income Gap (%) | 298 | 21.70% |
| Wage / Income Gap ($) | 298 | 78.30¢ per $1 |
| Gini / Inequality Index | 298 | 0.35 |
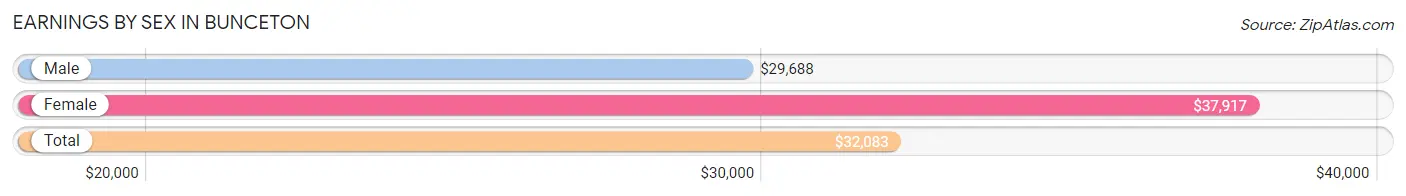
Earnings by Sex in Bunceton
Average Earnings in Bunceton are $32,083, $29,688 for men and $37,917 for women, a difference of 21.7%.
| Sex | Number | Average Earnings |
| Male | 88 (49.2%) | $29,688 |
| Female | 91 (50.8%) | $37,917 |
| Total | 179 (100.0%) | $32,083 |
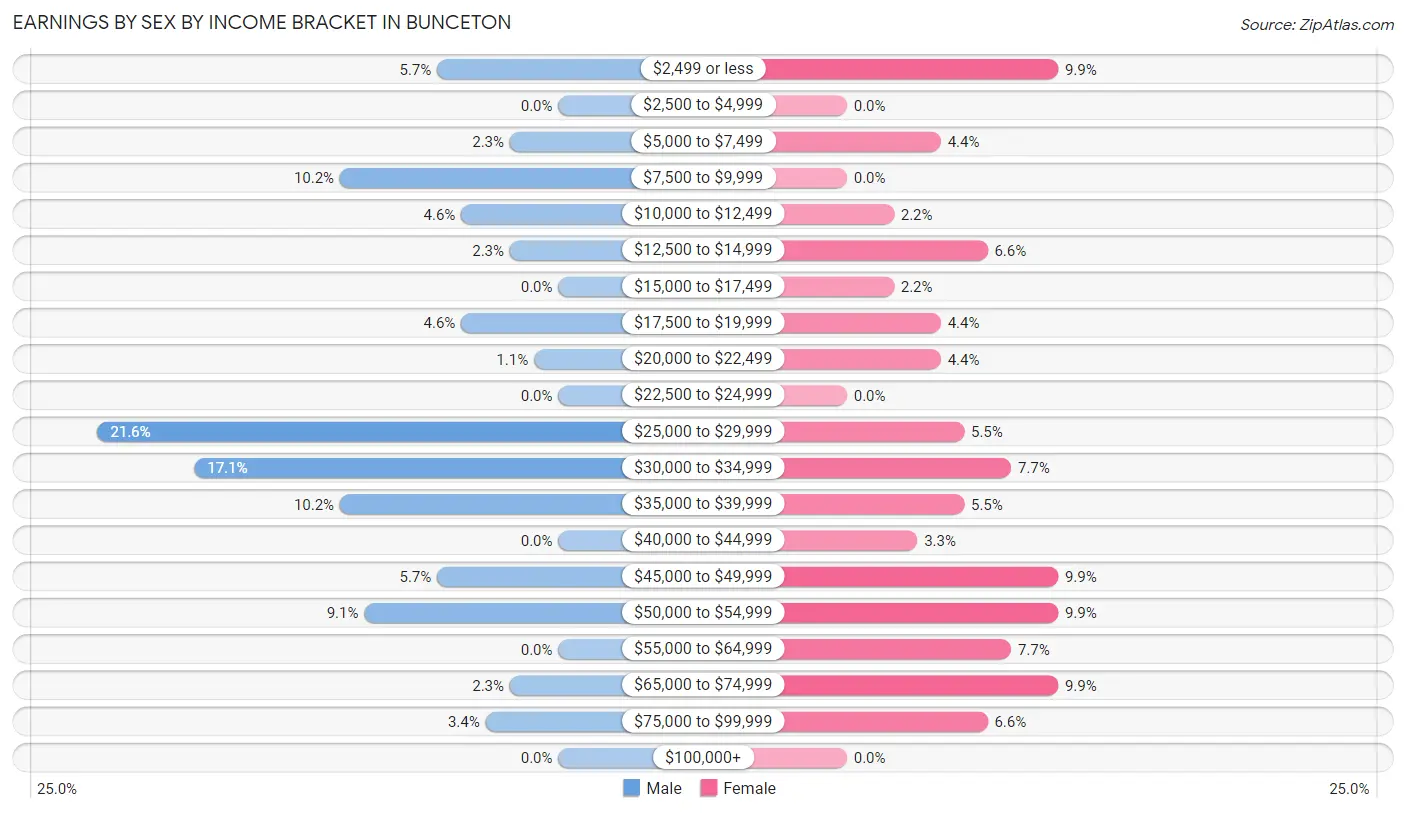
Earnings by Sex by Income Bracket in Bunceton
The most common earnings brackets in Bunceton are $25,000 to $29,999 for men (19 | 21.6%) and $2,499 or less for women (9 | 9.9%).
| Income | Male | Female |
| $2,499 or less | 5 (5.7%) | 9 (9.9%) |
| $2,500 to $4,999 | 0 (0.0%) | 0 (0.0%) |
| $5,000 to $7,499 | 2 (2.3%) | 4 (4.4%) |
| $7,500 to $9,999 | 9 (10.2%) | 0 (0.0%) |
| $10,000 to $12,499 | 4 (4.5%) | 2 (2.2%) |
| $12,500 to $14,999 | 2 (2.3%) | 6 (6.6%) |
| $15,000 to $17,499 | 0 (0.0%) | 2 (2.2%) |
| $17,500 to $19,999 | 4 (4.5%) | 4 (4.4%) |
| $20,000 to $22,499 | 1 (1.1%) | 4 (4.4%) |
| $22,500 to $24,999 | 0 (0.0%) | 0 (0.0%) |
| $25,000 to $29,999 | 19 (21.6%) | 5 (5.5%) |
| $30,000 to $34,999 | 15 (17.1%) | 7 (7.7%) |
| $35,000 to $39,999 | 9 (10.2%) | 5 (5.5%) |
| $40,000 to $44,999 | 0 (0.0%) | 3 (3.3%) |
| $45,000 to $49,999 | 5 (5.7%) | 9 (9.9%) |
| $50,000 to $54,999 | 8 (9.1%) | 9 (9.9%) |
| $55,000 to $64,999 | 0 (0.0%) | 7 (7.7%) |
| $65,000 to $74,999 | 2 (2.3%) | 9 (9.9%) |
| $75,000 to $99,999 | 3 (3.4%) | 6 (6.6%) |
| $100,000+ | 0 (0.0%) | 0 (0.0%) |
| Total | 88 (100.0%) | 91 (100.0%) |
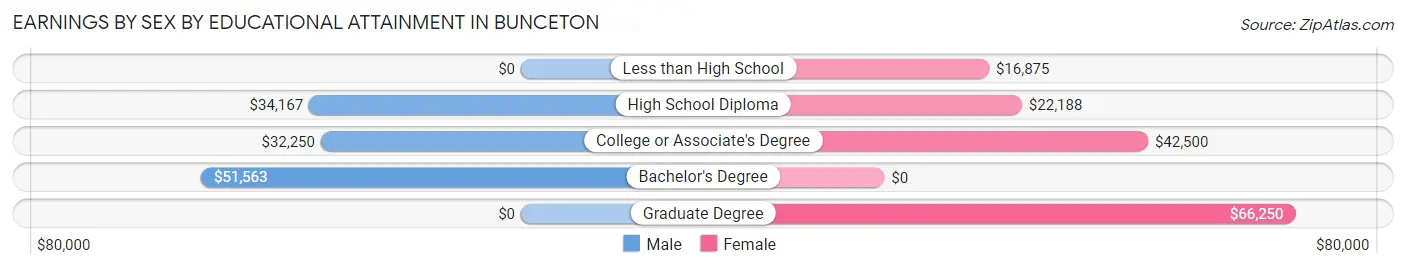
Earnings by Sex by Educational Attainment in Bunceton
Average earnings in Bunceton are $31,875 for men and $40,833 for women, a difference of 21.9%. Men with an educational attainment of bachelor's degree enjoy the highest average annual earnings of $51,563, while those with college or associate's degree education earn the least with $32,250. Women with an educational attainment of graduate degree earn the most with the average annual earnings of $66,250, while those with less than high school education have the smallest earnings of $16,875.
| Educational Attainment | Male Income | Female Income |
| Less than High School | - | - |
| High School Diploma | $34,167 | $22,188 |
| College or Associate's Degree | $32,250 | $42,500 |
| Bachelor's Degree | $51,563 | $0 |
| Graduate Degree | - | - |
| Total | $31,875 | $40,833 |
Family Income in Bunceton
Family Income Brackets in Bunceton
According to the Bunceton family income data, there are 16 families falling into the $100,000 to $149,999 income range, which is the most common income bracket and makes up 20.3% of all families.

| Income Bracket | # Families | % Families |
| Less than $10,000 | 15 | 19.0% |
| $10,000 to $14,999 | 6 | 7.6% |
| $15,000 to $24,999 | 2 | 2.5% |
| $25,000 to $34,999 | 9 | 11.4% |
| $35,000 to $49,999 | 8 | 10.1% |
| $50,000 to $74,999 | 9 | 11.4% |
| $75,000 to $99,999 | 14 | 17.7% |
| $100,000 to $149,999 | 16 | 20.3% |
| $150,000 to $199,999 | 0 | 0.0% |
| $200,000+ | 0 | 0.0% |
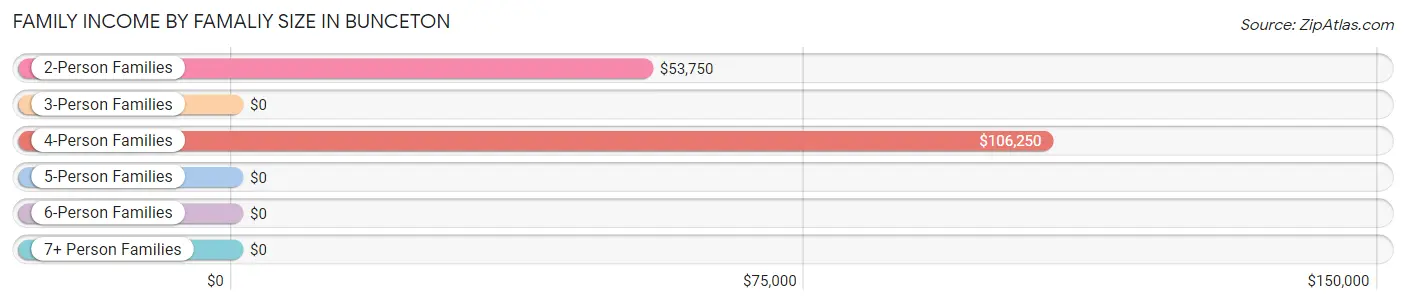
Family Income by Famaliy Size in Bunceton
4-person families (12 | 15.2%) account for the highest median family income in Bunceton with $106,250 per family, while 2-person families (30 | 38.0%) have the highest median income of $26,875 per family member.
| Income Bracket | # Families | Median Income |
| 2-Person Families | 30 (38.0%) | $53,750 |
| 3-Person Families | 32 (40.5%) | $0 |
| 4-Person Families | 12 (15.2%) | $106,250 |
| 5-Person Families | 5 (6.3%) | $0 |
| 6-Person Families | 0 (0.0%) | $0 |
| 7+ Person Families | 0 (0.0%) | $0 |
| Total | 79 (100.0%) | $49,375 |
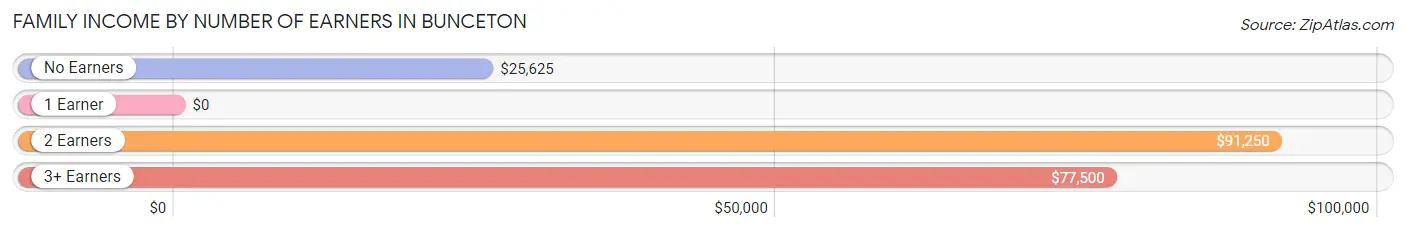
Family Income by Number of Earners in Bunceton
| Number of Earners | # Families | Median Income |
| No Earners | 10 (12.7%) | $25,625 |
| 1 Earner | 33 (41.8%) | $0 |
| 2 Earners | 30 (38.0%) | $91,250 |
| 3+ Earners | 6 (7.6%) | $77,500 |
| Total | 79 (100.0%) | $49,375 |
Household Income in Bunceton
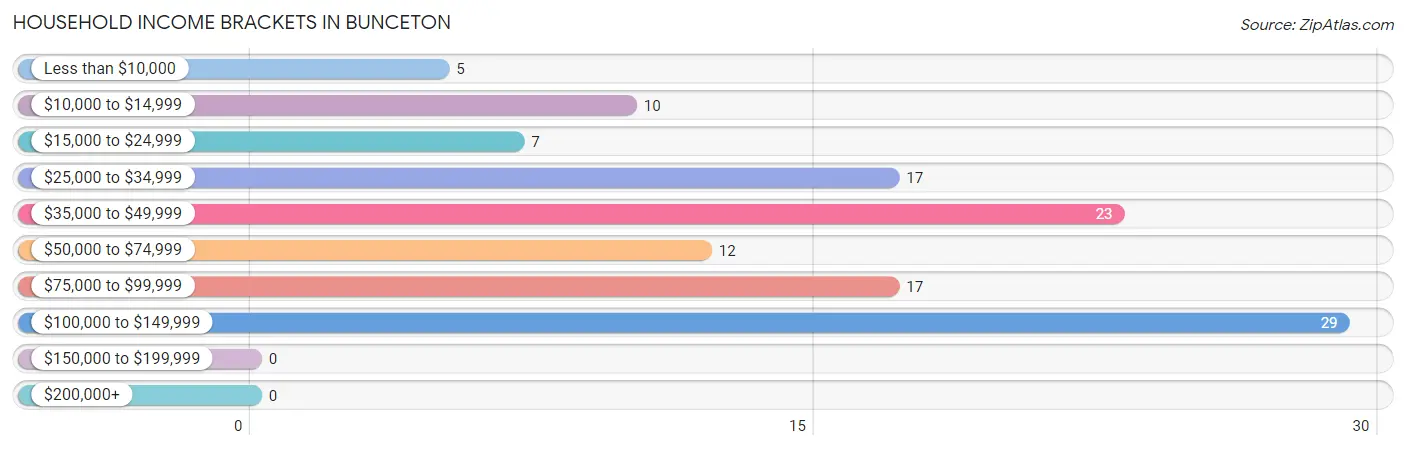
Household Income Brackets in Bunceton
With 29 households falling in the category, the $100,000 to $149,999 income range is the most frequent in Bunceton, accounting for 24.2% of all households.
| Income Bracket | # Households | % Households |
| Less than $10,000 | 5 | 4.2% |
| $10,000 to $14,999 | 10 | 8.3% |
| $15,000 to $24,999 | 7 | 5.8% |
| $25,000 to $34,999 | 17 | 14.2% |
| $35,000 to $49,999 | 23 | 19.2% |
| $50,000 to $74,999 | 12 | 10.0% |
| $75,000 to $99,999 | 17 | 14.2% |
| $100,000 to $149,999 | 29 | 24.2% |
| $150,000 to $199,999 | 0 | 0.0% |
| $200,000+ | 0 | 0.0% |
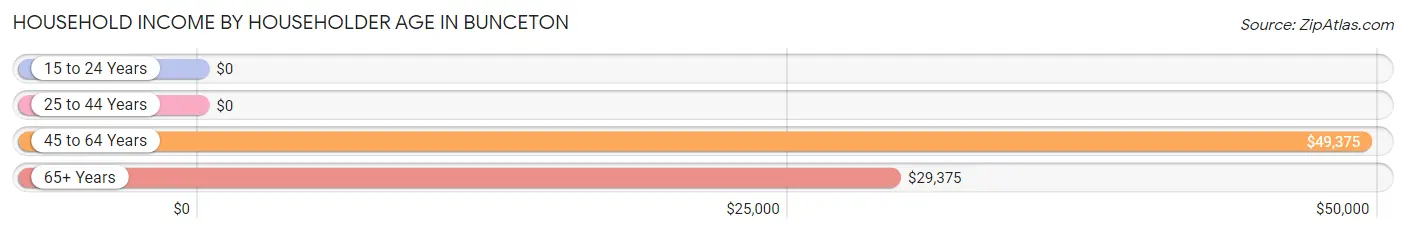
Household Income by Householder Age in Bunceton
The median household income in Bunceton is $46,250, with the highest median household income of $49,375 found in the 45 to 64 years age bracket for the primary householder. A total of 51 households (42.5%) fall into this category. Meanwhile, the 15 to 24 years age bracket for the primary householder has the lowest median household income of $0, with 3 households (2.5%) in this group.
| Income Bracket | # Households | Median Income |
| 15 to 24 Years | 3 (2.5%) | $0 |
| 25 to 44 Years | 41 (34.2%) | $0 |
| 45 to 64 Years | 51 (42.5%) | $49,375 |
| 65+ Years | 25 (20.8%) | $29,375 |
| Total | 120 (100.0%) | $46,250 |
Poverty in Bunceton
Income Below Poverty by Sex and Age in Bunceton
With 25.9% poverty level for males and 25.8% for females among the residents of Bunceton, 5 year old males and 6 to 11 year old females are the most vulnerable to poverty, with 3 males (100.0%) and 9 females (52.9%) in their respective age groups living below the poverty level.
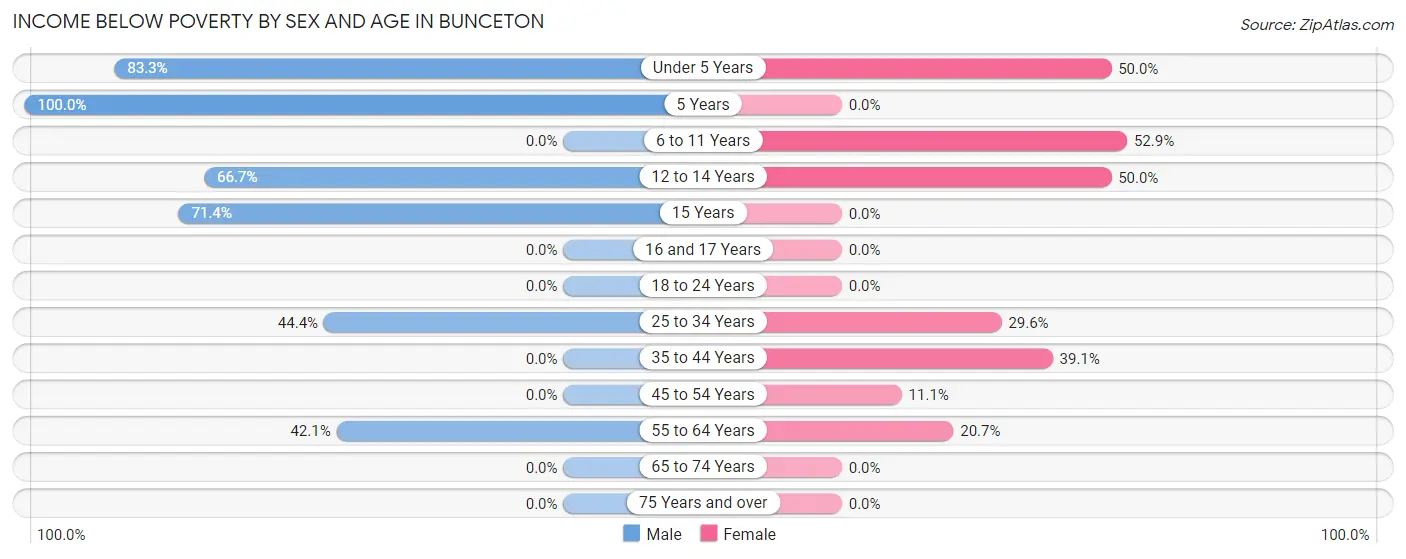
| Age Bracket | Male | Female |
| Under 5 Years | 5 (83.3%) | 3 (50.0%) |
| 5 Years | 3 (100.0%) | 0 (0.0%) |
| 6 to 11 Years | 0 (0.0%) | 9 (52.9%) |
| 12 to 14 Years | 2 (66.7%) | 5 (50.0%) |
| 15 Years | 5 (71.4%) | 0 (0.0%) |
| 16 and 17 Years | 0 (0.0%) | 0 (0.0%) |
| 18 to 24 Years | 0 (0.0%) | 0 (0.0%) |
| 25 to 34 Years | 12 (44.4%) | 8 (29.6%) |
| 35 to 44 Years | 0 (0.0%) | 9 (39.1%) |
| 45 to 54 Years | 0 (0.0%) | 2 (11.1%) |
| 55 to 64 Years | 8 (42.1%) | 6 (20.7%) |
| 65 to 74 Years | 0 (0.0%) | 0 (0.0%) |
| 75 Years and over | 0 (0.0%) | 0 (0.0%) |
| Total | 35 (25.9%) | 42 (25.8%) |
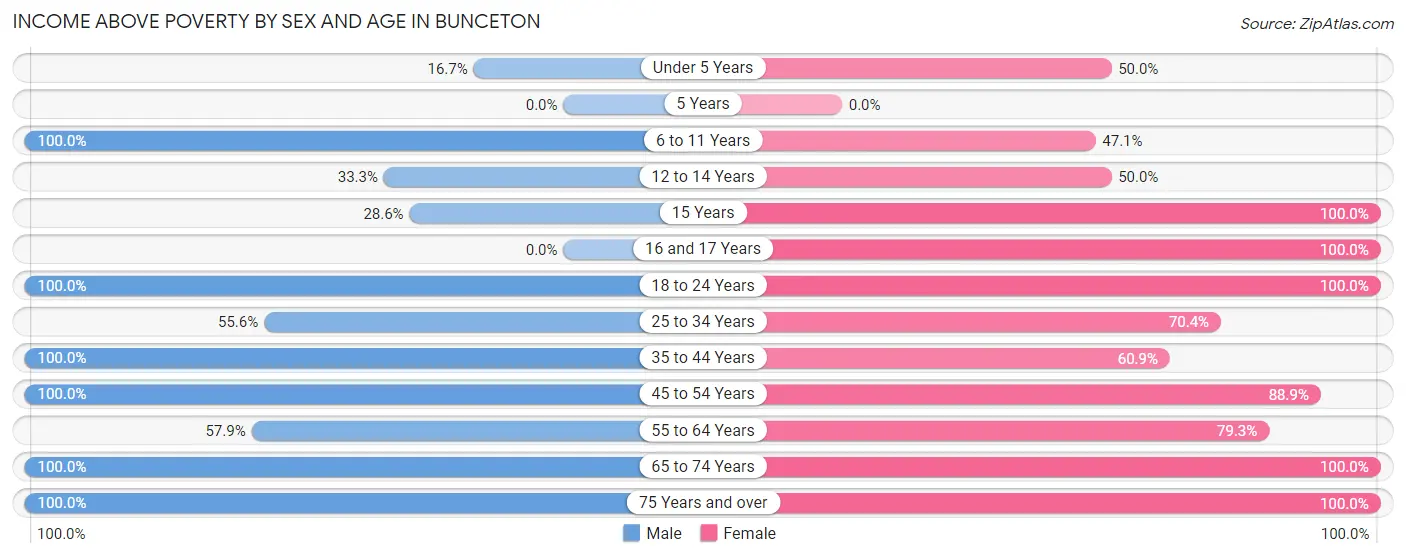
Income Above Poverty by Sex and Age in Bunceton
According to the poverty statistics in Bunceton, males aged 6 to 11 years and females aged 15 years are the age groups that are most secure financially, with 100.0% of males and 100.0% of females in these age groups living above the poverty line.
| Age Bracket | Male | Female |
| Under 5 Years | 1 (16.7%) | 3 (50.0%) |
| 5 Years | 0 (0.0%) | 0 (0.0%) |
| 6 to 11 Years | 4 (100.0%) | 8 (47.1%) |
| 12 to 14 Years | 1 (33.3%) | 5 (50.0%) |
| 15 Years | 2 (28.6%) | 3 (100.0%) |
| 16 and 17 Years | 0 (0.0%) | 4 (100.0%) |
| 18 to 24 Years | 21 (100.0%) | 6 (100.0%) |
| 25 to 34 Years | 15 (55.6%) | 19 (70.4%) |
| 35 to 44 Years | 13 (100.0%) | 14 (60.9%) |
| 45 to 54 Years | 15 (100.0%) | 16 (88.9%) |
| 55 to 64 Years | 11 (57.9%) | 23 (79.3%) |
| 65 to 74 Years | 12 (100.0%) | 12 (100.0%) |
| 75 Years and over | 5 (100.0%) | 8 (100.0%) |
| Total | 100 (74.1%) | 121 (74.2%) |
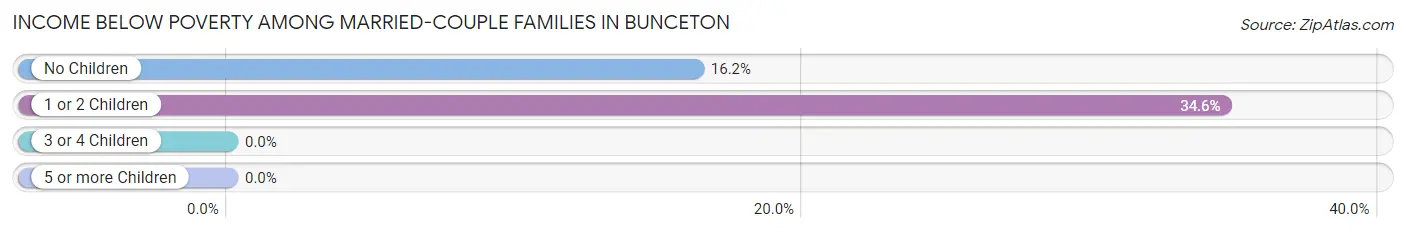
Income Below Poverty Among Married-Couple Families in Bunceton
The poverty statistics for married-couple families in Bunceton show that 23.8% or 15 of the total 63 families live below the poverty line. Families with 1 or 2 children have the highest poverty rate of 34.6%, comprising of 9 families. On the other hand, families with no children have the lowest poverty rate of 16.2%, which includes 6 families.
| Children | Above Poverty | Below Poverty |
| No Children | 31 (83.8%) | 6 (16.2%) |
| 1 or 2 Children | 17 (65.4%) | 9 (34.6%) |
| 3 or 4 Children | 0 (0.0%) | 0 (0.0%) |
| 5 or more Children | 0 (0.0%) | 0 (0.0%) |
| Total | 48 (76.2%) | 15 (23.8%) |
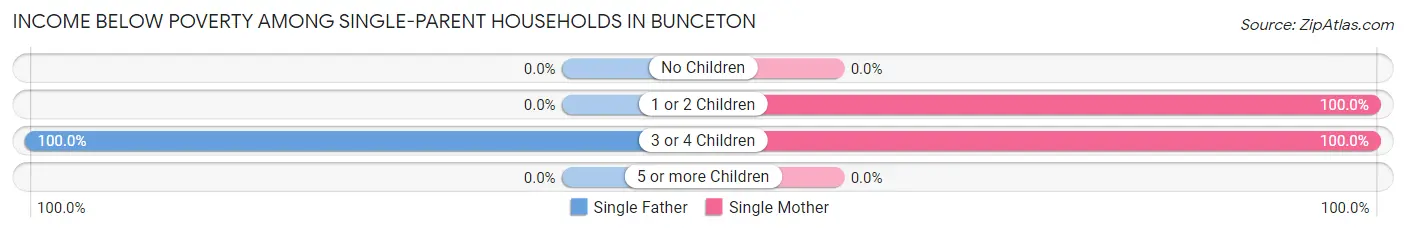
Income Below Poverty Among Single-Parent Households in Bunceton
According to the poverty data in Bunceton, 12.5% or 1 single-father households and 75.0% or 6 single-mother households are living below the poverty line. Among single-father households, those with 3 or 4 children have the highest poverty rate, with 1 households (100.0%) experiencing poverty. Likewise, among single-mother households, those with 1 or 2 children have the highest poverty rate, with 3 households (100.0%) falling below the poverty line.
| Children | Single Father | Single Mother |
| No Children | 0 (0.0%) | 0 (0.0%) |
| 1 or 2 Children | 0 (0.0%) | 3 (100.0%) |
| 3 or 4 Children | 1 (100.0%) | 3 (100.0%) |
| 5 or more Children | 0 (0.0%) | 0 (0.0%) |
| Total | 1 (12.5%) | 6 (75.0%) |
Income Below Poverty Among Married-Couple vs Single-Parent Households in Bunceton
The poverty data for Bunceton shows that 15 of the married-couple family households (23.8%) and 7 of the single-parent households (43.8%) are living below the poverty level. Within the married-couple family households, those with 1 or 2 children have the highest poverty rate, with 9 households (34.6%) falling below the poverty line. Among the single-parent households, those with 3 or 4 children have the highest poverty rate, with 4 household (100.0%) living below poverty.
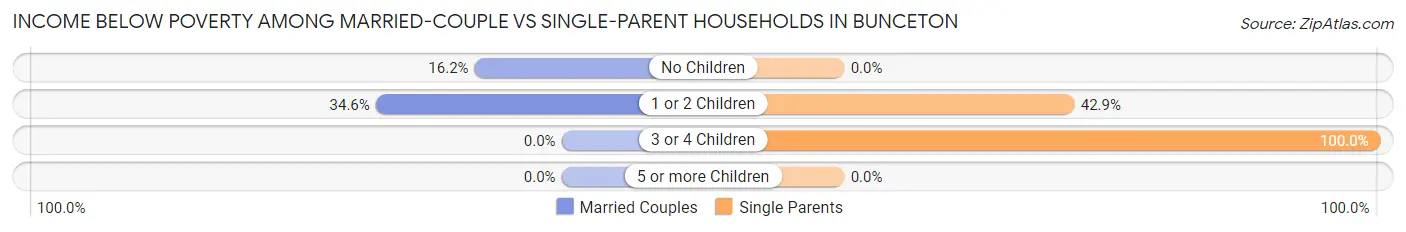
| Children | Married-Couple Families | Single-Parent Households |
| No Children | 6 (16.2%) | 0 (0.0%) |
| 1 or 2 Children | 9 (34.6%) | 3 (42.9%) |
| 3 or 4 Children | 0 (0.0%) | 4 (100.0%) |
| 5 or more Children | 0 (0.0%) | 0 (0.0%) |
| Total | 15 (23.8%) | 7 (43.8%) |
Race in Bunceton
The most populous races in Bunceton are White / Caucasian (275 | 92.3%), Two or more Races (17 | 5.7%), and Black / African American (3 | 1.0%).
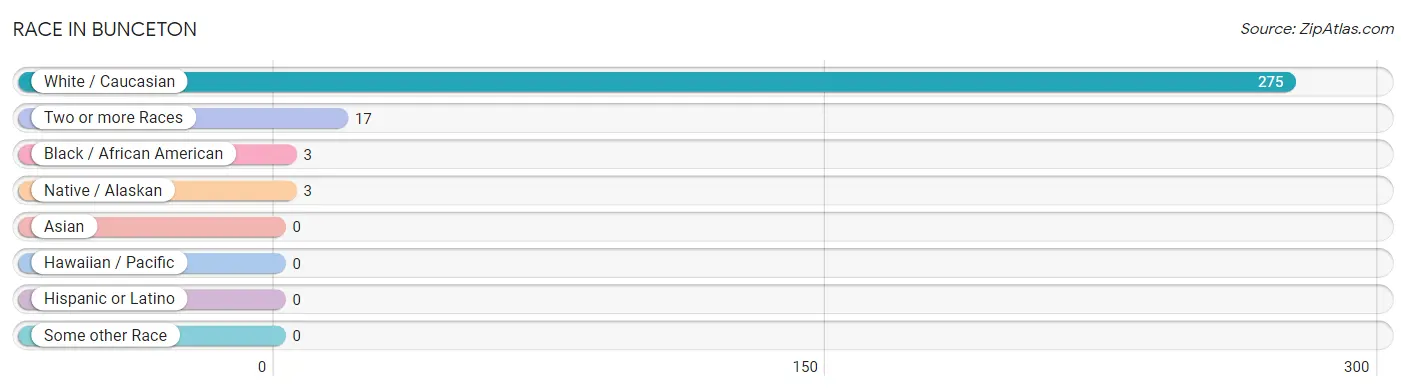
| Race | # Population | % Population |
| Asian | 0 | 0.0% |
| Black / African American | 3 | 1.0% |
| Hawaiian / Pacific | 0 | 0.0% |
| Hispanic or Latino | 0 | 0.0% |
| Native / Alaskan | 3 | 1.0% |
| White / Caucasian | 275 | 92.3% |
| Two or more Races | 17 | 5.7% |
| Some other Race | 0 | 0.0% |
| Total | 298 | 100.0% |
Ancestry in Bunceton
The most populous ancestries reported in Bunceton are German (129 | 43.3%), Irish (42 | 14.1%), English (17 | 5.7%), American (14 | 4.7%), and French (4 | 1.3%), together accounting for 69.1% of all Bunceton residents.
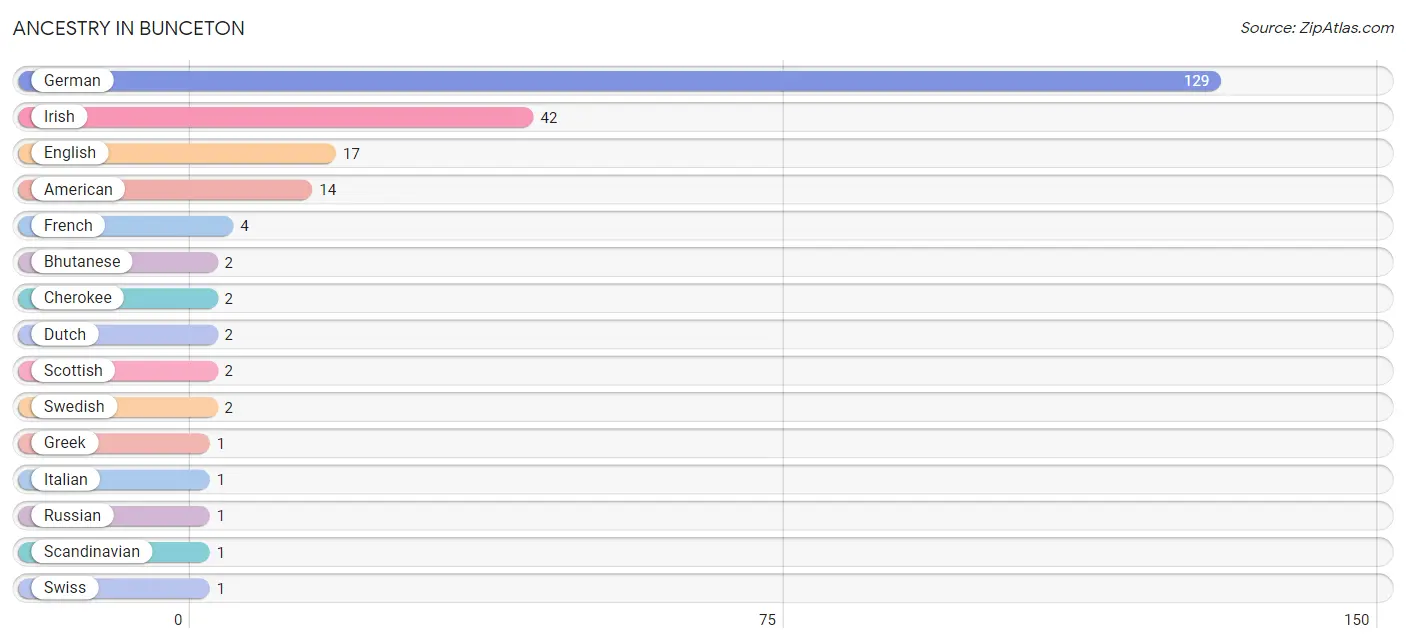
| Ancestry | # Population | % Population |
| American | 14 | 4.7% |
| Bhutanese | 2 | 0.7% |
| Cherokee | 2 | 0.7% |
| Dutch | 2 | 0.7% |
| English | 17 | 5.7% |
| French | 4 | 1.3% |
| German | 129 | 43.3% |
| Greek | 1 | 0.3% |
| Irish | 42 | 14.1% |
| Italian | 1 | 0.3% |
| Russian | 1 | 0.3% |
| Scandinavian | 1 | 0.3% |
| Scottish | 2 | 0.7% |
| Swedish | 2 | 0.7% |
| Swiss | 1 | 0.3% | View All 15 Rows |
Immigrants in Bunceton

| Immigration Origin | # Population | % Population | View All 0 Rows |
Sex and Age in Bunceton
Sex and Age in Bunceton
The most populous age groups in Bunceton are 20 to 24 Years (18 | 13.3%) for men and 30 to 34 Years (17 | 10.4%) for women.
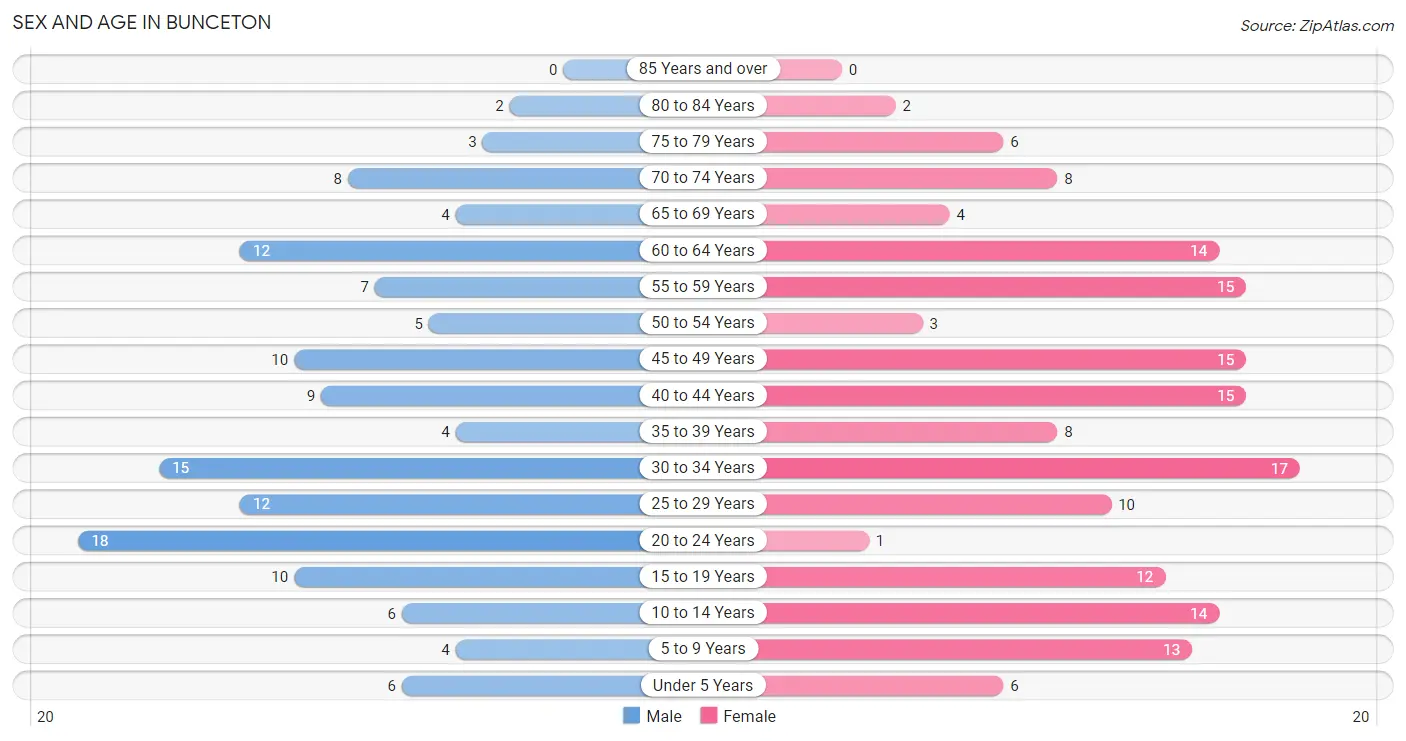
| Age Bracket | Male | Female |
| Under 5 Years | 6 (4.4%) | 6 (3.7%) |
| 5 to 9 Years | 4 (3.0%) | 13 (8.0%) |
| 10 to 14 Years | 6 (4.4%) | 14 (8.6%) |
| 15 to 19 Years | 10 (7.4%) | 12 (7.4%) |
| 20 to 24 Years | 18 (13.3%) | 1 (0.6%) |
| 25 to 29 Years | 12 (8.9%) | 10 (6.1%) |
| 30 to 34 Years | 15 (11.1%) | 17 (10.4%) |
| 35 to 39 Years | 4 (3.0%) | 8 (4.9%) |
| 40 to 44 Years | 9 (6.7%) | 15 (9.2%) |
| 45 to 49 Years | 10 (7.4%) | 15 (9.2%) |
| 50 to 54 Years | 5 (3.7%) | 3 (1.8%) |
| 55 to 59 Years | 7 (5.2%) | 15 (9.2%) |
| 60 to 64 Years | 12 (8.9%) | 14 (8.6%) |
| 65 to 69 Years | 4 (3.0%) | 4 (2.5%) |
| 70 to 74 Years | 8 (5.9%) | 8 (4.9%) |
| 75 to 79 Years | 3 (2.2%) | 6 (3.7%) |
| 80 to 84 Years | 2 (1.5%) | 2 (1.2%) |
| 85 Years and over | 0 (0.0%) | 0 (0.0%) |
| Total | 135 (100.0%) | 163 (100.0%) |
Families and Households in Bunceton
Median Family Size in Bunceton
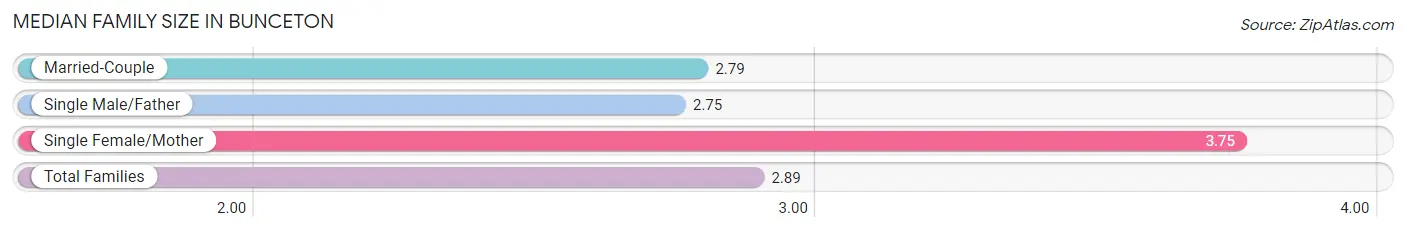
The median family size in Bunceton is 2.89 persons per family, with single female/mother families (8 | 10.1%) accounting for the largest median family size of 3.75 persons per family. On the other hand, single male/father families (8 | 10.1%) represent the smallest median family size with 2.75 persons per family.
| Family Type | # Families | Family Size |
| Married-Couple | 63 (79.7%) | 2.79 |
| Single Male/Father | 8 (10.1%) | 2.75 |
| Single Female/Mother | 8 (10.1%) | 3.75 |
| Total Families | 79 (100.0%) | 2.89 |
Median Household Size in Bunceton
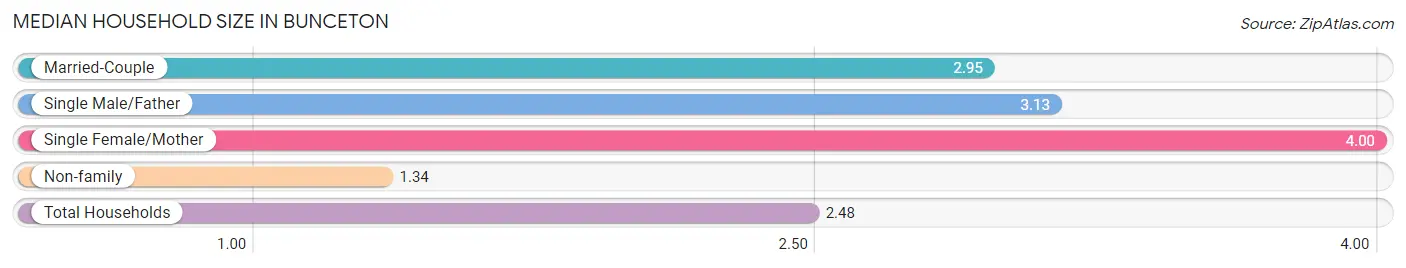
The median household size in Bunceton is 2.48 persons per household, with single female/mother households (8 | 6.7%) accounting for the largest median household size of 4 persons per household. non-family households (41 | 34.2%) represent the smallest median household size with 1.34 persons per household.
| Household Type | # Households | Household Size |
| Married-Couple | 63 (52.5%) | 2.95 |
| Single Male/Father | 8 (6.7%) | 3.13 |
| Single Female/Mother | 8 (6.7%) | 4.00 |
| Non-family | 41 (34.2%) | 1.34 |
| Total Households | 120 (100.0%) | 2.48 |
Household Size by Marriage Status in Bunceton
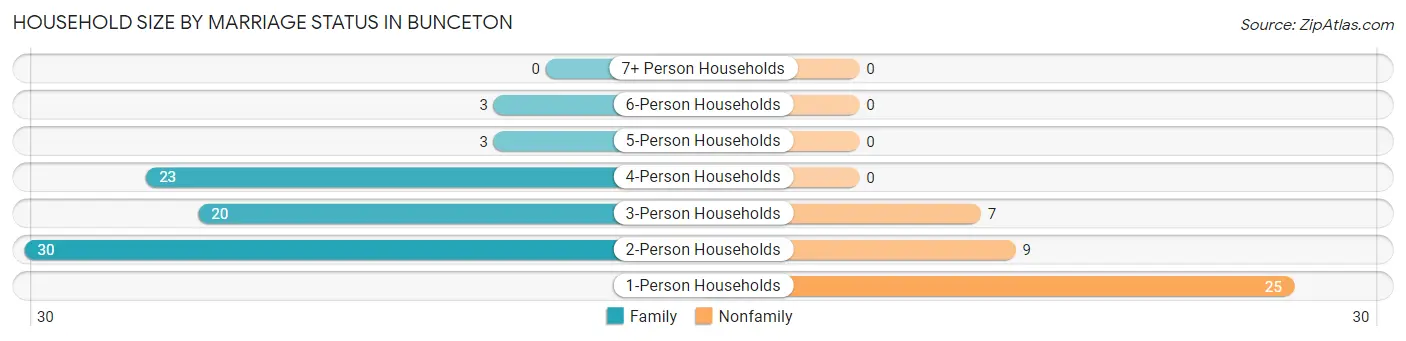
Out of a total of 120 households in Bunceton, 79 (65.8%) are family households, while 41 (34.2%) are nonfamily households. The most numerous type of family households are 2-person households, comprising 30, and the most common type of nonfamily households are 1-person households, comprising 25.
| Household Size | Family Households | Nonfamily Households |
| 1-Person Households | - | 25 (20.8%) |
| 2-Person Households | 30 (25.0%) | 9 (7.5%) |
| 3-Person Households | 20 (16.7%) | 7 (5.8%) |
| 4-Person Households | 23 (19.2%) | 0 (0.0%) |
| 5-Person Households | 3 (2.5%) | 0 (0.0%) |
| 6-Person Households | 3 (2.5%) | 0 (0.0%) |
| 7+ Person Households | 0 (0.0%) | 0 (0.0%) |
| Total | 79 (65.8%) | 41 (34.2%) |
Female Fertility in Bunceton
Fertility by Age in Bunceton
| Age Bracket | Women with Births | Births / 1,000 Women |
| 15 to 19 years | 0 (0.0%) | 0.0 |
| 20 to 34 years | 0 (0.0%) | 0.0 |
| 35 to 50 years | 0 (0.0%) | 0.0 |
| Total | 0 (0.0%) | 0.0 |
Fertility by Age by Marriage Status in Bunceton
| Age Bracket | Married | Unmarried |
| 15 to 19 years | 0 (0.0%) | 0 (0.0%) |
| 20 to 34 years | 0 (0.0%) | 0 (0.0%) |
| 35 to 50 years | 0 (0.0%) | 0 (0.0%) |
| Total | 0 (0.0%) | 0 (0.0%) |
Fertility by Education in Bunceton
| Educational Attainment | Women with Births | Births / 1,000 Women |
| Less than High School | 0 (0.0%) | 0.0 |
| High School Diploma | 0 (0.0%) | 0.0 |
| College or Associate's Degree | 0 (0.0%) | 0.0 |
| Bachelor's Degree | 0 (0.0%) | 0.0 |
| Graduate Degree | 0 (0.0%) | 0.0 |
| Total | 0 (0.0%) | 0.0 |
Fertility by Education by Marriage Status in Bunceton
| Educational Attainment | Married | Unmarried |
| Less than High School | 0 (0.0%) | 0 (0.0%) |
| High School Diploma | 0 (0.0%) | 0 (0.0%) |
| College or Associate's Degree | 0 (0.0%) | 0 (0.0%) |
| Bachelor's Degree | 0 (0.0%) | 0 (0.0%) |
| Graduate Degree | 0 (0.0%) | 0 (0.0%) |
| Total | 0 (0.0%) | 0 (0.0%) |
Employment Characteristics in Bunceton
Employment by Class of Employer in Bunceton
Among the 164 employed individuals in Bunceton, private company employees (122 | 74.4%), local government employees (19 | 11.6%), and self-employed (incorporated) (15 | 9.1%) make up the most common classes of employment.
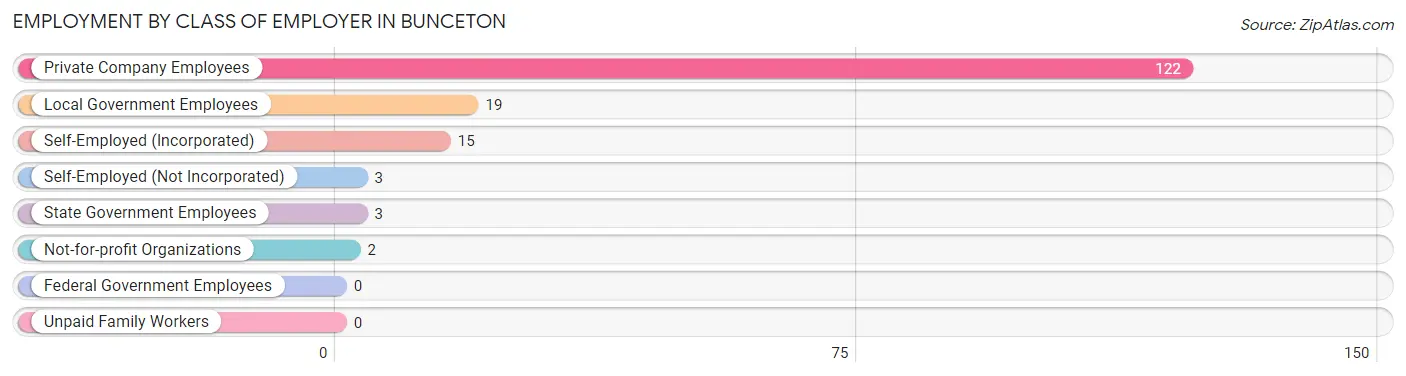
| Employer Class | # Employees | % Employees |
| Private Company Employees | 122 | 74.4% |
| Self-Employed (Incorporated) | 15 | 9.1% |
| Self-Employed (Not Incorporated) | 3 | 1.8% |
| Not-for-profit Organizations | 2 | 1.2% |
| Local Government Employees | 19 | 11.6% |
| State Government Employees | 3 | 1.8% |
| Federal Government Employees | 0 | 0.0% |
| Unpaid Family Workers | 0 | 0.0% |
| Total | 164 | 100.0% |
Employment Status by Age in Bunceton
According to the labor force statistics for Bunceton, out of the total population over 16 years of age (239), 70.7% or 169 individuals are in the labor force, with 1.8% or 3 of them unemployed. The age group with the highest labor force participation rate is 55 to 59 years, with 95.5% or 21 individuals in the labor force. Within the labor force, the 55 to 59 years age range has the highest percentage of unemployed individuals, with 9.5% or 2 of them being unemployed.
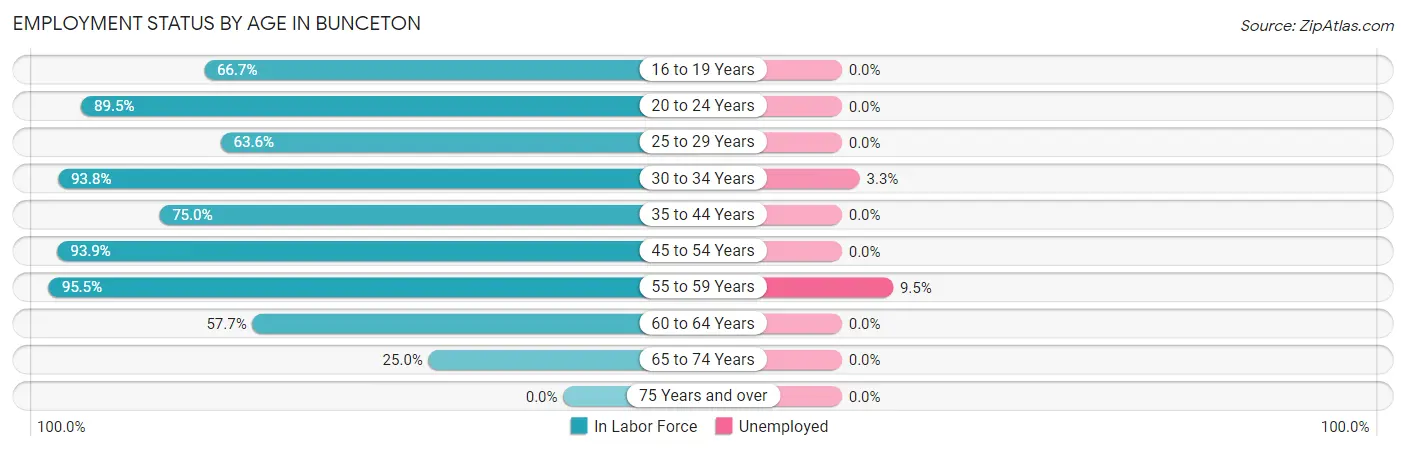
| Age Bracket | In Labor Force | Unemployed |
| 16 to 19 Years | 8 (66.7%) | 0 (0.0%) |
| 20 to 24 Years | 17 (89.5%) | 0 (0.0%) |
| 25 to 29 Years | 14 (63.6%) | 0 (0.0%) |
| 30 to 34 Years | 30 (93.8%) | 1 (3.3%) |
| 35 to 44 Years | 27 (75.0%) | 0 (0.0%) |
| 45 to 54 Years | 31 (93.9%) | 0 (0.0%) |
| 55 to 59 Years | 21 (95.5%) | 2 (9.5%) |
| 60 to 64 Years | 15 (57.7%) | 0 (0.0%) |
| 65 to 74 Years | 6 (25.0%) | 0 (0.0%) |
| 75 Years and over | 0 (0.0%) | 0 (0.0%) |
| Total | 169 (70.7%) | 3 (1.8%) |
Employment Status by Educational Attainment in Bunceton
According to labor force statistics for Bunceton, 80.7% of individuals (138) out of the total population between 25 and 64 years of age (171) are in the labor force, with 2.2% or 3 of them being unemployed. The group with the highest labor force participation rate are those with the educational attainment of bachelor's degree or higher, with 96.9% or 31 individuals in the labor force. Within the labor force, individuals with college / associate degree education have the highest percentage of unemployment, with 3.6% or 1 of them being unemployed.
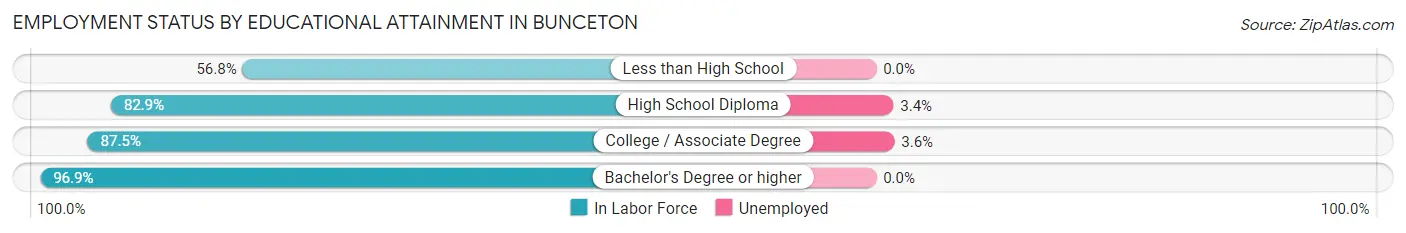
| Educational Attainment | In Labor Force | Unemployed |
| Less than High School | 21 (56.8%) | 0 (0.0%) |
| High School Diploma | 58 (82.9%) | 2 (3.4%) |
| College / Associate Degree | 28 (87.5%) | 1 (3.6%) |
| Bachelor's Degree or higher | 31 (96.9%) | 0 (0.0%) |
| Total | 138 (80.7%) | 4 (2.2%) |
Employment Occupations by Sex in Bunceton
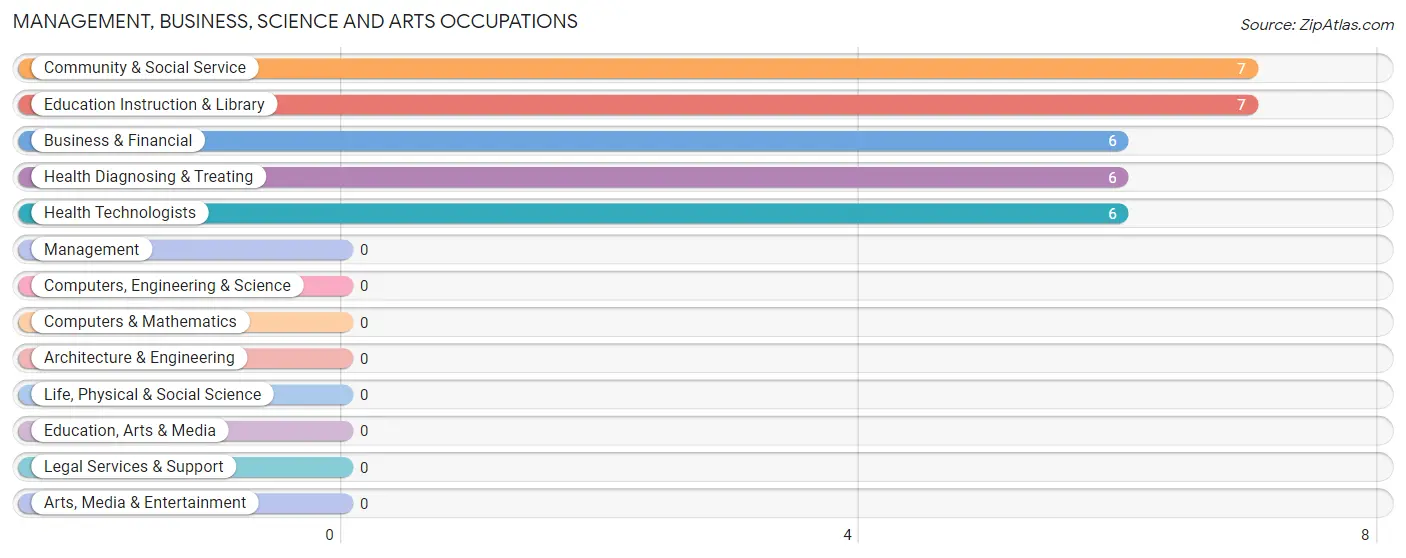
Management, Business, Science and Arts Occupations
The most common Management, Business, Science and Arts occupations in Bunceton are Community & Social Service (7 | 4.2%), Education Instruction & Library (7 | 4.2%), Business & Financial (6 | 3.6%), Health Diagnosing & Treating (6 | 3.6%), and Health Technologists (6 | 3.6%).
Management, Business, Science and Arts Occupations by Sex
Within the Management, Business, Science and Arts occupations in Bunceton, the most male-oriented occupations are Community & Social Service (14.3%), and Education Instruction & Library (14.3%), while the most female-oriented occupations are Business & Financial (100.0%), Health Diagnosing & Treating (100.0%), and Health Technologists (100.0%).
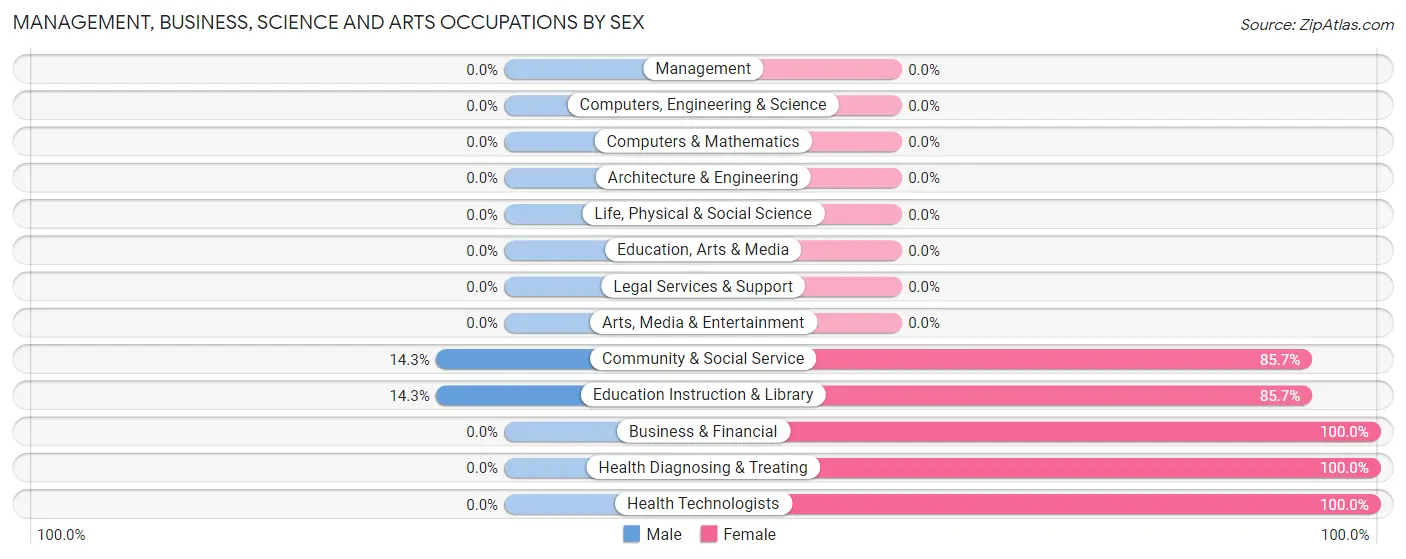
| Occupation | Male | Female |
| Management | 0 (0.0%) | 0 (0.0%) |
| Business & Financial | 0 (0.0%) | 6 (100.0%) |
| Computers, Engineering & Science | 0 (0.0%) | 0 (0.0%) |
| Computers & Mathematics | 0 (0.0%) | 0 (0.0%) |
| Architecture & Engineering | 0 (0.0%) | 0 (0.0%) |
| Life, Physical & Social Science | 0 (0.0%) | 0 (0.0%) |
| Community & Social Service | 1 (14.3%) | 6 (85.7%) |
| Education, Arts & Media | 0 (0.0%) | 0 (0.0%) |
| Legal Services & Support | 0 (0.0%) | 0 (0.0%) |
| Education Instruction & Library | 1 (14.3%) | 6 (85.7%) |
| Arts, Media & Entertainment | 0 (0.0%) | 0 (0.0%) |
| Health Diagnosing & Treating | 0 (0.0%) | 6 (100.0%) |
| Health Technologists | 0 (0.0%) | 6 (100.0%) |
| Total (Category) | 1 (5.3%) | 18 (94.7%) |
| Total (Overall) | 85 (51.2%) | 81 (48.8%) |
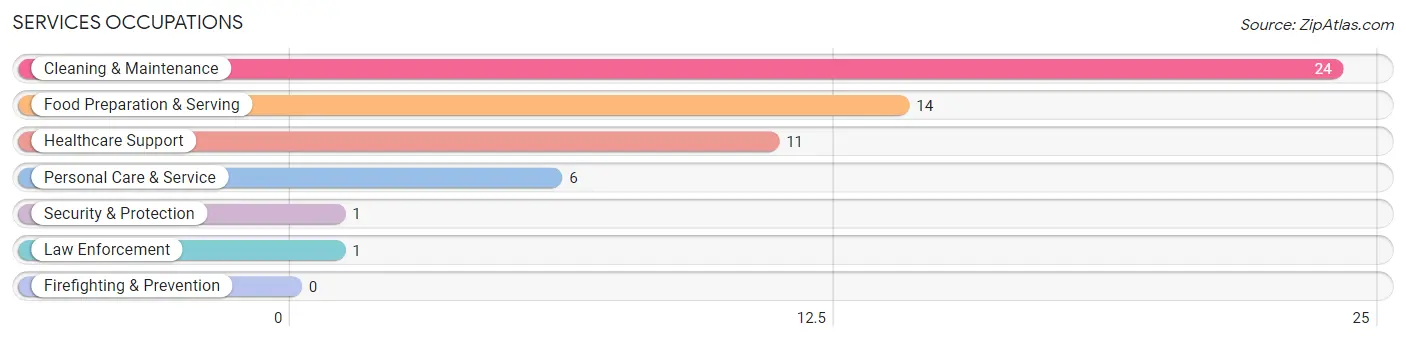
Services Occupations
The most common Services occupations in Bunceton are Cleaning & Maintenance (24 | 14.5%), Food Preparation & Serving (14 | 8.4%), Healthcare Support (11 | 6.6%), Personal Care & Service (6 | 3.6%), and Security & Protection (1 | 0.6%).
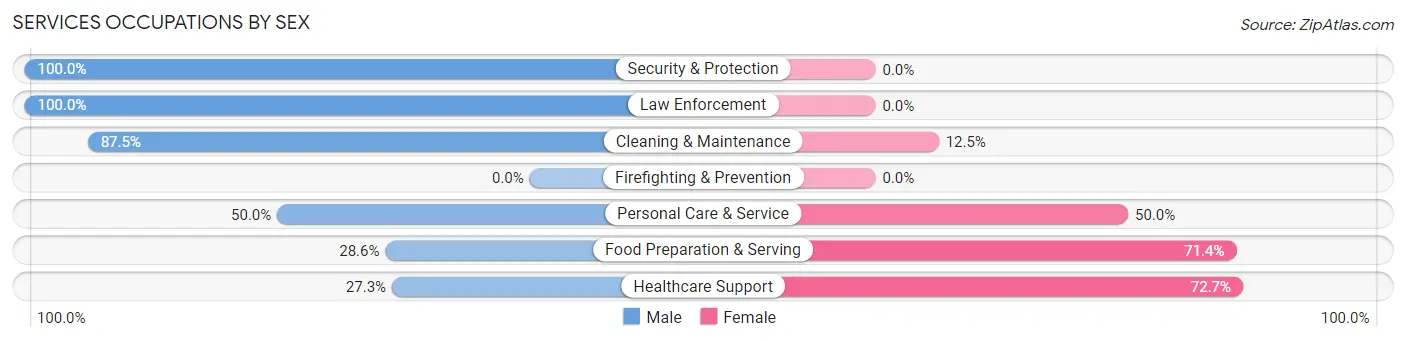
Services Occupations by Sex
Within the Services occupations in Bunceton, the most male-oriented occupations are Security & Protection (100.0%), Law Enforcement (100.0%), and Cleaning & Maintenance (87.5%), while the most female-oriented occupations are Healthcare Support (72.7%), Food Preparation & Serving (71.4%), and Personal Care & Service (50.0%).
| Occupation | Male | Female |
| Healthcare Support | 3 (27.3%) | 8 (72.7%) |
| Security & Protection | 1 (100.0%) | 0 (0.0%) |
| Firefighting & Prevention | 0 (0.0%) | 0 (0.0%) |
| Law Enforcement | 1 (100.0%) | 0 (0.0%) |
| Food Preparation & Serving | 4 (28.6%) | 10 (71.4%) |
| Cleaning & Maintenance | 21 (87.5%) | 3 (12.5%) |
| Personal Care & Service | 3 (50.0%) | 3 (50.0%) |
| Total (Category) | 32 (57.1%) | 24 (42.9%) |
| Total (Overall) | 85 (51.2%) | 81 (48.8%) |
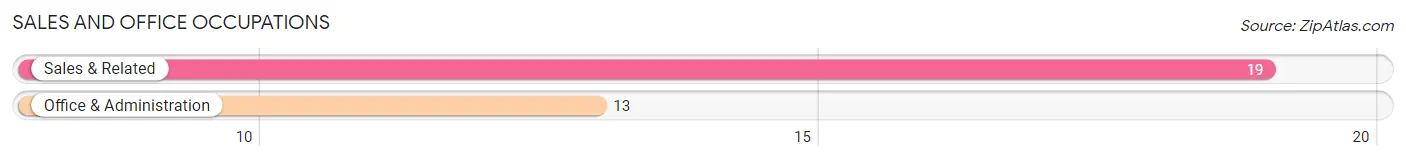
Sales and Office Occupations
The most common Sales and Office occupations in Bunceton are Sales & Related (19 | 11.5%), and Office & Administration (13 | 7.8%).
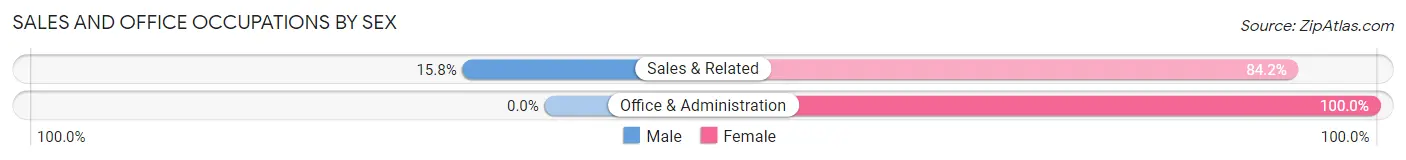
Sales and Office Occupations by Sex
| Occupation | Male | Female |
| Sales & Related | 3 (15.8%) | 16 (84.2%) |
| Office & Administration | 0 (0.0%) | 13 (100.0%) |
| Total (Category) | 3 (9.4%) | 29 (90.6%) |
| Total (Overall) | 85 (51.2%) | 81 (48.8%) |
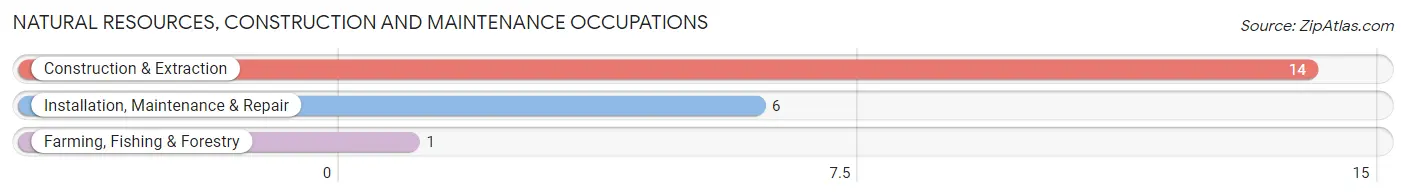
Natural Resources, Construction and Maintenance Occupations
The most common Natural Resources, Construction and Maintenance occupations in Bunceton are Construction & Extraction (14 | 8.4%), Installation, Maintenance & Repair (6 | 3.6%), and Farming, Fishing & Forestry (1 | 0.6%).
Natural Resources, Construction and Maintenance Occupations by Sex
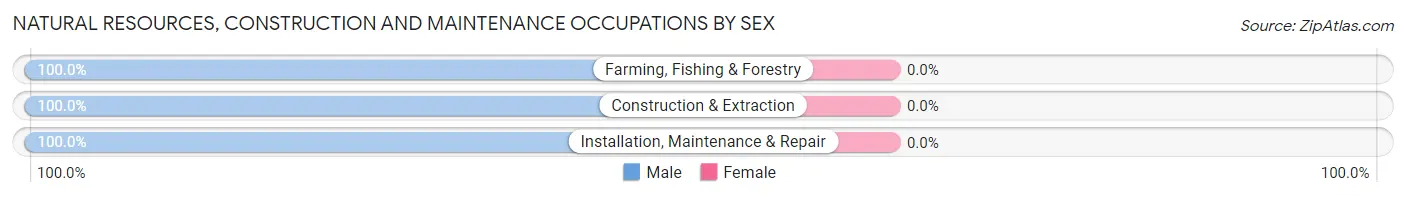
| Occupation | Male | Female |
| Farming, Fishing & Forestry | 1 (100.0%) | 0 (0.0%) |
| Construction & Extraction | 14 (100.0%) | 0 (0.0%) |
| Installation, Maintenance & Repair | 6 (100.0%) | 0 (0.0%) |
| Total (Category) | 21 (100.0%) | 0 (0.0%) |
| Total (Overall) | 85 (51.2%) | 81 (48.8%) |
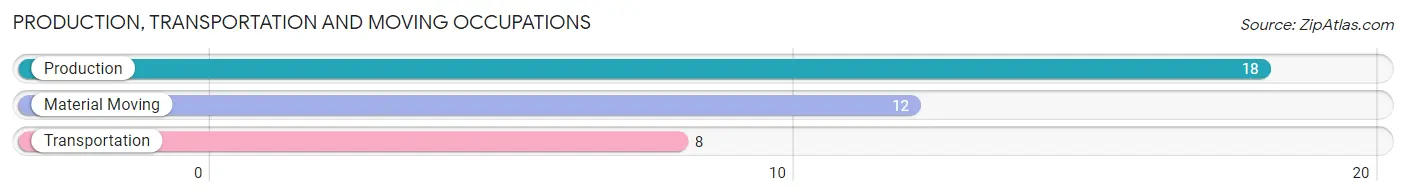
Production, Transportation and Moving Occupations
The most common Production, Transportation and Moving occupations in Bunceton are Production (18 | 10.8%), Material Moving (12 | 7.2%), and Transportation (8 | 4.8%).
Production, Transportation and Moving Occupations by Sex
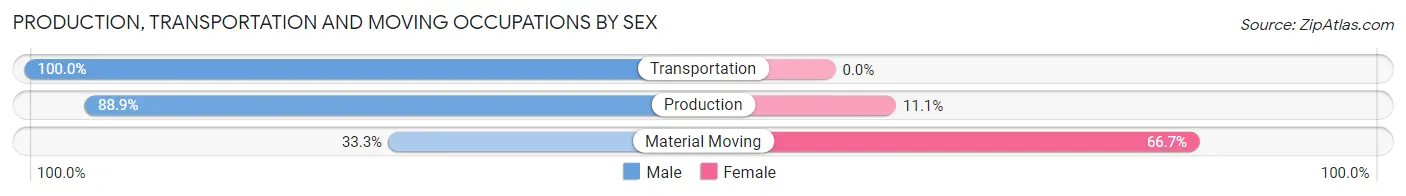
| Occupation | Male | Female |
| Production | 16 (88.9%) | 2 (11.1%) |
| Transportation | 8 (100.0%) | 0 (0.0%) |
| Material Moving | 4 (33.3%) | 8 (66.7%) |
| Total (Category) | 28 (73.7%) | 10 (26.3%) |
| Total (Overall) | 85 (51.2%) | 81 (48.8%) |
Employment Industries by Sex in Bunceton
Employment Industries in Bunceton
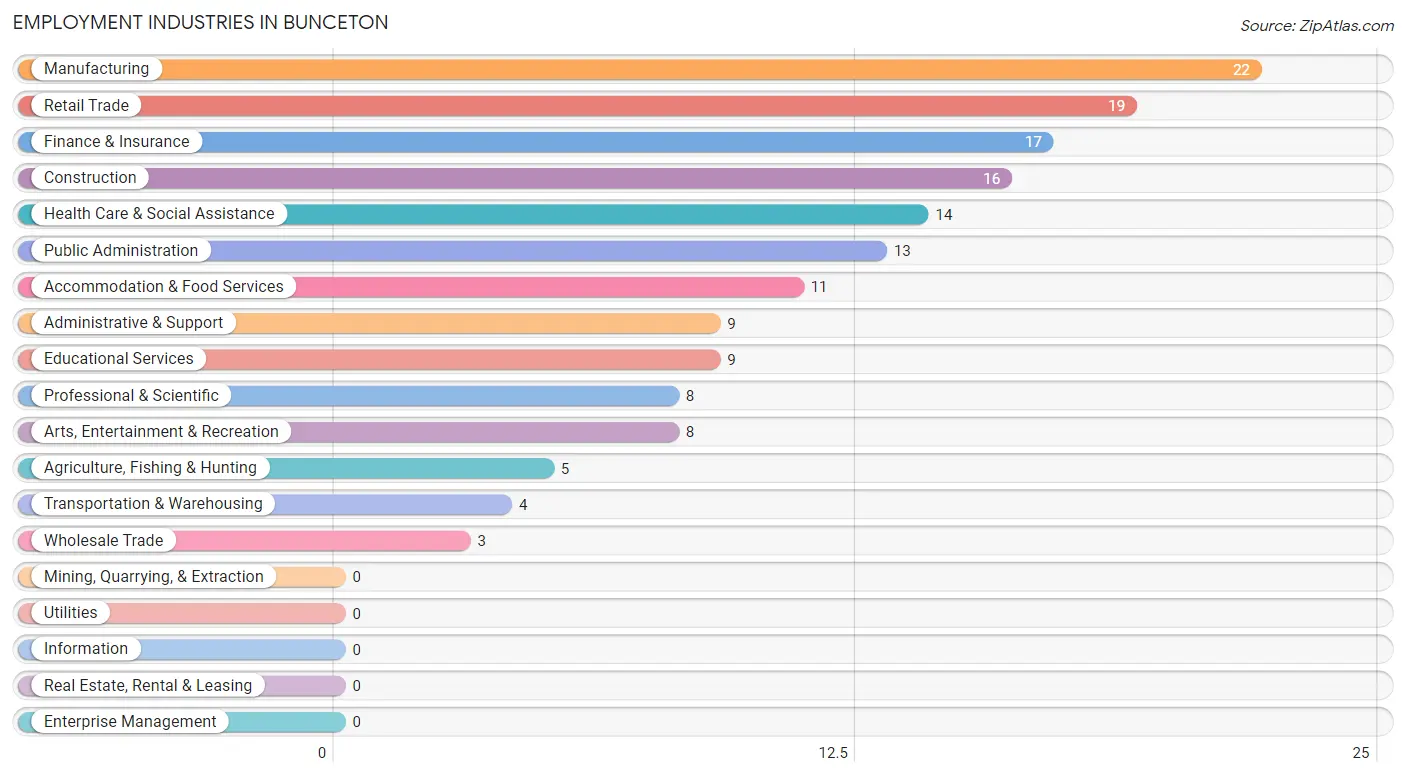
The major employment industries in Bunceton include Manufacturing (22 | 13.3%), Retail Trade (19 | 11.5%), Finance & Insurance (17 | 10.2%), Construction (16 | 9.6%), and Health Care & Social Assistance (14 | 8.4%).
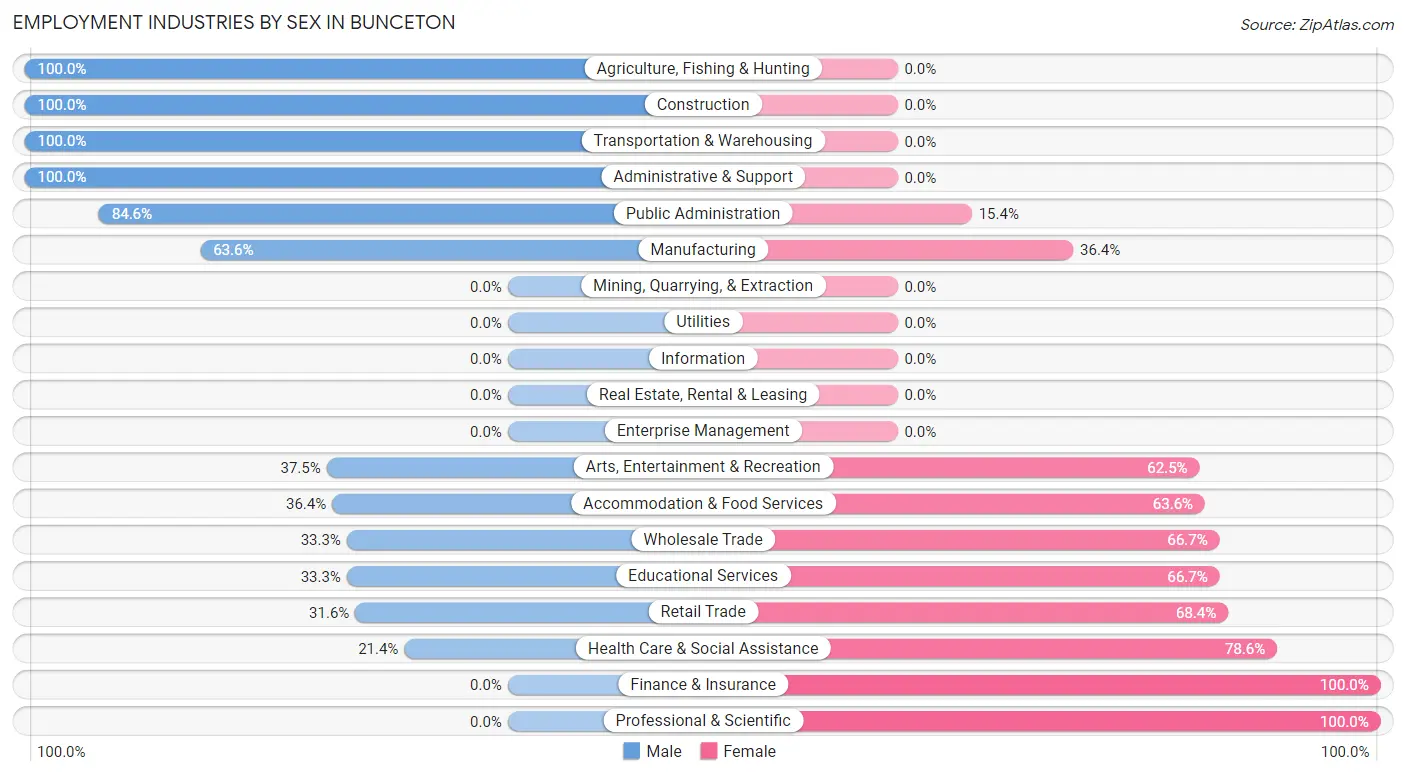
Employment Industries by Sex in Bunceton
The Bunceton industries that see more men than women are Agriculture, Fishing & Hunting (100.0%), Construction (100.0%), and Transportation & Warehousing (100.0%), whereas the industries that tend to have a higher number of women are Finance & Insurance (100.0%), Professional & Scientific (100.0%), and Health Care & Social Assistance (78.6%).
| Industry | Male | Female |
| Agriculture, Fishing & Hunting | 5 (100.0%) | 0 (0.0%) |
| Mining, Quarrying, & Extraction | 0 (0.0%) | 0 (0.0%) |
| Construction | 16 (100.0%) | 0 (0.0%) |
| Manufacturing | 14 (63.6%) | 8 (36.4%) |
| Wholesale Trade | 1 (33.3%) | 2 (66.7%) |
| Retail Trade | 6 (31.6%) | 13 (68.4%) |
| Transportation & Warehousing | 4 (100.0%) | 0 (0.0%) |
| Utilities | 0 (0.0%) | 0 (0.0%) |
| Information | 0 (0.0%) | 0 (0.0%) |
| Finance & Insurance | 0 (0.0%) | 17 (100.0%) |
| Real Estate, Rental & Leasing | 0 (0.0%) | 0 (0.0%) |
| Professional & Scientific | 0 (0.0%) | 8 (100.0%) |
| Enterprise Management | 0 (0.0%) | 0 (0.0%) |
| Administrative & Support | 9 (100.0%) | 0 (0.0%) |
| Educational Services | 3 (33.3%) | 6 (66.7%) |
| Health Care & Social Assistance | 3 (21.4%) | 11 (78.6%) |
| Arts, Entertainment & Recreation | 3 (37.5%) | 5 (62.5%) |
| Accommodation & Food Services | 4 (36.4%) | 7 (63.6%) |
| Public Administration | 11 (84.6%) | 2 (15.4%) |
| Total | 85 (51.2%) | 81 (48.8%) |
Education in Bunceton
School Enrollment in Bunceton
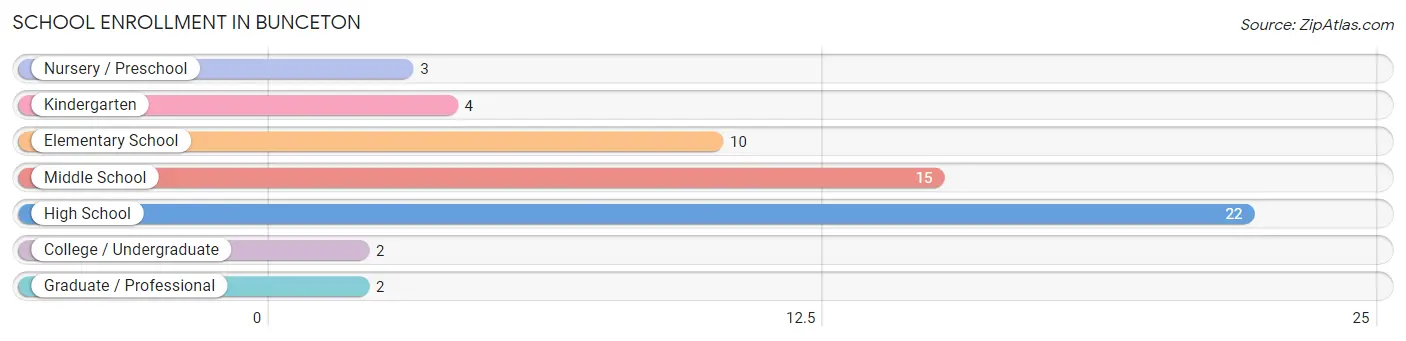
The most common levels of schooling among the 58 students in Bunceton are high school (22 | 37.9%), middle school (15 | 25.9%), and elementary school (10 | 17.2%).
| School Level | # Students | % Students |
| Nursery / Preschool | 3 | 5.2% |
| Kindergarten | 4 | 6.9% |
| Elementary School | 10 | 17.2% |
| Middle School | 15 | 25.9% |
| High School | 22 | 37.9% |
| College / Undergraduate | 2 | 3.5% |
| Graduate / Professional | 2 | 3.5% |
| Total | 58 | 100.0% |
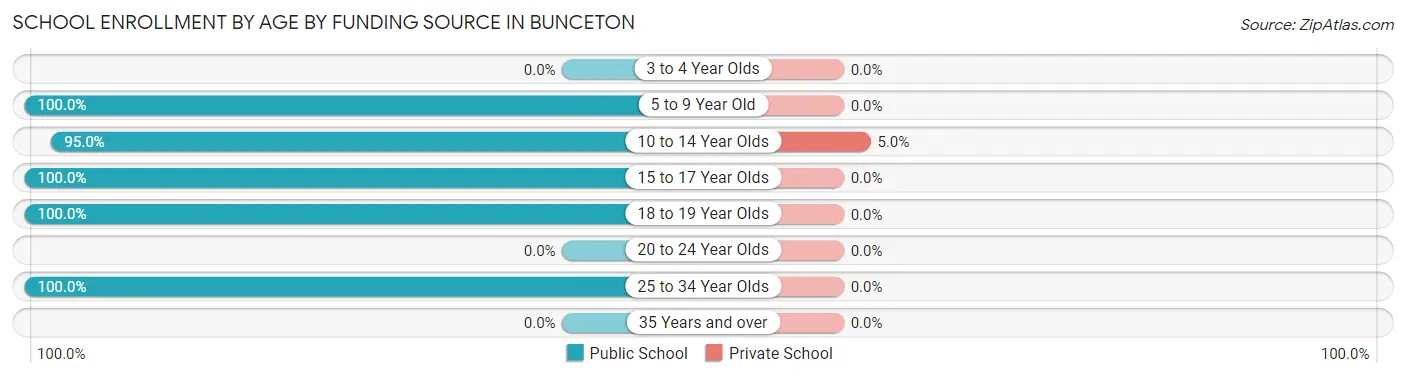
School Enrollment by Age by Funding Source in Bunceton
Out of a total of 58 students who are enrolled in schools in Bunceton, 1 (1.7%) attend a private institution, while the remaining 57 (98.3%) are enrolled in public schools. The age group of 10 to 14 year olds has the highest likelihood of being enrolled in private schools, with 1 (5.0% in the age bracket) enrolled. Conversely, the age group of 5 to 9 year old has the lowest likelihood of being enrolled in a private school, with 17 (100.0% in the age bracket) attending a public institution.
| Age Bracket | Public School | Private School |
| 3 to 4 Year Olds | 0 (0.0%) | 0 (0.0%) |
| 5 to 9 Year Old | 17 (100.0%) | 0 (0.0%) |
| 10 to 14 Year Olds | 19 (95.0%) | 1 (5.0%) |
| 15 to 17 Year Olds | 14 (100.0%) | 0 (0.0%) |
| 18 to 19 Year Olds | 5 (100.0%) | 0 (0.0%) |
| 20 to 24 Year Olds | 0 (0.0%) | 0 (0.0%) |
| 25 to 34 Year Olds | 2 (100.0%) | 0 (0.0%) |
| 35 Years and over | 0 (0.0%) | 0 (0.0%) |
| Total | 57 (98.3%) | 1 (1.7%) |
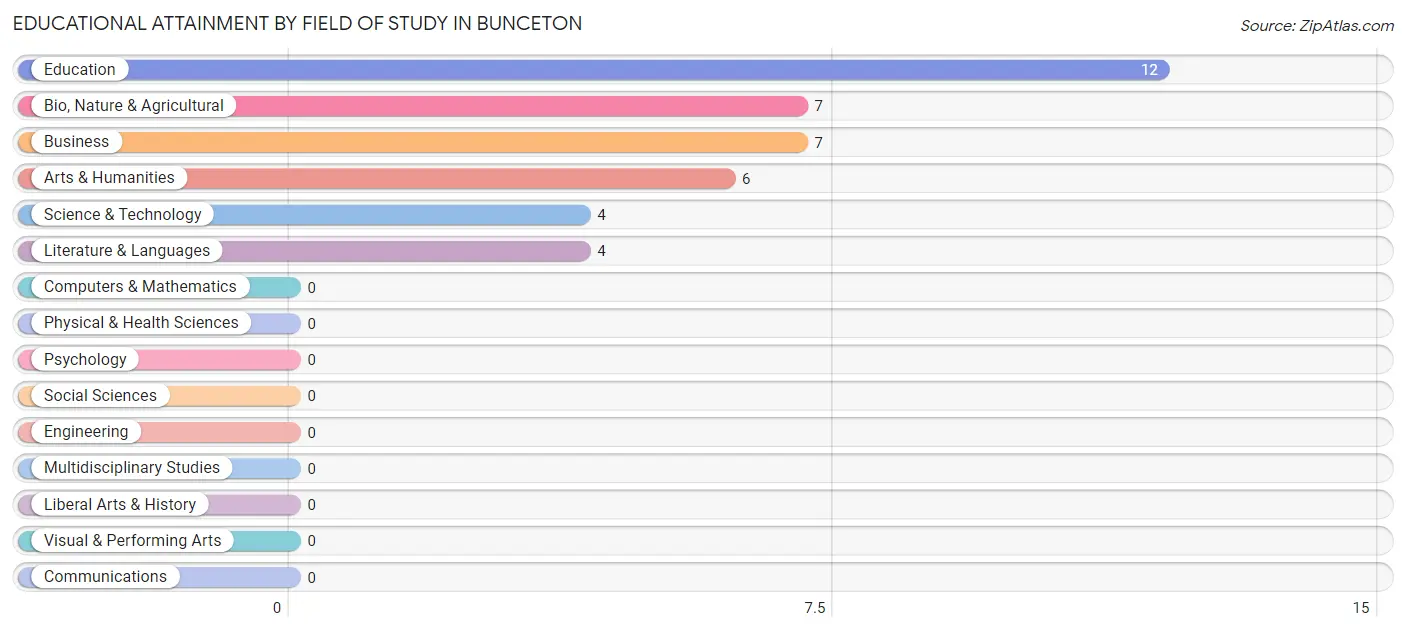
Educational Attainment by Field of Study in Bunceton
Education (12 | 30.0%), bio, nature & agricultural (7 | 17.5%), business (7 | 17.5%), arts & humanities (6 | 15.0%), and science & technology (4 | 10.0%) are the most common fields of study among 40 individuals in Bunceton who have obtained a bachelor's degree or higher.
| Field of Study | # Graduates | % Graduates |
| Computers & Mathematics | 0 | 0.0% |
| Bio, Nature & Agricultural | 7 | 17.5% |
| Physical & Health Sciences | 0 | 0.0% |
| Psychology | 0 | 0.0% |
| Social Sciences | 0 | 0.0% |
| Engineering | 0 | 0.0% |
| Multidisciplinary Studies | 0 | 0.0% |
| Science & Technology | 4 | 10.0% |
| Business | 7 | 17.5% |
| Education | 12 | 30.0% |
| Literature & Languages | 4 | 10.0% |
| Liberal Arts & History | 0 | 0.0% |
| Visual & Performing Arts | 0 | 0.0% |
| Communications | 0 | 0.0% |
| Arts & Humanities | 6 | 15.0% |
| Total | 40 | 100.0% |
Transportation & Commute in Bunceton
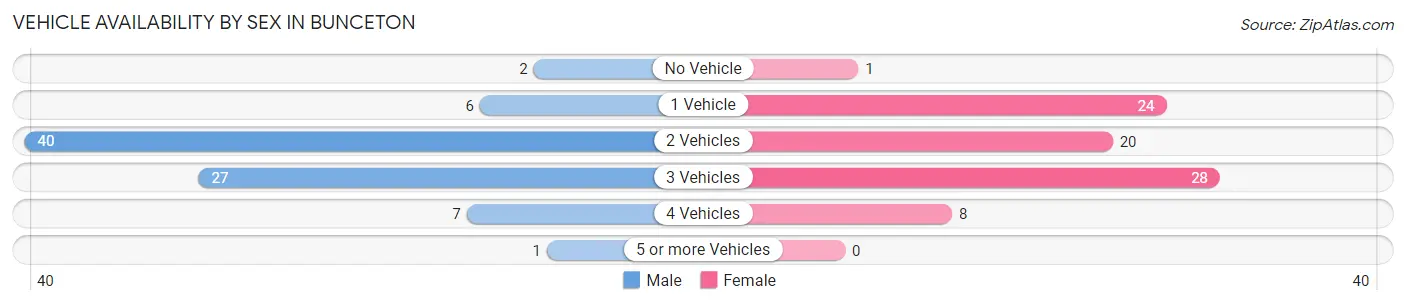
Vehicle Availability by Sex in Bunceton
The most prevalent vehicle ownership categories in Bunceton are males with 2 vehicles (40, accounting for 48.2%) and females with 2 vehicles (20, making up 49.4%).
| Vehicles Available | Male | Female |
| No Vehicle | 2 (2.4%) | 1 (1.2%) |
| 1 Vehicle | 6 (7.2%) | 24 (29.6%) |
| 2 Vehicles | 40 (48.2%) | 20 (24.7%) |
| 3 Vehicles | 27 (32.5%) | 28 (34.6%) |
| 4 Vehicles | 7 (8.4%) | 8 (9.9%) |
| 5 or more Vehicles | 1 (1.2%) | 0 (0.0%) |
| Total | 83 (100.0%) | 81 (100.0%) |
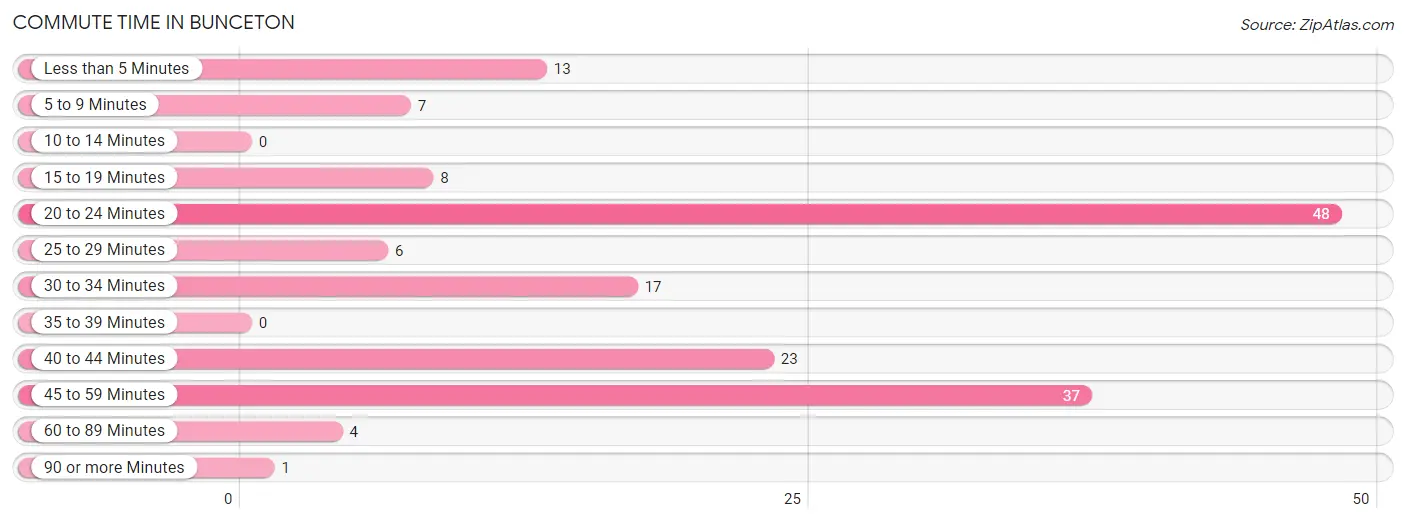
Commute Time in Bunceton
The most frequently occuring commute durations in Bunceton are 20 to 24 minutes (48 commuters, 29.3%), 45 to 59 minutes (37 commuters, 22.6%), and 40 to 44 minutes (23 commuters, 14.0%).
| Commute Time | # Commuters | % Commuters |
| Less than 5 Minutes | 13 | 7.9% |
| 5 to 9 Minutes | 7 | 4.3% |
| 10 to 14 Minutes | 0 | 0.0% |
| 15 to 19 Minutes | 8 | 4.9% |
| 20 to 24 Minutes | 48 | 29.3% |
| 25 to 29 Minutes | 6 | 3.7% |
| 30 to 34 Minutes | 17 | 10.4% |
| 35 to 39 Minutes | 0 | 0.0% |
| 40 to 44 Minutes | 23 | 14.0% |
| 45 to 59 Minutes | 37 | 22.6% |
| 60 to 89 Minutes | 4 | 2.4% |
| 90 or more Minutes | 1 | 0.6% |
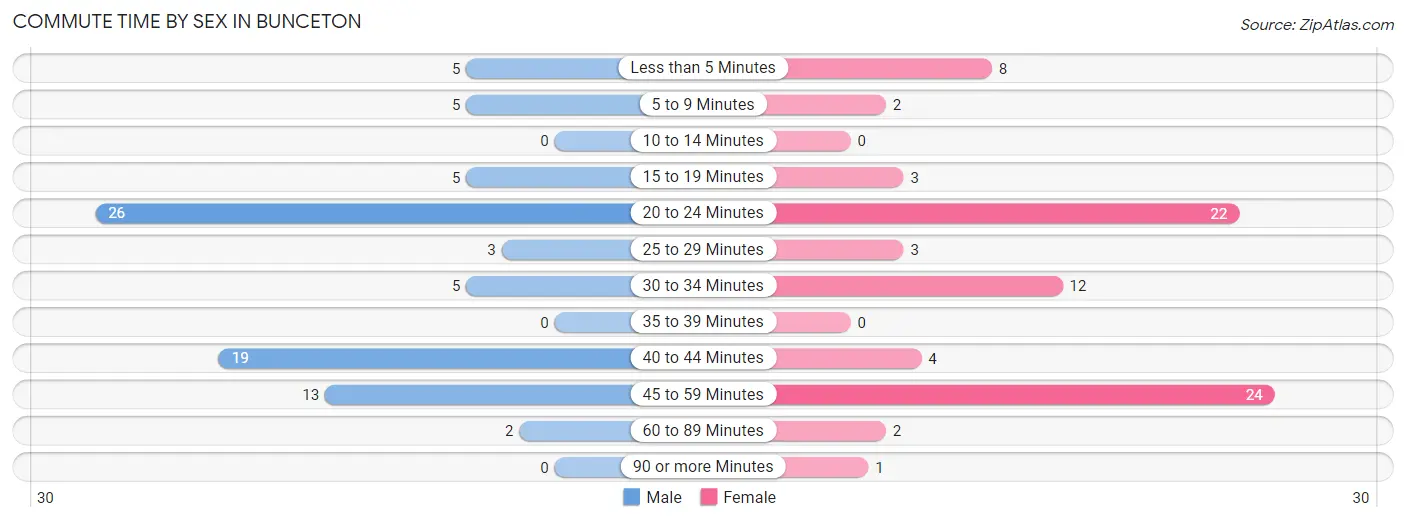
Commute Time by Sex in Bunceton
The most common commute times in Bunceton are 20 to 24 minutes (26 commuters, 31.3%) for males and 45 to 59 minutes (24 commuters, 29.6%) for females.
| Commute Time | Male | Female |
| Less than 5 Minutes | 5 (6.0%) | 8 (9.9%) |
| 5 to 9 Minutes | 5 (6.0%) | 2 (2.5%) |
| 10 to 14 Minutes | 0 (0.0%) | 0 (0.0%) |
| 15 to 19 Minutes | 5 (6.0%) | 3 (3.7%) |
| 20 to 24 Minutes | 26 (31.3%) | 22 (27.2%) |
| 25 to 29 Minutes | 3 (3.6%) | 3 (3.7%) |
| 30 to 34 Minutes | 5 (6.0%) | 12 (14.8%) |
| 35 to 39 Minutes | 0 (0.0%) | 0 (0.0%) |
| 40 to 44 Minutes | 19 (22.9%) | 4 (4.9%) |
| 45 to 59 Minutes | 13 (15.7%) | 24 (29.6%) |
| 60 to 89 Minutes | 2 (2.4%) | 2 (2.5%) |
| 90 or more Minutes | 0 (0.0%) | 1 (1.2%) |
Time of Departure to Work by Sex in Bunceton
The most frequent times of departure to work in Bunceton are 6:00 AM to 6:29 AM (34, 41.0%) for males and 8:00 AM to 8:29 AM (18, 22.2%) for females.
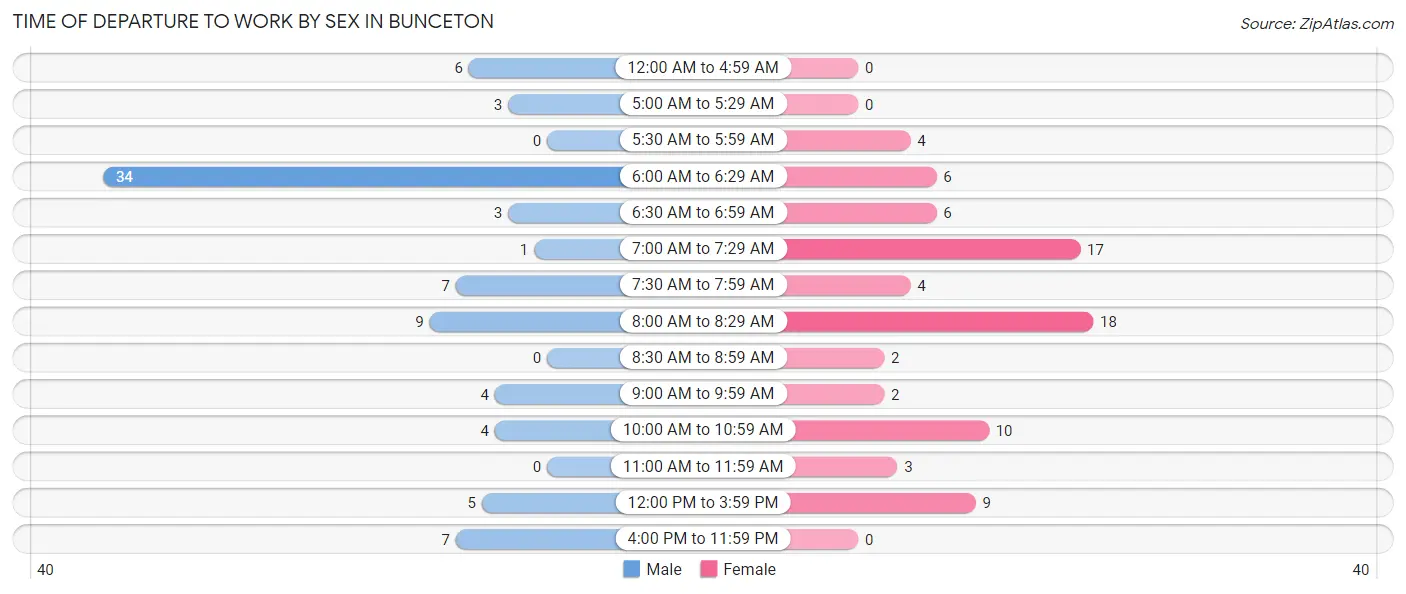
| Time of Departure | Male | Female |
| 12:00 AM to 4:59 AM | 6 (7.2%) | 0 (0.0%) |
| 5:00 AM to 5:29 AM | 3 (3.6%) | 0 (0.0%) |
| 5:30 AM to 5:59 AM | 0 (0.0%) | 4 (4.9%) |
| 6:00 AM to 6:29 AM | 34 (41.0%) | 6 (7.4%) |
| 6:30 AM to 6:59 AM | 3 (3.6%) | 6 (7.4%) |
| 7:00 AM to 7:29 AM | 1 (1.2%) | 17 (21.0%) |
| 7:30 AM to 7:59 AM | 7 (8.4%) | 4 (4.9%) |
| 8:00 AM to 8:29 AM | 9 (10.8%) | 18 (22.2%) |
| 8:30 AM to 8:59 AM | 0 (0.0%) | 2 (2.5%) |
| 9:00 AM to 9:59 AM | 4 (4.8%) | 2 (2.5%) |
| 10:00 AM to 10:59 AM | 4 (4.8%) | 10 (12.3%) |
| 11:00 AM to 11:59 AM | 0 (0.0%) | 3 (3.7%) |
| 12:00 PM to 3:59 PM | 5 (6.0%) | 9 (11.1%) |
| 4:00 PM to 11:59 PM | 7 (8.4%) | 0 (0.0%) |
| Total | 83 (100.0%) | 81 (100.0%) |
Housing Occupancy in Bunceton
Occupancy by Ownership in Bunceton
Of the total 120 dwellings in Bunceton, owner-occupied units account for 82 (68.3%), while renter-occupied units make up 38 (31.7%).
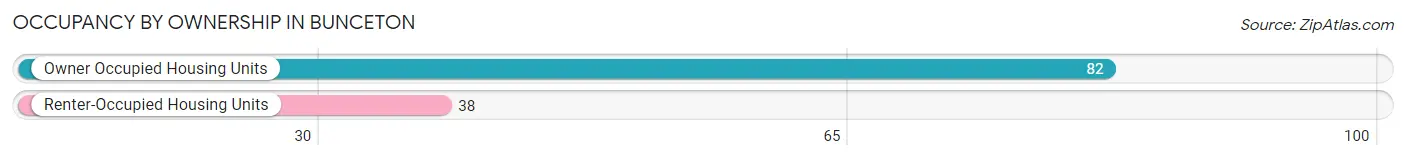
| Occupancy | # Housing Units | % Housing Units |
| Owner Occupied Housing Units | 82 | 68.3% |
| Renter-Occupied Housing Units | 38 | 31.7% |
| Total Occupied Housing Units | 120 | 100.0% |
Occupancy by Household Size in Bunceton
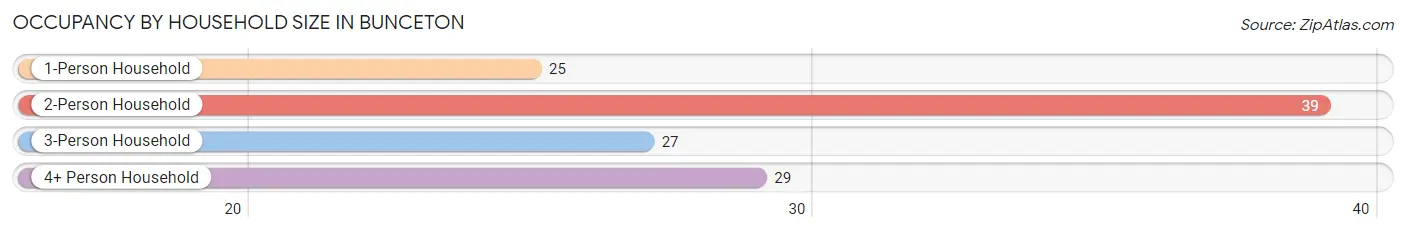
| Household Size | # Housing Units | % Housing Units |
| 1-Person Household | 25 | 20.8% |
| 2-Person Household | 39 | 32.5% |
| 3-Person Household | 27 | 22.5% |
| 4+ Person Household | 29 | 24.2% |
| Total Housing Units | 120 | 100.0% |
Occupancy by Ownership by Household Size in Bunceton
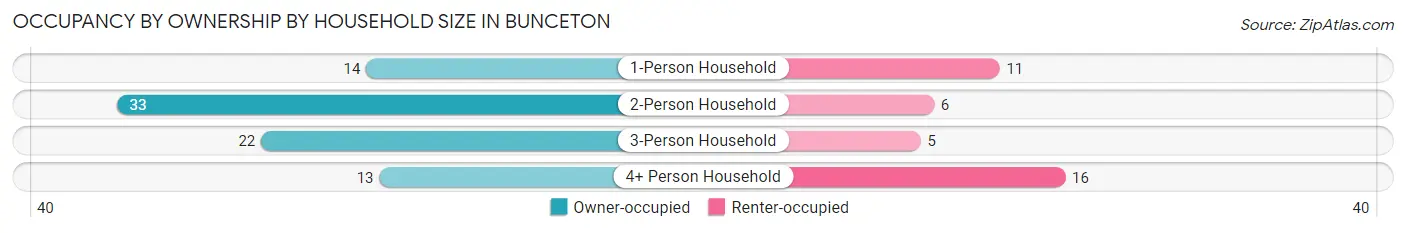
| Household Size | Owner-occupied | Renter-occupied |
| 1-Person Household | 14 (56.0%) | 11 (44.0%) |
| 2-Person Household | 33 (84.6%) | 6 (15.4%) |
| 3-Person Household | 22 (81.5%) | 5 (18.5%) |
| 4+ Person Household | 13 (44.8%) | 16 (55.2%) |
| Total Housing Units | 82 (68.3%) | 38 (31.7%) |
Occupancy by Educational Attainment in Bunceton
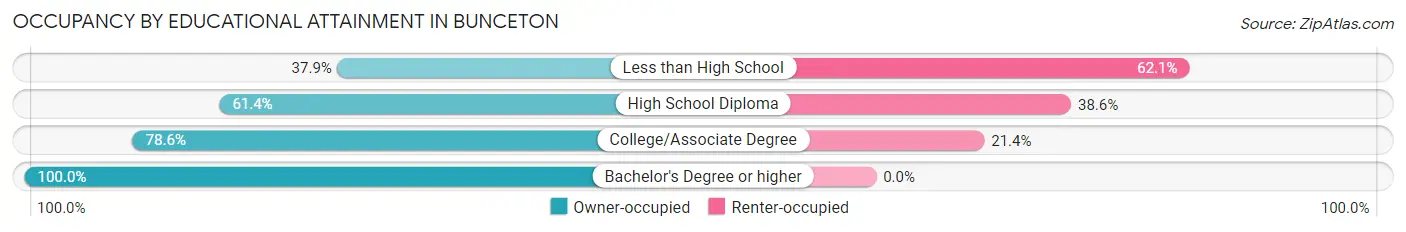
| Household Size | Owner-occupied | Renter-occupied |
| Less than High School | 11 (37.9%) | 18 (62.1%) |
| High School Diploma | 27 (61.4%) | 17 (38.6%) |
| College/Associate Degree | 11 (78.6%) | 3 (21.4%) |
| Bachelor's Degree or higher | 33 (100.0%) | 0 (0.0%) |
Occupancy by Age of Householder in Bunceton
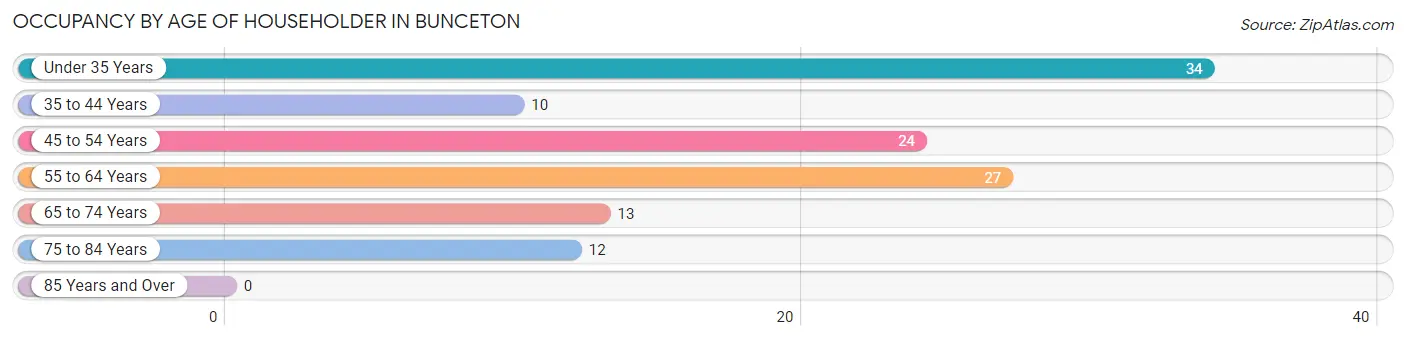
| Age Bracket | # Households | % Households |
| Under 35 Years | 34 | 28.3% |
| 35 to 44 Years | 10 | 8.3% |
| 45 to 54 Years | 24 | 20.0% |
| 55 to 64 Years | 27 | 22.5% |
| 65 to 74 Years | 13 | 10.8% |
| 75 to 84 Years | 12 | 10.0% |
| 85 Years and Over | 0 | 0.0% |
| Total | 120 | 100.0% |
Housing Finances in Bunceton
Median Income by Occupancy in Bunceton
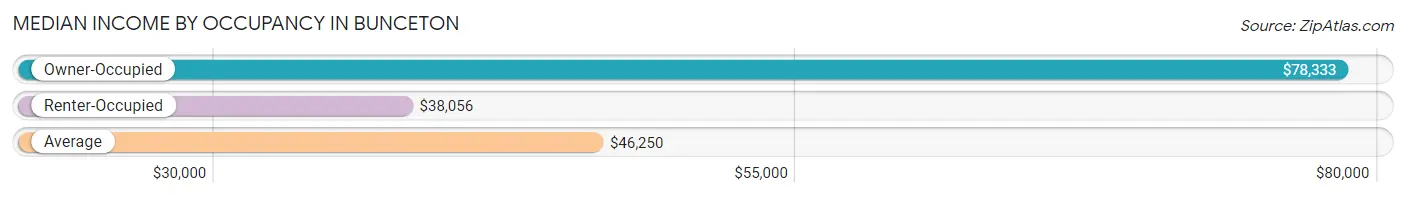
| Occupancy Type | # Households | Median Income |
| Owner-Occupied | 82 (68.3%) | $78,333 |
| Renter-Occupied | 38 (31.7%) | $38,056 |
| Average | 120 (100.0%) | $46,250 |
Occupancy by Householder Income Bracket in Bunceton
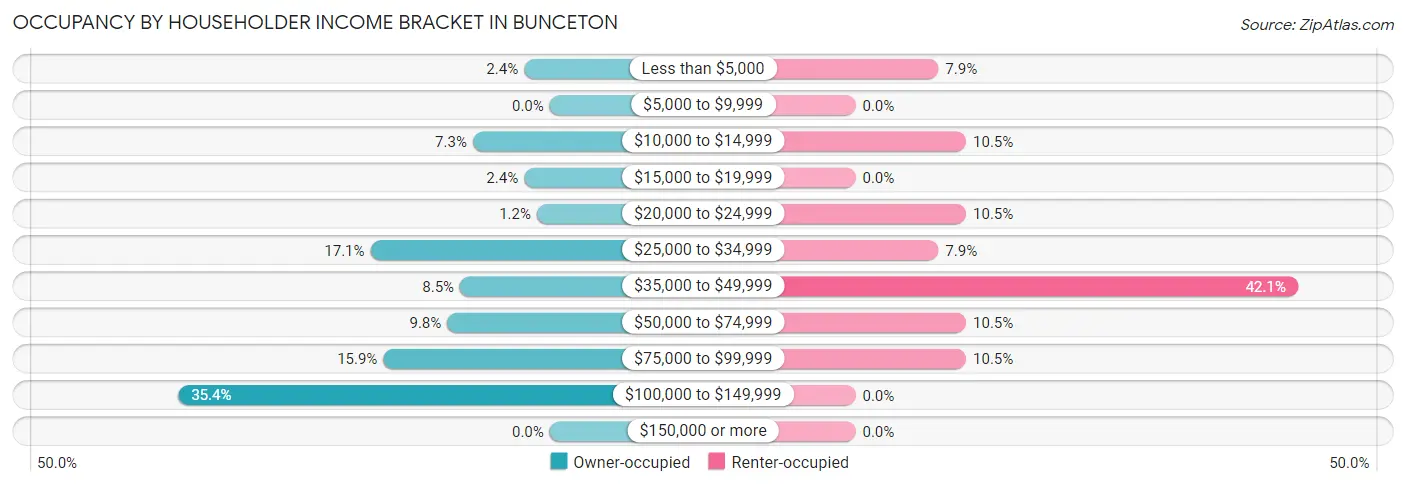
| Income Bracket | Owner-occupied | Renter-occupied |
| Less than $5,000 | 2 (2.4%) | 3 (7.9%) |
| $5,000 to $9,999 | 0 (0.0%) | 0 (0.0%) |
| $10,000 to $14,999 | 6 (7.3%) | 4 (10.5%) |
| $15,000 to $19,999 | 2 (2.4%) | 0 (0.0%) |
| $20,000 to $24,999 | 1 (1.2%) | 4 (10.5%) |
| $25,000 to $34,999 | 14 (17.1%) | 3 (7.9%) |
| $35,000 to $49,999 | 7 (8.5%) | 16 (42.1%) |
| $50,000 to $74,999 | 8 (9.8%) | 4 (10.5%) |
| $75,000 to $99,999 | 13 (15.9%) | 4 (10.5%) |
| $100,000 to $149,999 | 29 (35.4%) | 0 (0.0%) |
| $150,000 or more | 0 (0.0%) | 0 (0.0%) |
| Total | 82 (100.0%) | 38 (100.0%) |
Monthly Housing Cost Tiers in Bunceton
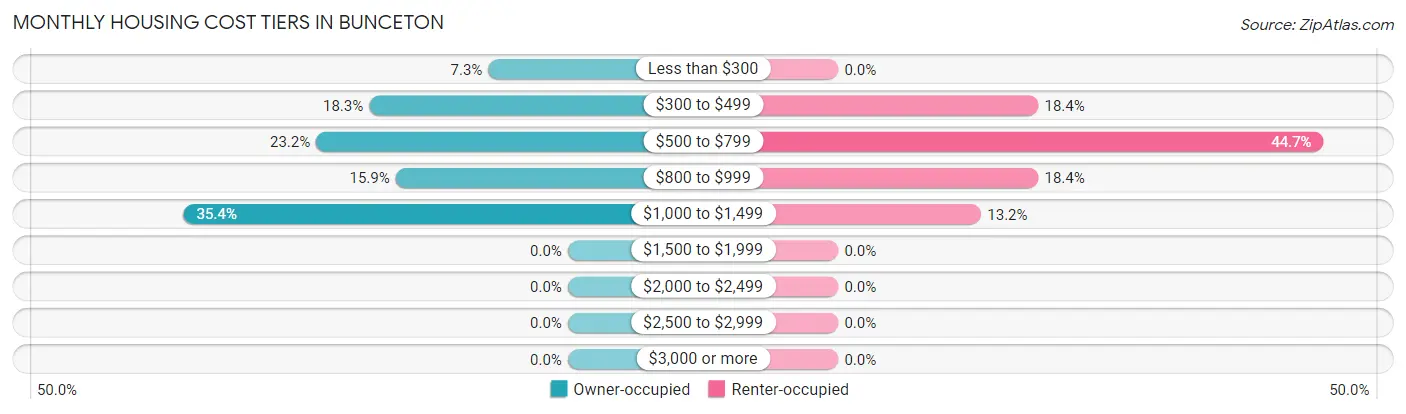
| Monthly Cost | Owner-occupied | Renter-occupied |
| Less than $300 | 6 (7.3%) | 0 (0.0%) |
| $300 to $499 | 15 (18.3%) | 7 (18.4%) |
| $500 to $799 | 19 (23.2%) | 17 (44.7%) |
| $800 to $999 | 13 (15.9%) | 7 (18.4%) |
| $1,000 to $1,499 | 29 (35.4%) | 5 (13.2%) |
| $1,500 to $1,999 | 0 (0.0%) | 0 (0.0%) |
| $2,000 to $2,499 | 0 (0.0%) | 0 (0.0%) |
| $2,500 to $2,999 | 0 (0.0%) | 0 (0.0%) |
| $3,000 or more | 0 (0.0%) | 0 (0.0%) |
| Total | 82 (100.0%) | 38 (100.0%) |
Physical Housing Characteristics in Bunceton
Housing Structures in Bunceton
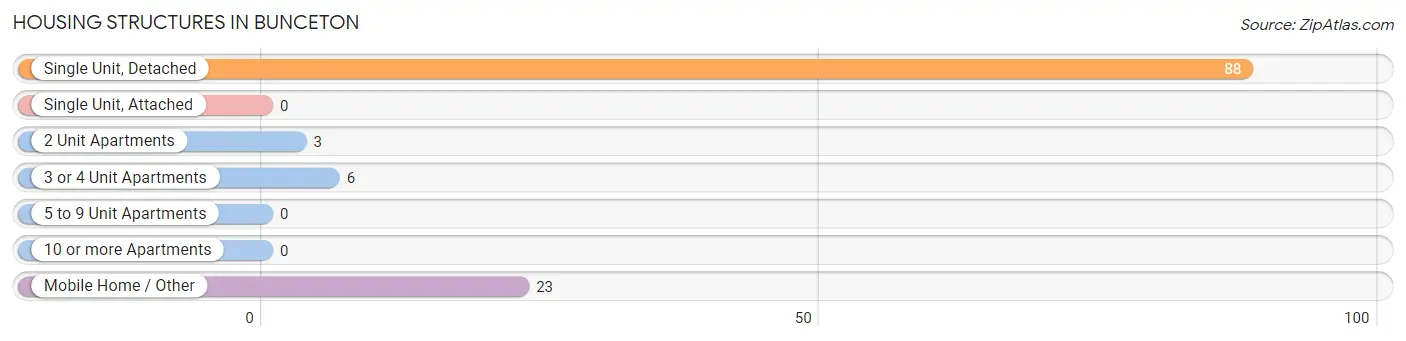
| Structure Type | # Housing Units | % Housing Units |
| Single Unit, Detached | 88 | 73.3% |
| Single Unit, Attached | 0 | 0.0% |
| 2 Unit Apartments | 3 | 2.5% |
| 3 or 4 Unit Apartments | 6 | 5.0% |
| 5 to 9 Unit Apartments | 0 | 0.0% |
| 10 or more Apartments | 0 | 0.0% |
| Mobile Home / Other | 23 | 19.2% |
| Total | 120 | 100.0% |
Housing Structures by Occupancy in Bunceton
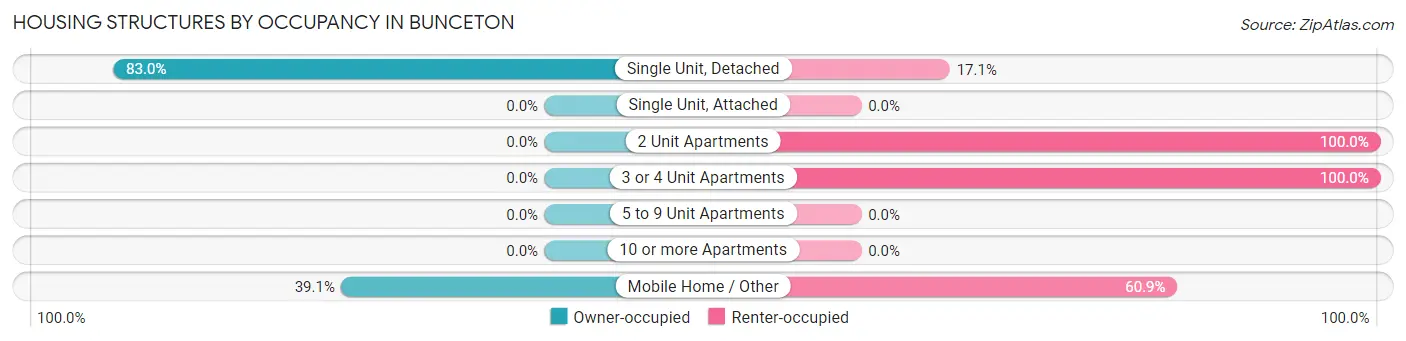
| Structure Type | Owner-occupied | Renter-occupied |
| Single Unit, Detached | 73 (83.0%) | 15 (17.1%) |
| Single Unit, Attached | 0 (0.0%) | 0 (0.0%) |
| 2 Unit Apartments | 0 (0.0%) | 3 (100.0%) |
| 3 or 4 Unit Apartments | 0 (0.0%) | 6 (100.0%) |
| 5 to 9 Unit Apartments | 0 (0.0%) | 0 (0.0%) |
| 10 or more Apartments | 0 (0.0%) | 0 (0.0%) |
| Mobile Home / Other | 9 (39.1%) | 14 (60.9%) |
| Total | 82 (68.3%) | 38 (31.7%) |
Housing Structures by Number of Rooms in Bunceton
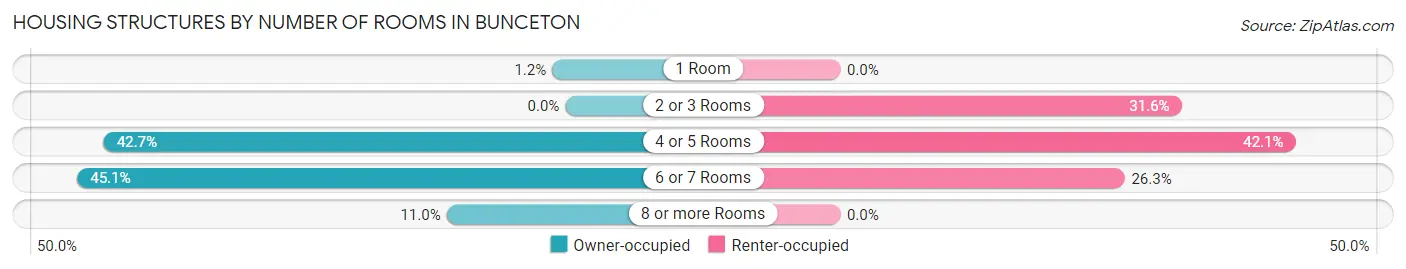
| Number of Rooms | Owner-occupied | Renter-occupied |
| 1 Room | 1 (1.2%) | 0 (0.0%) |
| 2 or 3 Rooms | 0 (0.0%) | 12 (31.6%) |
| 4 or 5 Rooms | 35 (42.7%) | 16 (42.1%) |
| 6 or 7 Rooms | 37 (45.1%) | 10 (26.3%) |
| 8 or more Rooms | 9 (11.0%) | 0 (0.0%) |
| Total | 82 (100.0%) | 38 (100.0%) |
Housing Structure by Heating Type in Bunceton
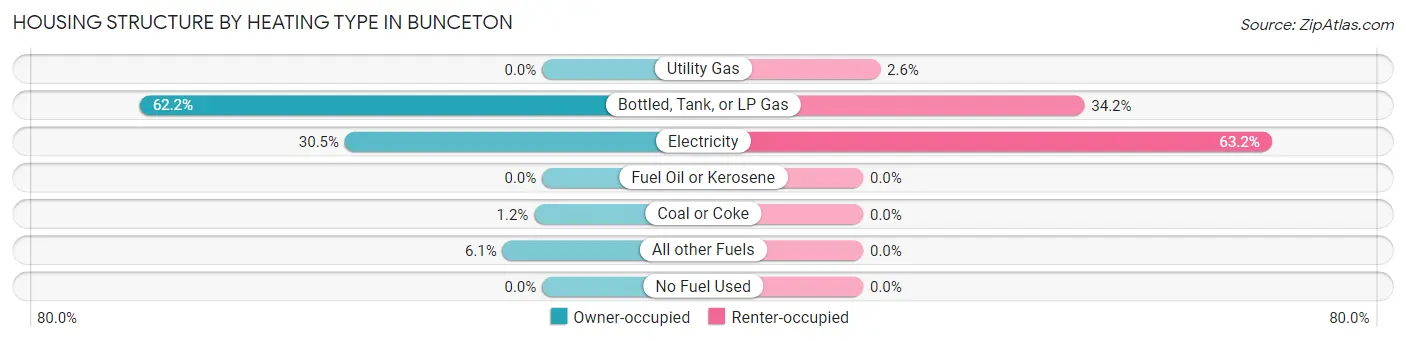
| Heating Type | Owner-occupied | Renter-occupied |
| Utility Gas | 0 (0.0%) | 1 (2.6%) |
| Bottled, Tank, or LP Gas | 51 (62.2%) | 13 (34.2%) |
| Electricity | 25 (30.5%) | 24 (63.2%) |
| Fuel Oil or Kerosene | 0 (0.0%) | 0 (0.0%) |
| Coal or Coke | 1 (1.2%) | 0 (0.0%) |
| All other Fuels | 5 (6.1%) | 0 (0.0%) |
| No Fuel Used | 0 (0.0%) | 0 (0.0%) |
| Total | 82 (100.0%) | 38 (100.0%) |
Household Vehicle Usage in Bunceton
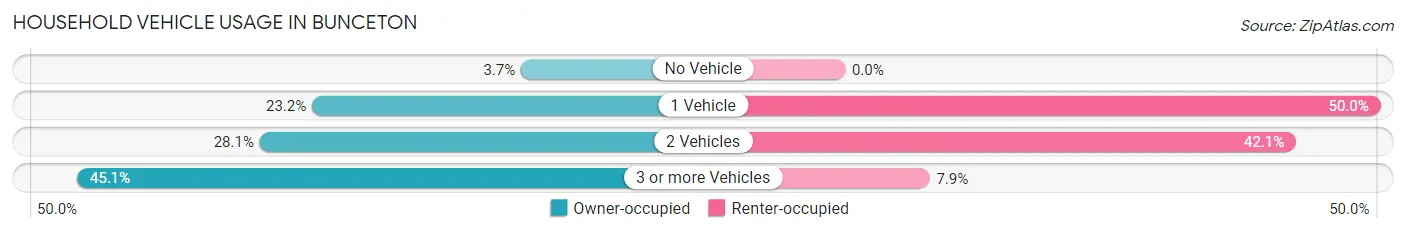
| Vehicles per Household | Owner-occupied | Renter-occupied |
| No Vehicle | 3 (3.7%) | 0 (0.0%) |
| 1 Vehicle | 19 (23.2%) | 19 (50.0%) |
| 2 Vehicles | 23 (28.1%) | 16 (42.1%) |
| 3 or more Vehicles | 37 (45.1%) | 3 (7.9%) |
| Total | 82 (100.0%) | 38 (100.0%) |
Real Estate & Mortgages in Bunceton
Real Estate and Mortgage Overview in Bunceton
| Characteristic | Without Mortgage | With Mortgage |
| Housing Units | 32 | 50 |
| Median Property Value | $83,300 | $84,700 |
| Median Household Income | $53,750 | $0 |
| Monthly Housing Costs | $489 | $0 |
| Real Estate Taxes | $700 | $0 |
Property Value by Mortgage Status in Bunceton
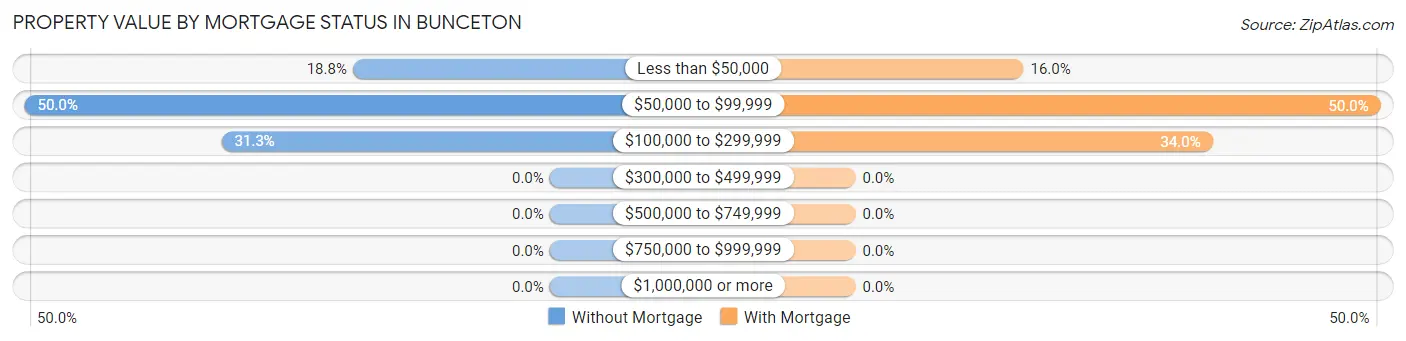
| Property Value | Without Mortgage | With Mortgage |
| Less than $50,000 | 6 (18.8%) | 8 (16.0%) |
| $50,000 to $99,999 | 16 (50.0%) | 25 (50.0%) |
| $100,000 to $299,999 | 10 (31.2%) | 17 (34.0%) |
| $300,000 to $499,999 | 0 (0.0%) | 0 (0.0%) |
| $500,000 to $749,999 | 0 (0.0%) | 0 (0.0%) |
| $750,000 to $999,999 | 0 (0.0%) | 0 (0.0%) |
| $1,000,000 or more | 0 (0.0%) | 0 (0.0%) |
| Total | 32 (100.0%) | 50 (100.0%) |
Household Income by Mortgage Status in Bunceton
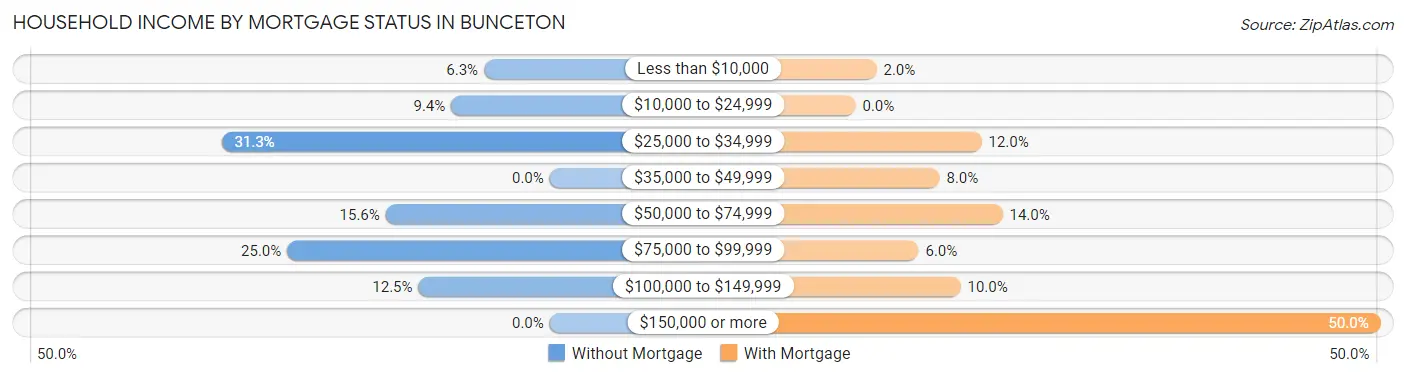
| Household Income | Without Mortgage | With Mortgage |
| Less than $10,000 | 2 (6.2%) | 1 (2.0%) |
| $10,000 to $24,999 | 3 (9.4%) | 0 (0.0%) |
| $25,000 to $34,999 | 10 (31.2%) | 6 (12.0%) |
| $35,000 to $49,999 | 0 (0.0%) | 4 (8.0%) |
| $50,000 to $74,999 | 5 (15.6%) | 7 (14.0%) |
| $75,000 to $99,999 | 8 (25.0%) | 3 (6.0%) |
| $100,000 to $149,999 | 4 (12.5%) | 5 (10.0%) |
| $150,000 or more | 0 (0.0%) | 25 (50.0%) |
| Total | 32 (100.0%) | 50 (100.0%) |
Property Value to Household Income Ratio in Bunceton
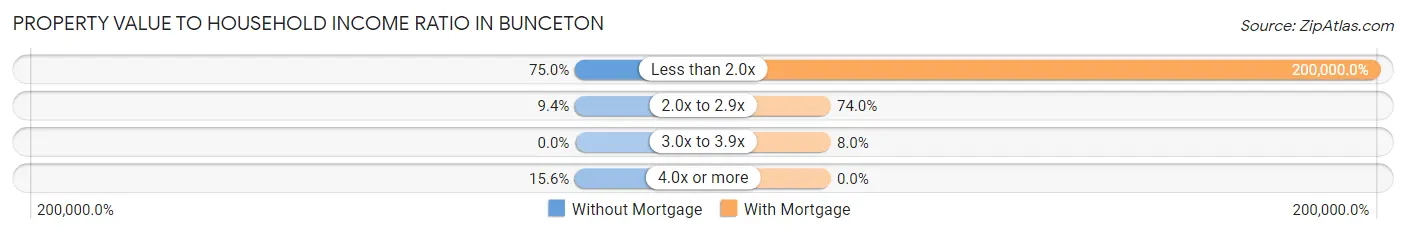
| Value-to-Income Ratio | Without Mortgage | With Mortgage |
| Less than 2.0x | 24 (75.0%) | 100,000 (200,000.0%) |
| 2.0x to 2.9x | 3 (9.4%) | 37 (74.0%) |
| 3.0x to 3.9x | 0 (0.0%) | 4 (8.0%) |
| 4.0x or more | 5 (15.6%) | 0 (0.0%) |
| Total | 32 (100.0%) | 50 (100.0%) |
Real Estate Taxes by Mortgage Status in Bunceton
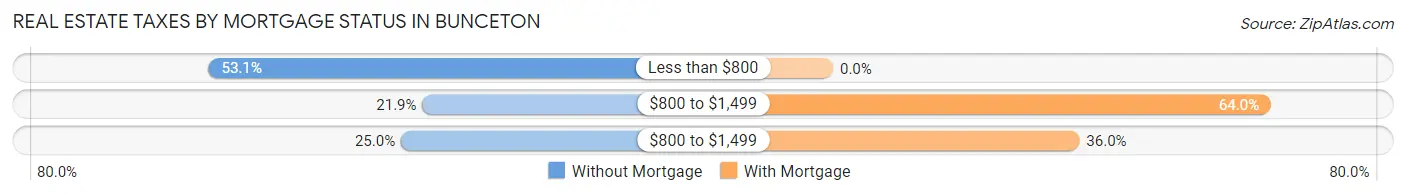
| Property Taxes | Without Mortgage | With Mortgage |
| Less than $800 | 17 (53.1%) | 0 (0.0%) |
| $800 to $1,499 | 7 (21.9%) | 32 (64.0%) |
| $800 to $1,499 | 8 (25.0%) | 18 (36.0%) |
| Total | 32 (100.0%) | 50 (100.0%) |
Health & Disability in Bunceton
Health Insurance Coverage by Age in Bunceton
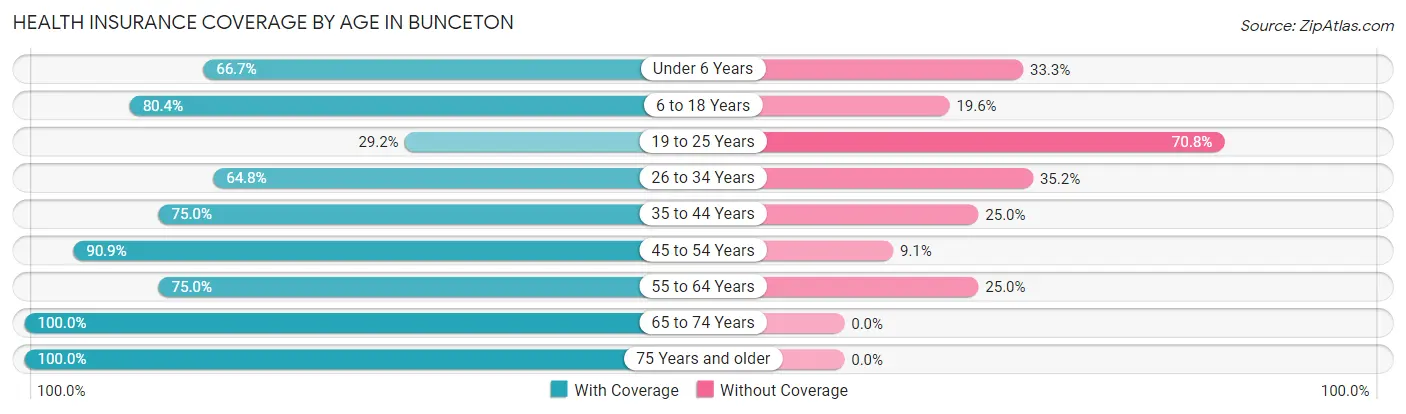
| Age Bracket | With Coverage | Without Coverage |
| Under 6 Years | 10 (66.7%) | 5 (33.3%) |
| 6 to 18 Years | 41 (80.4%) | 10 (19.6%) |
| 19 to 25 Years | 7 (29.2%) | 17 (70.8%) |
| 26 to 34 Years | 35 (64.8%) | 19 (35.2%) |
| 35 to 44 Years | 27 (75.0%) | 9 (25.0%) |
| 45 to 54 Years | 30 (90.9%) | 3 (9.1%) |
| 55 to 64 Years | 36 (75.0%) | 12 (25.0%) |
| 65 to 74 Years | 24 (100.0%) | 0 (0.0%) |
| 75 Years and older | 13 (100.0%) | 0 (0.0%) |
| Total | 223 (74.8%) | 75 (25.2%) |
Health Insurance Coverage by Citizenship Status in Bunceton
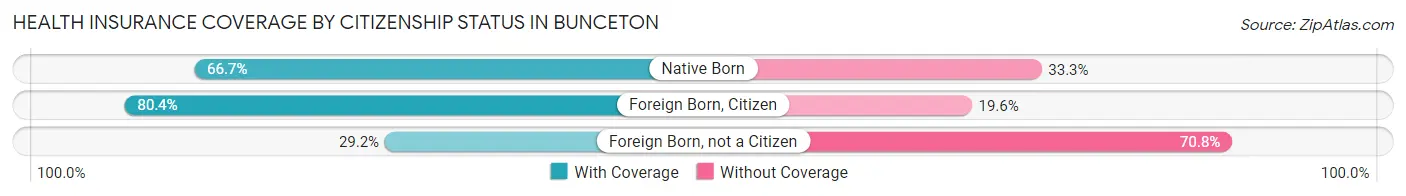
| Citizenship Status | With Coverage | Without Coverage |
| Native Born | 10 (66.7%) | 5 (33.3%) |
| Foreign Born, Citizen | 41 (80.4%) | 10 (19.6%) |
| Foreign Born, not a Citizen | 7 (29.2%) | 17 (70.8%) |
Health Insurance Coverage by Household Income in Bunceton
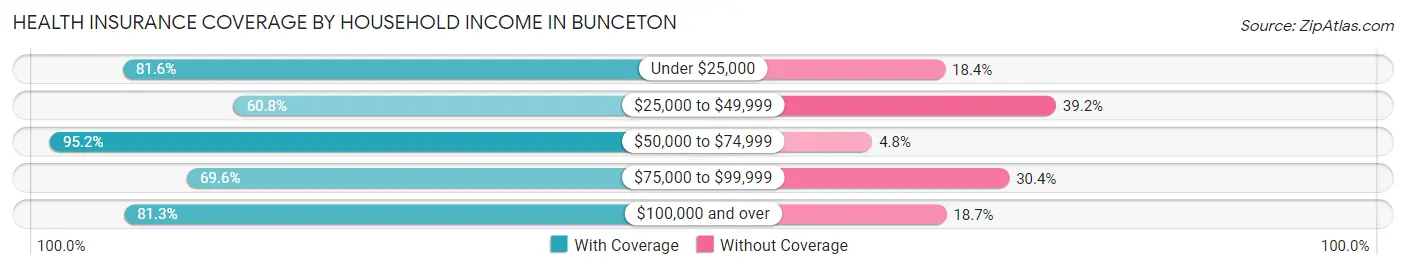
| Household Income | With Coverage | Without Coverage |
| Under $25,000 | 31 (81.6%) | 7 (18.4%) |
| $25,000 to $49,999 | 59 (60.8%) | 38 (39.2%) |
| $50,000 to $74,999 | 40 (95.2%) | 2 (4.8%) |
| $75,000 to $99,999 | 32 (69.6%) | 14 (30.4%) |
| $100,000 and over | 61 (81.3%) | 14 (18.7%) |
Public vs Private Health Insurance Coverage by Age in Bunceton
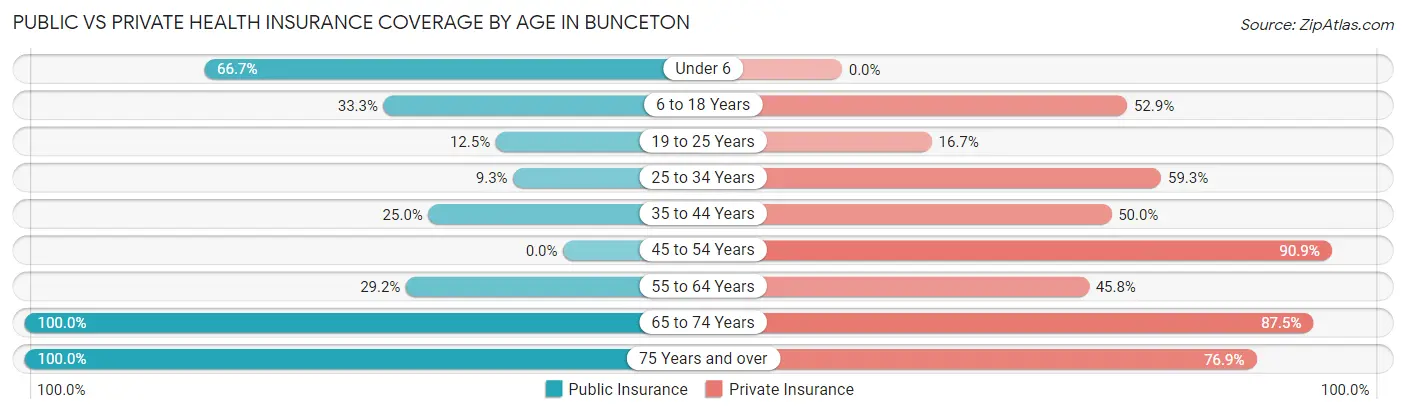
| Age Bracket | Public Insurance | Private Insurance |
| Under 6 | 10 (66.7%) | 0 (0.0%) |
| 6 to 18 Years | 17 (33.3%) | 27 (52.9%) |
| 19 to 25 Years | 3 (12.5%) | 4 (16.7%) |
| 25 to 34 Years | 5 (9.3%) | 32 (59.3%) |
| 35 to 44 Years | 9 (25.0%) | 18 (50.0%) |
| 45 to 54 Years | 0 (0.0%) | 30 (90.9%) |
| 55 to 64 Years | 14 (29.2%) | 22 (45.8%) |
| 65 to 74 Years | 24 (100.0%) | 21 (87.5%) |
| 75 Years and over | 13 (100.0%) | 10 (76.9%) |
| Total | 95 (31.9%) | 164 (55.0%) |
Disability Status by Sex by Age in Bunceton
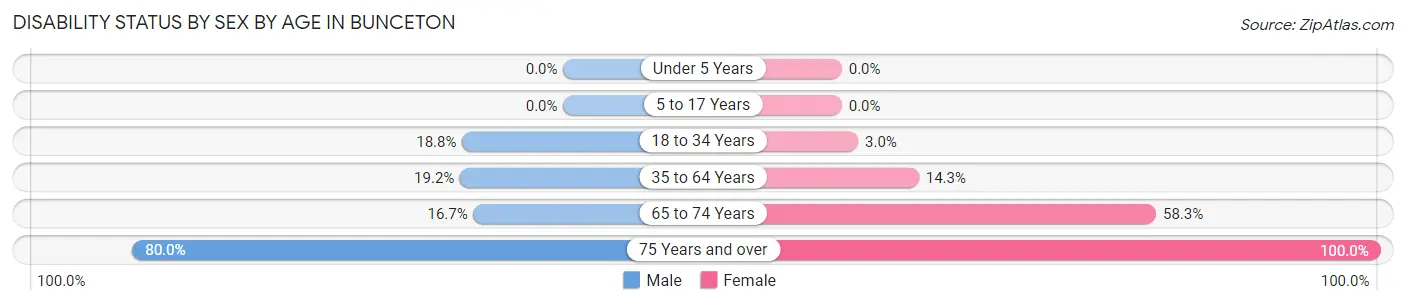
| Age Bracket | Male | Female |
| Under 5 Years | 0 (0.0%) | 0 (0.0%) |
| 5 to 17 Years | 0 (0.0%) | 0 (0.0%) |
| 18 to 34 Years | 9 (18.8%) | 1 (3.0%) |
| 35 to 64 Years | 9 (19.2%) | 10 (14.3%) |
| 65 to 74 Years | 2 (16.7%) | 7 (58.3%) |
| 75 Years and over | 4 (80.0%) | 8 (100.0%) |
Disability Class by Sex by Age in Bunceton
Disability Class: Hearing Difficulty
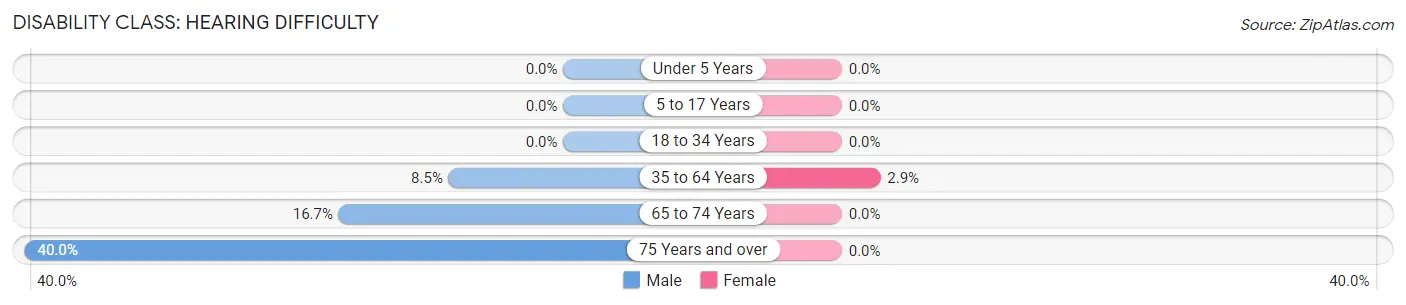
| Age Bracket | Male | Female |
| Under 5 Years | 0 (0.0%) | 0 (0.0%) |
| 5 to 17 Years | 0 (0.0%) | 0 (0.0%) |
| 18 to 34 Years | 0 (0.0%) | 0 (0.0%) |
| 35 to 64 Years | 4 (8.5%) | 2 (2.9%) |
| 65 to 74 Years | 2 (16.7%) | 0 (0.0%) |
| 75 Years and over | 2 (40.0%) | 0 (0.0%) |
Disability Class: Vision Difficulty
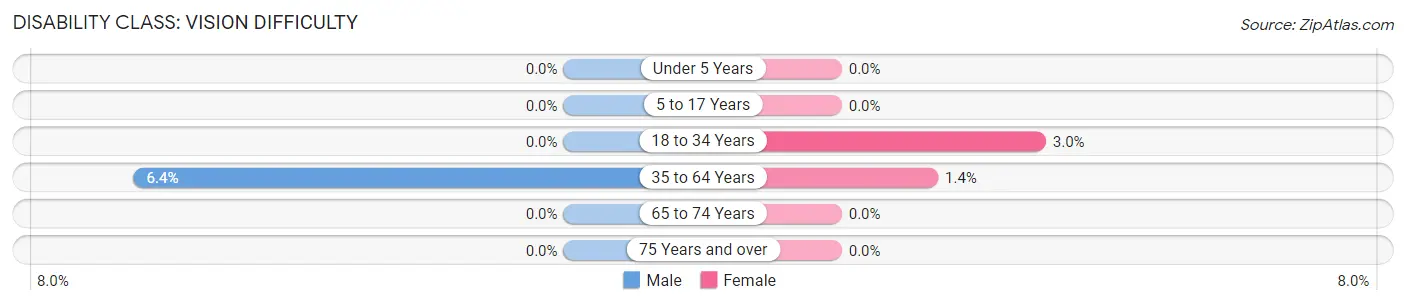
| Age Bracket | Male | Female |
| Under 5 Years | 0 (0.0%) | 0 (0.0%) |
| 5 to 17 Years | 0 (0.0%) | 0 (0.0%) |
| 18 to 34 Years | 0 (0.0%) | 1 (3.0%) |
| 35 to 64 Years | 3 (6.4%) | 1 (1.4%) |
| 65 to 74 Years | 0 (0.0%) | 0 (0.0%) |
| 75 Years and over | 0 (0.0%) | 0 (0.0%) |
Disability Class: Cognitive Difficulty
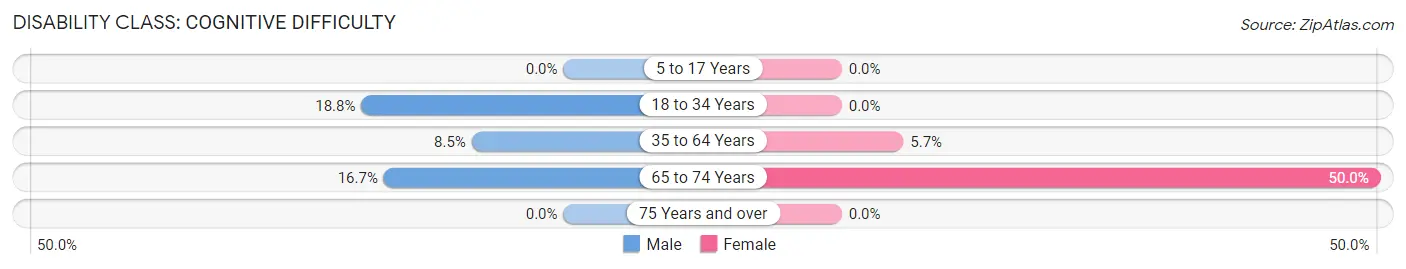
| Age Bracket | Male | Female |
| 5 to 17 Years | 0 (0.0%) | 0 (0.0%) |
| 18 to 34 Years | 9 (18.8%) | 0 (0.0%) |
| 35 to 64 Years | 4 (8.5%) | 4 (5.7%) |
| 65 to 74 Years | 2 (16.7%) | 6 (50.0%) |
| 75 Years and over | 0 (0.0%) | 0 (0.0%) |
Disability Class: Ambulatory Difficulty
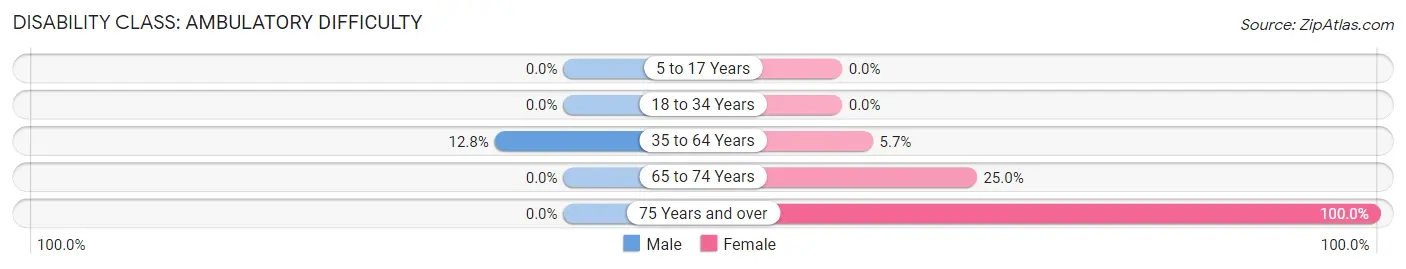
| Age Bracket | Male | Female |
| 5 to 17 Years | 0 (0.0%) | 0 (0.0%) |
| 18 to 34 Years | 0 (0.0%) | 0 (0.0%) |
| 35 to 64 Years | 6 (12.8%) | 4 (5.7%) |
| 65 to 74 Years | 0 (0.0%) | 3 (25.0%) |
| 75 Years and over | 0 (0.0%) | 8 (100.0%) |
Disability Class: Self-Care Difficulty
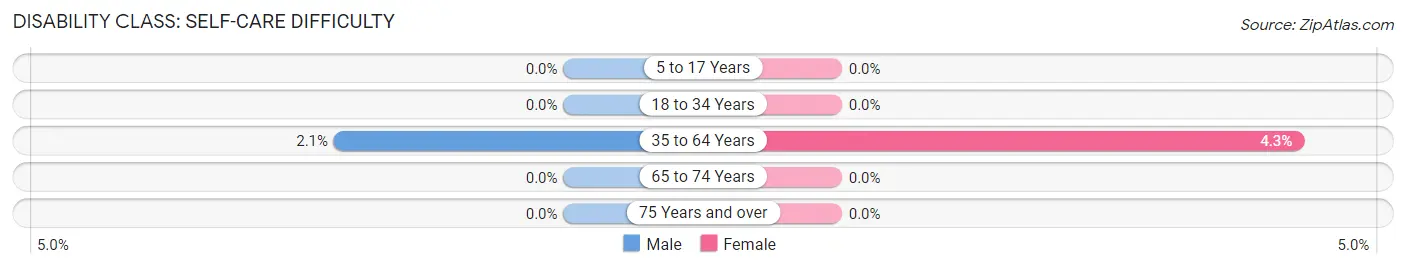
| Age Bracket | Male | Female |
| 5 to 17 Years | 0 (0.0%) | 0 (0.0%) |
| 18 to 34 Years | 0 (0.0%) | 0 (0.0%) |
| 35 to 64 Years | 1 (2.1%) | 3 (4.3%) |
| 65 to 74 Years | 0 (0.0%) | 0 (0.0%) |
| 75 Years and over | 0 (0.0%) | 0 (0.0%) |
Technology Access in Bunceton
Computing Device Access in Bunceton
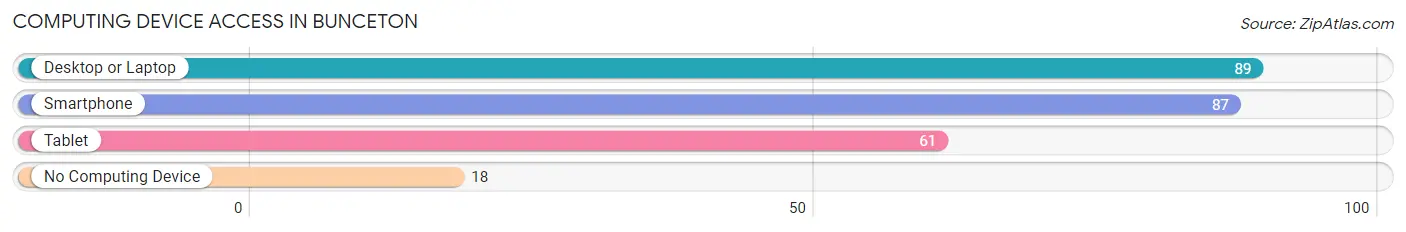
| Device Type | # Households | % Households |
| Desktop or Laptop | 89 | 74.2% |
| Smartphone | 87 | 72.5% |
| Tablet | 61 | 50.8% |
| No Computing Device | 18 | 15.0% |
| Total | 120 | 100.0% |
Internet Access in Bunceton
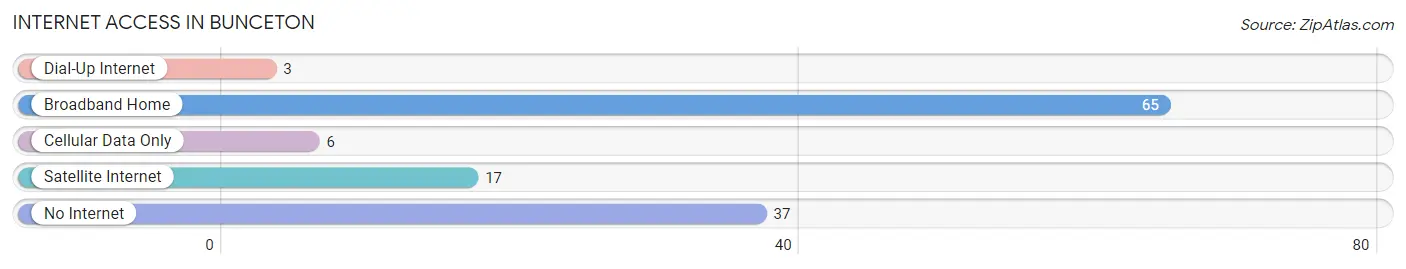
| Internet Type | # Households | % Households |
| Dial-Up Internet | 3 | 2.5% |
| Broadband Home | 65 | 54.2% |
| Cellular Data Only | 6 | 5.0% |
| Satellite Internet | 17 | 14.2% |
| No Internet | 37 | 30.8% |
| Total | 120 | 100.0% |
Bunceton Summary
Bunceton is a small town located in Cooper County, Missouri, United States. It is situated on the banks of the Missouri River, approximately 20 miles east of the state capital, Jefferson City. The population of Bunceton was estimated to be 517 in the year 2000.
History
Bunceton was founded in 1858 by a group of settlers from Kentucky and Tennessee. The town was named after the Bunce family, who were among the first settlers. The Bunce family had a large farm in the area and the town was built around it.
The town was incorporated in 1872 and the first mayor was elected in 1873. The town grew slowly but steadily over the years, and by the turn of the century, it had a population of around 500.
In the early 1900s, the town was a major stop on the Missouri Pacific Railroad. This allowed the town to become a hub for trade and commerce. The town also had a number of businesses, including a bank, a hotel, a general store, and a blacksmith shop.
Geography
Bunceton is located in Cooper County, Missouri, approximately 20 miles east of the state capital, Jefferson City. The town is situated on the banks of the Missouri River, and is surrounded by rolling hills and farmland. The town is located in the Central Plains region of the state, and has a humid continental climate.
The town covers an area of 1.2 square miles, and has an elevation of 845 feet. The town is located in the Central Time Zone, and the zip code is 65237.
Economy
The economy of Bunceton is largely based on agriculture. The town is home to several farms, which produce a variety of crops, including corn, soybeans, wheat, and hay. The town also has a number of businesses, including a bank, a hotel, a general store, and a blacksmith shop.
The town is also home to a number of manufacturing companies, including a furniture factory, a metal fabrication plant, and a plastics factory. The town is also home to a number of small businesses, including restaurants, retail stores, and service providers.
Demographics
The population of Bunceton was estimated to be 517 in the year 2000. The town has a population density of 431 people per square mile. The median age of the population is 41.7 years, and the median household income is $37,500.
The town is predominantly white, with 95.3% of the population identifying as white. The town also has a small African American population, with 2.3% of the population identifying as African American. The town also has a small Hispanic population, with 1.4% of the population identifying as Hispanic or Latino.
Conclusion
Bunceton is a small town located in Cooper County, Missouri, United States. It is situated on the banks of the Missouri River, approximately 20 miles east of the state capital, Jefferson City. The population of Bunceton was estimated to be 517 in the year 2000. The town has a largely agricultural economy, and is home to a number of businesses, including a bank, a hotel, a general store, and a blacksmith shop. The town is predominantly white, with 95.3% of the population identifying as white. The town also has a small African American population, with 2.3% of the population identifying as African American. The town also has a small Hispanic population, with 1.4% of the population identifying as Hispanic or Latino.
Common Questions
What is Per Capita Income in Bunceton?
Per Capita income in Bunceton is $23,755.
What is the Median Family Income in Bunceton?
Median Family Income in Bunceton is $49,375.
What is the Median Household income in Bunceton?
Median Household Income in Bunceton is $46,250.
What is Income or Wage Gap in Bunceton?
Income or Wage Gap in Bunceton is 21.7%.
Women in Bunceton earn 78.3 cents for every dollar earned by a man.
What is Inequality or Gini Index in Bunceton?
Inequality or Gini Index in Bunceton is 0.35.
What is the Total Population of Bunceton?
Total Population of Bunceton is 298.
What is the Total Male Population of Bunceton?
Total Male Population of Bunceton is 135.
What is the Total Female Population of Bunceton?
Total Female Population of Bunceton is 163.
What is the Ratio of Males per 100 Females in Bunceton?
There are 82.82 Males per 100 Females in Bunceton.
What is the Ratio of Females per 100 Males in Bunceton?
There are 120.74 Females per 100 Males in Bunceton.
What is the Median Population Age in Bunceton?
Median Population Age in Bunceton is 37.7 Years.
What is the Average Family Size in Bunceton
Average Family Size in Bunceton is 2.9 People.
What is the Average Household Size in Bunceton
Average Household Size in Bunceton is 2.5 People.
How Large is the Labor Force in Bunceton?
There are 169 People in the Labor Forcein in Bunceton.
What is the Percentage of People in the Labor Force in Bunceton?
70.7% of People are in the Labor Force in Bunceton.
What is the Unemployment Rate in Bunceton?
Unemployment Rate in Bunceton is 1.8%.