Brookfield, MO Map & Demographics
Brookfield Map
Brookfield Overview
$28,966
PER CAPITA INCOME
$56,599
AVG FAMILY INCOME
$53,653
AVG HOUSEHOLD INCOME
28.3%
WAGE / INCOME GAP [ % ]
71.7¢/ $1
WAGE / INCOME GAP [ $ ]
$14,931
FAMILY INCOME DEFICIT
0.45
INEQUALITY / GINI INDEX
4,142
TOTAL POPULATION
2,000
MALE POPULATION
2,142
FEMALE POPULATION
93.37
MALES / 100 FEMALES
107.10
FEMALES / 100 MALES
42.5
MEDIAN AGE
3.0
AVG FAMILY SIZE
2.3
AVG HOUSEHOLD SIZE
1,917
LABOR FORCE [ PEOPLE ]
57.6%
PERCENT IN LABOR FORCE
2.7%
UNEMPLOYMENT RATE
Brookfield Zip Codes
Brookfield Area Codes
Income in Brookfield
Income Overview in Brookfield
Per Capita Income in Brookfield is $28,966, while median incomes of families and households are $56,599 and $53,653 respectively.
| Characteristic | Number | Measure |
| Per Capita Income | 4,142 | $28,966 |
| Median Family Income | 1,017 | $56,599 |
| Mean Family Income | 1,017 | $72,202 |
| Median Household Income | 1,705 | $53,653 |
| Mean Household Income | 1,705 | $72,088 |
| Income Deficit | 1,017 | $14,931 |
| Wage / Income Gap (%) | 4,142 | 28.28% |
| Wage / Income Gap ($) | 4,142 | 71.72¢ per $1 |
| Gini / Inequality Index | 4,142 | 0.45 |
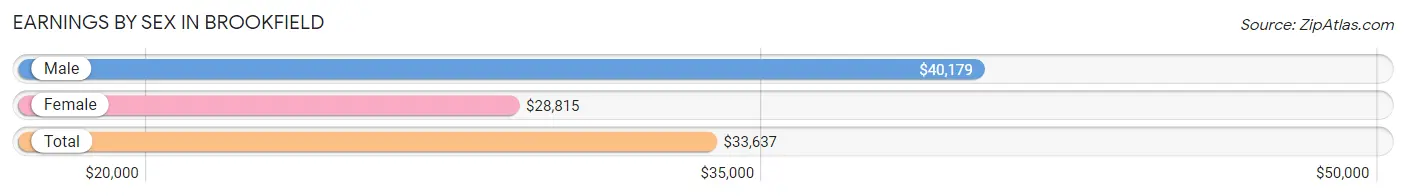
Earnings by Sex in Brookfield
Average Earnings in Brookfield are $33,637, $40,179 for men and $28,815 for women, a difference of 28.3%.
| Sex | Number | Average Earnings |
| Male | 970 (49.8%) | $40,179 |
| Female | 977 (50.2%) | $28,815 |
| Total | 1,947 (100.0%) | $33,637 |
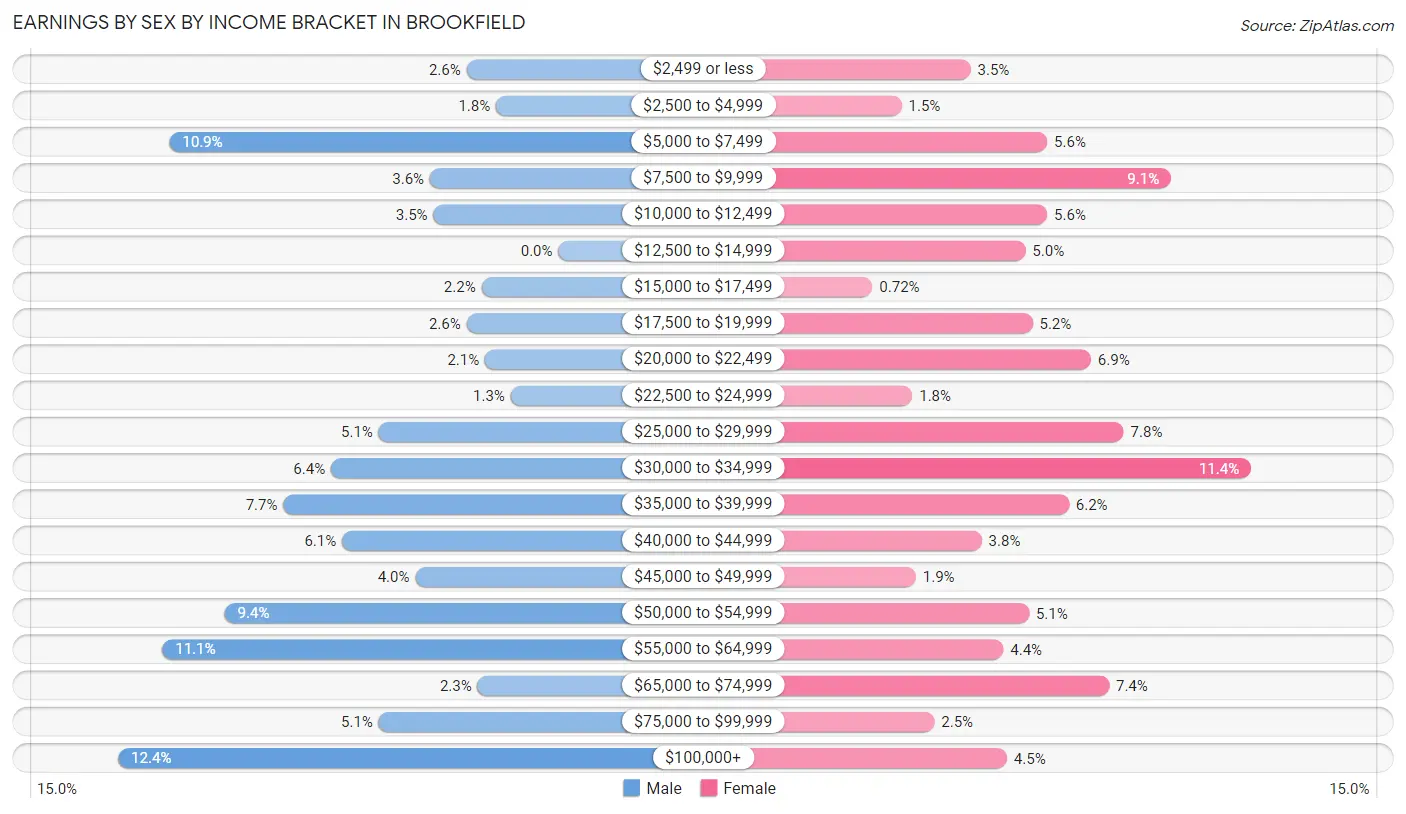
Earnings by Sex by Income Bracket in Brookfield
The most common earnings brackets in Brookfield are $100,000+ for men (120 | 12.4%) and $30,000 to $34,999 for women (111 | 11.4%).
| Income | Male | Female |
| $2,499 or less | 25 (2.6%) | 34 (3.5%) |
| $2,500 to $4,999 | 17 (1.8%) | 15 (1.5%) |
| $5,000 to $7,499 | 106 (10.9%) | 55 (5.6%) |
| $7,500 to $9,999 | 35 (3.6%) | 89 (9.1%) |
| $10,000 to $12,499 | 34 (3.5%) | 55 (5.6%) |
| $12,500 to $14,999 | 0 (0.0%) | 49 (5.0%) |
| $15,000 to $17,499 | 21 (2.2%) | 7 (0.7%) |
| $17,500 to $19,999 | 25 (2.6%) | 51 (5.2%) |
| $20,000 to $22,499 | 20 (2.1%) | 67 (6.9%) |
| $22,500 to $24,999 | 13 (1.3%) | 18 (1.8%) |
| $25,000 to $29,999 | 49 (5.1%) | 76 (7.8%) |
| $30,000 to $34,999 | 62 (6.4%) | 111 (11.4%) |
| $35,000 to $39,999 | 75 (7.7%) | 61 (6.2%) |
| $40,000 to $44,999 | 59 (6.1%) | 37 (3.8%) |
| $45,000 to $49,999 | 39 (4.0%) | 19 (1.9%) |
| $50,000 to $54,999 | 91 (9.4%) | 50 (5.1%) |
| $55,000 to $64,999 | 108 (11.1%) | 43 (4.4%) |
| $65,000 to $74,999 | 22 (2.3%) | 72 (7.4%) |
| $75,000 to $99,999 | 49 (5.1%) | 24 (2.5%) |
| $100,000+ | 120 (12.4%) | 44 (4.5%) |
| Total | 970 (100.0%) | 977 (100.0%) |
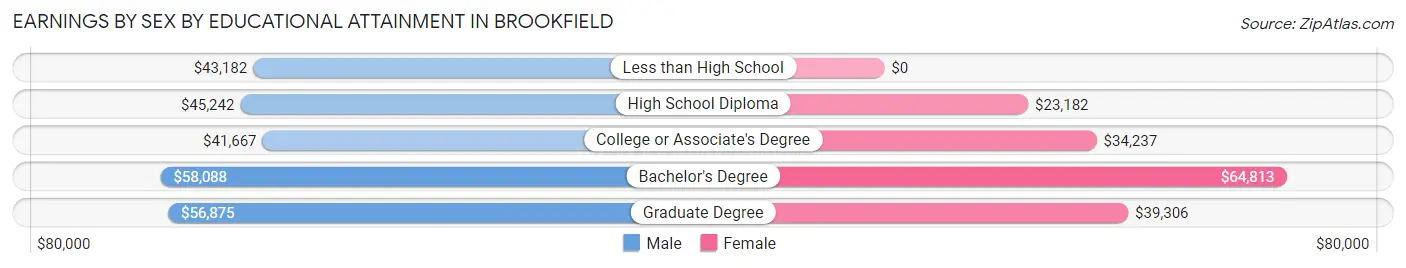
Earnings by Sex by Educational Attainment in Brookfield
Average earnings in Brookfield are $45,403 for men and $32,756 for women, a difference of 27.9%. Men with an educational attainment of bachelor's degree enjoy the highest average annual earnings of $58,088, while those with college or associate's degree education earn the least with $41,667. Women with an educational attainment of bachelor's degree earn the most with the average annual earnings of $64,813, while those with high school diploma education have the smallest earnings of $23,182.
| Educational Attainment | Male Income | Female Income |
| Less than High School | $43,182 | $0 |
| High School Diploma | $45,242 | $23,182 |
| College or Associate's Degree | $41,667 | $34,237 |
| Bachelor's Degree | $58,088 | $64,813 |
| Graduate Degree | $56,875 | $39,306 |
| Total | $45,403 | $32,756 |
Family Income in Brookfield
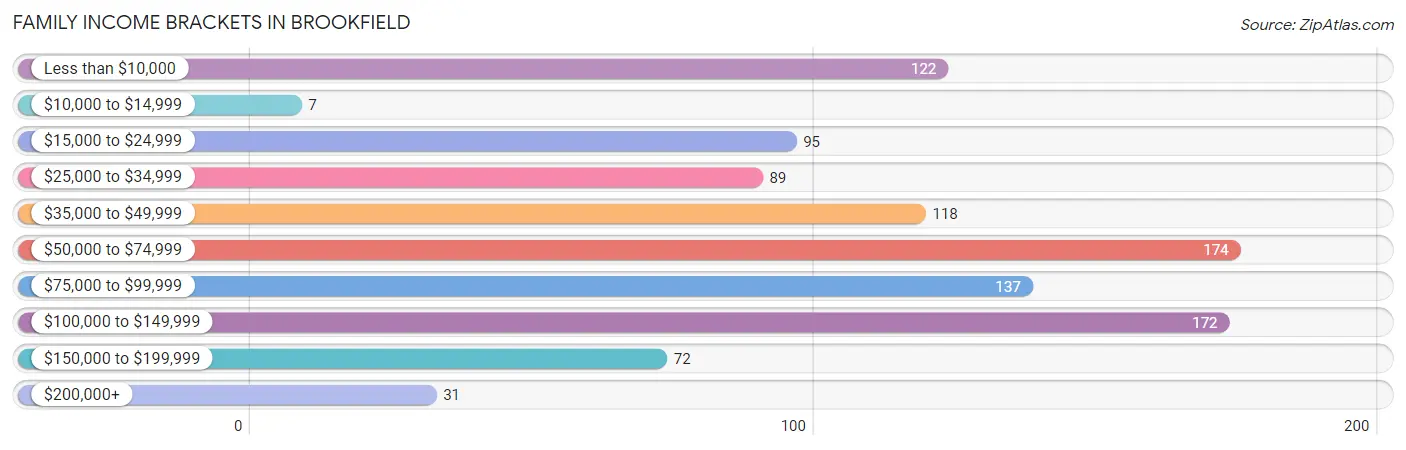
Family Income Brackets in Brookfield
According to the Brookfield family income data, there are 174 families falling into the $50,000 to $74,999 income range, which is the most common income bracket and makes up 17.1% of all families. Conversely, the $10,000 to $14,999 income bracket is the least frequent group with only 7 families (0.7%) belonging to this category.
| Income Bracket | # Families | % Families |
| Less than $10,000 | 122 | 12.0% |
| $10,000 to $14,999 | 7 | 0.7% |
| $15,000 to $24,999 | 95 | 9.3% |
| $25,000 to $34,999 | 89 | 8.8% |
| $35,000 to $49,999 | 118 | 11.6% |
| $50,000 to $74,999 | 174 | 17.1% |
| $75,000 to $99,999 | 137 | 13.5% |
| $100,000 to $149,999 | 172 | 16.9% |
| $150,000 to $199,999 | 72 | 7.1% |
| $200,000+ | 31 | 3.0% |
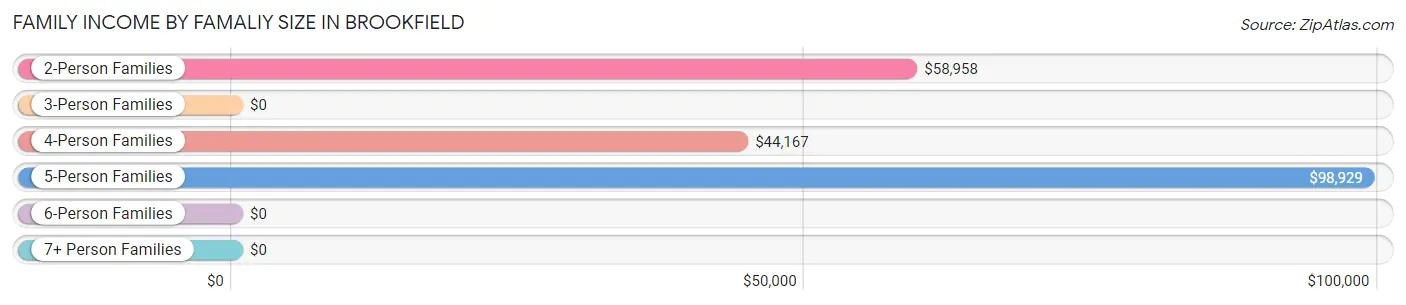
Family Income by Famaliy Size in Brookfield
5-person families (80 | 7.9%) account for the highest median family income in Brookfield with $98,929 per family, while 2-person families (503 | 49.5%) have the highest median income of $29,479 per family member.
| Income Bracket | # Families | Median Income |
| 2-Person Families | 503 (49.5%) | $58,958 |
| 3-Person Families | 184 (18.1%) | $0 |
| 4-Person Families | 242 (23.8%) | $44,167 |
| 5-Person Families | 80 (7.9%) | $98,929 |
| 6-Person Families | 0 (0.0%) | $0 |
| 7+ Person Families | 8 (0.8%) | $0 |
| Total | 1,017 (100.0%) | $56,599 |
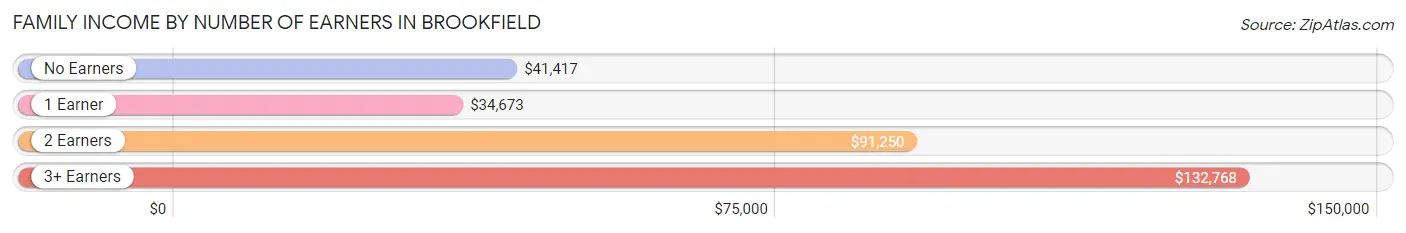
Family Income by Number of Earners in Brookfield
The median family income in Brookfield is $56,599, with families comprising 3+ earners (68) having the highest median family income of $132,768, while families with 1 earner (259) have the lowest median family income of $34,673, accounting for 6.7% and 25.5% of families, respectively.
| Number of Earners | # Families | Median Income |
| No Earners | 305 (30.0%) | $41,417 |
| 1 Earner | 259 (25.5%) | $34,673 |
| 2 Earners | 385 (37.9%) | $91,250 |
| 3+ Earners | 68 (6.7%) | $132,768 |
| Total | 1,017 (100.0%) | $56,599 |
Household Income in Brookfield
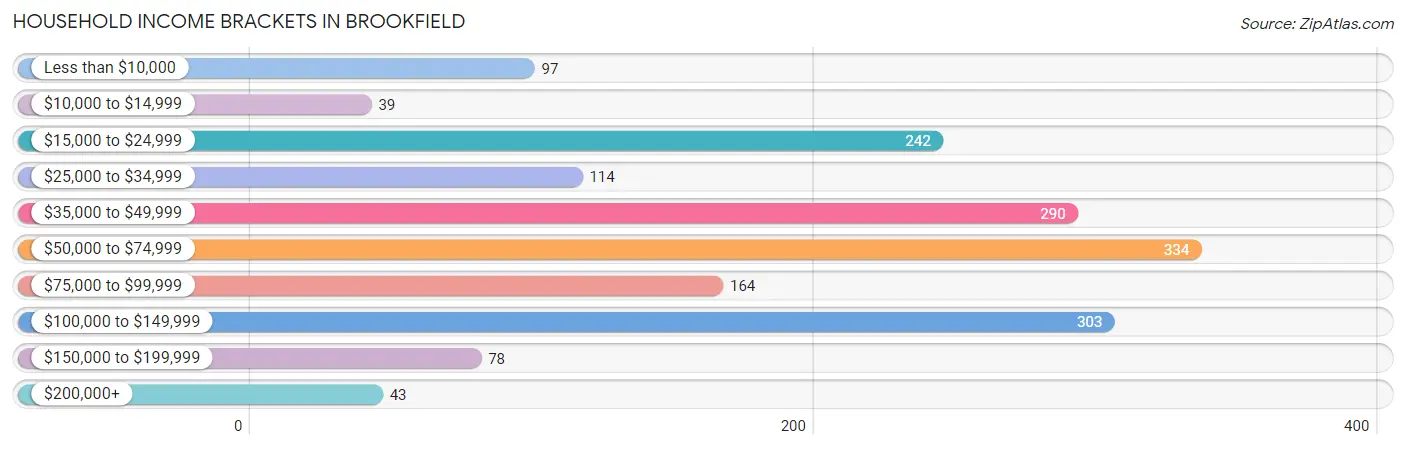
Household Income Brackets in Brookfield
With 334 households falling in the category, the $50,000 to $74,999 income range is the most frequent in Brookfield, accounting for 19.6% of all households. In contrast, only 39 households (2.3%) fall into the $10,000 to $14,999 income bracket, making it the least populous group.
| Income Bracket | # Households | % Households |
| Less than $10,000 | 97 | 5.7% |
| $10,000 to $14,999 | 39 | 2.3% |
| $15,000 to $24,999 | 242 | 14.2% |
| $25,000 to $34,999 | 114 | 6.7% |
| $35,000 to $49,999 | 290 | 17.0% |
| $50,000 to $74,999 | 334 | 19.6% |
| $75,000 to $99,999 | 164 | 9.6% |
| $100,000 to $149,999 | 303 | 17.8% |
| $150,000 to $199,999 | 78 | 4.6% |
| $200,000+ | 43 | 2.5% |
Household Income by Householder Age in Brookfield
The median household income in Brookfield is $53,653, with the highest median household income of $63,319 found in the 25 to 44 years age bracket for the primary householder. A total of 449 households (26.3%) fall into this category. Meanwhile, the 15 to 24 years age bracket for the primary householder has the lowest median household income of $0, with 108 households (6.3%) in this group.
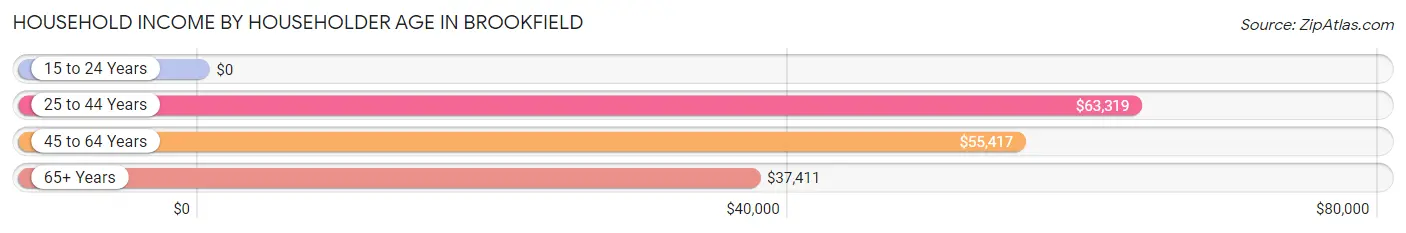
| Income Bracket | # Households | Median Income |
| 15 to 24 Years | 108 (6.3%) | $0 |
| 25 to 44 Years | 449 (26.3%) | $63,319 |
| 45 to 64 Years | 566 (33.2%) | $55,417 |
| 65+ Years | 582 (34.1%) | $37,411 |
| Total | 1,705 (100.0%) | $53,653 |
Poverty in Brookfield
Income Below Poverty by Sex and Age in Brookfield
With 21.1% poverty level for males and 25.1% for females among the residents of Brookfield, under 5 year old males and 5 year old females are the most vulnerable to poverty, with 111 males (79.3%) and 30 females (85.7%) in their respective age groups living below the poverty level.
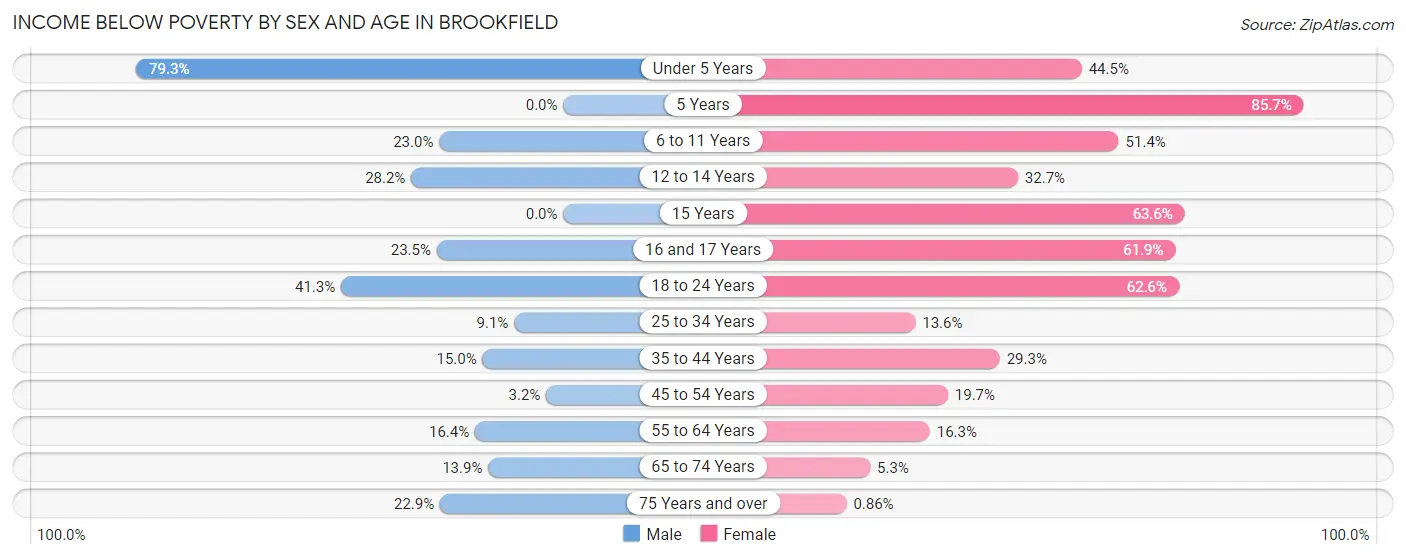
| Age Bracket | Male | Female |
| Under 5 Years | 111 (79.3%) | 53 (44.5%) |
| 5 Years | 0 (0.0%) | 30 (85.7%) |
| 6 to 11 Years | 47 (23.0%) | 37 (51.4%) |
| 12 to 14 Years | 24 (28.2%) | 34 (32.7%) |
| 15 Years | 0 (0.0%) | 28 (63.6%) |
| 16 and 17 Years | 35 (23.5%) | 26 (61.9%) |
| 18 to 24 Years | 26 (41.3%) | 122 (62.6%) |
| 25 to 34 Years | 23 (9.1%) | 39 (13.6%) |
| 35 to 44 Years | 42 (15.0%) | 39 (29.3%) |
| 45 to 54 Years | 6 (3.2%) | 50 (19.7%) |
| 55 to 64 Years | 40 (16.4%) | 41 (16.3%) |
| 65 to 74 Years | 29 (13.9%) | 15 (5.3%) |
| 75 Years and over | 27 (22.9%) | 2 (0.9%) |
| Total | 410 (21.1%) | 516 (25.1%) |
Income Above Poverty by Sex and Age in Brookfield
According to the poverty statistics in Brookfield, males aged 5 years and females aged 75 years and over are the age groups that are most secure financially, with 100.0% of males and 99.1% of females in these age groups living above the poverty line.
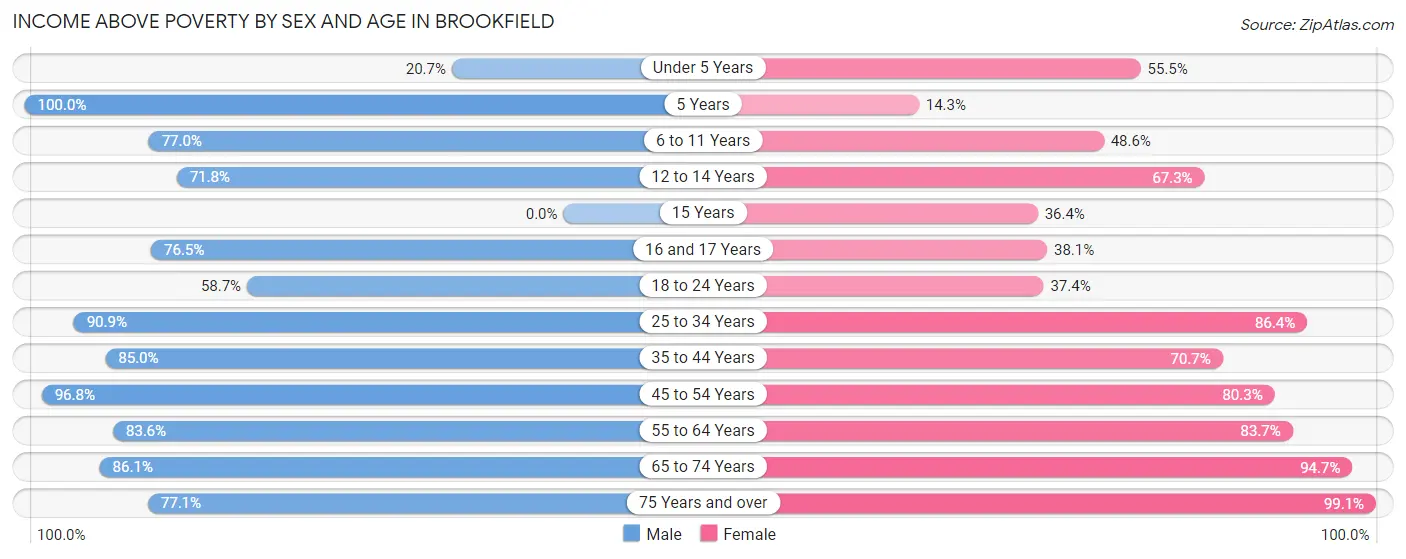
| Age Bracket | Male | Female |
| Under 5 Years | 29 (20.7%) | 66 (55.5%) |
| 5 Years | 11 (100.0%) | 5 (14.3%) |
| 6 to 11 Years | 157 (77.0%) | 35 (48.6%) |
| 12 to 14 Years | 61 (71.8%) | 70 (67.3%) |
| 15 Years | 0 (0.0%) | 16 (36.4%) |
| 16 and 17 Years | 114 (76.5%) | 16 (38.1%) |
| 18 to 24 Years | 37 (58.7%) | 73 (37.4%) |
| 25 to 34 Years | 229 (90.9%) | 247 (86.4%) |
| 35 to 44 Years | 238 (85.0%) | 94 (70.7%) |
| 45 to 54 Years | 182 (96.8%) | 204 (80.3%) |
| 55 to 64 Years | 204 (83.6%) | 210 (83.7%) |
| 65 to 74 Years | 179 (86.1%) | 270 (94.7%) |
| 75 Years and over | 91 (77.1%) | 231 (99.1%) |
| Total | 1,532 (78.9%) | 1,537 (74.9%) |
Income Below Poverty Among Married-Couple Families in Brookfield
The poverty statistics for married-couple families in Brookfield show that 12.5% or 97 of the total 774 families live below the poverty line. Families with 1 or 2 children have the highest poverty rate of 25.5%, comprising of 54 families. On the other hand, families with no children have the lowest poverty rate of 6.1%, which includes 30 families.
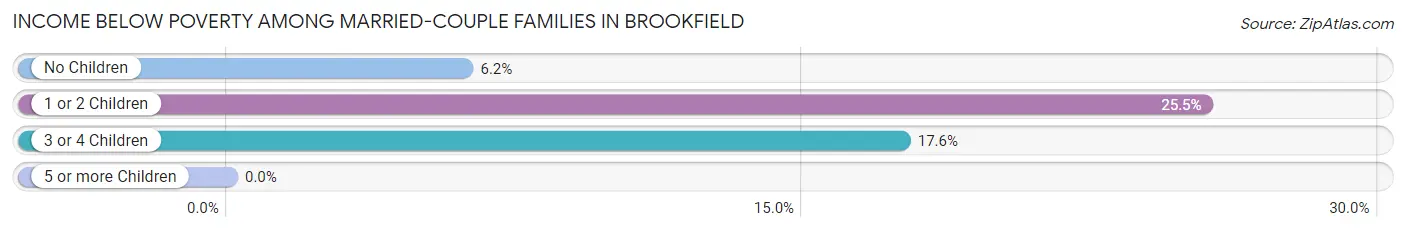
| Children | Above Poverty | Below Poverty |
| No Children | 458 (93.9%) | 30 (6.1%) |
| 1 or 2 Children | 158 (74.5%) | 54 (25.5%) |
| 3 or 4 Children | 61 (82.4%) | 13 (17.6%) |
| 5 or more Children | 0 (0.0%) | 0 (0.0%) |
| Total | 677 (87.5%) | 97 (12.5%) |
Income Below Poverty Among Single-Parent Households in Brookfield
According to the poverty data in Brookfield, 49.2% or 33 single-father households and 48.3% or 85 single-mother households are living below the poverty line. Among single-father households, those with 3 or 4 children have the highest poverty rate, with 13 households (100.0%) experiencing poverty. Likewise, among single-mother households, those with 3 or 4 children have the highest poverty rate, with 68 households (100.0%) falling below the poverty line.
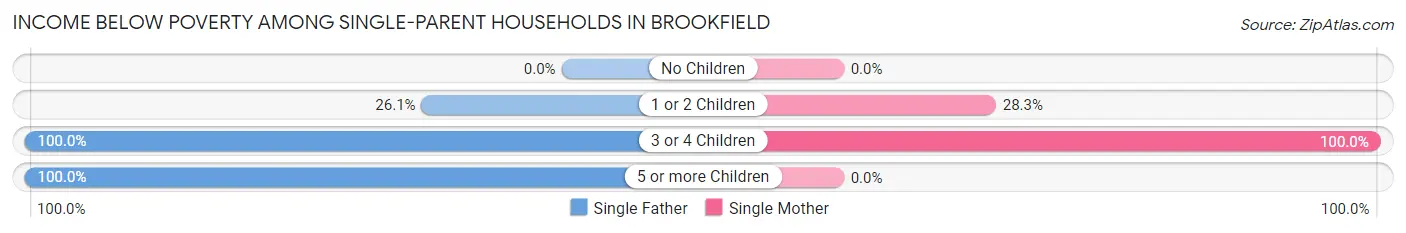
| Children | Single Father | Single Mother |
| No Children | 0 (0.0%) | 0 (0.0%) |
| 1 or 2 Children | 12 (26.1%) | 17 (28.3%) |
| 3 or 4 Children | 13 (100.0%) | 68 (100.0%) |
| 5 or more Children | 8 (100.0%) | 0 (0.0%) |
| Total | 33 (49.2%) | 85 (48.3%) |
Income Below Poverty Among Married-Couple vs Single-Parent Households in Brookfield
The poverty data for Brookfield shows that 97 of the married-couple family households (12.5%) and 118 of the single-parent households (48.6%) are living below the poverty level. Within the married-couple family households, those with 1 or 2 children have the highest poverty rate, with 54 households (25.5%) falling below the poverty line. Among the single-parent households, those with 3 or 4 children have the highest poverty rate, with 81 household (100.0%) living below poverty.
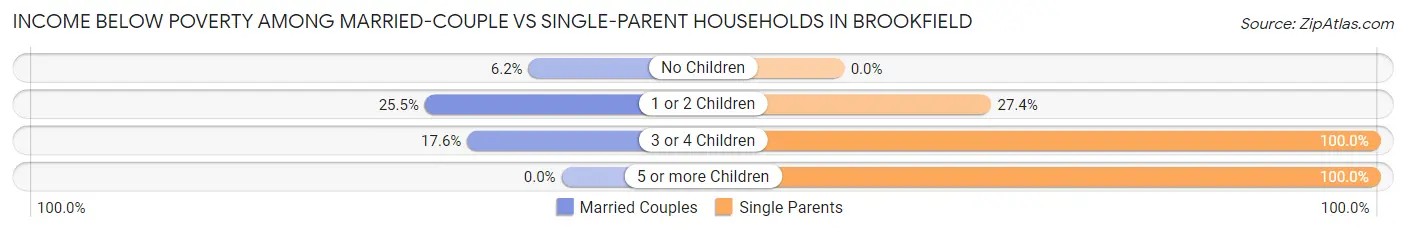
| Children | Married-Couple Families | Single-Parent Households |
| No Children | 30 (6.1%) | 0 (0.0%) |
| 1 or 2 Children | 54 (25.5%) | 29 (27.4%) |
| 3 or 4 Children | 13 (17.6%) | 81 (100.0%) |
| 5 or more Children | 0 (0.0%) | 8 (100.0%) |
| Total | 97 (12.5%) | 118 (48.6%) |
Race in Brookfield
The most populous races in Brookfield are White / Caucasian (3,919 | 94.6%), Hispanic or Latino (105 | 2.5%), and Two or more Races (83 | 2.0%).
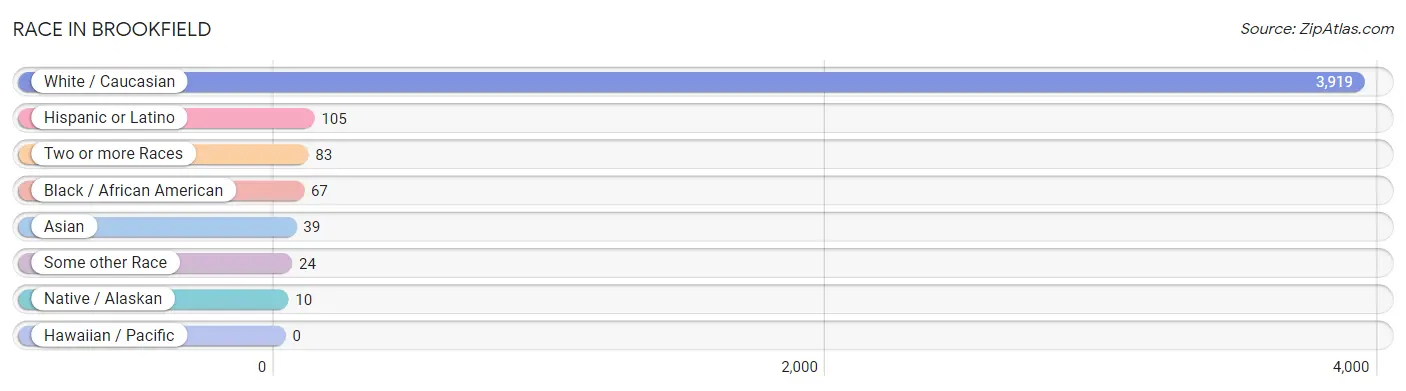
| Race | # Population | % Population |
| Asian | 39 | 0.9% |
| Black / African American | 67 | 1.6% |
| Hawaiian / Pacific | 0 | 0.0% |
| Hispanic or Latino | 105 | 2.5% |
| Native / Alaskan | 10 | 0.2% |
| White / Caucasian | 3,919 | 94.6% |
| Two or more Races | 83 | 2.0% |
| Some other Race | 24 | 0.6% |
| Total | 4,142 | 100.0% |
Ancestry in Brookfield
The most populous ancestries reported in Brookfield are Irish (425 | 10.3%), German (390 | 9.4%), English (370 | 8.9%), American (233 | 5.6%), and European (108 | 2.6%), together accounting for 36.9% of all Brookfield residents.
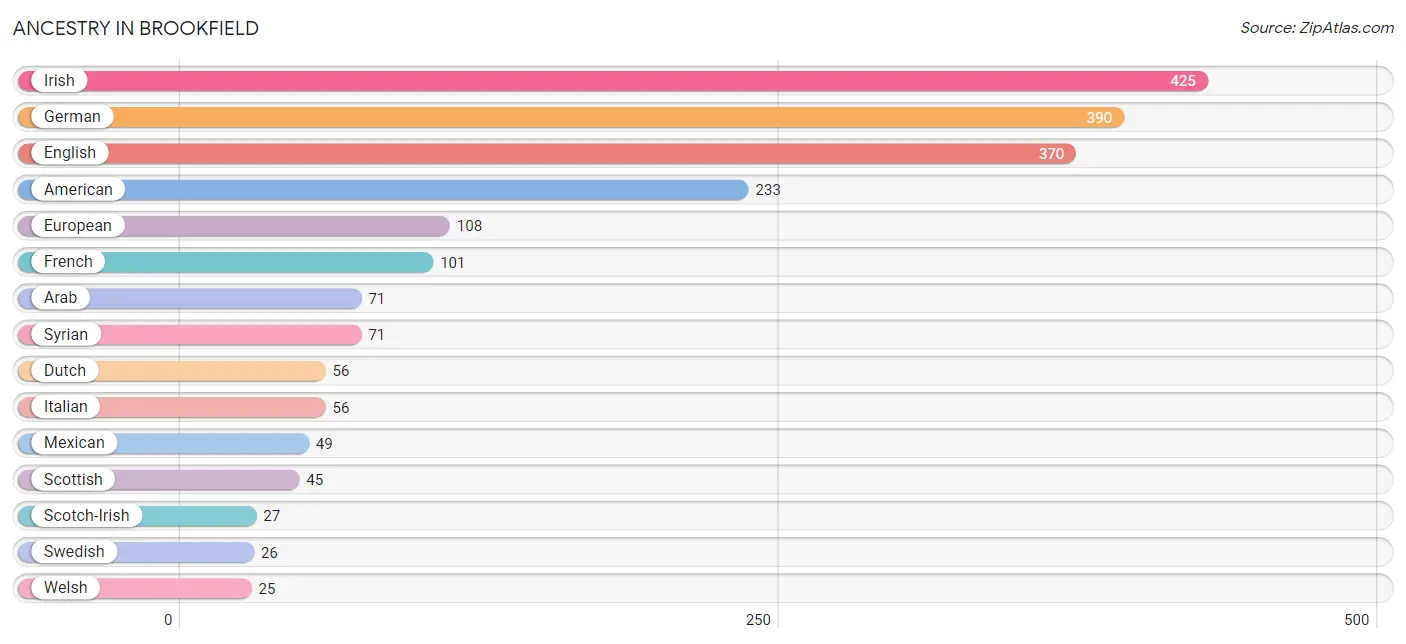
| Ancestry | # Population | % Population |
| American | 233 | 5.6% |
| Arab | 71 | 1.7% |
| Bhutanese | 7 | 0.2% |
| British | 7 | 0.2% |
| Cherokee | 12 | 0.3% |
| Czech | 6 | 0.1% |
| Danish | 13 | 0.3% |
| Dutch | 56 | 1.3% |
| English | 370 | 8.9% |
| European | 108 | 2.6% |
| French | 101 | 2.4% |
| German | 390 | 9.4% |
| Irish | 425 | 10.3% |
| Iroquois | 2 | 0.1% |
| Italian | 56 | 1.3% |
| Korean | 18 | 0.4% |
| Laotian | 22 | 0.5% |
| Mexican | 49 | 1.2% |
| Norwegian | 12 | 0.3% |
| Russian | 11 | 0.3% |
| Scandinavian | 21 | 0.5% |
| Scotch-Irish | 27 | 0.6% |
| Scottish | 45 | 1.1% |
| Sri Lankan | 10 | 0.2% |
| Swedish | 26 | 0.6% |
| Syrian | 71 | 1.7% |
| Welsh | 25 | 0.6% | View All 27 Rows |
Immigrants in Brookfield
The most numerous immigrant groups reported in Brookfield came from Asia (39 | 0.9%), South Eastern Asia (32 | 0.8%), Indonesia (22 | 0.5%), Vietnam (10 | 0.2%), and Eastern Asia (7 | 0.2%), together accounting for 2.6% of all Brookfield residents.
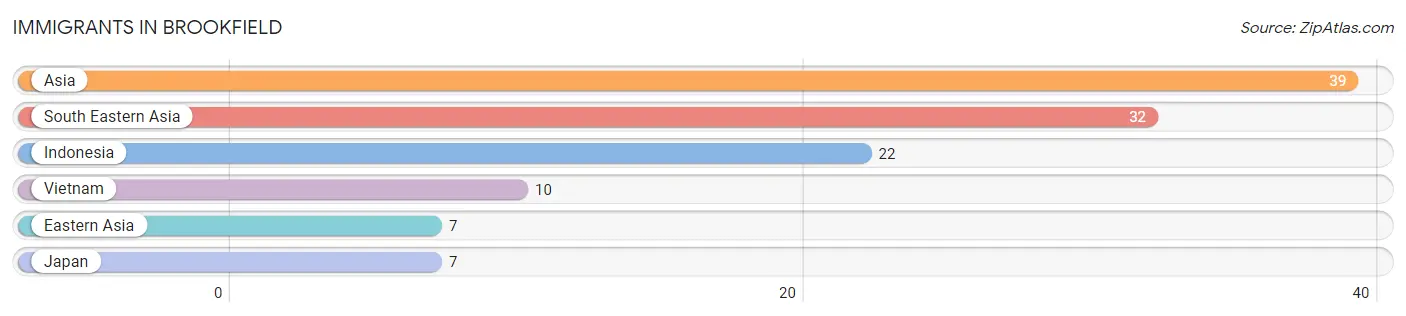
| Immigration Origin | # Population | % Population |
| Asia | 39 | 0.9% |
| Eastern Asia | 7 | 0.2% |
| Indonesia | 22 | 0.5% |
| Japan | 7 | 0.2% |
| South Eastern Asia | 32 | 0.8% |
| Vietnam | 10 | 0.2% | View All 6 Rows |
Sex and Age in Brookfield
Sex and Age in Brookfield
The most populous age groups in Brookfield are 40 to 44 Years (178 | 8.9%) for men and 65 to 69 Years (206 | 9.6%) for women.
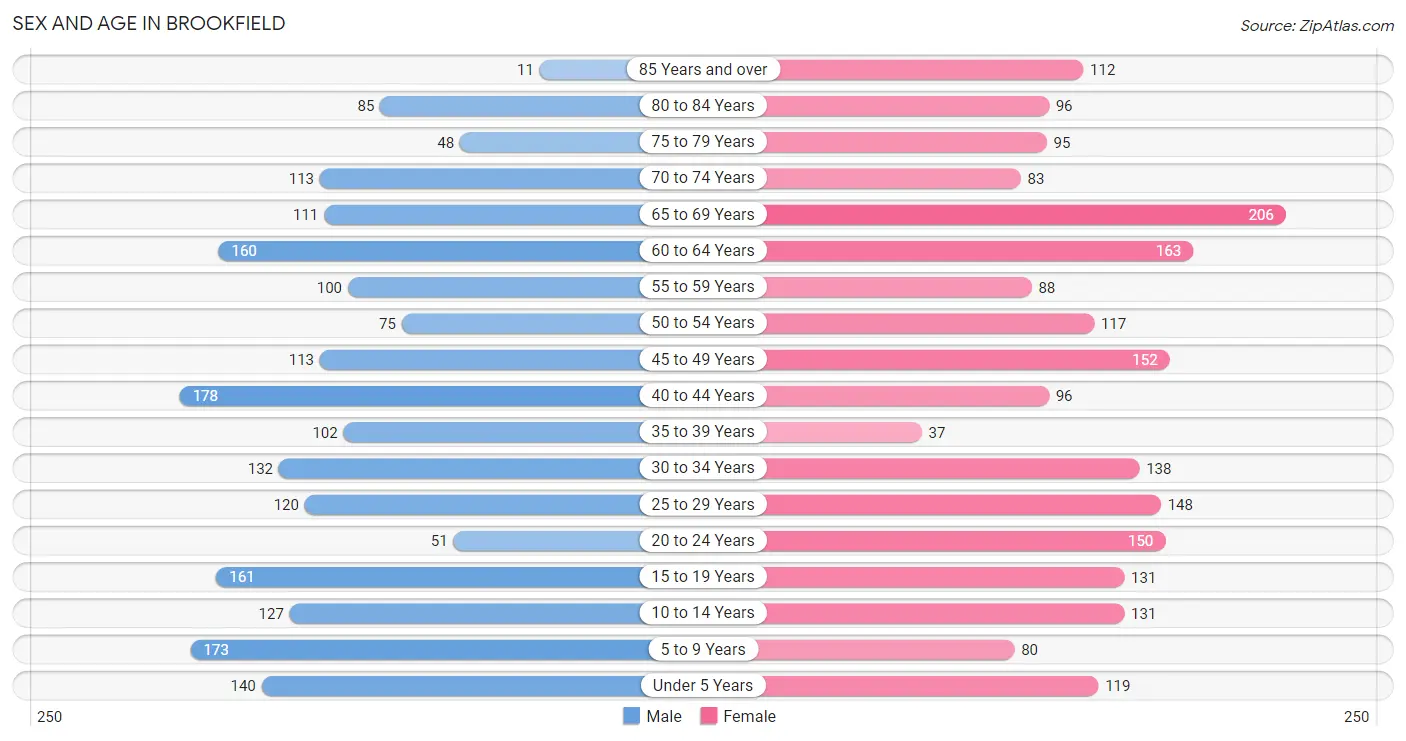
| Age Bracket | Male | Female |
| Under 5 Years | 140 (7.0%) | 119 (5.6%) |
| 5 to 9 Years | 173 (8.6%) | 80 (3.7%) |
| 10 to 14 Years | 127 (6.4%) | 131 (6.1%) |
| 15 to 19 Years | 161 (8.1%) | 131 (6.1%) |
| 20 to 24 Years | 51 (2.5%) | 150 (7.0%) |
| 25 to 29 Years | 120 (6.0%) | 148 (6.9%) |
| 30 to 34 Years | 132 (6.6%) | 138 (6.4%) |
| 35 to 39 Years | 102 (5.1%) | 37 (1.7%) |
| 40 to 44 Years | 178 (8.9%) | 96 (4.5%) |
| 45 to 49 Years | 113 (5.7%) | 152 (7.1%) |
| 50 to 54 Years | 75 (3.7%) | 117 (5.5%) |
| 55 to 59 Years | 100 (5.0%) | 88 (4.1%) |
| 60 to 64 Years | 160 (8.0%) | 163 (7.6%) |
| 65 to 69 Years | 111 (5.6%) | 206 (9.6%) |
| 70 to 74 Years | 113 (5.7%) | 83 (3.9%) |
| 75 to 79 Years | 48 (2.4%) | 95 (4.4%) |
| 80 to 84 Years | 85 (4.3%) | 96 (4.5%) |
| 85 Years and over | 11 (0.5%) | 112 (5.2%) |
| Total | 2,000 (100.0%) | 2,142 (100.0%) |
Families and Households in Brookfield
Median Family Size in Brookfield
The median family size in Brookfield is 2.98 persons per family, with single male/father families (67 | 6.6%) accounting for the largest median family size of 4.13 persons per family. On the other hand, single female/mother families (176 | 17.3%) represent the smallest median family size with 2.74 persons per family.
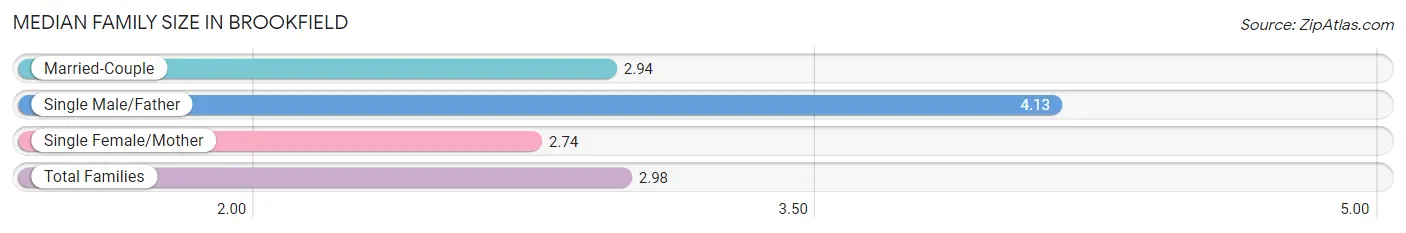
| Family Type | # Families | Family Size |
| Married-Couple | 774 (76.1%) | 2.94 |
| Single Male/Father | 67 (6.6%) | 4.13 |
| Single Female/Mother | 176 (17.3%) | 2.74 |
| Total Families | 1,017 (100.0%) | 2.98 |
Median Household Size in Brookfield
The median household size in Brookfield is 2.34 persons per household, with single male/father households (67 | 3.9%) accounting for the largest median household size of 4.66 persons per household. non-family households (688 | 40.4%) represent the smallest median household size with 1.22 persons per household.
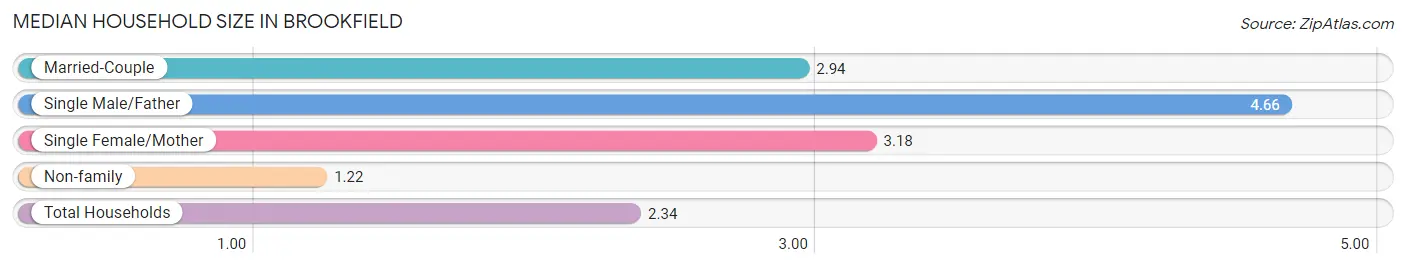
| Household Type | # Households | Household Size |
| Married-Couple | 774 (45.4%) | 2.94 |
| Single Male/Father | 67 (3.9%) | 4.66 |
| Single Female/Mother | 176 (10.3%) | 3.18 |
| Non-family | 688 (40.4%) | 1.22 |
| Total Households | 1,705 (100.0%) | 2.34 |
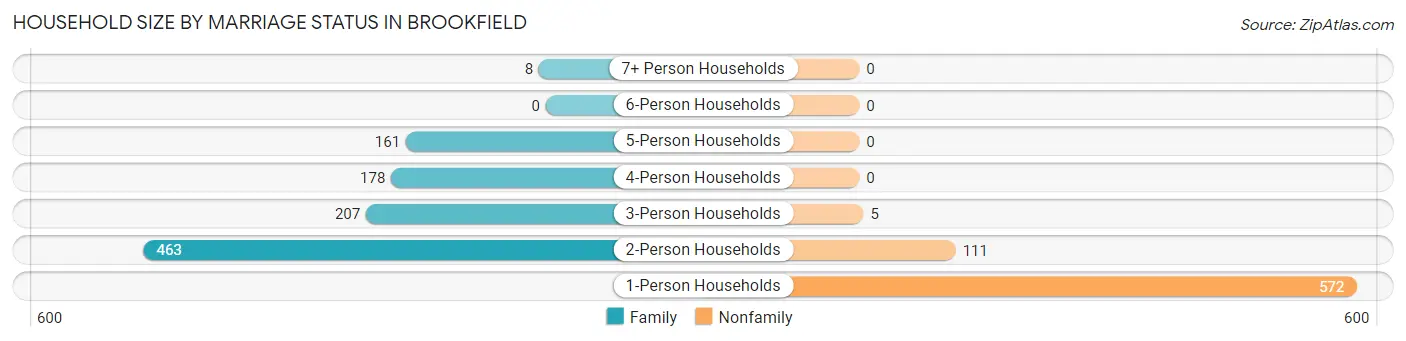
Household Size by Marriage Status in Brookfield
Out of a total of 1,705 households in Brookfield, 1,017 (59.7%) are family households, while 688 (40.4%) are nonfamily households. The most numerous type of family households are 2-person households, comprising 463, and the most common type of nonfamily households are 1-person households, comprising 572.
| Household Size | Family Households | Nonfamily Households |
| 1-Person Households | - | 572 (33.6%) |
| 2-Person Households | 463 (27.2%) | 111 (6.5%) |
| 3-Person Households | 207 (12.1%) | 5 (0.3%) |
| 4-Person Households | 178 (10.4%) | 0 (0.0%) |
| 5-Person Households | 161 (9.4%) | 0 (0.0%) |
| 6-Person Households | 0 (0.0%) | 0 (0.0%) |
| 7+ Person Households | 8 (0.5%) | 0 (0.0%) |
| Total | 1,017 (59.7%) | 688 (40.4%) |
Female Fertility in Brookfield
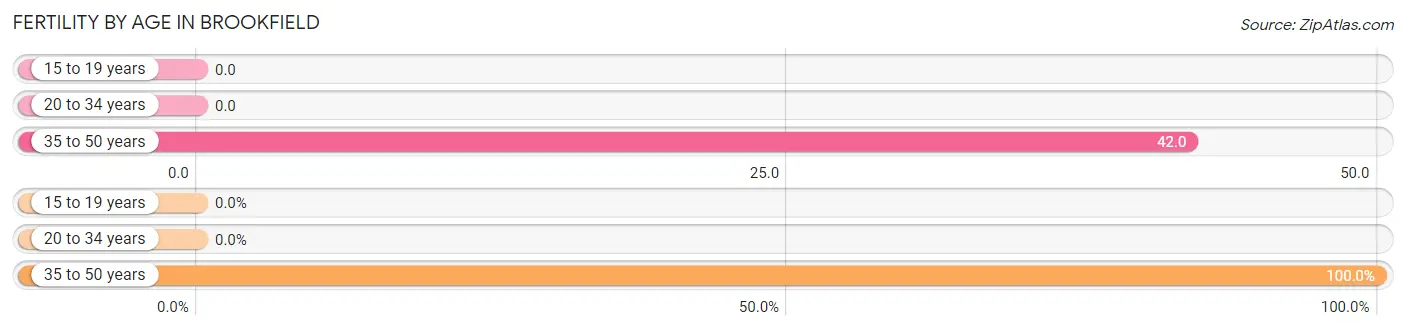
Fertility by Age in Brookfield
Average fertility rate in Brookfield is 14.0 births per 1,000 women. Women in the age bracket of 35 to 50 years have the highest fertility rate with 42.0 births per 1,000 women. Women in the age bracket of 35 to 50 years acount for 100.0% of all women with births.
| Age Bracket | Women with Births | Births / 1,000 Women |
| 15 to 19 years | 0 (0.0%) | 0.0 |
| 20 to 34 years | 0 (0.0%) | 0.0 |
| 35 to 50 years | 12 (100.0%) | 42.0 |
| Total | 12 (100.0%) | 14.0 |
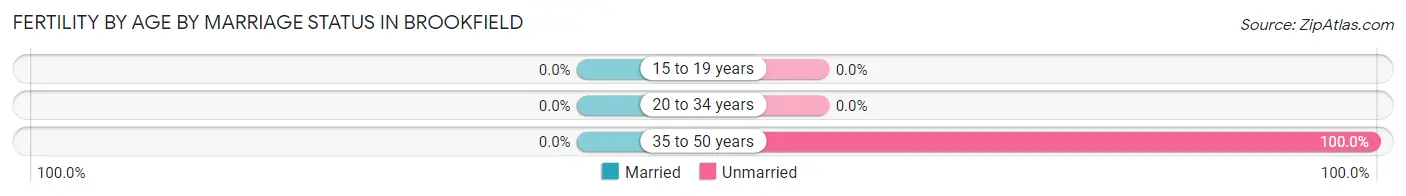
Fertility by Age by Marriage Status in Brookfield
| Age Bracket | Married | Unmarried |
| 15 to 19 years | 0 (0.0%) | 0 (0.0%) |
| 20 to 34 years | 0 (0.0%) | 0 (0.0%) |
| 35 to 50 years | 0 (0.0%) | 12 (100.0%) |
| Total | 0 (0.0%) | 12 (100.0%) |
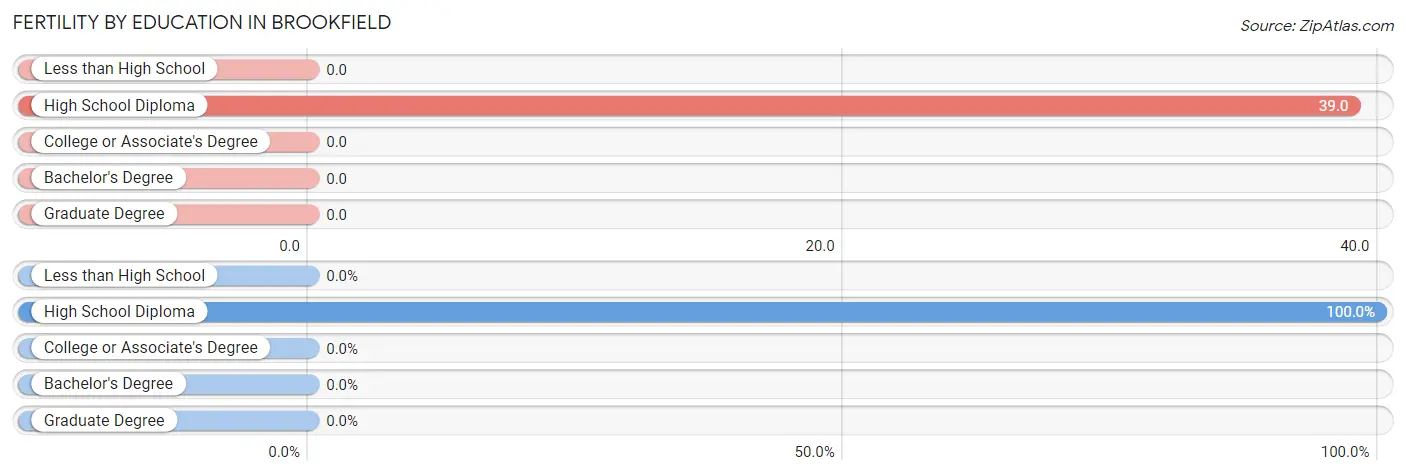
Fertility by Education in Brookfield
| Educational Attainment | Women with Births | Births / 1,000 Women |
| Less than High School | 0 (0.0%) | 0.0 |
| High School Diploma | 12 (100.0%) | 39.0 |
| College or Associate's Degree | 0 (0.0%) | 0.0 |
| Bachelor's Degree | 0 (0.0%) | 0.0 |
| Graduate Degree | 0 (0.0%) | 0.0 |
| Total | 12 (100.0%) | 14.0 |
Fertility by Education by Marriage Status in Brookfield
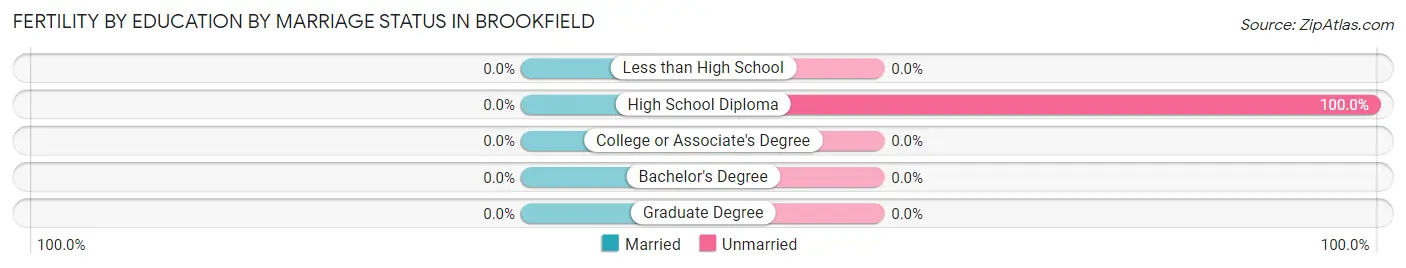
| Educational Attainment | Married | Unmarried |
| Less than High School | 0 (0.0%) | 0 (0.0%) |
| High School Diploma | 0 (0.0%) | 12 (100.0%) |
| College or Associate's Degree | 0 (0.0%) | 0 (0.0%) |
| Bachelor's Degree | 0 (0.0%) | 0 (0.0%) |
| Graduate Degree | 0 (0.0%) | 0 (0.0%) |
| Total | 0 (0.0%) | 12 (100.0%) |
Employment Characteristics in Brookfield
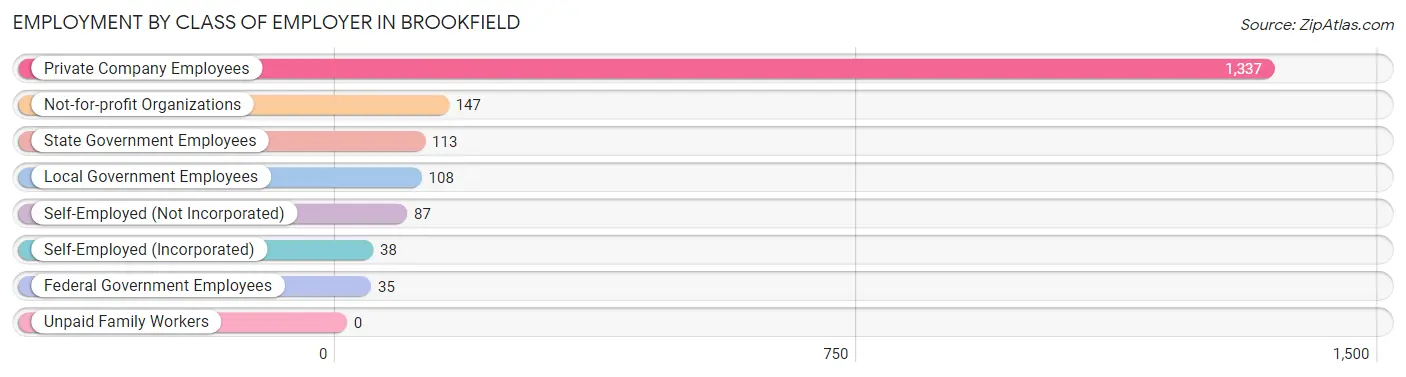
Employment by Class of Employer in Brookfield
Among the 1,865 employed individuals in Brookfield, private company employees (1,337 | 71.7%), not-for-profit organizations (147 | 7.9%), and state government employees (113 | 6.1%) make up the most common classes of employment.
| Employer Class | # Employees | % Employees |
| Private Company Employees | 1,337 | 71.7% |
| Self-Employed (Incorporated) | 38 | 2.0% |
| Self-Employed (Not Incorporated) | 87 | 4.7% |
| Not-for-profit Organizations | 147 | 7.9% |
| Local Government Employees | 108 | 5.8% |
| State Government Employees | 113 | 6.1% |
| Federal Government Employees | 35 | 1.9% |
| Unpaid Family Workers | 0 | 0.0% |
| Total | 1,865 | 100.0% |
Employment Status by Age in Brookfield
According to the labor force statistics for Brookfield, out of the total population over 16 years of age (3,328), 57.6% or 1,917 individuals are in the labor force, with 2.7% or 52 of them unemployed. The age group with the highest labor force participation rate is 35 to 44 years, with 91.8% or 379 individuals in the labor force. Within the labor force, the 35 to 44 years age range has the highest percentage of unemployed individuals, with 9.5% or 36 of them being unemployed.
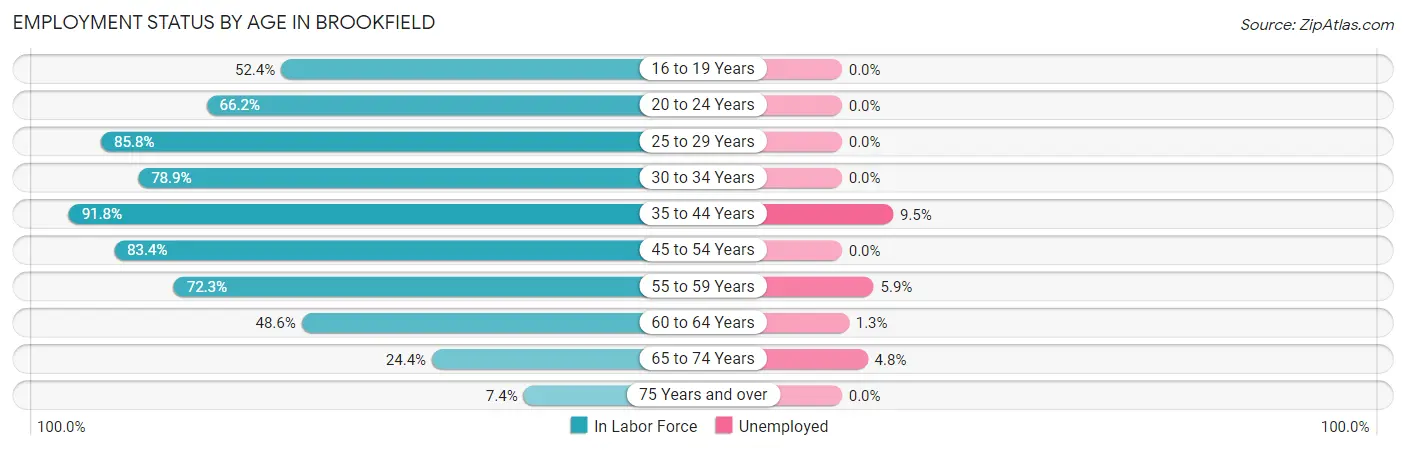
| Age Bracket | In Labor Force | Unemployed |
| 16 to 19 Years | 130 (52.4%) | 0 (0.0%) |
| 20 to 24 Years | 133 (66.2%) | 0 (0.0%) |
| 25 to 29 Years | 230 (85.8%) | 0 (0.0%) |
| 30 to 34 Years | 213 (78.9%) | 0 (0.0%) |
| 35 to 44 Years | 379 (91.8%) | 36 (9.5%) |
| 45 to 54 Years | 381 (83.4%) | 0 (0.0%) |
| 55 to 59 Years | 136 (72.3%) | 8 (5.9%) |
| 60 to 64 Years | 157 (48.6%) | 2 (1.3%) |
| 65 to 74 Years | 125 (24.4%) | 6 (4.8%) |
| 75 Years and over | 33 (7.4%) | 0 (0.0%) |
| Total | 1,917 (57.6%) | 52 (2.7%) |
Employment Status by Educational Attainment in Brookfield
According to labor force statistics for Brookfield, 78.0% of individuals (1,497) out of the total population between 25 and 64 years of age (1,919) are in the labor force, with 3.1% or 46 of them being unemployed. The group with the highest labor force participation rate are those with the educational attainment of college / associate degree, with 85.9% or 439 individuals in the labor force. Within the labor force, individuals with high school diploma education have the highest percentage of unemployment, with 6.3% or 38 of them being unemployed.
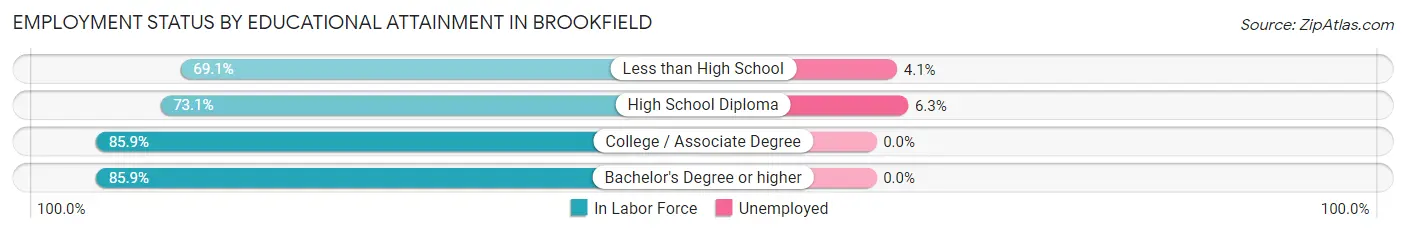
| Educational Attainment | In Labor Force | Unemployed |
| Less than High School | 197 (69.1%) | 12 (4.1%) |
| High School Diploma | 599 (73.1%) | 52 (6.3%) |
| College / Associate Degree | 439 (85.9%) | 0 (0.0%) |
| Bachelor's Degree or higher | 261 (85.9%) | 0 (0.0%) |
| Total | 1,497 (78.0%) | 59 (3.1%) |
Employment Occupations by Sex in Brookfield
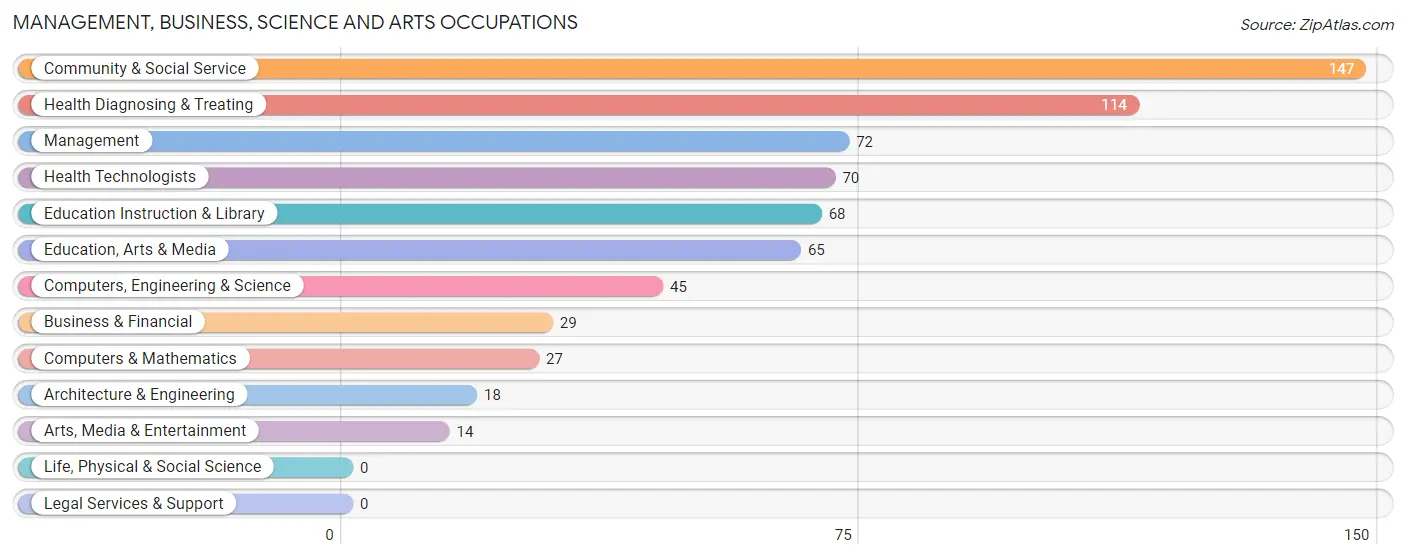
Management, Business, Science and Arts Occupations
The most common Management, Business, Science and Arts occupations in Brookfield are Community & Social Service (147 | 7.9%), Health Diagnosing & Treating (114 | 6.1%), Management (72 | 3.9%), Health Technologists (70 | 3.7%), and Education Instruction & Library (68 | 3.6%).
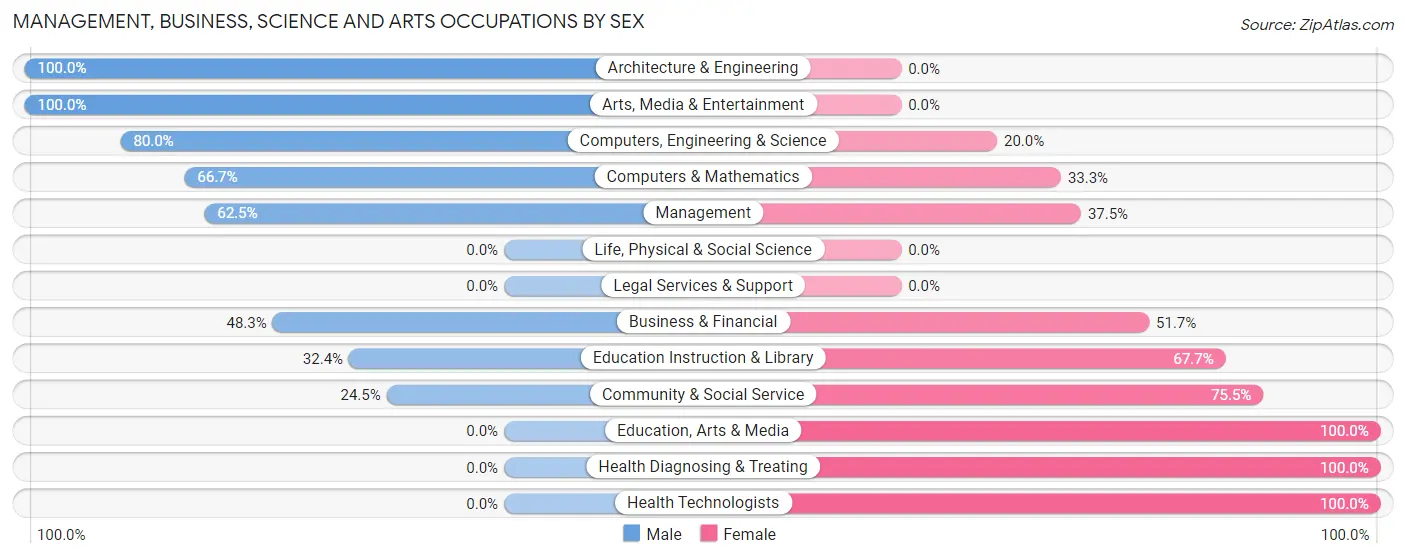
Management, Business, Science and Arts Occupations by Sex
Within the Management, Business, Science and Arts occupations in Brookfield, the most male-oriented occupations are Architecture & Engineering (100.0%), Arts, Media & Entertainment (100.0%), and Computers, Engineering & Science (80.0%), while the most female-oriented occupations are Education, Arts & Media (100.0%), Health Diagnosing & Treating (100.0%), and Health Technologists (100.0%).
| Occupation | Male | Female |
| Management | 45 (62.5%) | 27 (37.5%) |
| Business & Financial | 14 (48.3%) | 15 (51.7%) |
| Computers, Engineering & Science | 36 (80.0%) | 9 (20.0%) |
| Computers & Mathematics | 18 (66.7%) | 9 (33.3%) |
| Architecture & Engineering | 18 (100.0%) | 0 (0.0%) |
| Life, Physical & Social Science | 0 (0.0%) | 0 (0.0%) |
| Community & Social Service | 36 (24.5%) | 111 (75.5%) |
| Education, Arts & Media | 0 (0.0%) | 65 (100.0%) |
| Legal Services & Support | 0 (0.0%) | 0 (0.0%) |
| Education Instruction & Library | 22 (32.4%) | 46 (67.6%) |
| Arts, Media & Entertainment | 14 (100.0%) | 0 (0.0%) |
| Health Diagnosing & Treating | 0 (0.0%) | 114 (100.0%) |
| Health Technologists | 0 (0.0%) | 70 (100.0%) |
| Total (Category) | 131 (32.2%) | 276 (67.8%) |
| Total (Overall) | 938 (50.3%) | 927 (49.7%) |
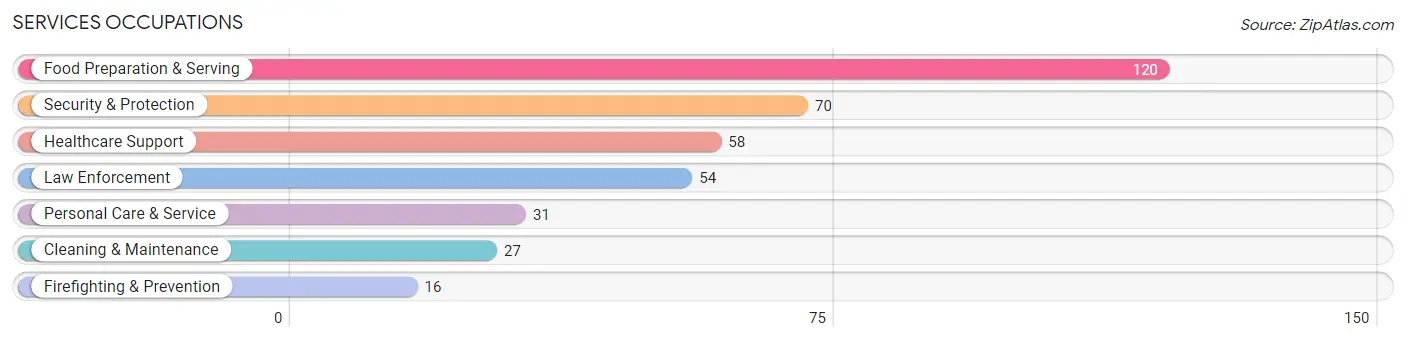
Services Occupations
The most common Services occupations in Brookfield are Food Preparation & Serving (120 | 6.4%), Security & Protection (70 | 3.7%), Healthcare Support (58 | 3.1%), Law Enforcement (54 | 2.9%), and Personal Care & Service (31 | 1.7%).
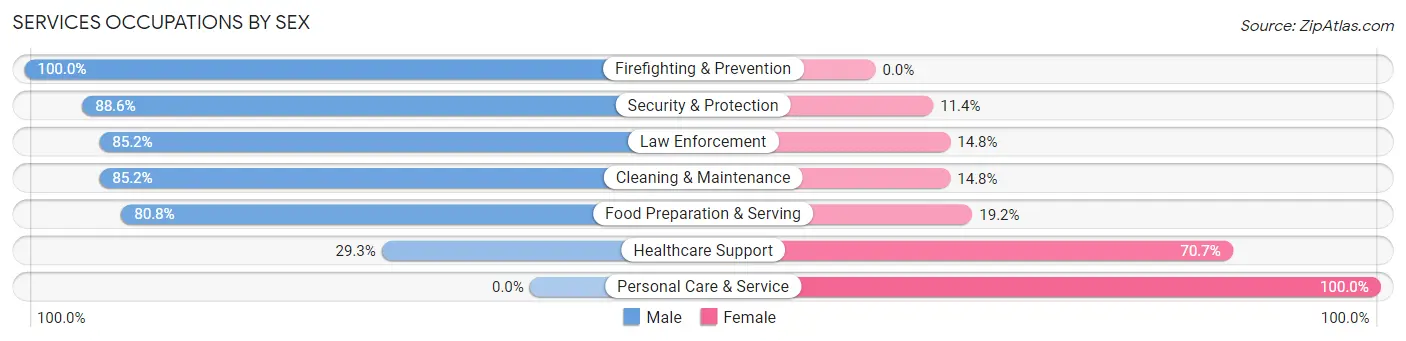
Services Occupations by Sex
Within the Services occupations in Brookfield, the most male-oriented occupations are Firefighting & Prevention (100.0%), Security & Protection (88.6%), and Law Enforcement (85.2%), while the most female-oriented occupations are Personal Care & Service (100.0%), Healthcare Support (70.7%), and Food Preparation & Serving (19.2%).
| Occupation | Male | Female |
| Healthcare Support | 17 (29.3%) | 41 (70.7%) |
| Security & Protection | 62 (88.6%) | 8 (11.4%) |
| Firefighting & Prevention | 16 (100.0%) | 0 (0.0%) |
| Law Enforcement | 46 (85.2%) | 8 (14.8%) |
| Food Preparation & Serving | 97 (80.8%) | 23 (19.2%) |
| Cleaning & Maintenance | 23 (85.2%) | 4 (14.8%) |
| Personal Care & Service | 0 (0.0%) | 31 (100.0%) |
| Total (Category) | 199 (65.0%) | 107 (35.0%) |
| Total (Overall) | 938 (50.3%) | 927 (49.7%) |
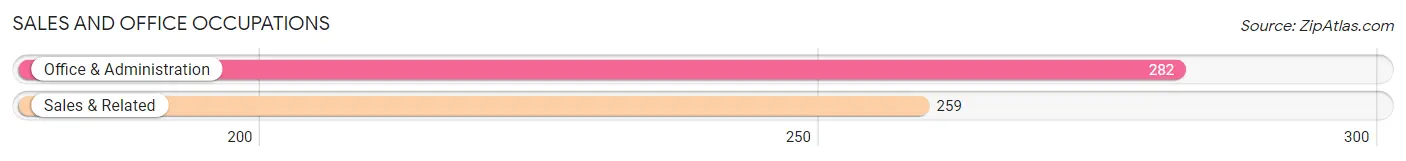
Sales and Office Occupations
The most common Sales and Office occupations in Brookfield are Office & Administration (282 | 15.1%), and Sales & Related (259 | 13.9%).
Sales and Office Occupations by Sex
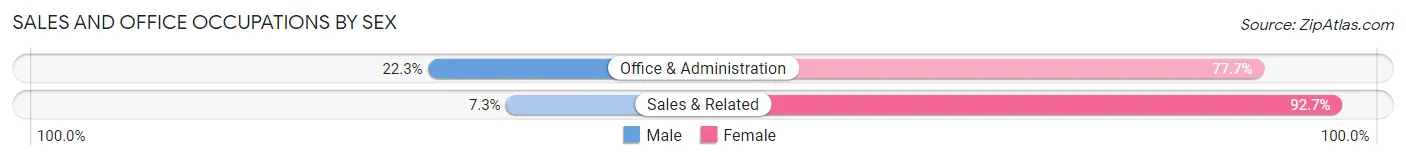
| Occupation | Male | Female |
| Sales & Related | 19 (7.3%) | 240 (92.7%) |
| Office & Administration | 63 (22.3%) | 219 (77.7%) |
| Total (Category) | 82 (15.2%) | 459 (84.8%) |
| Total (Overall) | 938 (50.3%) | 927 (49.7%) |
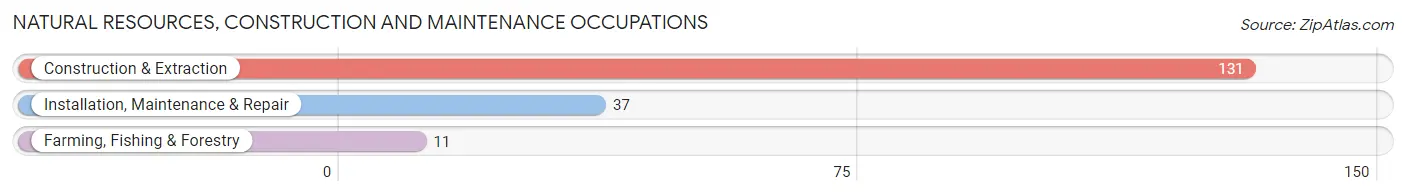
Natural Resources, Construction and Maintenance Occupations
The most common Natural Resources, Construction and Maintenance occupations in Brookfield are Construction & Extraction (131 | 7.0%), Installation, Maintenance & Repair (37 | 2.0%), and Farming, Fishing & Forestry (11 | 0.6%).
Natural Resources, Construction and Maintenance Occupations by Sex
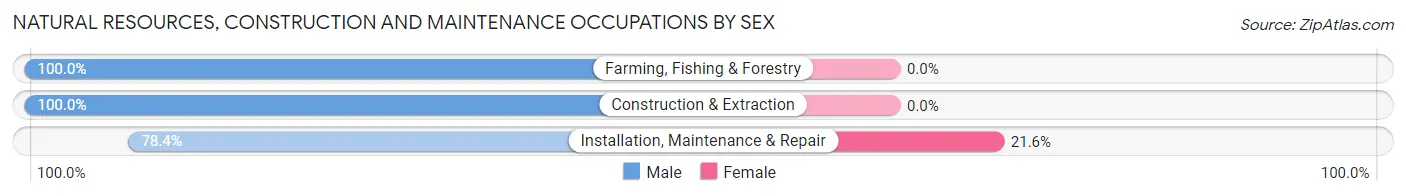
| Occupation | Male | Female |
| Farming, Fishing & Forestry | 11 (100.0%) | 0 (0.0%) |
| Construction & Extraction | 131 (100.0%) | 0 (0.0%) |
| Installation, Maintenance & Repair | 29 (78.4%) | 8 (21.6%) |
| Total (Category) | 171 (95.5%) | 8 (4.5%) |
| Total (Overall) | 938 (50.3%) | 927 (49.7%) |
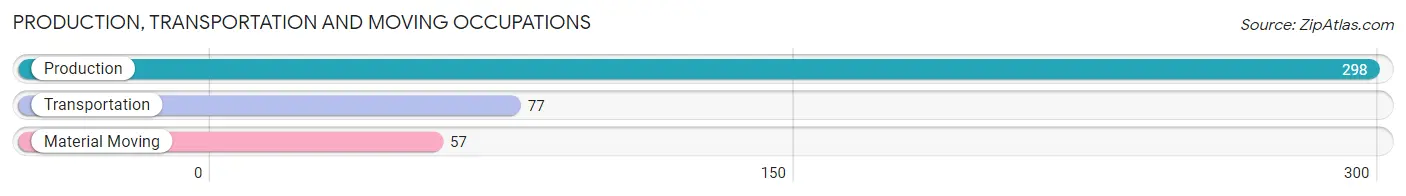
Production, Transportation and Moving Occupations
The most common Production, Transportation and Moving occupations in Brookfield are Production (298 | 16.0%), Transportation (77 | 4.1%), and Material Moving (57 | 3.1%).
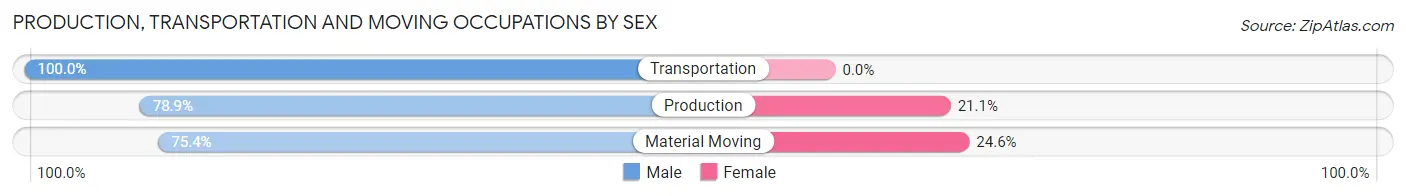
Production, Transportation and Moving Occupations by Sex
| Occupation | Male | Female |
| Production | 235 (78.9%) | 63 (21.1%) |
| Transportation | 77 (100.0%) | 0 (0.0%) |
| Material Moving | 43 (75.4%) | 14 (24.6%) |
| Total (Category) | 355 (82.2%) | 77 (17.8%) |
| Total (Overall) | 938 (50.3%) | 927 (49.7%) |
Employment Industries by Sex in Brookfield
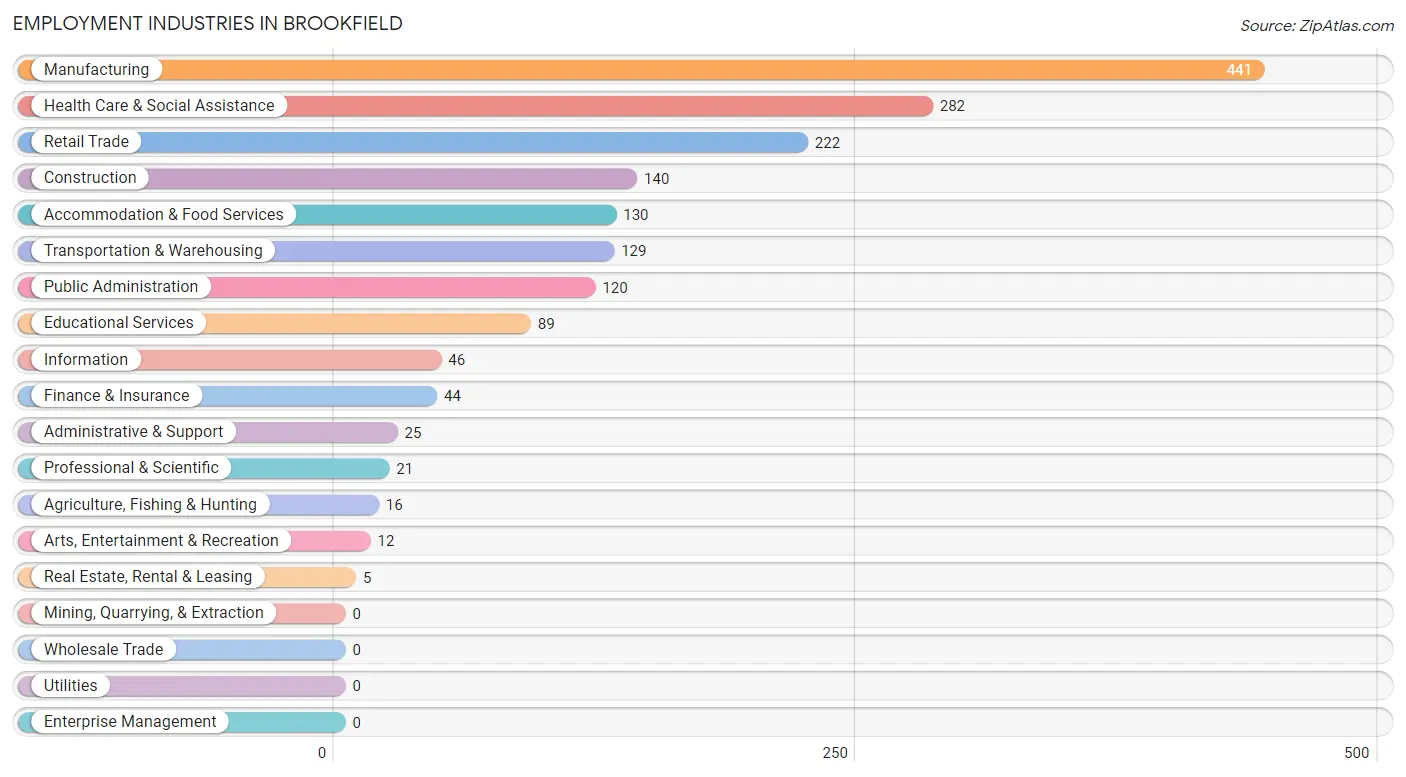
Employment Industries in Brookfield
The major employment industries in Brookfield include Manufacturing (441 | 23.6%), Health Care & Social Assistance (282 | 15.1%), Retail Trade (222 | 11.9%), Construction (140 | 7.5%), and Accommodation & Food Services (130 | 7.0%).
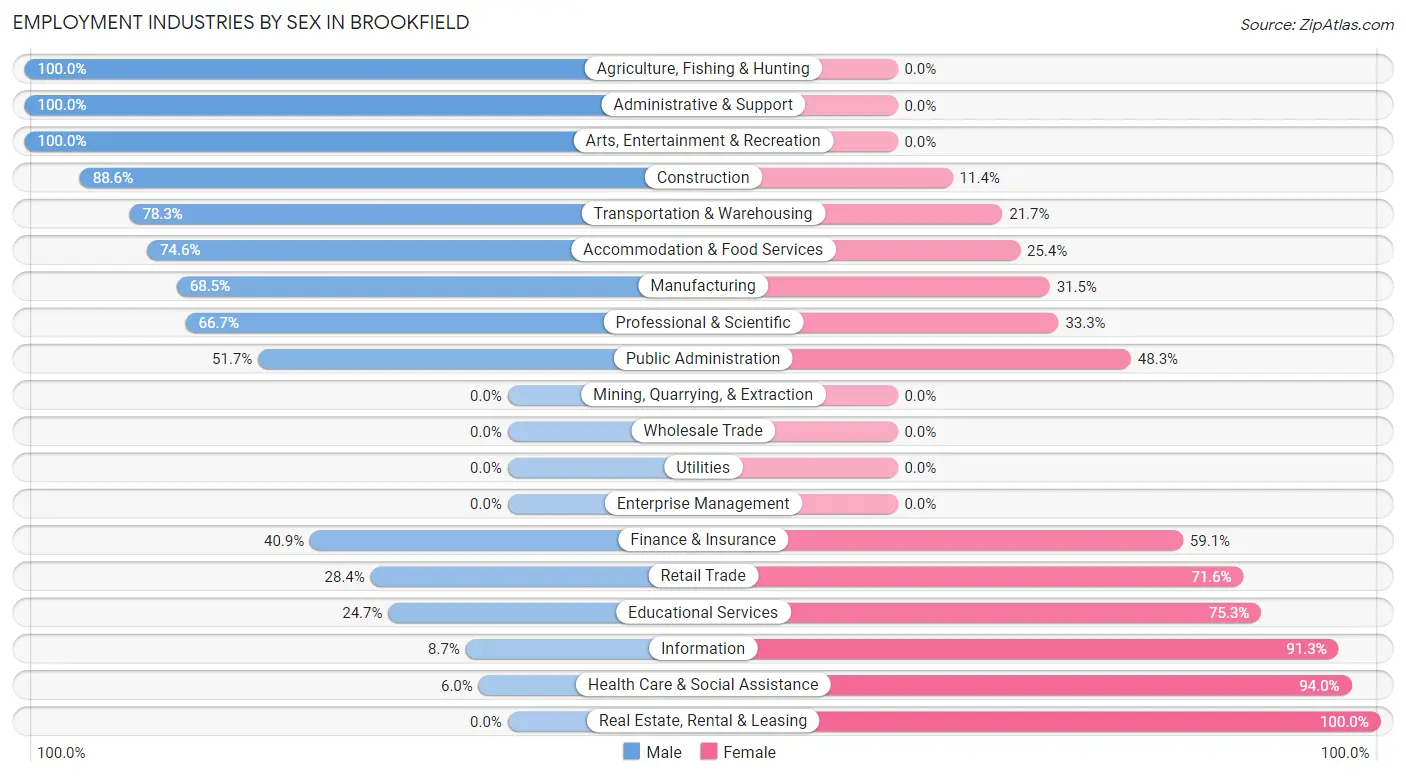
Employment Industries by Sex in Brookfield
The Brookfield industries that see more men than women are Agriculture, Fishing & Hunting (100.0%), Administrative & Support (100.0%), and Arts, Entertainment & Recreation (100.0%), whereas the industries that tend to have a higher number of women are Real Estate, Rental & Leasing (100.0%), Health Care & Social Assistance (94.0%), and Information (91.3%).
| Industry | Male | Female |
| Agriculture, Fishing & Hunting | 16 (100.0%) | 0 (0.0%) |
| Mining, Quarrying, & Extraction | 0 (0.0%) | 0 (0.0%) |
| Construction | 124 (88.6%) | 16 (11.4%) |
| Manufacturing | 302 (68.5%) | 139 (31.5%) |
| Wholesale Trade | 0 (0.0%) | 0 (0.0%) |
| Retail Trade | 63 (28.4%) | 159 (71.6%) |
| Transportation & Warehousing | 101 (78.3%) | 28 (21.7%) |
| Utilities | 0 (0.0%) | 0 (0.0%) |
| Information | 4 (8.7%) | 42 (91.3%) |
| Finance & Insurance | 18 (40.9%) | 26 (59.1%) |
| Real Estate, Rental & Leasing | 0 (0.0%) | 5 (100.0%) |
| Professional & Scientific | 14 (66.7%) | 7 (33.3%) |
| Enterprise Management | 0 (0.0%) | 0 (0.0%) |
| Administrative & Support | 25 (100.0%) | 0 (0.0%) |
| Educational Services | 22 (24.7%) | 67 (75.3%) |
| Health Care & Social Assistance | 17 (6.0%) | 265 (94.0%) |
| Arts, Entertainment & Recreation | 12 (100.0%) | 0 (0.0%) |
| Accommodation & Food Services | 97 (74.6%) | 33 (25.4%) |
| Public Administration | 62 (51.7%) | 58 (48.3%) |
| Total | 938 (50.3%) | 927 (49.7%) |
Education in Brookfield
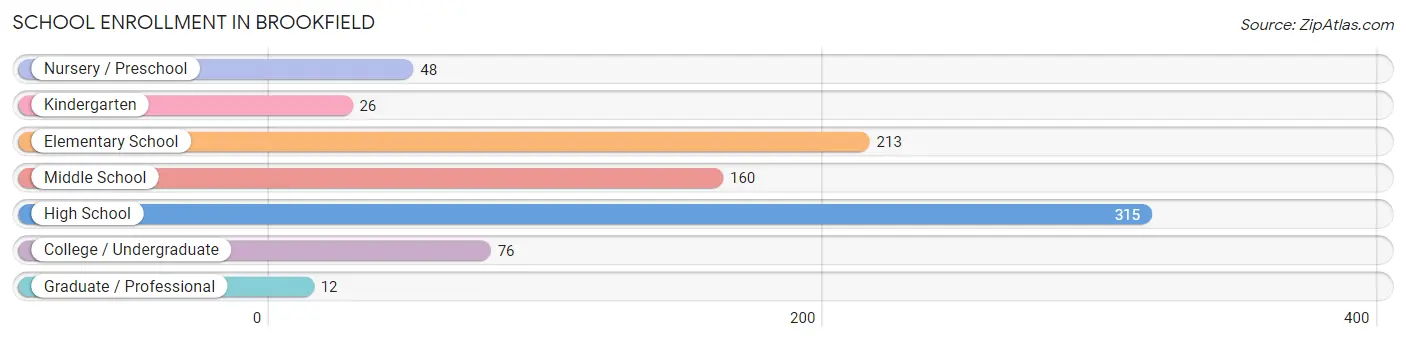
School Enrollment in Brookfield
The most common levels of schooling among the 850 students in Brookfield are high school (315 | 37.1%), elementary school (213 | 25.1%), and middle school (160 | 18.8%).
| School Level | # Students | % Students |
| Nursery / Preschool | 48 | 5.7% |
| Kindergarten | 26 | 3.1% |
| Elementary School | 213 | 25.1% |
| Middle School | 160 | 18.8% |
| High School | 315 | 37.1% |
| College / Undergraduate | 76 | 8.9% |
| Graduate / Professional | 12 | 1.4% |
| Total | 850 | 100.0% |
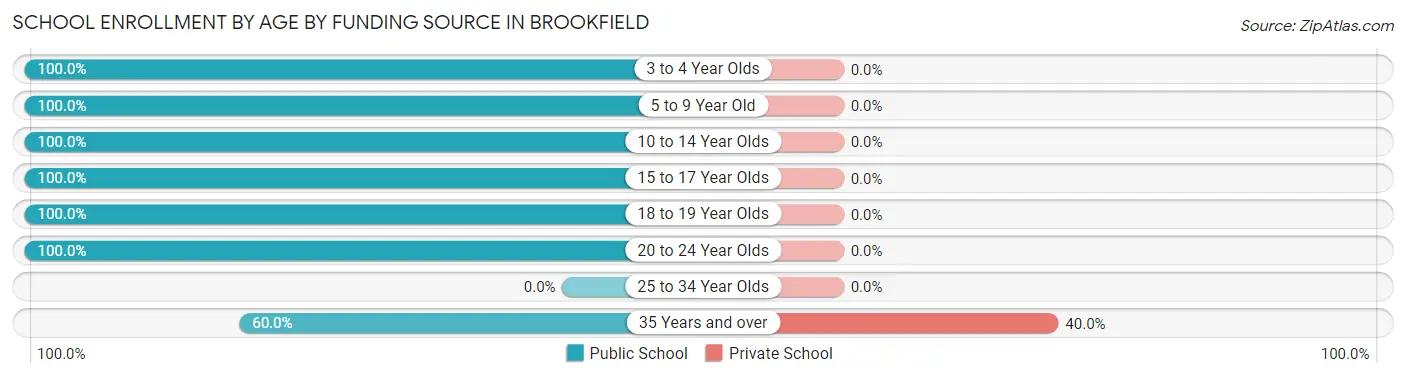
School Enrollment by Age by Funding Source in Brookfield
Out of a total of 850 students who are enrolled in schools in Brookfield, 12 (1.4%) attend a private institution, while the remaining 838 (98.6%) are enrolled in public schools. The age group of 35 years and over has the highest likelihood of being enrolled in private schools, with 12 (40.0% in the age bracket) enrolled. Conversely, the age group of 3 to 4 year olds has the lowest likelihood of being enrolled in a private school, with 48 (100.0% in the age bracket) attending a public institution.
| Age Bracket | Public School | Private School |
| 3 to 4 Year Olds | 48 (100.0%) | 0 (0.0%) |
| 5 to 9 Year Old | 248 (100.0%) | 0 (0.0%) |
| 10 to 14 Year Olds | 212 (100.0%) | 0 (0.0%) |
| 15 to 17 Year Olds | 235 (100.0%) | 0 (0.0%) |
| 18 to 19 Year Olds | 57 (100.0%) | 0 (0.0%) |
| 20 to 24 Year Olds | 20 (100.0%) | 0 (0.0%) |
| 25 to 34 Year Olds | 0 (0.0%) | 0 (0.0%) |
| 35 Years and over | 18 (60.0%) | 12 (40.0%) |
| Total | 838 (98.6%) | 12 (1.4%) |
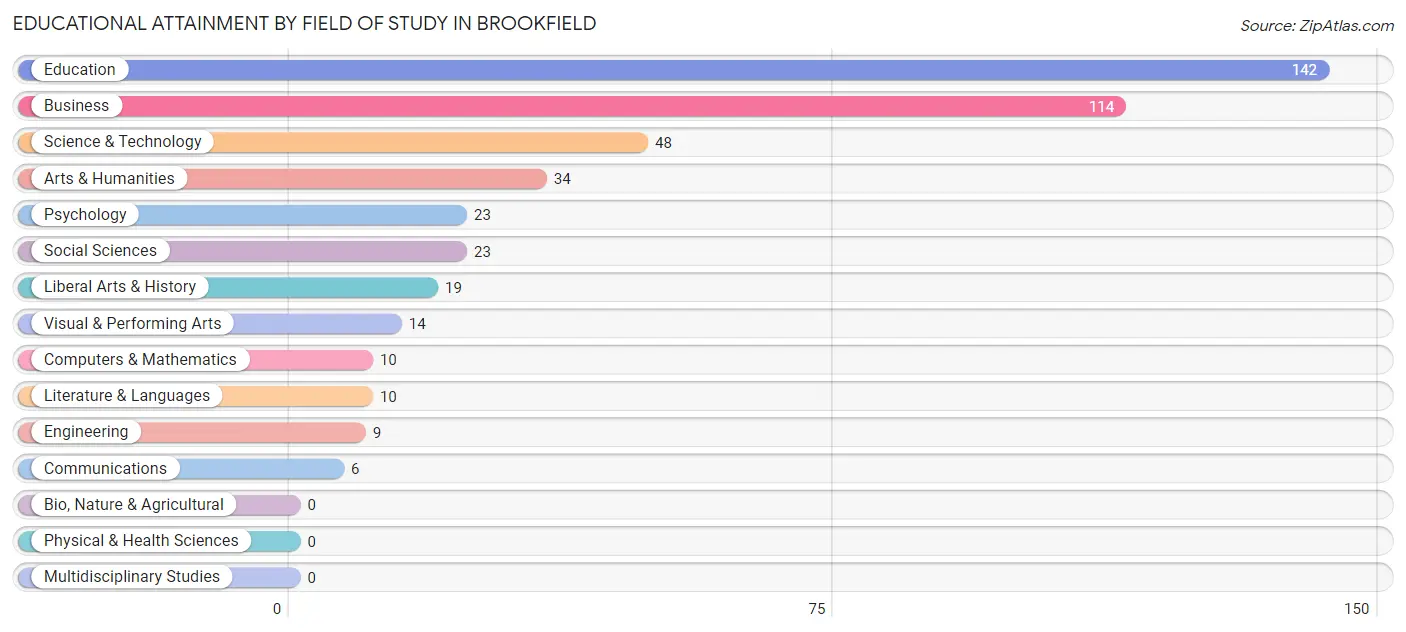
Educational Attainment by Field of Study in Brookfield
Education (142 | 31.4%), business (114 | 25.2%), science & technology (48 | 10.6%), arts & humanities (34 | 7.5%), and psychology (23 | 5.1%) are the most common fields of study among 452 individuals in Brookfield who have obtained a bachelor's degree or higher.
| Field of Study | # Graduates | % Graduates |
| Computers & Mathematics | 10 | 2.2% |
| Bio, Nature & Agricultural | 0 | 0.0% |
| Physical & Health Sciences | 0 | 0.0% |
| Psychology | 23 | 5.1% |
| Social Sciences | 23 | 5.1% |
| Engineering | 9 | 2.0% |
| Multidisciplinary Studies | 0 | 0.0% |
| Science & Technology | 48 | 10.6% |
| Business | 114 | 25.2% |
| Education | 142 | 31.4% |
| Literature & Languages | 10 | 2.2% |
| Liberal Arts & History | 19 | 4.2% |
| Visual & Performing Arts | 14 | 3.1% |
| Communications | 6 | 1.3% |
| Arts & Humanities | 34 | 7.5% |
| Total | 452 | 100.0% |
Transportation & Commute in Brookfield
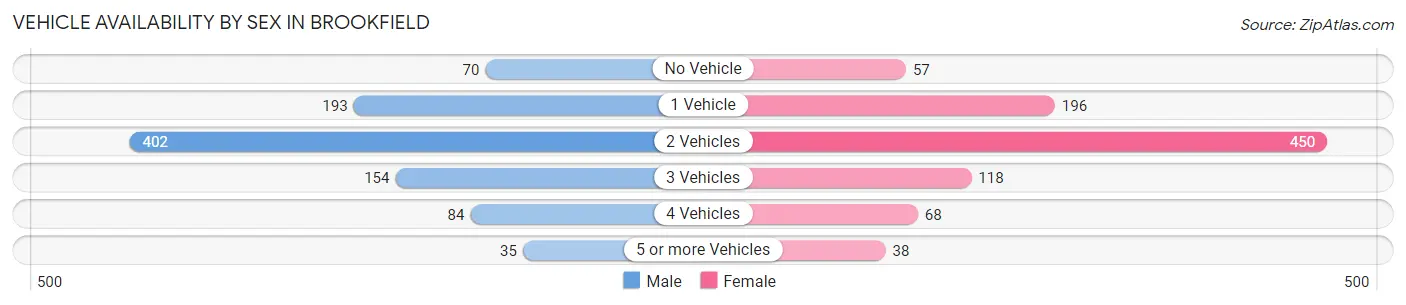
Vehicle Availability by Sex in Brookfield
The most prevalent vehicle ownership categories in Brookfield are males with 2 vehicles (402, accounting for 42.9%) and females with 2 vehicles (450, making up 43.4%).
| Vehicles Available | Male | Female |
| No Vehicle | 70 (7.5%) | 57 (6.1%) |
| 1 Vehicle | 193 (20.6%) | 196 (21.1%) |
| 2 Vehicles | 402 (42.9%) | 450 (48.5%) |
| 3 Vehicles | 154 (16.4%) | 118 (12.7%) |
| 4 Vehicles | 84 (9.0%) | 68 (7.3%) |
| 5 or more Vehicles | 35 (3.7%) | 38 (4.1%) |
| Total | 938 (100.0%) | 927 (100.0%) |
Commute Time in Brookfield
The most frequently occuring commute durations in Brookfield are 5 to 9 minutes (684 commuters, 37.4%), less than 5 minutes (297 commuters, 16.2%), and 10 to 14 minutes (191 commuters, 10.4%).
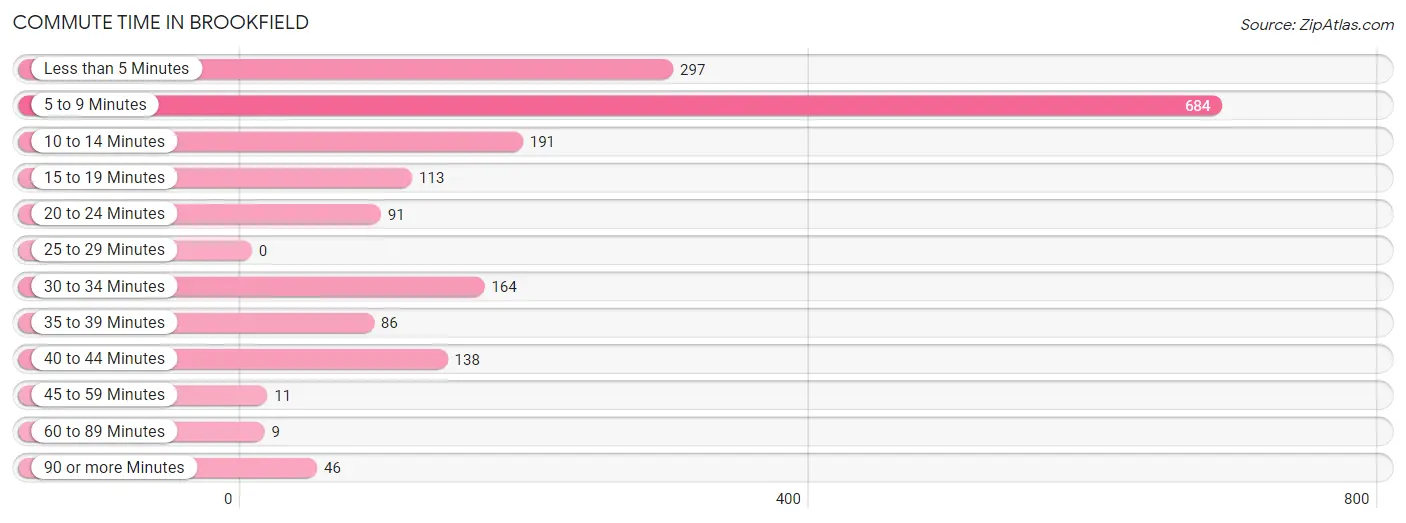
| Commute Time | # Commuters | % Commuters |
| Less than 5 Minutes | 297 | 16.2% |
| 5 to 9 Minutes | 684 | 37.4% |
| 10 to 14 Minutes | 191 | 10.4% |
| 15 to 19 Minutes | 113 | 6.2% |
| 20 to 24 Minutes | 91 | 5.0% |
| 25 to 29 Minutes | 0 | 0.0% |
| 30 to 34 Minutes | 164 | 9.0% |
| 35 to 39 Minutes | 86 | 4.7% |
| 40 to 44 Minutes | 138 | 7.5% |
| 45 to 59 Minutes | 11 | 0.6% |
| 60 to 89 Minutes | 9 | 0.5% |
| 90 or more Minutes | 46 | 2.5% |
Commute Time by Sex in Brookfield
The most common commute times in Brookfield are 5 to 9 minutes (305 commuters, 33.7%) for males and 5 to 9 minutes (379 commuters, 41.0%) for females.
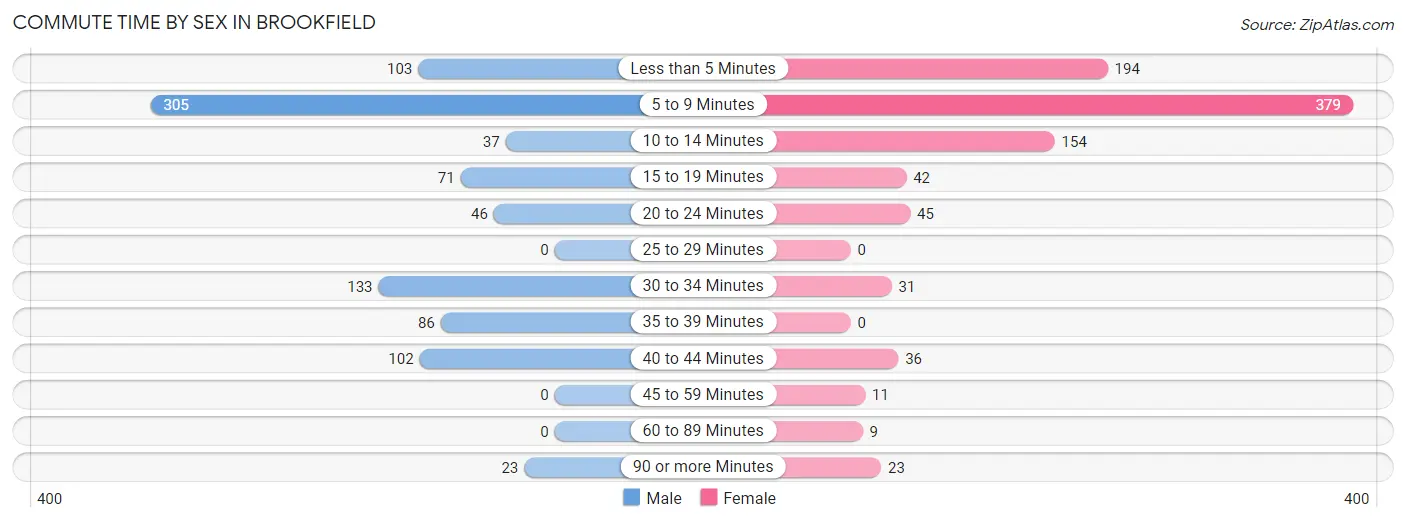
| Commute Time | Male | Female |
| Less than 5 Minutes | 103 (11.4%) | 194 (21.0%) |
| 5 to 9 Minutes | 305 (33.7%) | 379 (41.0%) |
| 10 to 14 Minutes | 37 (4.1%) | 154 (16.7%) |
| 15 to 19 Minutes | 71 (7.8%) | 42 (4.5%) |
| 20 to 24 Minutes | 46 (5.1%) | 45 (4.9%) |
| 25 to 29 Minutes | 0 (0.0%) | 0 (0.0%) |
| 30 to 34 Minutes | 133 (14.7%) | 31 (3.4%) |
| 35 to 39 Minutes | 86 (9.5%) | 0 (0.0%) |
| 40 to 44 Minutes | 102 (11.3%) | 36 (3.9%) |
| 45 to 59 Minutes | 0 (0.0%) | 11 (1.2%) |
| 60 to 89 Minutes | 0 (0.0%) | 9 (1.0%) |
| 90 or more Minutes | 23 (2.5%) | 23 (2.5%) |
Time of Departure to Work by Sex in Brookfield
The most frequent times of departure to work in Brookfield are 7:00 AM to 7:29 AM (158, 17.4%) for males and 7:00 AM to 7:29 AM (192, 20.8%) for females.
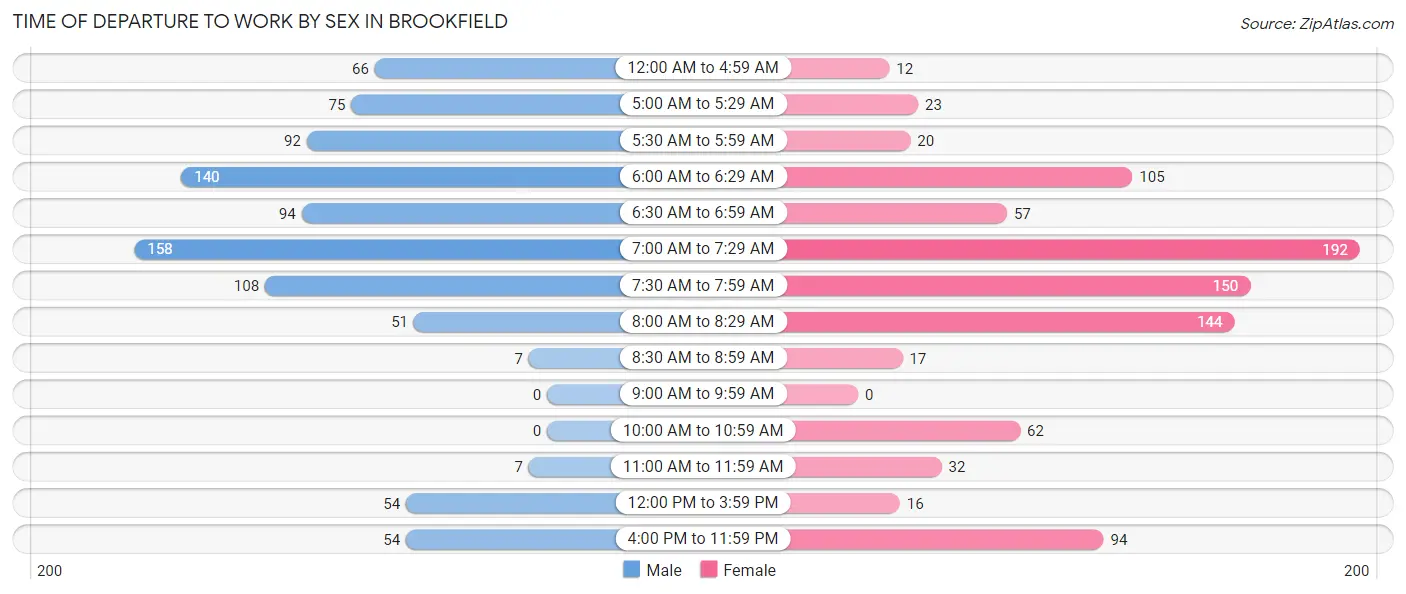
| Time of Departure | Male | Female |
| 12:00 AM to 4:59 AM | 66 (7.3%) | 12 (1.3%) |
| 5:00 AM to 5:29 AM | 75 (8.3%) | 23 (2.5%) |
| 5:30 AM to 5:59 AM | 92 (10.2%) | 20 (2.2%) |
| 6:00 AM to 6:29 AM | 140 (15.4%) | 105 (11.4%) |
| 6:30 AM to 6:59 AM | 94 (10.4%) | 57 (6.2%) |
| 7:00 AM to 7:29 AM | 158 (17.4%) | 192 (20.8%) |
| 7:30 AM to 7:59 AM | 108 (11.9%) | 150 (16.2%) |
| 8:00 AM to 8:29 AM | 51 (5.6%) | 144 (15.6%) |
| 8:30 AM to 8:59 AM | 7 (0.8%) | 17 (1.8%) |
| 9:00 AM to 9:59 AM | 0 (0.0%) | 0 (0.0%) |
| 10:00 AM to 10:59 AM | 0 (0.0%) | 62 (6.7%) |
| 11:00 AM to 11:59 AM | 7 (0.8%) | 32 (3.5%) |
| 12:00 PM to 3:59 PM | 54 (6.0%) | 16 (1.7%) |
| 4:00 PM to 11:59 PM | 54 (6.0%) | 94 (10.2%) |
| Total | 906 (100.0%) | 924 (100.0%) |
Housing Occupancy in Brookfield
Occupancy by Ownership in Brookfield
Of the total 1,705 dwellings in Brookfield, owner-occupied units account for 1,168 (68.5%), while renter-occupied units make up 537 (31.5%).
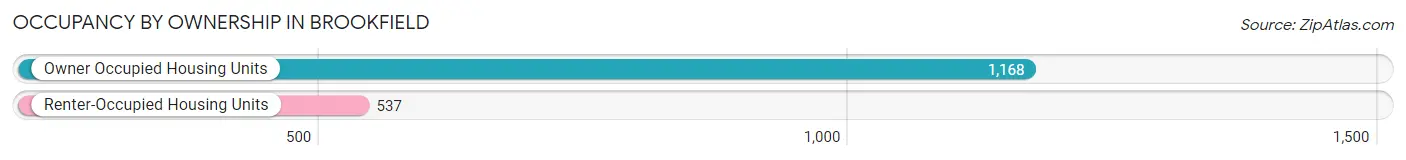
| Occupancy | # Housing Units | % Housing Units |
| Owner Occupied Housing Units | 1,168 | 68.5% |
| Renter-Occupied Housing Units | 537 | 31.5% |
| Total Occupied Housing Units | 1,705 | 100.0% |
Occupancy by Household Size in Brookfield
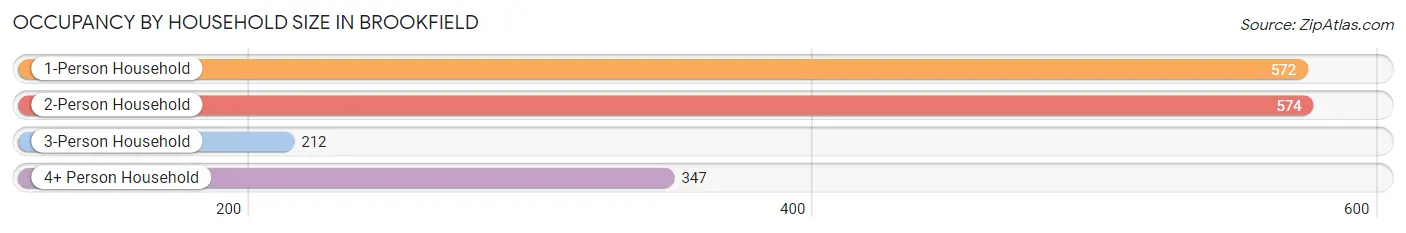
| Household Size | # Housing Units | % Housing Units |
| 1-Person Household | 572 | 33.6% |
| 2-Person Household | 574 | 33.7% |
| 3-Person Household | 212 | 12.4% |
| 4+ Person Household | 347 | 20.3% |
| Total Housing Units | 1,705 | 100.0% |
Occupancy by Ownership by Household Size in Brookfield
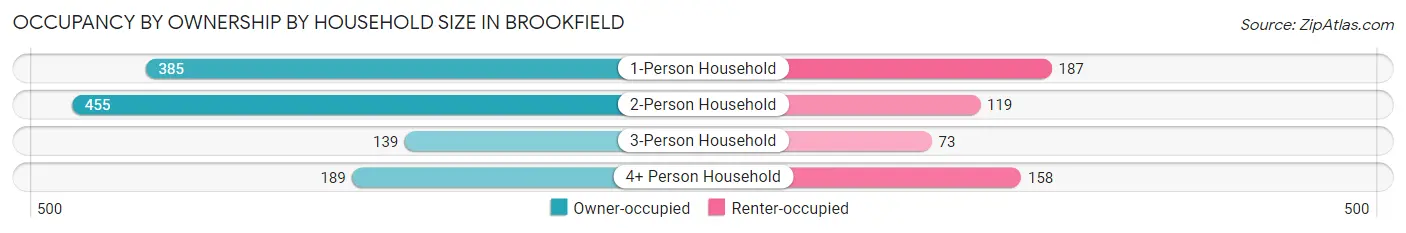
| Household Size | Owner-occupied | Renter-occupied |
| 1-Person Household | 385 (67.3%) | 187 (32.7%) |
| 2-Person Household | 455 (79.3%) | 119 (20.7%) |
| 3-Person Household | 139 (65.6%) | 73 (34.4%) |
| 4+ Person Household | 189 (54.5%) | 158 (45.5%) |
| Total Housing Units | 1,168 (68.5%) | 537 (31.5%) |
Occupancy by Educational Attainment in Brookfield
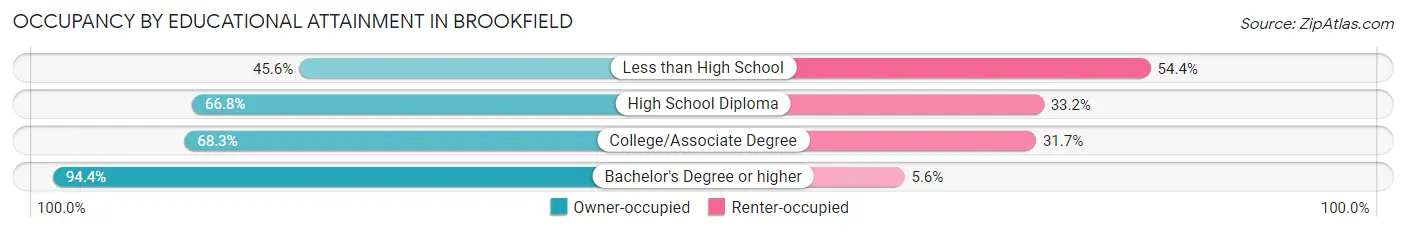
| Household Size | Owner-occupied | Renter-occupied |
| Less than High School | 98 (45.6%) | 117 (54.4%) |
| High School Diploma | 559 (66.8%) | 278 (33.2%) |
| College/Associate Degree | 276 (68.3%) | 128 (31.7%) |
| Bachelor's Degree or higher | 235 (94.4%) | 14 (5.6%) |
Occupancy by Age of Householder in Brookfield
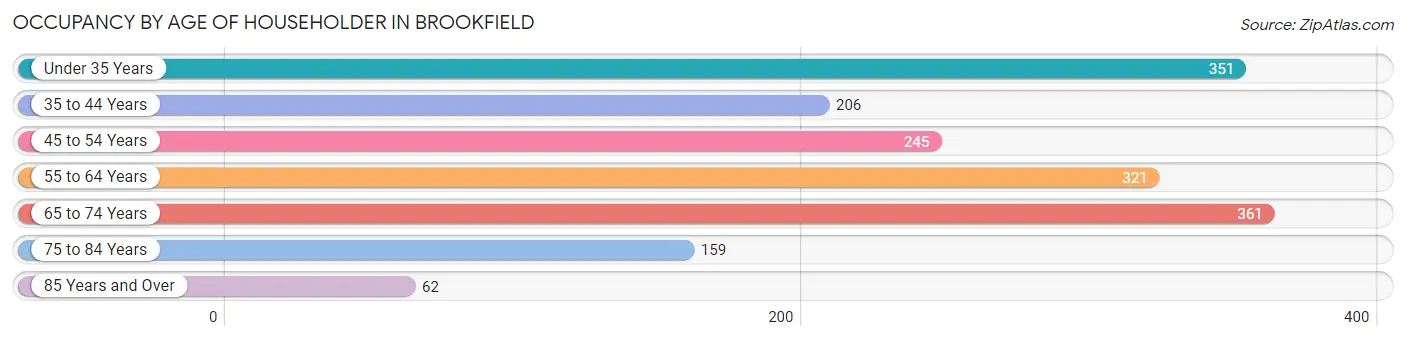
| Age Bracket | # Households | % Households |
| Under 35 Years | 351 | 20.6% |
| 35 to 44 Years | 206 | 12.1% |
| 45 to 54 Years | 245 | 14.4% |
| 55 to 64 Years | 321 | 18.8% |
| 65 to 74 Years | 361 | 21.2% |
| 75 to 84 Years | 159 | 9.3% |
| 85 Years and Over | 62 | 3.6% |
| Total | 1,705 | 100.0% |
Housing Finances in Brookfield
Median Income by Occupancy in Brookfield
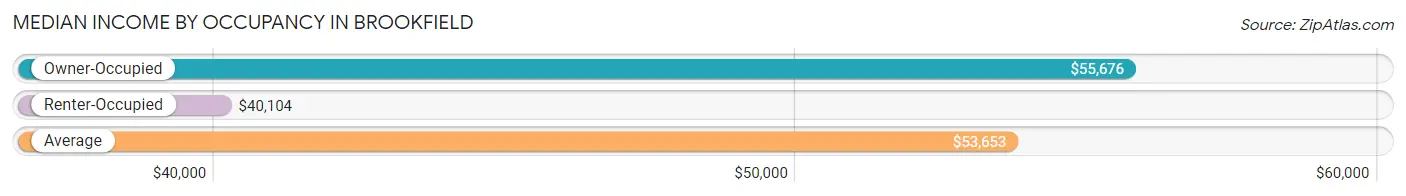
| Occupancy Type | # Households | Median Income |
| Owner-Occupied | 1,168 (68.5%) | $55,676 |
| Renter-Occupied | 537 (31.5%) | $40,104 |
| Average | 1,705 (100.0%) | $53,653 |
Occupancy by Householder Income Bracket in Brookfield
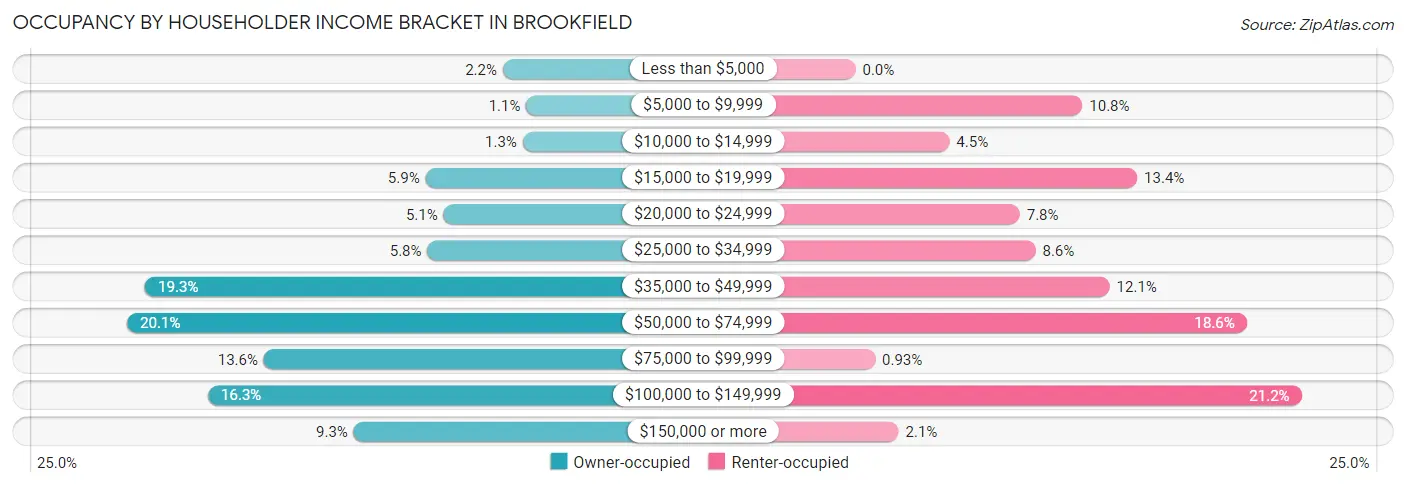
| Income Bracket | Owner-occupied | Renter-occupied |
| Less than $5,000 | 26 (2.2%) | 0 (0.0%) |
| $5,000 to $9,999 | 13 (1.1%) | 58 (10.8%) |
| $10,000 to $14,999 | 15 (1.3%) | 24 (4.5%) |
| $15,000 to $19,999 | 69 (5.9%) | 72 (13.4%) |
| $20,000 to $24,999 | 59 (5.1%) | 42 (7.8%) |
| $25,000 to $34,999 | 68 (5.8%) | 46 (8.6%) |
| $35,000 to $49,999 | 225 (19.3%) | 65 (12.1%) |
| $50,000 to $74,999 | 235 (20.1%) | 100 (18.6%) |
| $75,000 to $99,999 | 159 (13.6%) | 5 (0.9%) |
| $100,000 to $149,999 | 190 (16.3%) | 114 (21.2%) |
| $150,000 or more | 109 (9.3%) | 11 (2.1%) |
| Total | 1,168 (100.0%) | 537 (100.0%) |
Monthly Housing Cost Tiers in Brookfield
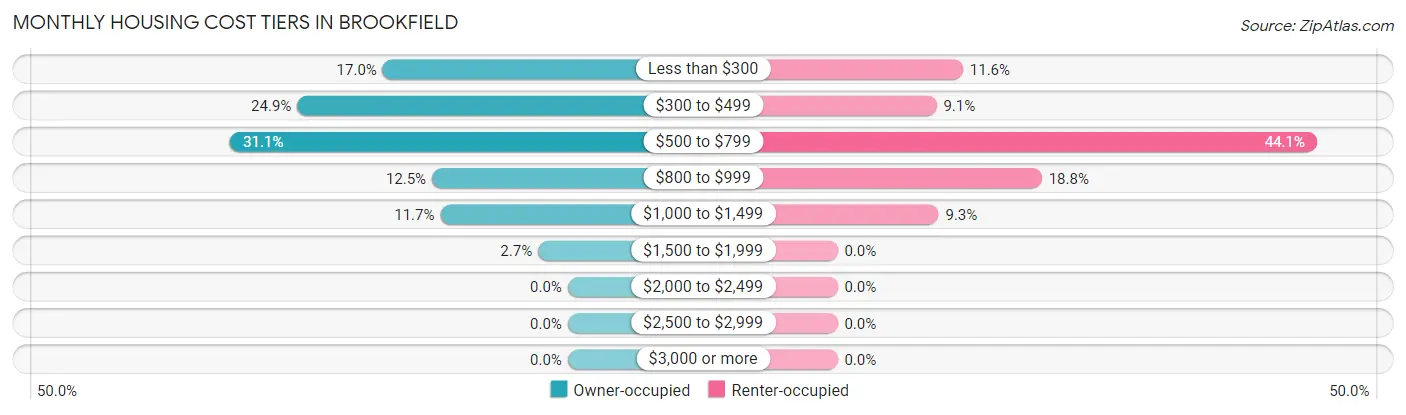
| Monthly Cost | Owner-occupied | Renter-occupied |
| Less than $300 | 199 (17.0%) | 62 (11.6%) |
| $300 to $499 | 291 (24.9%) | 49 (9.1%) |
| $500 to $799 | 363 (31.1%) | 237 (44.1%) |
| $800 to $999 | 146 (12.5%) | 101 (18.8%) |
| $1,000 to $1,499 | 137 (11.7%) | 50 (9.3%) |
| $1,500 to $1,999 | 32 (2.7%) | 0 (0.0%) |
| $2,000 to $2,499 | 0 (0.0%) | 0 (0.0%) |
| $2,500 to $2,999 | 0 (0.0%) | 0 (0.0%) |
| $3,000 or more | 0 (0.0%) | 0 (0.0%) |
| Total | 1,168 (100.0%) | 537 (100.0%) |
Physical Housing Characteristics in Brookfield
Housing Structures in Brookfield
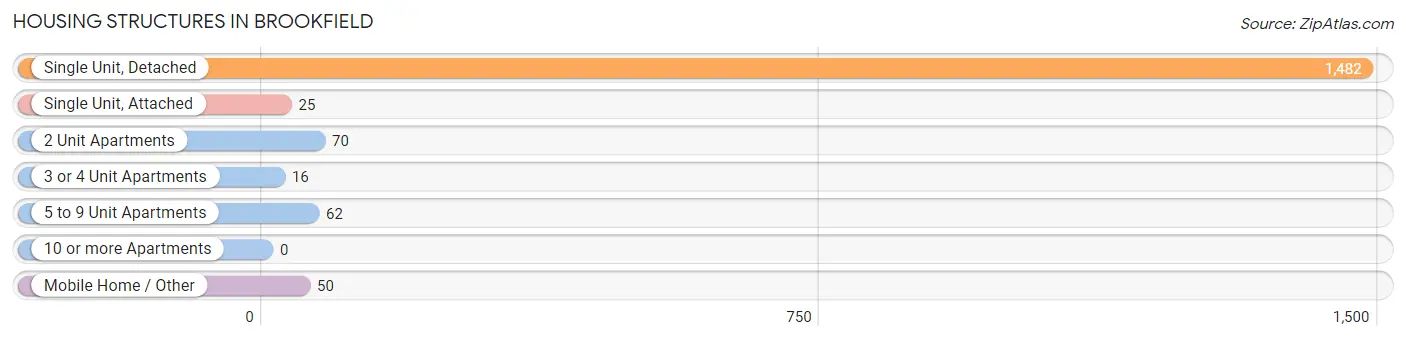
| Structure Type | # Housing Units | % Housing Units |
| Single Unit, Detached | 1,482 | 86.9% |
| Single Unit, Attached | 25 | 1.5% |
| 2 Unit Apartments | 70 | 4.1% |
| 3 or 4 Unit Apartments | 16 | 0.9% |
| 5 to 9 Unit Apartments | 62 | 3.6% |
| 10 or more Apartments | 0 | 0.0% |
| Mobile Home / Other | 50 | 2.9% |
| Total | 1,705 | 100.0% |
Housing Structures by Occupancy in Brookfield
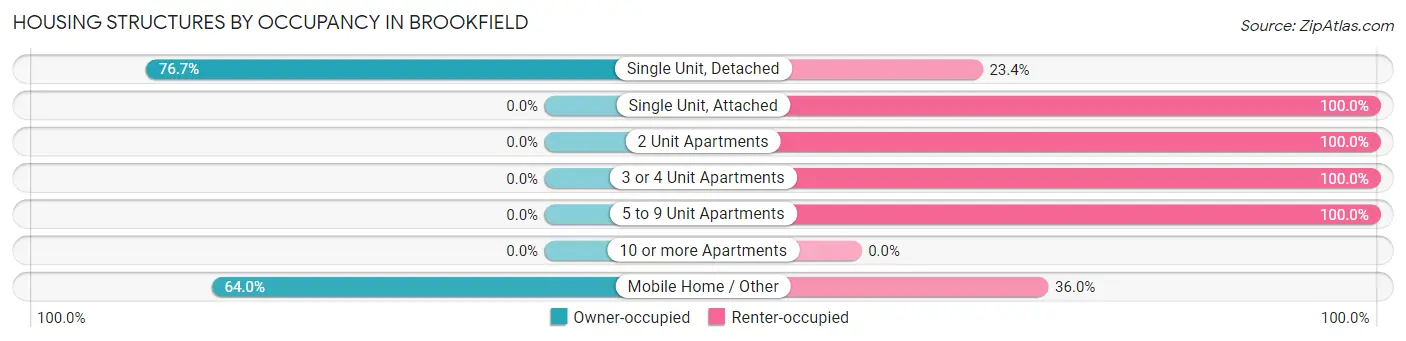
| Structure Type | Owner-occupied | Renter-occupied |
| Single Unit, Detached | 1,136 (76.6%) | 346 (23.4%) |
| Single Unit, Attached | 0 (0.0%) | 25 (100.0%) |
| 2 Unit Apartments | 0 (0.0%) | 70 (100.0%) |
| 3 or 4 Unit Apartments | 0 (0.0%) | 16 (100.0%) |
| 5 to 9 Unit Apartments | 0 (0.0%) | 62 (100.0%) |
| 10 or more Apartments | 0 (0.0%) | 0 (0.0%) |
| Mobile Home / Other | 32 (64.0%) | 18 (36.0%) |
| Total | 1,168 (68.5%) | 537 (31.5%) |
Housing Structures by Number of Rooms in Brookfield
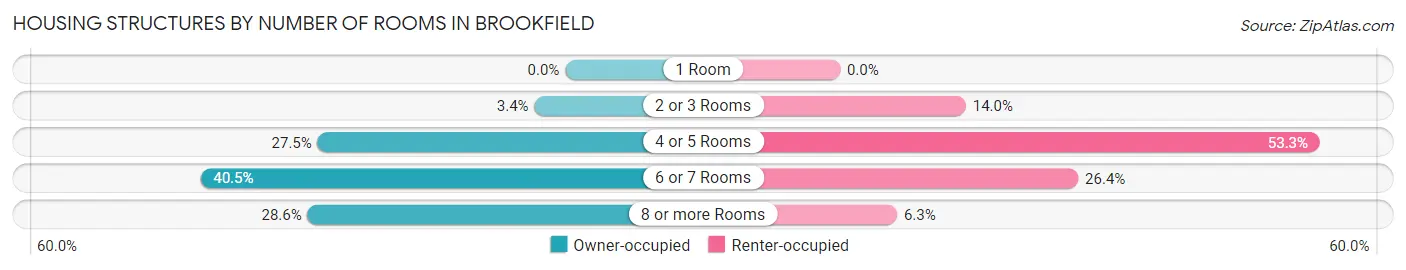
| Number of Rooms | Owner-occupied | Renter-occupied |
| 1 Room | 0 (0.0%) | 0 (0.0%) |
| 2 or 3 Rooms | 40 (3.4%) | 75 (14.0%) |
| 4 or 5 Rooms | 321 (27.5%) | 286 (53.3%) |
| 6 or 7 Rooms | 473 (40.5%) | 142 (26.4%) |
| 8 or more Rooms | 334 (28.6%) | 34 (6.3%) |
| Total | 1,168 (100.0%) | 537 (100.0%) |
Housing Structure by Heating Type in Brookfield
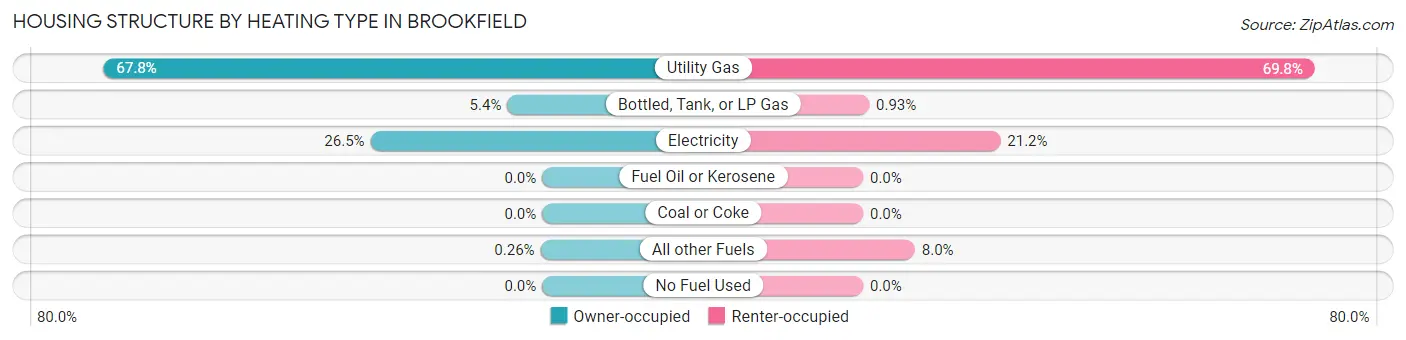
| Heating Type | Owner-occupied | Renter-occupied |
| Utility Gas | 792 (67.8%) | 375 (69.8%) |
| Bottled, Tank, or LP Gas | 63 (5.4%) | 5 (0.9%) |
| Electricity | 310 (26.5%) | 114 (21.2%) |
| Fuel Oil or Kerosene | 0 (0.0%) | 0 (0.0%) |
| Coal or Coke | 0 (0.0%) | 0 (0.0%) |
| All other Fuels | 3 (0.3%) | 43 (8.0%) |
| No Fuel Used | 0 (0.0%) | 0 (0.0%) |
| Total | 1,168 (100.0%) | 537 (100.0%) |
Household Vehicle Usage in Brookfield
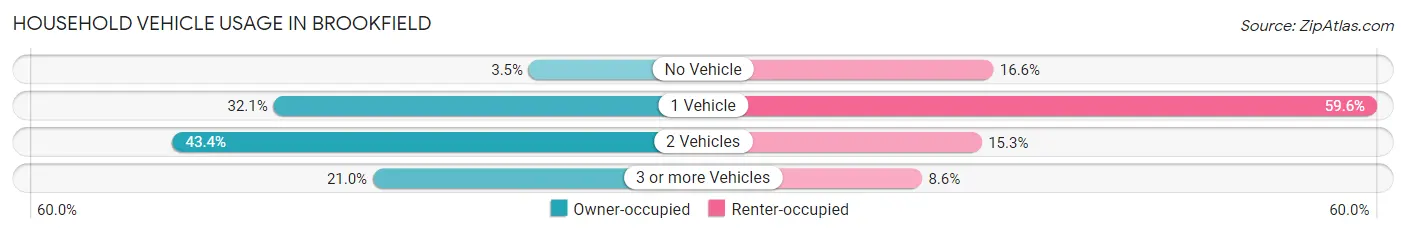
| Vehicles per Household | Owner-occupied | Renter-occupied |
| No Vehicle | 41 (3.5%) | 89 (16.6%) |
| 1 Vehicle | 375 (32.1%) | 320 (59.6%) |
| 2 Vehicles | 507 (43.4%) | 82 (15.3%) |
| 3 or more Vehicles | 245 (21.0%) | 46 (8.6%) |
| Total | 1,168 (100.0%) | 537 (100.0%) |
Real Estate & Mortgages in Brookfield
Real Estate and Mortgage Overview in Brookfield
| Characteristic | Without Mortgage | With Mortgage |
| Housing Units | 651 | 517 |
| Median Property Value | $77,300 | $86,700 |
| Median Household Income | $38,472 | $70 |
| Monthly Housing Costs | $379 | $0 |
| Real Estate Taxes | $753 | $0 |
Property Value by Mortgage Status in Brookfield
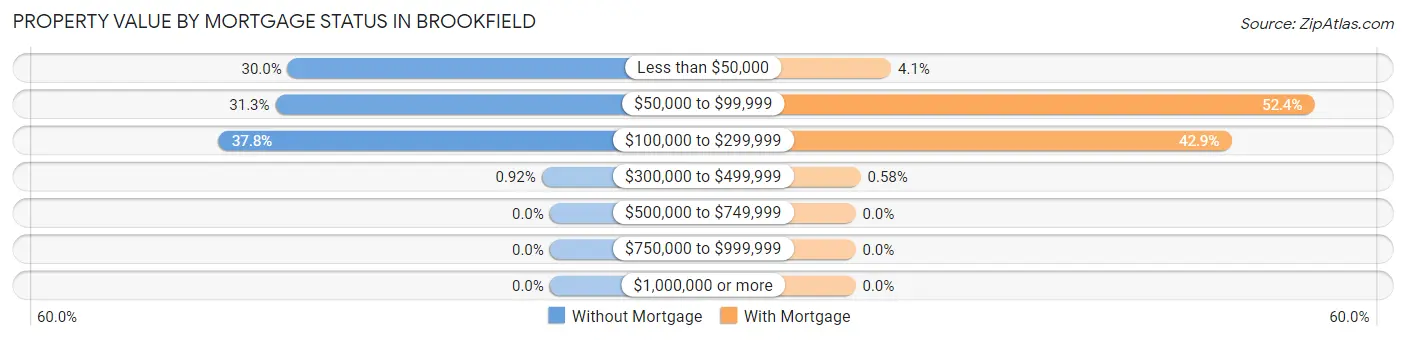
| Property Value | Without Mortgage | With Mortgage |
| Less than $50,000 | 195 (29.9%) | 21 (4.1%) |
| $50,000 to $99,999 | 204 (31.3%) | 271 (52.4%) |
| $100,000 to $299,999 | 246 (37.8%) | 222 (42.9%) |
| $300,000 to $499,999 | 6 (0.9%) | 3 (0.6%) |
| $500,000 to $749,999 | 0 (0.0%) | 0 (0.0%) |
| $750,000 to $999,999 | 0 (0.0%) | 0 (0.0%) |
| $1,000,000 or more | 0 (0.0%) | 0 (0.0%) |
| Total | 651 (100.0%) | 517 (100.0%) |
Household Income by Mortgage Status in Brookfield
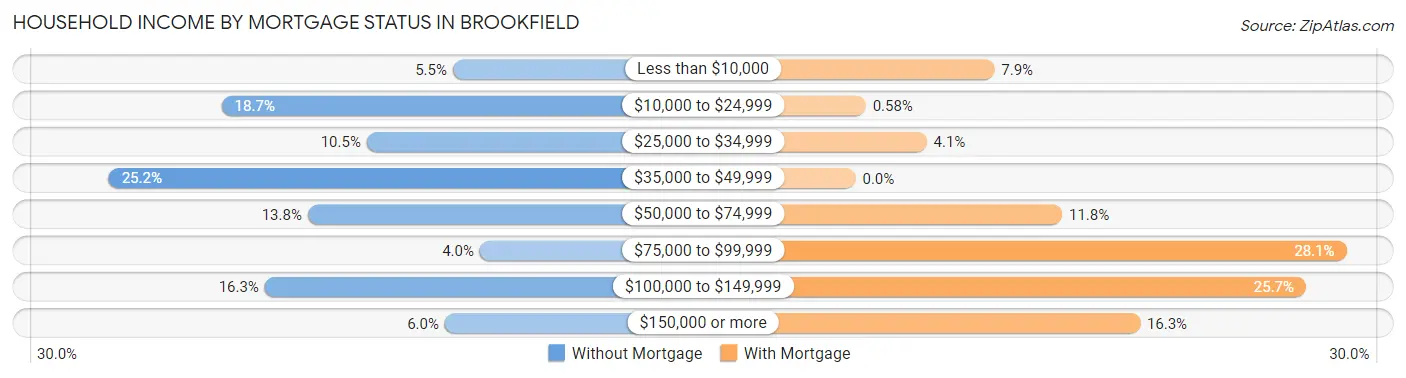
| Household Income | Without Mortgage | With Mortgage |
| Less than $10,000 | 36 (5.5%) | 41 (7.9%) |
| $10,000 to $24,999 | 122 (18.7%) | 3 (0.6%) |
| $25,000 to $34,999 | 68 (10.4%) | 21 (4.1%) |
| $35,000 to $49,999 | 164 (25.2%) | 0 (0.0%) |
| $50,000 to $74,999 | 90 (13.8%) | 61 (11.8%) |
| $75,000 to $99,999 | 26 (4.0%) | 145 (28.1%) |
| $100,000 to $149,999 | 106 (16.3%) | 133 (25.7%) |
| $150,000 or more | 39 (6.0%) | 84 (16.3%) |
| Total | 651 (100.0%) | 517 (100.0%) |
Property Value to Household Income Ratio in Brookfield
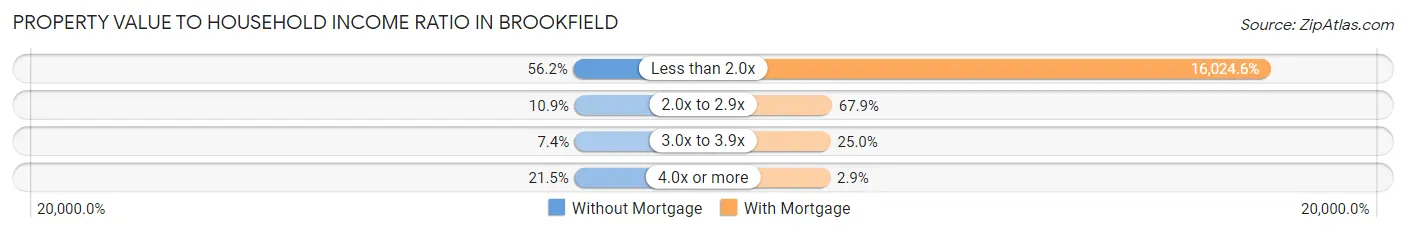
| Value-to-Income Ratio | Without Mortgage | With Mortgage |
| Less than 2.0x | 366 (56.2%) | 82,847 (16,024.6%) |
| 2.0x to 2.9x | 71 (10.9%) | 351 (67.9%) |
| 3.0x to 3.9x | 48 (7.4%) | 129 (24.9%) |
| 4.0x or more | 140 (21.5%) | 15 (2.9%) |
| Total | 651 (100.0%) | 517 (100.0%) |
Real Estate Taxes by Mortgage Status in Brookfield
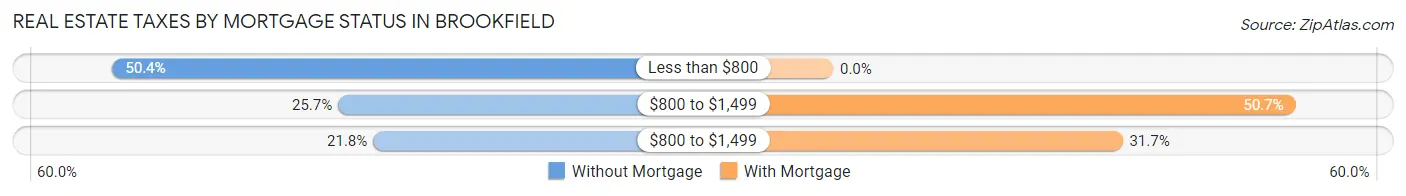
| Property Taxes | Without Mortgage | With Mortgage |
| Less than $800 | 328 (50.4%) | 0 (0.0%) |
| $800 to $1,499 | 167 (25.7%) | 262 (50.7%) |
| $800 to $1,499 | 142 (21.8%) | 164 (31.7%) |
| Total | 651 (100.0%) | 517 (100.0%) |
Health & Disability in Brookfield
Health Insurance Coverage by Age in Brookfield
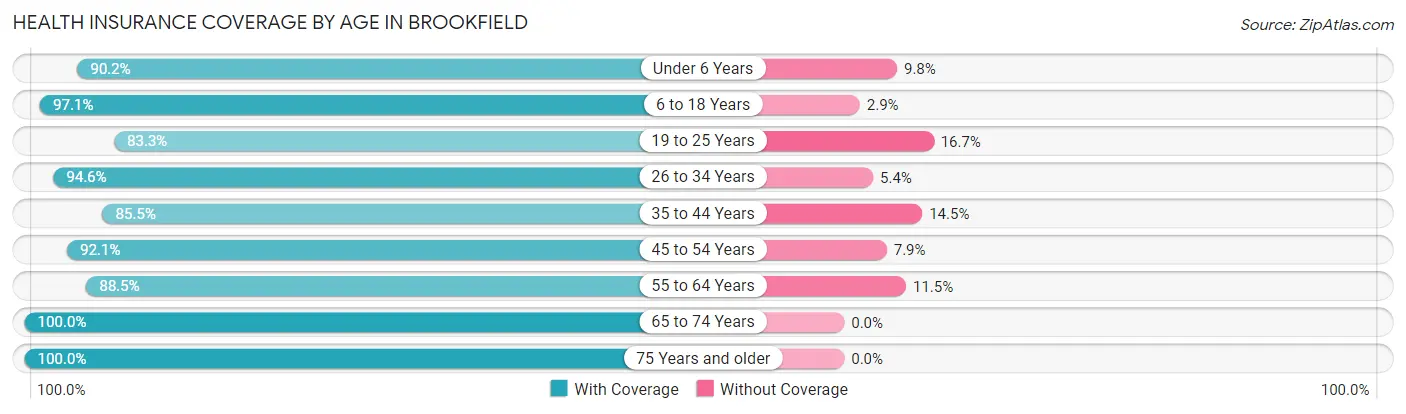
| Age Bracket | With Coverage | Without Coverage |
| Under 6 Years | 275 (90.2%) | 30 (9.8%) |
| 6 to 18 Years | 702 (97.1%) | 21 (2.9%) |
| 19 to 25 Years | 225 (83.3%) | 45 (16.7%) |
| 26 to 34 Years | 476 (94.6%) | 27 (5.4%) |
| 35 to 44 Years | 353 (85.5%) | 60 (14.5%) |
| 45 to 54 Years | 407 (92.1%) | 35 (7.9%) |
| 55 to 64 Years | 438 (88.5%) | 57 (11.5%) |
| 65 to 74 Years | 493 (100.0%) | 0 (0.0%) |
| 75 Years and older | 351 (100.0%) | 0 (0.0%) |
| Total | 3,720 (93.1%) | 275 (6.9%) |
Health Insurance Coverage by Citizenship Status in Brookfield
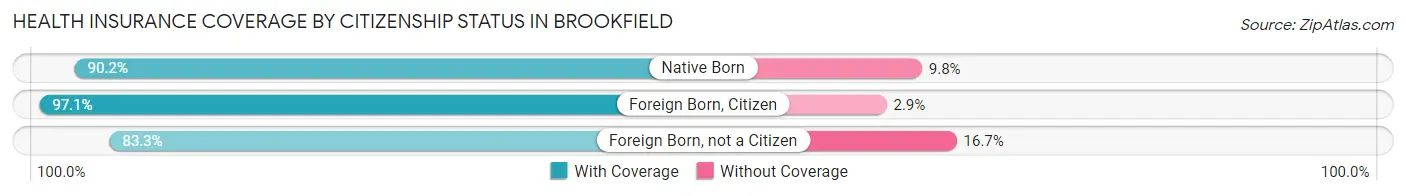
| Citizenship Status | With Coverage | Without Coverage |
| Native Born | 275 (90.2%) | 30 (9.8%) |
| Foreign Born, Citizen | 702 (97.1%) | 21 (2.9%) |
| Foreign Born, not a Citizen | 225 (83.3%) | 45 (16.7%) |
Health Insurance Coverage by Household Income in Brookfield
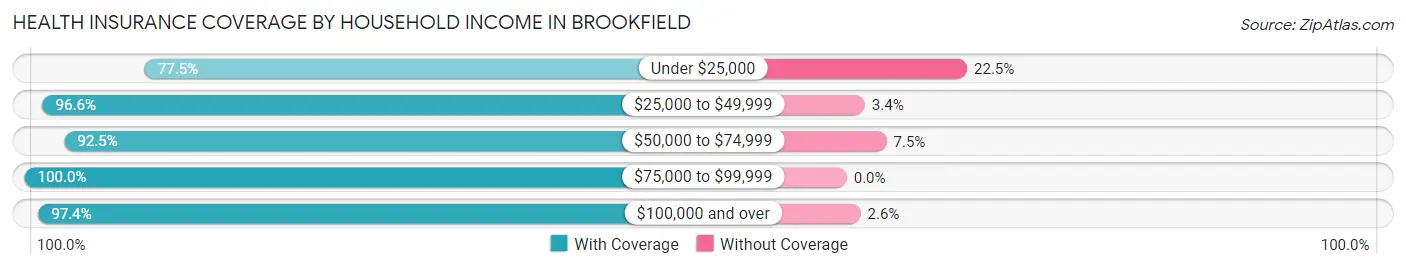
| Household Income | With Coverage | Without Coverage |
| Under $25,000 | 512 (77.5%) | 149 (22.5%) |
| $25,000 to $49,999 | 655 (96.6%) | 23 (3.4%) |
| $50,000 to $74,999 | 893 (92.5%) | 72 (7.5%) |
| $75,000 to $99,999 | 484 (100.0%) | 0 (0.0%) |
| $100,000 and over | 1,164 (97.4%) | 31 (2.6%) |
Public vs Private Health Insurance Coverage by Age in Brookfield
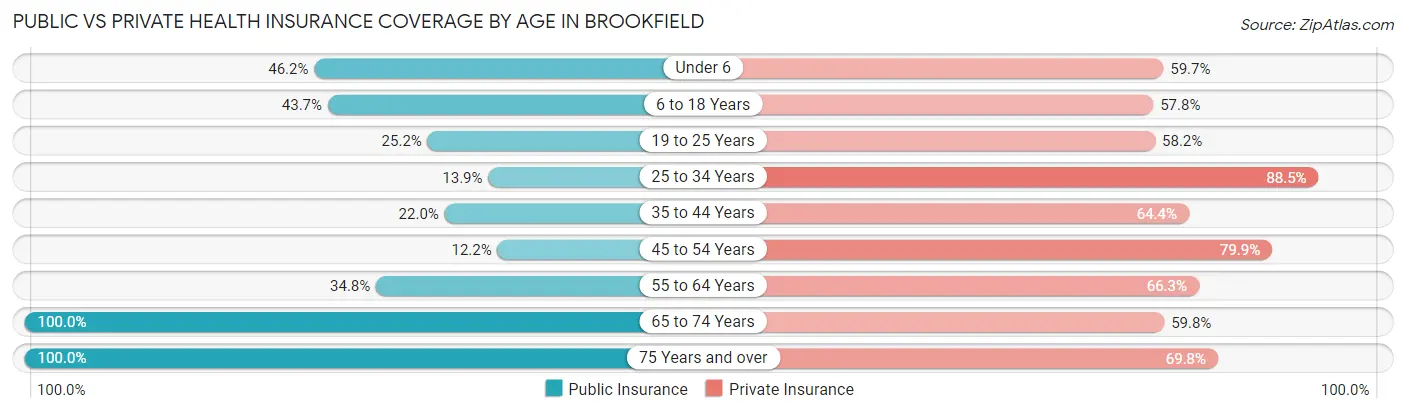
| Age Bracket | Public Insurance | Private Insurance |
| Under 6 | 141 (46.2%) | 182 (59.7%) |
| 6 to 18 Years | 316 (43.7%) | 418 (57.8%) |
| 19 to 25 Years | 68 (25.2%) | 157 (58.2%) |
| 25 to 34 Years | 70 (13.9%) | 445 (88.5%) |
| 35 to 44 Years | 91 (22.0%) | 266 (64.4%) |
| 45 to 54 Years | 54 (12.2%) | 353 (79.9%) |
| 55 to 64 Years | 172 (34.7%) | 328 (66.3%) |
| 65 to 74 Years | 493 (100.0%) | 295 (59.8%) |
| 75 Years and over | 351 (100.0%) | 245 (69.8%) |
| Total | 1,756 (44.0%) | 2,689 (67.3%) |
Disability Status by Sex by Age in Brookfield
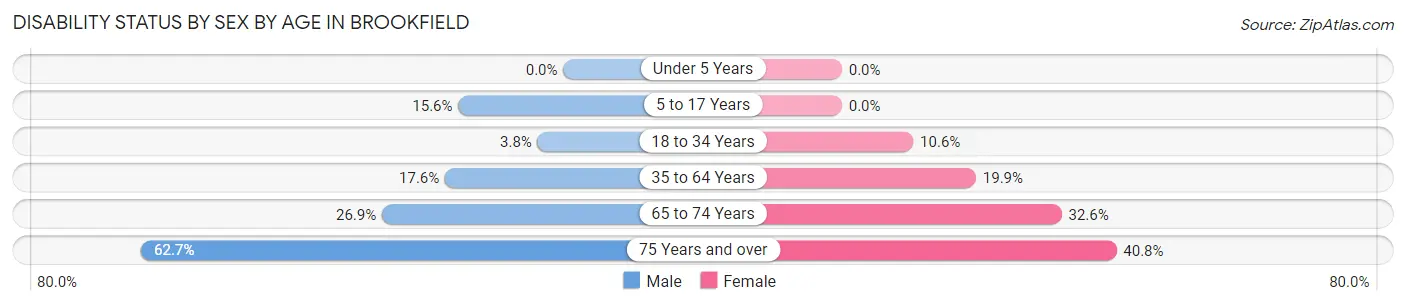
| Age Bracket | Male | Female |
| Under 5 Years | 0 (0.0%) | 0 (0.0%) |
| 5 to 17 Years | 70 (15.6%) | 0 (0.0%) |
| 18 to 34 Years | 12 (3.8%) | 51 (10.6%) |
| 35 to 64 Years | 125 (17.6%) | 127 (19.9%) |
| 65 to 74 Years | 56 (26.9%) | 93 (32.6%) |
| 75 Years and over | 74 (62.7%) | 95 (40.8%) |
Disability Class by Sex by Age in Brookfield
Disability Class: Hearing Difficulty
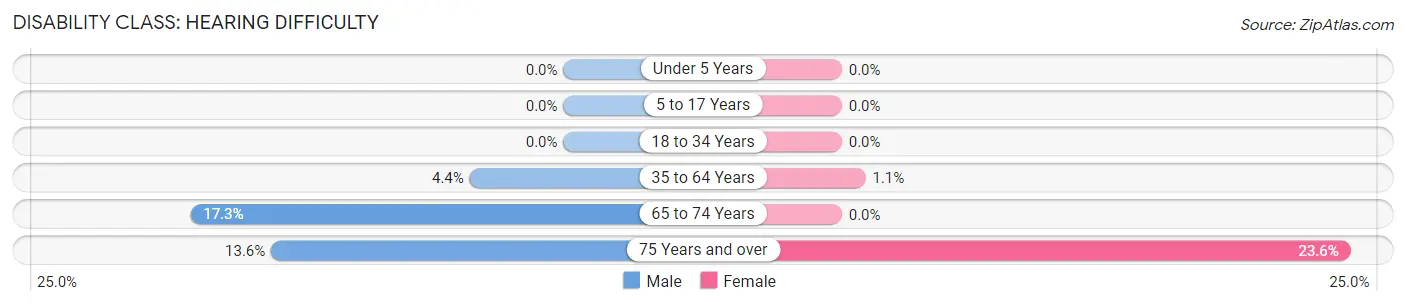
| Age Bracket | Male | Female |
| Under 5 Years | 0 (0.0%) | 0 (0.0%) |
| 5 to 17 Years | 0 (0.0%) | 0 (0.0%) |
| 18 to 34 Years | 0 (0.0%) | 0 (0.0%) |
| 35 to 64 Years | 31 (4.3%) | 7 (1.1%) |
| 65 to 74 Years | 36 (17.3%) | 0 (0.0%) |
| 75 Years and over | 16 (13.6%) | 55 (23.6%) |
Disability Class: Vision Difficulty
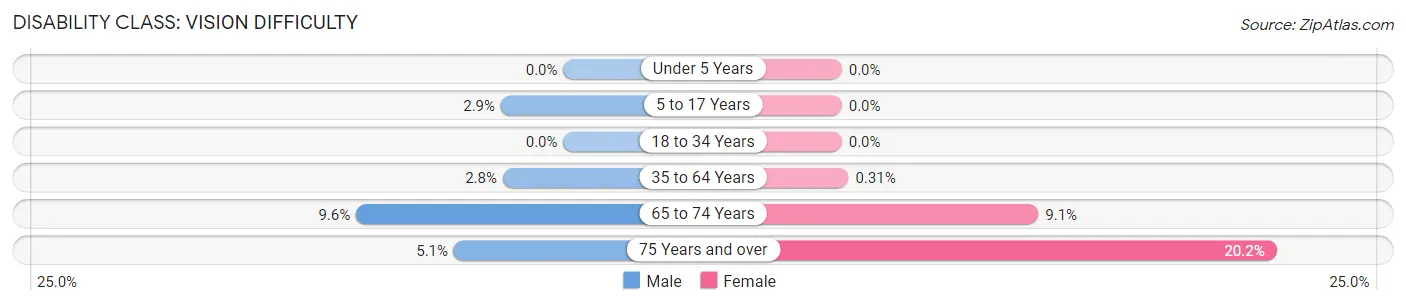
| Age Bracket | Male | Female |
| Under 5 Years | 0 (0.0%) | 0 (0.0%) |
| 5 to 17 Years | 13 (2.9%) | 0 (0.0%) |
| 18 to 34 Years | 0 (0.0%) | 0 (0.0%) |
| 35 to 64 Years | 20 (2.8%) | 2 (0.3%) |
| 65 to 74 Years | 20 (9.6%) | 26 (9.1%) |
| 75 Years and over | 6 (5.1%) | 47 (20.2%) |
Disability Class: Cognitive Difficulty
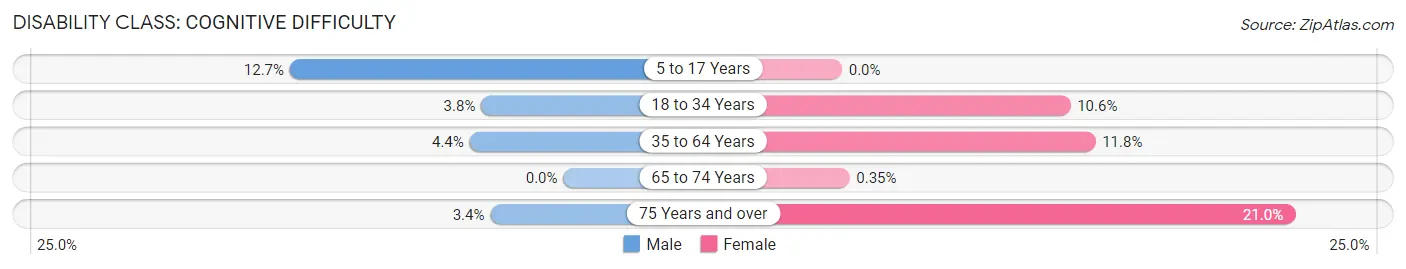
| Age Bracket | Male | Female |
| 5 to 17 Years | 57 (12.7%) | 0 (0.0%) |
| 18 to 34 Years | 12 (3.8%) | 51 (10.6%) |
| 35 to 64 Years | 31 (4.3%) | 75 (11.8%) |
| 65 to 74 Years | 0 (0.0%) | 1 (0.4%) |
| 75 Years and over | 4 (3.4%) | 49 (21.0%) |
Disability Class: Ambulatory Difficulty
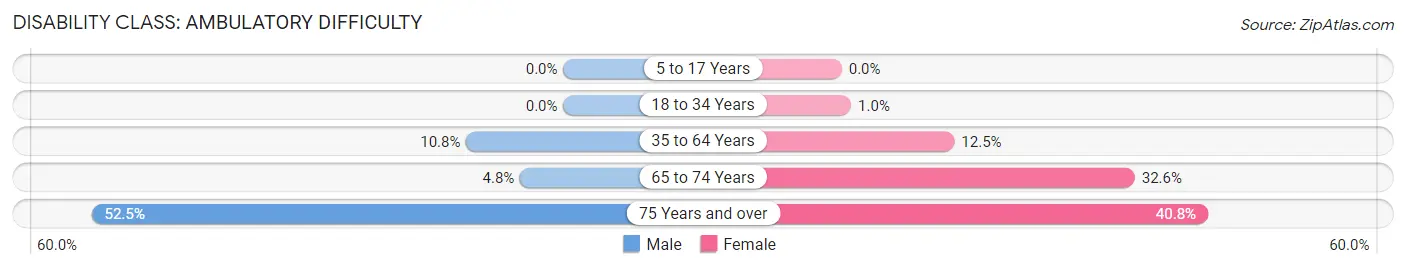
| Age Bracket | Male | Female |
| 5 to 17 Years | 0 (0.0%) | 0 (0.0%) |
| 18 to 34 Years | 0 (0.0%) | 5 (1.0%) |
| 35 to 64 Years | 77 (10.8%) | 80 (12.5%) |
| 65 to 74 Years | 10 (4.8%) | 93 (32.6%) |
| 75 Years and over | 62 (52.5%) | 95 (40.8%) |
Disability Class: Self-Care Difficulty
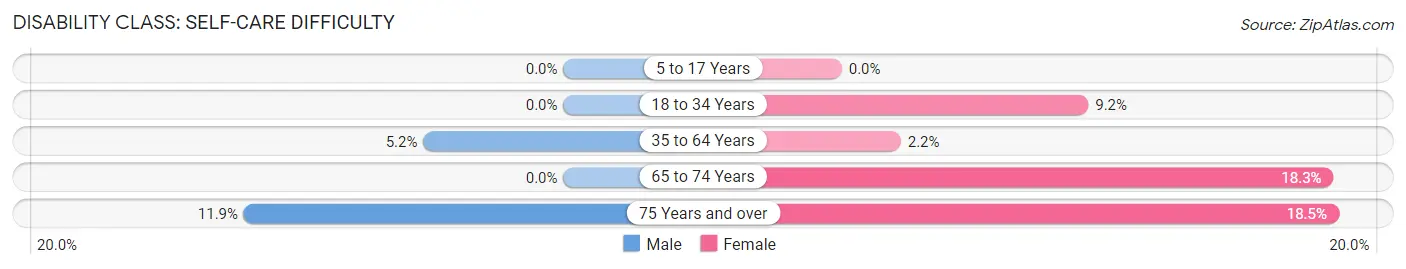
| Age Bracket | Male | Female |
| 5 to 17 Years | 0 (0.0%) | 0 (0.0%) |
| 18 to 34 Years | 0 (0.0%) | 44 (9.1%) |
| 35 to 64 Years | 37 (5.2%) | 14 (2.2%) |
| 65 to 74 Years | 0 (0.0%) | 52 (18.2%) |
| 75 Years and over | 14 (11.9%) | 43 (18.4%) |
Technology Access in Brookfield
Computing Device Access in Brookfield
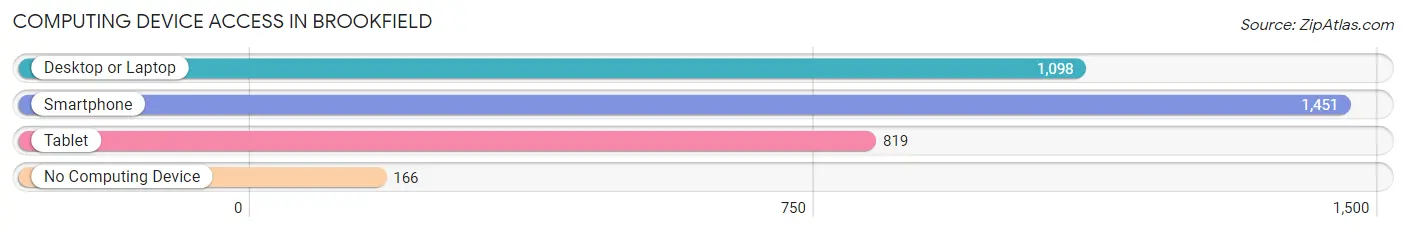
| Device Type | # Households | % Households |
| Desktop or Laptop | 1,098 | 64.4% |
| Smartphone | 1,451 | 85.1% |
| Tablet | 819 | 48.0% |
| No Computing Device | 166 | 9.7% |
| Total | 1,705 | 100.0% |
Internet Access in Brookfield
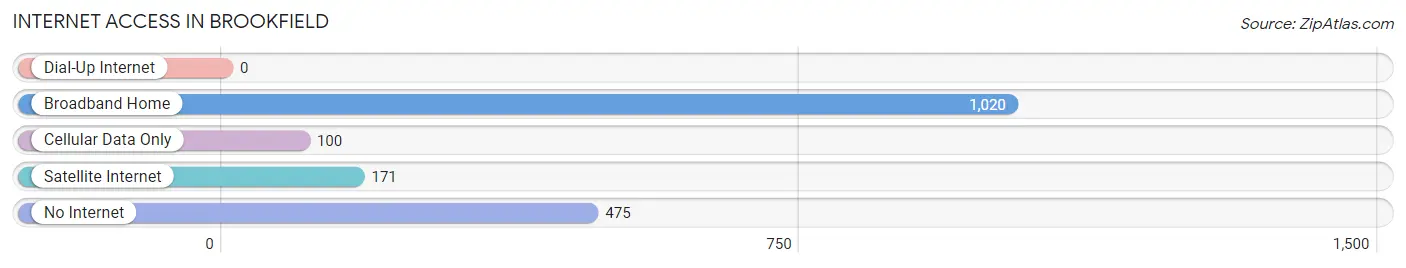
| Internet Type | # Households | % Households |
| Dial-Up Internet | 0 | 0.0% |
| Broadband Home | 1,020 | 59.8% |
| Cellular Data Only | 100 | 5.9% |
| Satellite Internet | 171 | 10.0% |
| No Internet | 475 | 27.9% |
| Total | 1,705 | 100.0% |
Brookfield Summary
History
The city of Brookfield, Missouri is located in Linn County in the north-central part of the state. It is the county seat and the largest city in the county. The city was founded in 1837 and was named after the nearby Brookfield Creek. The city was incorporated in 1868 and has a population of 4,919 as of the 2010 census.
The area around Brookfield was first settled by Native Americans, including the Osage, Kickapoo, and Potawatomi tribes. The first European settlers arrived in the area in the early 1800s. The city was founded in 1837 by a group of settlers from Kentucky and Tennessee. The settlers named the city after the nearby Brookfield Creek.
The city grew rapidly in the late 1800s and early 1900s. The railroad arrived in 1871, and the city was incorporated in 1868. The city was a major center for the production of wool and other agricultural products. The city also became a major center for the production of brick and tile.
In the early 1900s, the city was a major center for the production of automobiles. The city was home to the Brookfield Motor Company, which produced cars from 1909 to 1915. The company was the first to produce a car with a four-cylinder engine.
The city was also home to the Brookfield Glass Company, which produced glass products from 1909 to 1929. The company was the first to produce glass bottles with a screw-on cap.
Geography
Brookfield is located in north-central Missouri, in Linn County. The city is situated on the banks of the Chariton River, which flows through the city. The city is located about 50 miles northeast of Kansas City and about 100 miles west of St. Louis.
The city has a total area of 4.2 square miles, all of which is land. The city is located in the Ozark Plateau region of Missouri, and the terrain is mostly rolling hills. The city has a humid continental climate, with hot, humid summers and cold, dry winters.
Economy
The economy of Brookfield is largely based on agriculture and manufacturing. The city is home to several large agricultural operations, including a large hog farm and a large dairy farm. The city is also home to several manufacturing companies, including a large brick and tile factory and a large glass factory.
The city is also home to several retail stores, including a Walmart Supercenter and several smaller stores. The city is also home to several restaurants, including several fast food restaurants and several local restaurants.
Demographics
As of the 2010 census, the population of Brookfield was 4,919. The population is predominantly white, with about 90% of the population being white. The city has a median household income of $37,945, and the median age is 40.
The city has a large Hispanic population, with about 10% of the population being Hispanic. The city also has a large African American population, with about 8% of the population being African American. The city also has a large Native American population, with about 2% of the population being Native American.
Common Questions
What is Per Capita Income in Brookfield?
Per Capita income in Brookfield is $28,966.
What is the Median Family Income in Brookfield?
Median Family Income in Brookfield is $56,599.
What is the Median Household income in Brookfield?
Median Household Income in Brookfield is $53,653.
What is Income or Wage Gap in Brookfield?
Income or Wage Gap in Brookfield is 28.3%.
Women in Brookfield earn 71.7 cents for every dollar earned by a man.
What is Family Income Deficit in Brookfield?
Family Income Deficit in Brookfield is $14,931.
Families that are below poverty line in Brookfield earn $14,931 less on average than the poverty threshold level.
What is Inequality or Gini Index in Brookfield?
Inequality or Gini Index in Brookfield is 0.45.
What is the Total Population of Brookfield?
Total Population of Brookfield is 4,142.
What is the Total Male Population of Brookfield?
Total Male Population of Brookfield is 2,000.
What is the Total Female Population of Brookfield?
Total Female Population of Brookfield is 2,142.
What is the Ratio of Males per 100 Females in Brookfield?
There are 93.37 Males per 100 Females in Brookfield.
What is the Ratio of Females per 100 Males in Brookfield?
There are 107.10 Females per 100 Males in Brookfield.
What is the Median Population Age in Brookfield?
Median Population Age in Brookfield is 42.5 Years.
What is the Average Family Size in Brookfield
Average Family Size in Brookfield is 3.0 People.
What is the Average Household Size in Brookfield
Average Household Size in Brookfield is 2.3 People.
How Large is the Labor Force in Brookfield?
There are 1,917 People in the Labor Forcein in Brookfield.
What is the Percentage of People in the Labor Force in Brookfield?
57.6% of People are in the Labor Force in Brookfield.
What is the Unemployment Rate in Brookfield?
Unemployment Rate in Brookfield is 2.7%.