Blythedale, MO Map & Demographics
Blythedale Map
Blythedale Overview
$18,559
PER CAPITA INCOME
$32,614
AVG FAMILY INCOME
$33,984
AVG HOUSEHOLD INCOME
0.34
INEQUALITY / GINI INDEX
384
TOTAL POPULATION
238
MALE POPULATION
146
FEMALE POPULATION
163.01
MALES / 100 FEMALES
61.34
FEMALES / 100 MALES
36.8
MEDIAN AGE
4.0
AVG FAMILY SIZE
3.4
AVG HOUSEHOLD SIZE
130
LABOR FORCE [ PEOPLE ]
38.7%
PERCENT IN LABOR FORCE
3.9%
UNEMPLOYMENT RATE
Blythedale Zip Codes
Blythedale Area Codes
Income in Blythedale
Income Overview in Blythedale
Per Capita Income in Blythedale is $18,559, while median incomes of families and households are $32,614 and $33,984 respectively.
| Characteristic | Number | Measure |
| Per Capita Income | 384 | $18,559 |
| Median Family Income | 73 | $32,614 |
| Mean Family Income | 73 | $46,733 |
| Median Household Income | 113 | $33,984 |
| Mean Household Income | 113 | $48,480 |
| Income Deficit | 73 | $0 |
| Wage / Income Gap (%) | 384 | 0.00% |
| Wage / Income Gap ($) | 384 | 100.00¢ per $1 |
| Gini / Inequality Index | 384 | 0.34 |
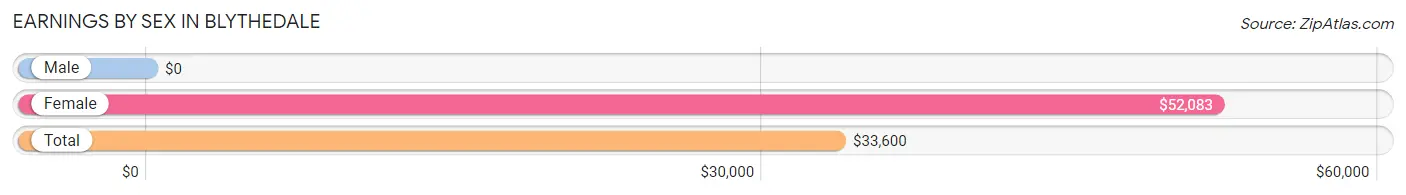
Earnings by Sex in Blythedale
| Sex | Number | Average Earnings |
| Male | 81 (56.2%) | $0 |
| Female | 63 (43.8%) | $52,083 |
| Total | 144 (100.0%) | $33,600 |
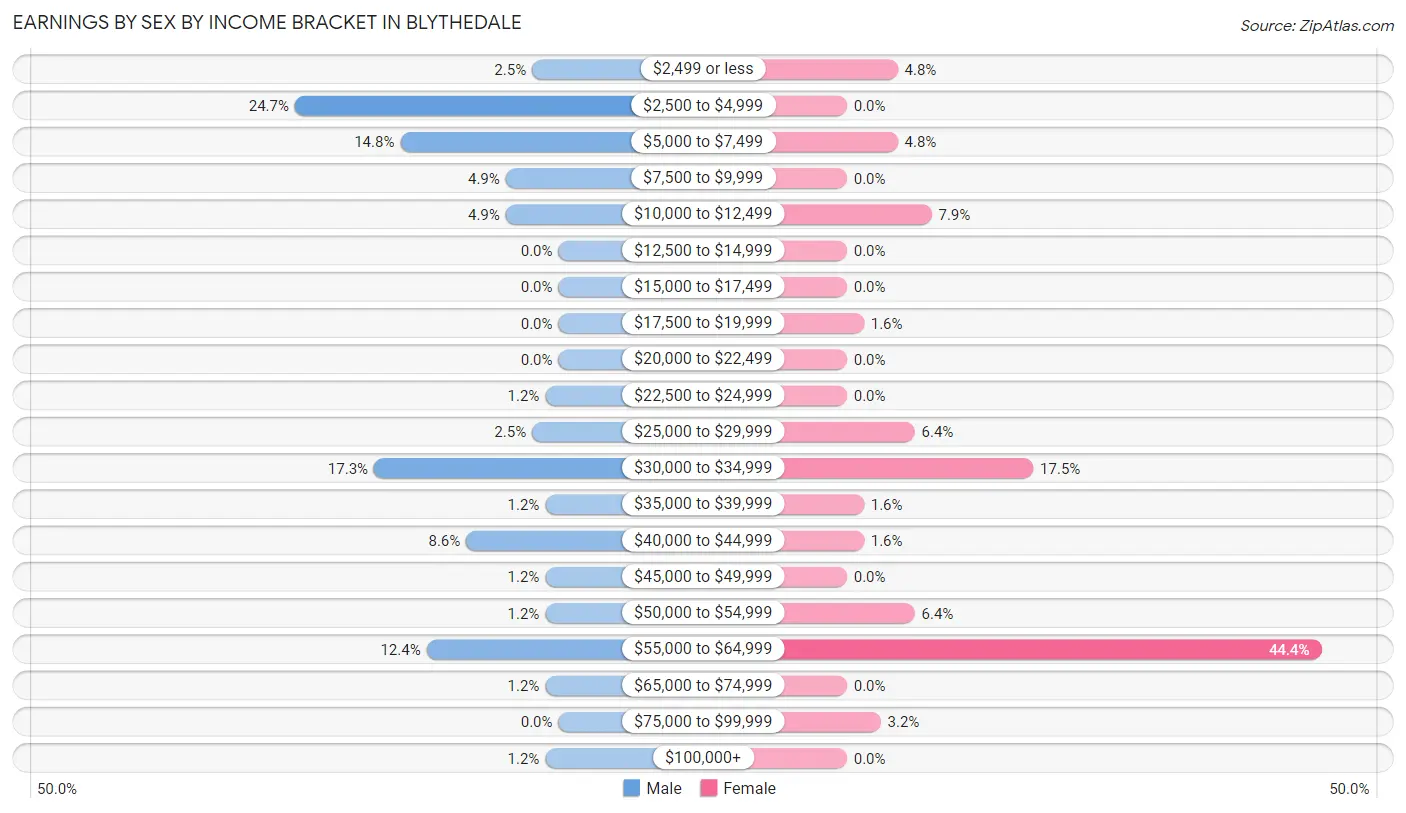
Earnings by Sex by Income Bracket in Blythedale
The most common earnings brackets in Blythedale are $2,500 to $4,999 for men (20 | 24.7%) and $55,000 to $64,999 for women (28 | 44.4%).
| Income | Male | Female |
| $2,499 or less | 2 (2.5%) | 3 (4.8%) |
| $2,500 to $4,999 | 20 (24.7%) | 0 (0.0%) |
| $5,000 to $7,499 | 12 (14.8%) | 3 (4.8%) |
| $7,500 to $9,999 | 4 (4.9%) | 0 (0.0%) |
| $10,000 to $12,499 | 4 (4.9%) | 5 (7.9%) |
| $12,500 to $14,999 | 0 (0.0%) | 0 (0.0%) |
| $15,000 to $17,499 | 0 (0.0%) | 0 (0.0%) |
| $17,500 to $19,999 | 0 (0.0%) | 1 (1.6%) |
| $20,000 to $22,499 | 0 (0.0%) | 0 (0.0%) |
| $22,500 to $24,999 | 1 (1.2%) | 0 (0.0%) |
| $25,000 to $29,999 | 2 (2.5%) | 4 (6.4%) |
| $30,000 to $34,999 | 14 (17.3%) | 11 (17.5%) |
| $35,000 to $39,999 | 1 (1.2%) | 1 (1.6%) |
| $40,000 to $44,999 | 7 (8.6%) | 1 (1.6%) |
| $45,000 to $49,999 | 1 (1.2%) | 0 (0.0%) |
| $50,000 to $54,999 | 1 (1.2%) | 4 (6.4%) |
| $55,000 to $64,999 | 10 (12.3%) | 28 (44.4%) |
| $65,000 to $74,999 | 1 (1.2%) | 0 (0.0%) |
| $75,000 to $99,999 | 0 (0.0%) | 2 (3.2%) |
| $100,000+ | 1 (1.2%) | 0 (0.0%) |
| Total | 81 (100.0%) | 63 (100.0%) |
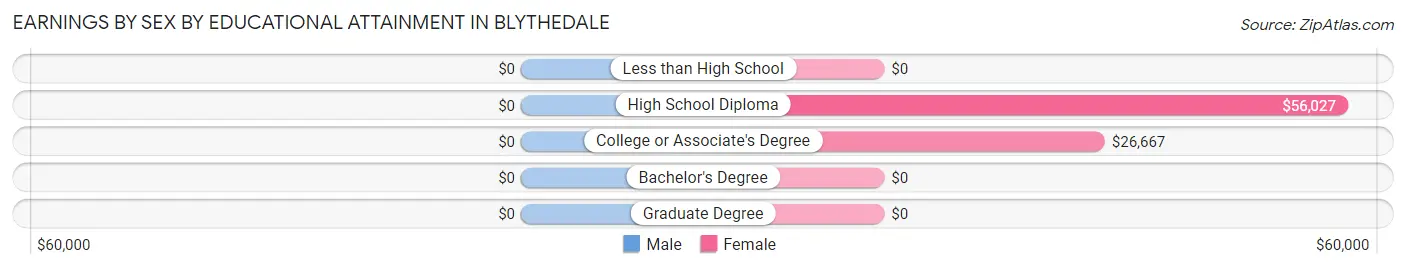
Earnings by Sex by Educational Attainment in Blythedale
| Educational Attainment | Male Income | Female Income |
| Less than High School | - | - |
| High School Diploma | - | - |
| College or Associate's Degree | - | - |
| Bachelor's Degree | - | - |
| Graduate Degree | - | - |
| Total | $33,125 | $55,179 |
Family Income in Blythedale
Family Income Brackets in Blythedale
According to the Blythedale family income data, there are 43 families falling into the $25,000 to $34,999 income range, which is the most common income bracket and makes up 58.9% of all families.
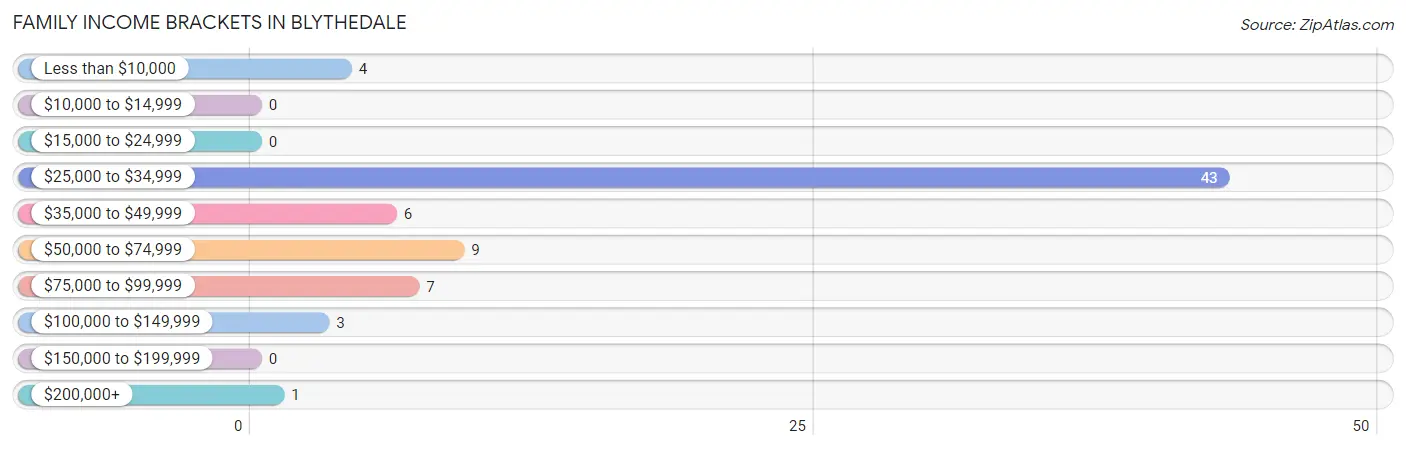
| Income Bracket | # Families | % Families |
| Less than $10,000 | 4 | 5.5% |
| $10,000 to $14,999 | 0 | 0.0% |
| $15,000 to $24,999 | 0 | 0.0% |
| $25,000 to $34,999 | 43 | 58.9% |
| $35,000 to $49,999 | 6 | 8.2% |
| $50,000 to $74,999 | 9 | 12.3% |
| $75,000 to $99,999 | 7 | 9.6% |
| $100,000 to $149,999 | 3 | 4.1% |
| $150,000 to $199,999 | 0 | 0.0% |
| $200,000+ | 1 | 1.4% |
Family Income by Famaliy Size in Blythedale
2-person families (45 | 61.6%) account for the highest median family income in Blythedale with $28,125 per family, while 2-person families (45 | 61.6%) have the highest median income of $14,062 per family member.
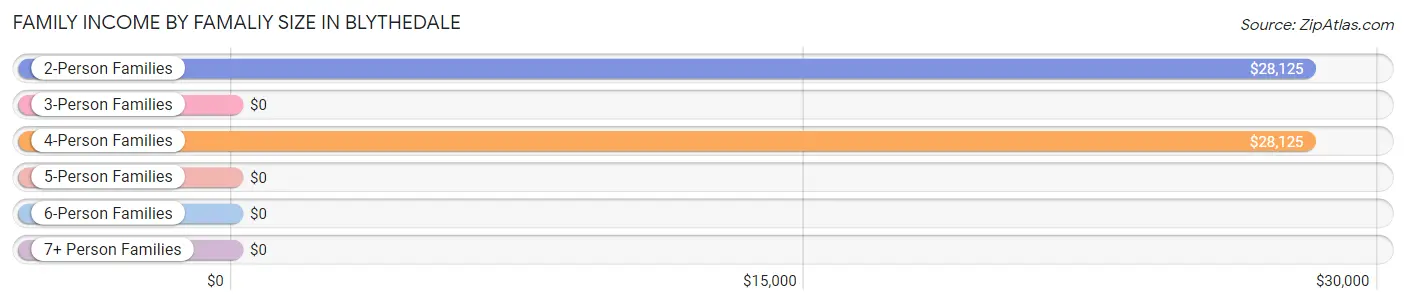
| Income Bracket | # Families | Median Income |
| 2-Person Families | 45 (61.6%) | $28,125 |
| 3-Person Families | 17 (23.3%) | $0 |
| 4-Person Families | 8 (11.0%) | $28,125 |
| 5-Person Families | 3 (4.1%) | $0 |
| 6-Person Families | 0 (0.0%) | $0 |
| 7+ Person Families | 0 (0.0%) | $0 |
| Total | 73 (100.0%) | $32,614 |
Family Income by Number of Earners in Blythedale
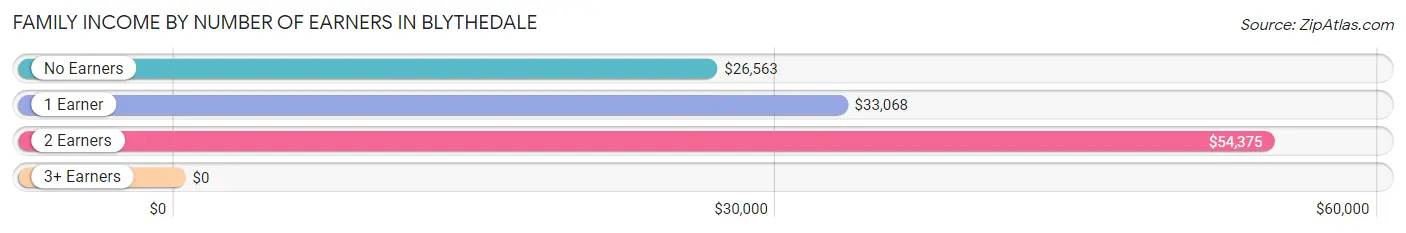
| Number of Earners | # Families | Median Income |
| No Earners | 25 (34.3%) | $26,563 |
| 1 Earner | 25 (34.3%) | $33,068 |
| 2 Earners | 23 (31.5%) | $54,375 |
| 3+ Earners | 0 (0.0%) | $0 |
| Total | 73 (100.0%) | $32,614 |
Household Income in Blythedale
Household Income Brackets in Blythedale
With 49 households falling in the category, the $25,000 to $34,999 income range is the most frequent in Blythedale, accounting for 43.4% of all households.
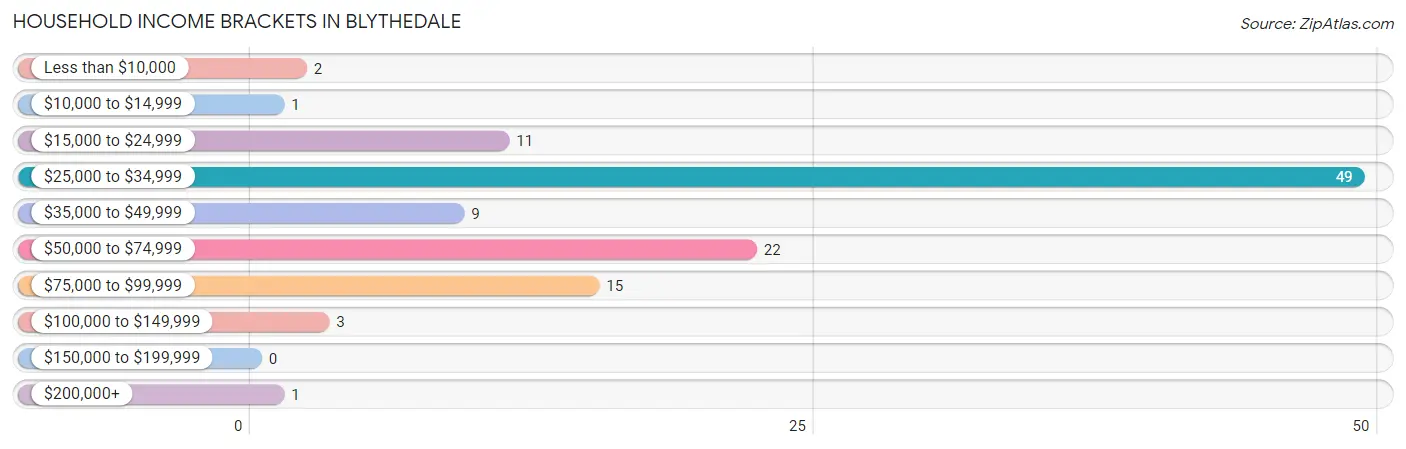
| Income Bracket | # Households | % Households |
| Less than $10,000 | 2 | 1.8% |
| $10,000 to $14,999 | 1 | 0.9% |
| $15,000 to $24,999 | 11 | 9.7% |
| $25,000 to $34,999 | 49 | 43.4% |
| $35,000 to $49,999 | 9 | 8.0% |
| $50,000 to $74,999 | 22 | 19.5% |
| $75,000 to $99,999 | 15 | 13.3% |
| $100,000 to $149,999 | 3 | 2.7% |
| $150,000 to $199,999 | 0 | 0.0% |
| $200,000+ | 1 | 0.9% |
Household Income by Householder Age in Blythedale
The median household income in Blythedale is $33,984, with the highest median household income of $58,500 found in the 25 to 44 years age bracket for the primary householder. A total of 34 households (30.1%) fall into this category. Meanwhile, the 15 to 24 years age bracket for the primary householder has the lowest median household income of $0, with 4 households (3.5%) in this group.
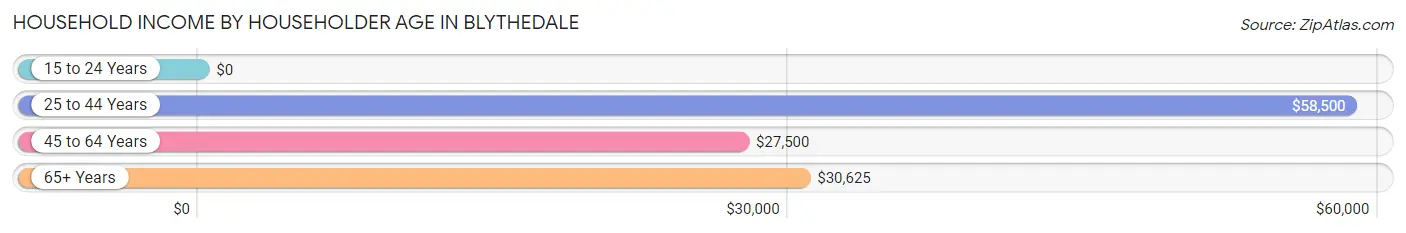
| Income Bracket | # Households | Median Income |
| 15 to 24 Years | 4 (3.5%) | $0 |
| 25 to 44 Years | 34 (30.1%) | $58,500 |
| 45 to 64 Years | 52 (46.0%) | $27,500 |
| 65+ Years | 23 (20.3%) | $30,625 |
| Total | 113 (100.0%) | $33,984 |
Poverty in Blythedale
Income Below Poverty by Sex and Age in Blythedale
With 20.6% poverty level for males and 17.1% for females among the residents of Blythedale, 12 to 14 year old males and under 5 year old females are the most vulnerable to poverty, with 14 males (93.3%) and 3 females (100.0%) in their respective age groups living below the poverty level.
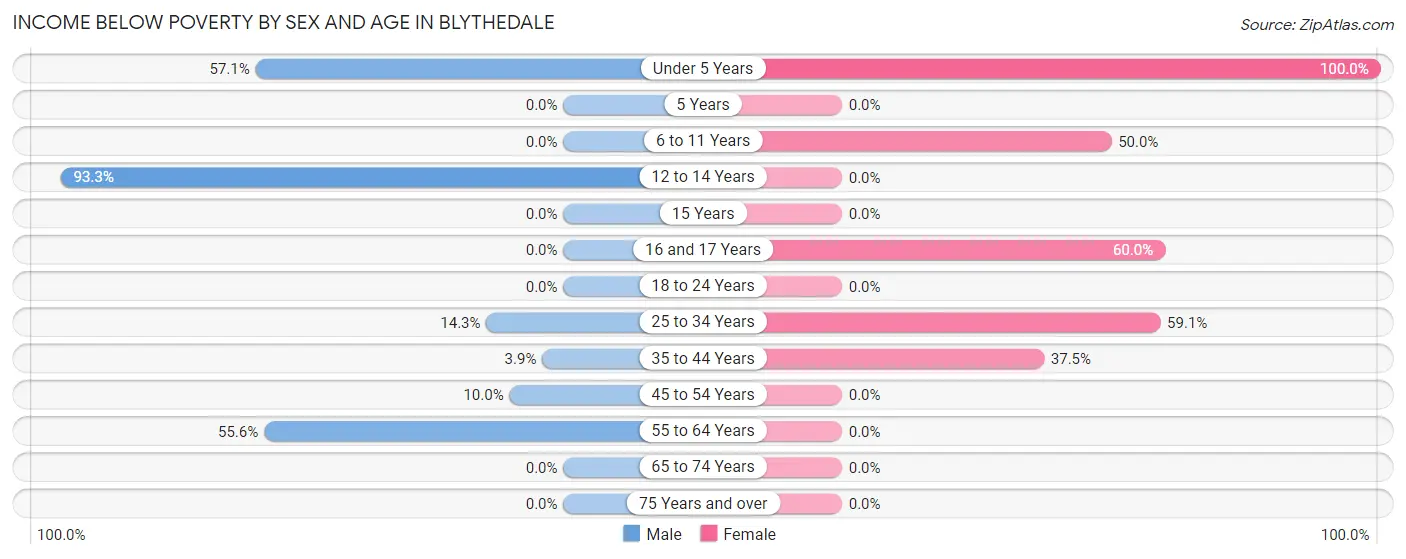
| Age Bracket | Male | Female |
| Under 5 Years | 8 (57.1%) | 3 (100.0%) |
| 5 Years | 0 (0.0%) | 0 (0.0%) |
| 6 to 11 Years | 0 (0.0%) | 3 (50.0%) |
| 12 to 14 Years | 14 (93.3%) | 0 (0.0%) |
| 15 Years | 0 (0.0%) | 0 (0.0%) |
| 16 and 17 Years | 0 (0.0%) | 3 (60.0%) |
| 18 to 24 Years | 0 (0.0%) | 0 (0.0%) |
| 25 to 34 Years | 2 (14.3%) | 13 (59.1%) |
| 35 to 44 Years | 4 (3.9%) | 3 (37.5%) |
| 45 to 54 Years | 1 (10.0%) | 0 (0.0%) |
| 55 to 64 Years | 20 (55.6%) | 0 (0.0%) |
| 65 to 74 Years | 0 (0.0%) | 0 (0.0%) |
| 75 Years and over | 0 (0.0%) | 0 (0.0%) |
| Total | 49 (20.6%) | 25 (17.1%) |
Income Above Poverty by Sex and Age in Blythedale
According to the poverty statistics in Blythedale, males aged 15 years and females aged 12 to 14 years are the age groups that are most secure financially, with 100.0% of males and 100.0% of females in these age groups living above the poverty line.
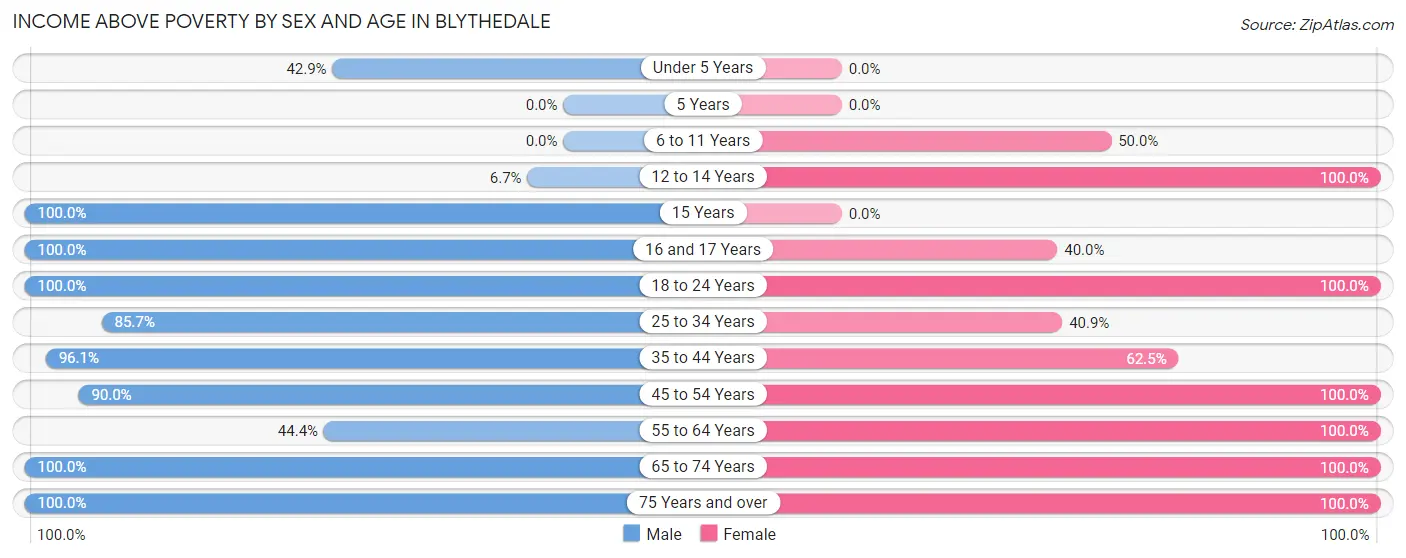
| Age Bracket | Male | Female |
| Under 5 Years | 6 (42.9%) | 0 (0.0%) |
| 5 Years | 0 (0.0%) | 0 (0.0%) |
| 6 to 11 Years | 0 (0.0%) | 3 (50.0%) |
| 12 to 14 Years | 1 (6.7%) | 1 (100.0%) |
| 15 Years | 9 (100.0%) | 0 (0.0%) |
| 16 and 17 Years | 8 (100.0%) | 2 (40.0%) |
| 18 to 24 Years | 16 (100.0%) | 4 (100.0%) |
| 25 to 34 Years | 12 (85.7%) | 9 (40.9%) |
| 35 to 44 Years | 98 (96.1%) | 5 (62.5%) |
| 45 to 54 Years | 9 (90.0%) | 9 (100.0%) |
| 55 to 64 Years | 16 (44.4%) | 50 (100.0%) |
| 65 to 74 Years | 9 (100.0%) | 33 (100.0%) |
| 75 Years and over | 5 (100.0%) | 5 (100.0%) |
| Total | 189 (79.4%) | 121 (82.9%) |
Income Below Poverty Among Married-Couple Families in Blythedale
The poverty statistics for married-couple families in Blythedale show that 25.9% or 7 of the total 27 families live below the poverty line. Families with 1 or 2 children have the highest poverty rate of 43.8%, comprising of 7 families. On the other hand, families with no children have the lowest poverty rate of 0.0%, which includes 0 families.
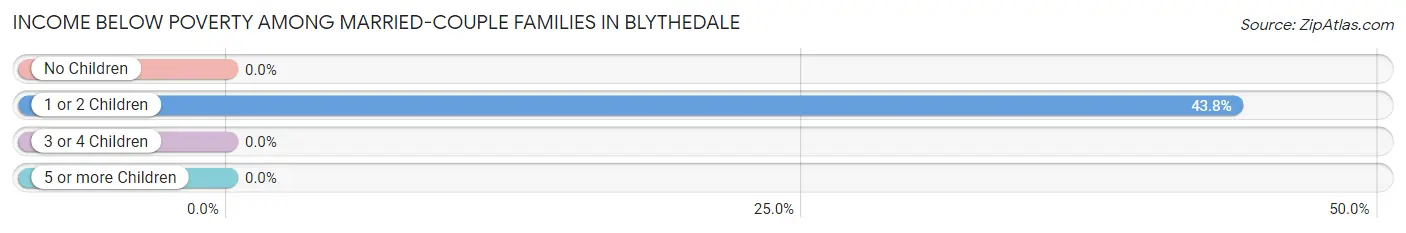
| Children | Above Poverty | Below Poverty |
| No Children | 11 (100.0%) | 0 (0.0%) |
| 1 or 2 Children | 9 (56.2%) | 7 (43.8%) |
| 3 or 4 Children | 0 (0.0%) | 0 (0.0%) |
| 5 or more Children | 0 (0.0%) | 0 (0.0%) |
| Total | 20 (74.1%) | 7 (25.9%) |
Income Below Poverty Among Single-Parent Households in Blythedale
According to the poverty data in Blythedale, 5.6% or 1 single-father households and 10.7% or 3 single-mother households are living below the poverty line. Among single-father households, those with 1 or 2 children have the highest poverty rate, with 1 households (11.1%) experiencing poverty. Likewise, among single-mother households, those with 3 or 4 children have the highest poverty rate, with 3 households (100.0%) falling below the poverty line.
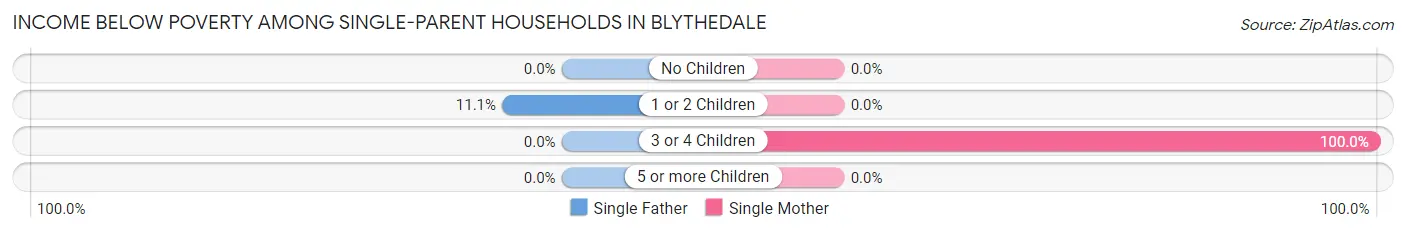
| Children | Single Father | Single Mother |
| No Children | 0 (0.0%) | 0 (0.0%) |
| 1 or 2 Children | 1 (11.1%) | 0 (0.0%) |
| 3 or 4 Children | 0 (0.0%) | 3 (100.0%) |
| 5 or more Children | 0 (0.0%) | 0 (0.0%) |
| Total | 1 (5.6%) | 3 (10.7%) |
Income Below Poverty Among Married-Couple vs Single-Parent Households in Blythedale
The poverty data for Blythedale shows that 7 of the married-couple family households (25.9%) and 4 of the single-parent households (8.7%) are living below the poverty level. Within the married-couple family households, those with 1 or 2 children have the highest poverty rate, with 7 households (43.8%) falling below the poverty line. Among the single-parent households, those with 3 or 4 children have the highest poverty rate, with 3 household (100.0%) living below poverty.
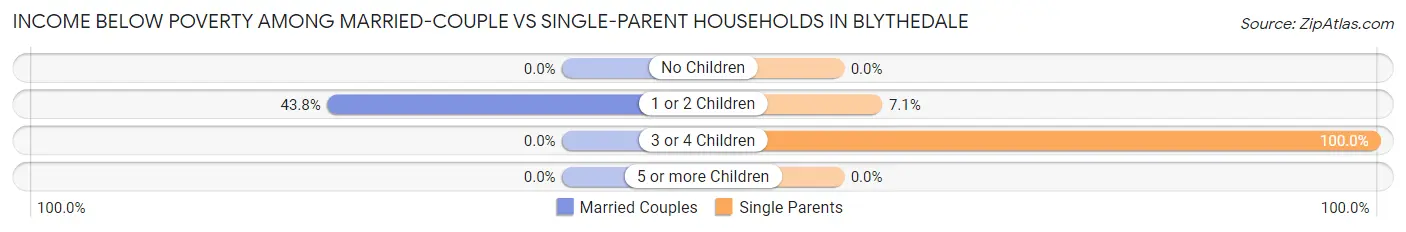
| Children | Married-Couple Families | Single-Parent Households |
| No Children | 0 (0.0%) | 0 (0.0%) |
| 1 or 2 Children | 7 (43.8%) | 1 (7.1%) |
| 3 or 4 Children | 0 (0.0%) | 3 (100.0%) |
| 5 or more Children | 0 (0.0%) | 0 (0.0%) |
| Total | 7 (25.9%) | 4 (8.7%) |
Race in Blythedale
The most populous races in Blythedale are White / Caucasian (383 | 99.7%), and Black / African American (1 | 0.3%).
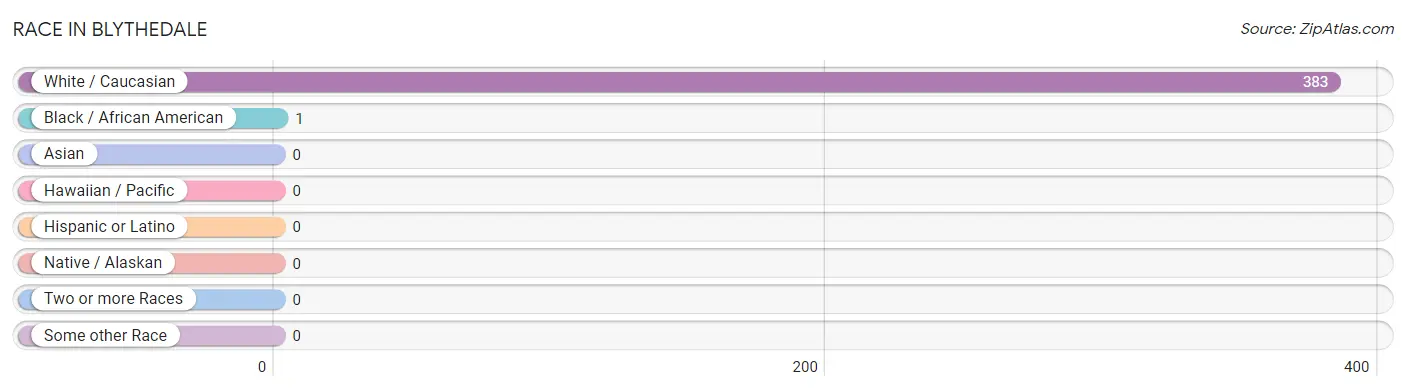
| Race | # Population | % Population |
| Asian | 0 | 0.0% |
| Black / African American | 1 | 0.3% |
| Hawaiian / Pacific | 0 | 0.0% |
| Hispanic or Latino | 0 | 0.0% |
| Native / Alaskan | 0 | 0.0% |
| White / Caucasian | 383 | 99.7% |
| Two or more Races | 0 | 0.0% |
| Some other Race | 0 | 0.0% |
| Total | 384 | 100.0% |
Ancestry in Blythedale
The most populous ancestries reported in Blythedale are American (195 | 50.8%), English (51 | 13.3%), German (29 | 7.5%), Irish (16 | 4.2%), and Italian (6 | 1.6%), together accounting for 77.3% of all Blythedale residents.
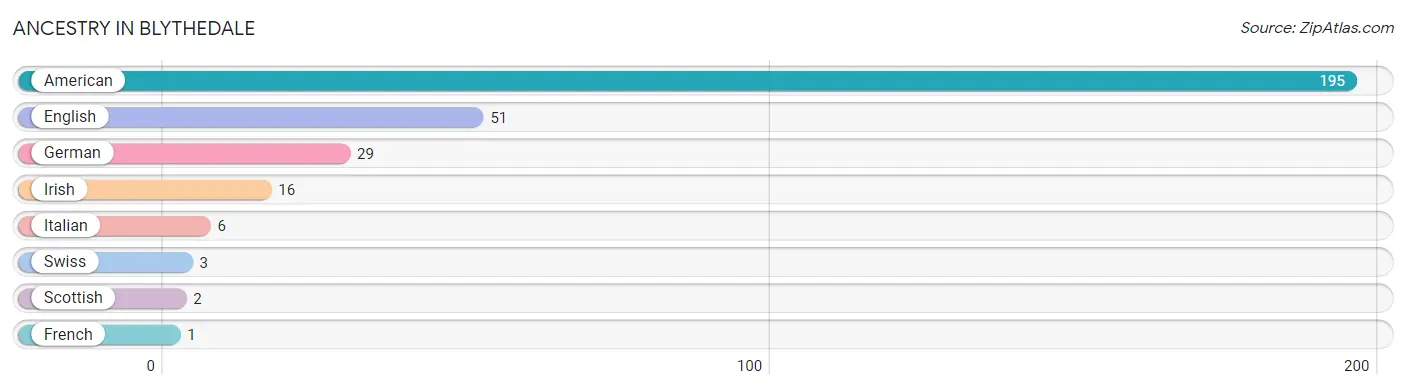
| Ancestry | # Population | % Population |
| American | 195 | 50.8% |
| English | 51 | 13.3% |
| French | 1 | 0.3% |
| German | 29 | 7.5% |
| Irish | 16 | 4.2% |
| Italian | 6 | 1.6% |
| Scottish | 2 | 0.5% |
| Swiss | 3 | 0.8% | View All 8 Rows |
Immigrants in Blythedale

| Immigration Origin | # Population | % Population | View All 0 Rows |
Sex and Age in Blythedale
Sex and Age in Blythedale
The most populous age groups in Blythedale are 35 to 39 Years (98 | 41.2%) for men and 55 to 59 Years (25 | 17.1%) for women.
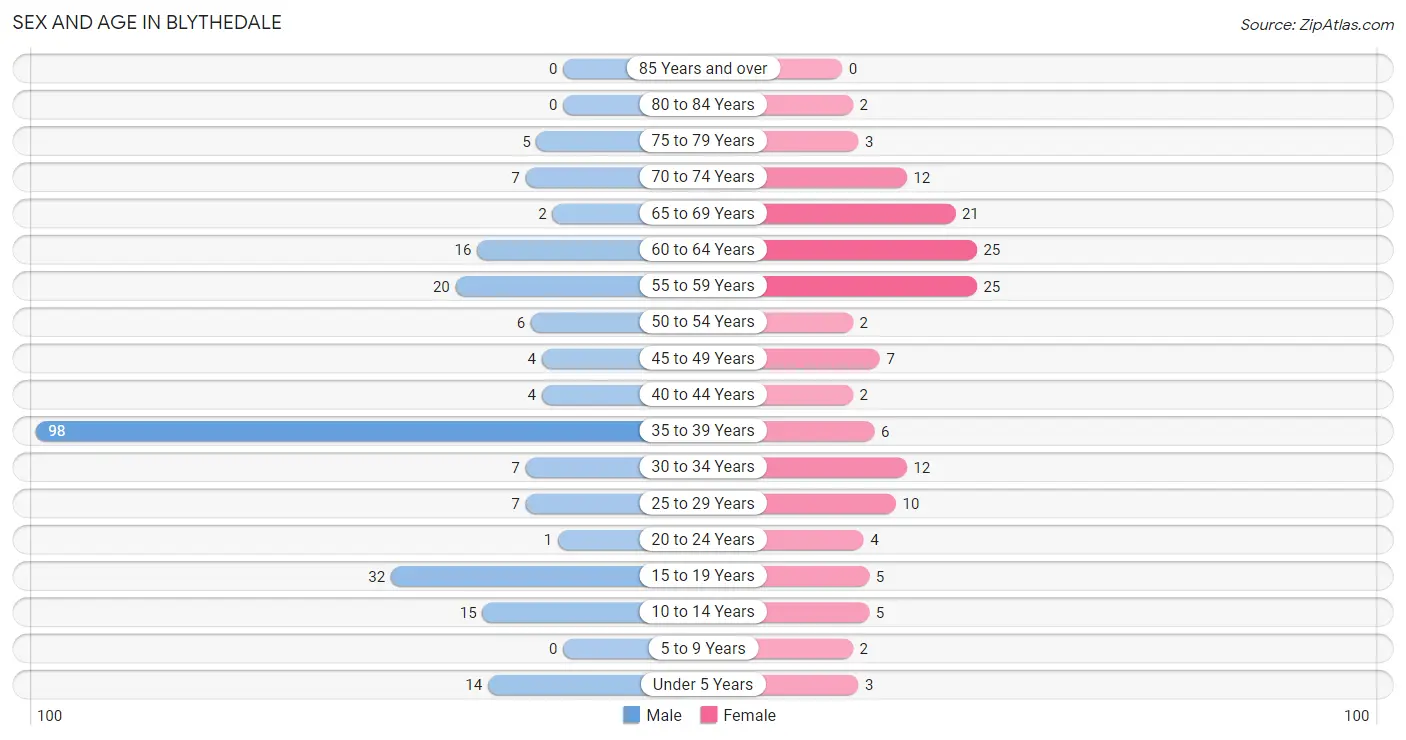
| Age Bracket | Male | Female |
| Under 5 Years | 14 (5.9%) | 3 (2.1%) |
| 5 to 9 Years | 0 (0.0%) | 2 (1.4%) |
| 10 to 14 Years | 15 (6.3%) | 5 (3.4%) |
| 15 to 19 Years | 32 (13.5%) | 5 (3.4%) |
| 20 to 24 Years | 1 (0.4%) | 4 (2.7%) |
| 25 to 29 Years | 7 (2.9%) | 10 (6.9%) |
| 30 to 34 Years | 7 (2.9%) | 12 (8.2%) |
| 35 to 39 Years | 98 (41.2%) | 6 (4.1%) |
| 40 to 44 Years | 4 (1.7%) | 2 (1.4%) |
| 45 to 49 Years | 4 (1.7%) | 7 (4.8%) |
| 50 to 54 Years | 6 (2.5%) | 2 (1.4%) |
| 55 to 59 Years | 20 (8.4%) | 25 (17.1%) |
| 60 to 64 Years | 16 (6.7%) | 25 (17.1%) |
| 65 to 69 Years | 2 (0.8%) | 21 (14.4%) |
| 70 to 74 Years | 7 (2.9%) | 12 (8.2%) |
| 75 to 79 Years | 5 (2.1%) | 3 (2.1%) |
| 80 to 84 Years | 0 (0.0%) | 2 (1.4%) |
| 85 Years and over | 0 (0.0%) | 0 (0.0%) |
| Total | 238 (100.0%) | 146 (100.0%) |
Families and Households in Blythedale
Median Family Size in Blythedale
The median family size in Blythedale is 3.99 persons per family, with single female/mother families (28 | 38.4%) accounting for the largest median family size of 4.82 persons per family. On the other hand, married-couple families (27 | 37.0%) represent the smallest median family size with 3.11 persons per family.
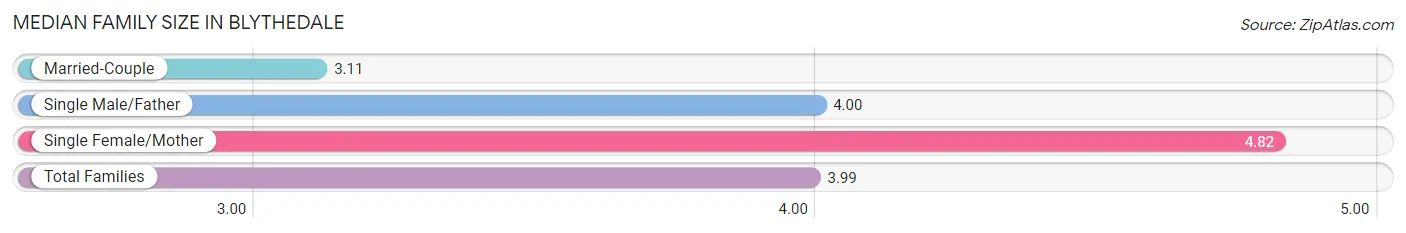
| Family Type | # Families | Family Size |
| Married-Couple | 27 (37.0%) | 3.11 |
| Single Male/Father | 18 (24.7%) | 4.00 |
| Single Female/Mother | 28 (38.4%) | 4.82 |
| Total Families | 73 (100.0%) | 3.99 |
Median Household Size in Blythedale
The median household size in Blythedale is 3.40 persons per household, with single female/mother households (28 | 24.8%) accounting for the largest median household size of 5 persons per household. non-family households (40 | 35.4%) represent the smallest median household size with 1.95 persons per household.
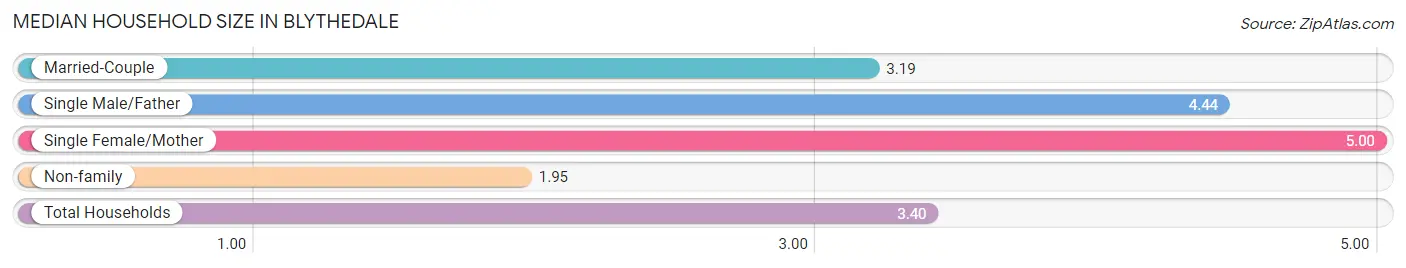
| Household Type | # Households | Household Size |
| Married-Couple | 27 (23.9%) | 3.19 |
| Single Male/Father | 18 (15.9%) | 4.44 |
| Single Female/Mother | 28 (24.8%) | 5.00 |
| Non-family | 40 (35.4%) | 1.95 |
| Total Households | 113 (100.0%) | 3.40 |
Household Size by Marriage Status in Blythedale
Out of a total of 113 households in Blythedale, 73 (64.6%) are family households, while 40 (35.4%) are nonfamily households. The most numerous type of family households are 2-person households, comprising 43, and the most common type of nonfamily households are 1-person households, comprising 33.
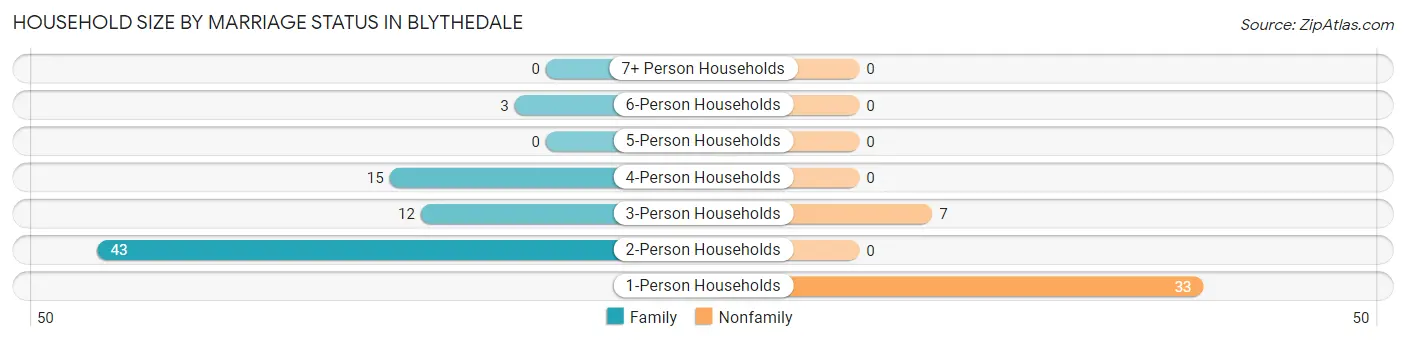
| Household Size | Family Households | Nonfamily Households |
| 1-Person Households | - | 33 (29.2%) |
| 2-Person Households | 43 (38.1%) | 0 (0.0%) |
| 3-Person Households | 12 (10.6%) | 7 (6.2%) |
| 4-Person Households | 15 (13.3%) | 0 (0.0%) |
| 5-Person Households | 0 (0.0%) | 0 (0.0%) |
| 6-Person Households | 3 (2.6%) | 0 (0.0%) |
| 7+ Person Households | 0 (0.0%) | 0 (0.0%) |
| Total | 73 (64.6%) | 40 (35.4%) |
Female Fertility in Blythedale
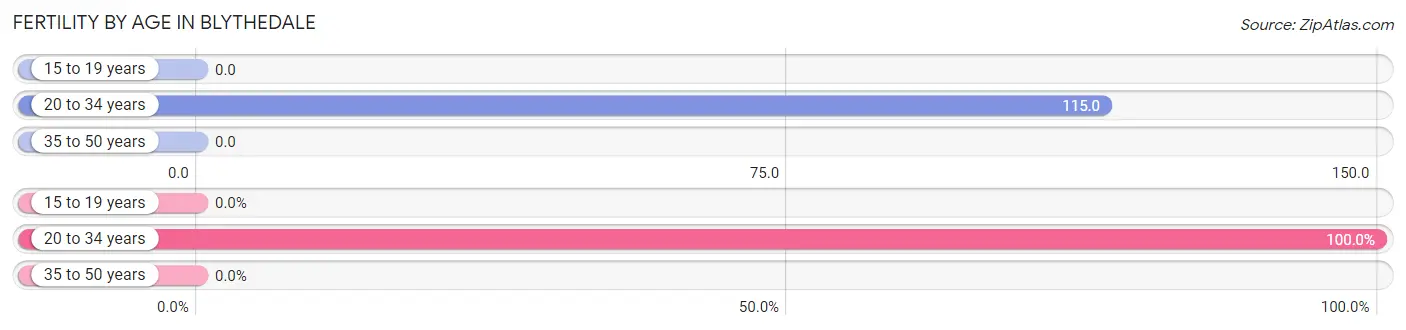
Fertility by Age in Blythedale
Average fertility rate in Blythedale is 65.0 births per 1,000 women. Women in the age bracket of 20 to 34 years have the highest fertility rate with 115.0 births per 1,000 women. Women in the age bracket of 20 to 34 years acount for 100.0% of all women with births.
| Age Bracket | Women with Births | Births / 1,000 Women |
| 15 to 19 years | 0 (0.0%) | 0.0 |
| 20 to 34 years | 3 (100.0%) | 115.0 |
| 35 to 50 years | 0 (0.0%) | 0.0 |
| Total | 3 (100.0%) | 65.0 |
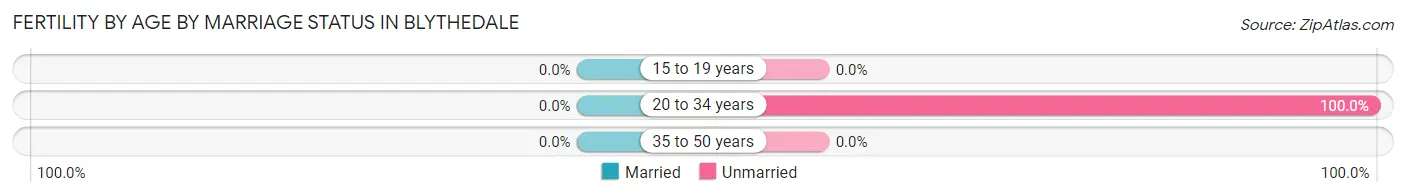
Fertility by Age by Marriage Status in Blythedale
| Age Bracket | Married | Unmarried |
| 15 to 19 years | 0 (0.0%) | 0 (0.0%) |
| 20 to 34 years | 0 (0.0%) | 3 (100.0%) |
| 35 to 50 years | 0 (0.0%) | 0 (0.0%) |
| Total | 0 (0.0%) | 3 (100.0%) |
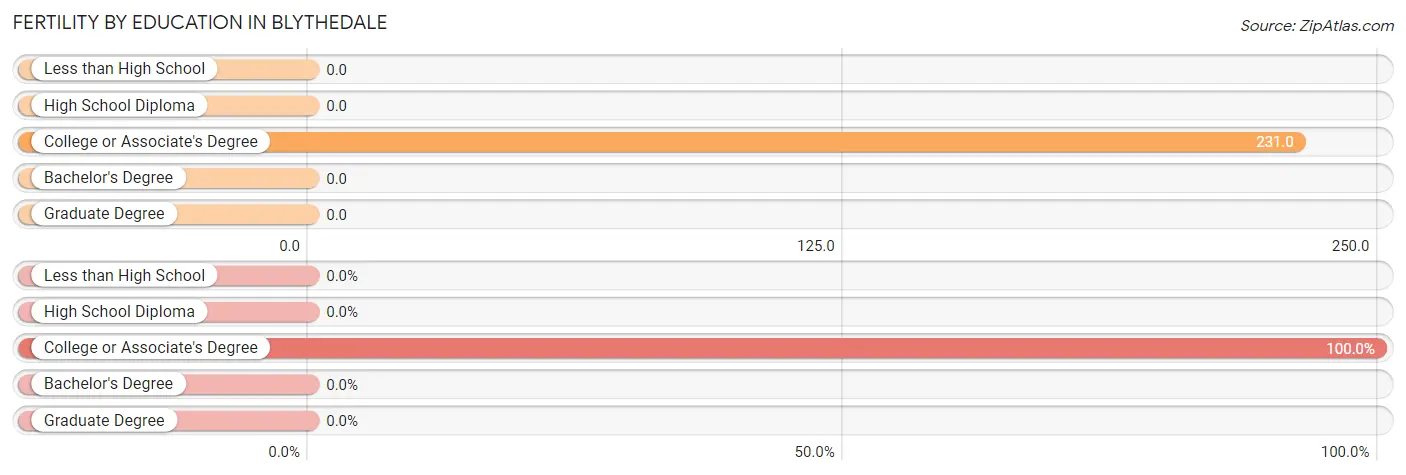
Fertility by Education in Blythedale
| Educational Attainment | Women with Births | Births / 1,000 Women |
| Less than High School | 0 (0.0%) | 0.0 |
| High School Diploma | 0 (0.0%) | 0.0 |
| College or Associate's Degree | 3 (100.0%) | 231.0 |
| Bachelor's Degree | 0 (0.0%) | 0.0 |
| Graduate Degree | 0 (0.0%) | 0.0 |
| Total | 3 (100.0%) | 65.0 |
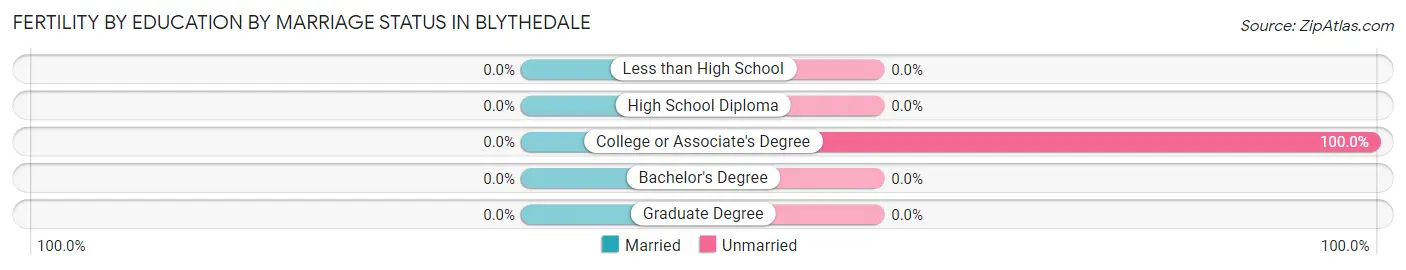
Fertility by Education by Marriage Status in Blythedale
| Educational Attainment | Married | Unmarried |
| Less than High School | 0 (0.0%) | 0 (0.0%) |
| High School Diploma | 0 (0.0%) | 0 (0.0%) |
| College or Associate's Degree | 0 (0.0%) | 3 (100.0%) |
| Bachelor's Degree | 0 (0.0%) | 0 (0.0%) |
| Graduate Degree | 0 (0.0%) | 0 (0.0%) |
| Total | 0 (0.0%) | 3 (100.0%) |
Employment Characteristics in Blythedale
Employment by Class of Employer in Blythedale
Among the 125 employed individuals in Blythedale, private company employees (99 | 79.2%), local government employees (12 | 9.6%), and self-employed (not incorporated) (7 | 5.6%) make up the most common classes of employment.
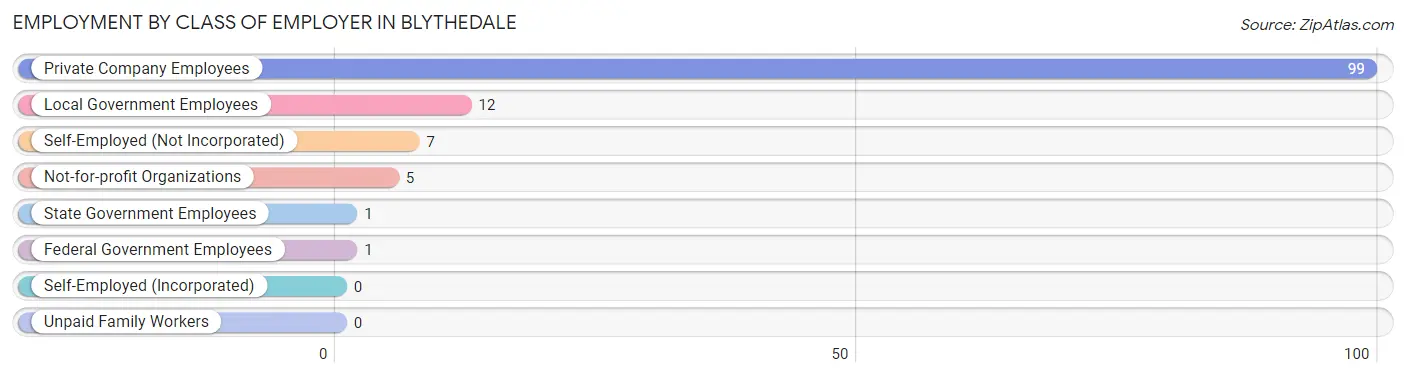
| Employer Class | # Employees | % Employees |
| Private Company Employees | 99 | 79.2% |
| Self-Employed (Incorporated) | 0 | 0.0% |
| Self-Employed (Not Incorporated) | 7 | 5.6% |
| Not-for-profit Organizations | 5 | 4.0% |
| Local Government Employees | 12 | 9.6% |
| State Government Employees | 1 | 0.8% |
| Federal Government Employees | 1 | 0.8% |
| Unpaid Family Workers | 0 | 0.0% |
| Total | 125 | 100.0% |
Employment Status by Age in Blythedale
According to the labor force statistics for Blythedale, out of the total population over 16 years of age (336), 38.7% or 130 individuals are in the labor force, with 3.9% or 5 of them unemployed. The age group with the highest labor force participation rate is 20 to 24 years, with 100.0% or 5 individuals in the labor force. Within the labor force, the 16 to 19 years age range has the highest percentage of unemployed individuals, with 57.1% or 4 of them being unemployed.
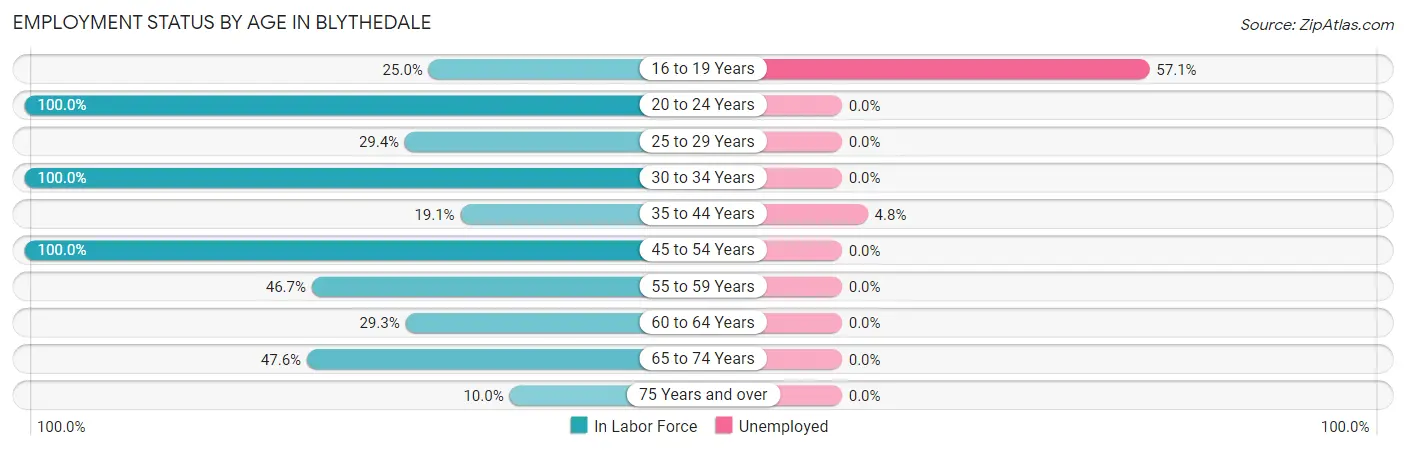
| Age Bracket | In Labor Force | Unemployed |
| 16 to 19 Years | 7 (25.0%) | 4 (57.1%) |
| 20 to 24 Years | 5 (100.0%) | 0 (0.0%) |
| 25 to 29 Years | 5 (29.4%) | 0 (0.0%) |
| 30 to 34 Years | 19 (100.0%) | 0 (0.0%) |
| 35 to 44 Years | 21 (19.1%) | 1 (4.8%) |
| 45 to 54 Years | 19 (100.0%) | 0 (0.0%) |
| 55 to 59 Years | 21 (46.7%) | 0 (0.0%) |
| 60 to 64 Years | 12 (29.3%) | 0 (0.0%) |
| 65 to 74 Years | 20 (47.6%) | 0 (0.0%) |
| 75 Years and over | 1 (10.0%) | 0 (0.0%) |
| Total | 130 (38.7%) | 5 (3.9%) |
Employment Status by Educational Attainment in Blythedale
According to labor force statistics for Blythedale, 38.6% of individuals (97) out of the total population between 25 and 64 years of age (251) are in the labor force, with 1.0% or 1 of them being unemployed. The group with the highest labor force participation rate are those with the educational attainment of bachelor's degree or higher, with 100.0% or 11 individuals in the labor force. Within the labor force, individuals with high school diploma education have the highest percentage of unemployment, with 1.7% or 1 of them being unemployed.
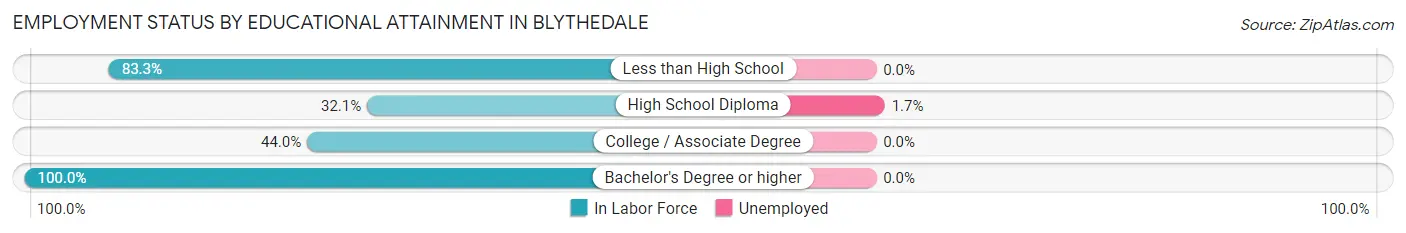
| Educational Attainment | In Labor Force | Unemployed |
| Less than High School | 5 (83.3%) | 0 (0.0%) |
| High School Diploma | 59 (32.1%) | 3 (1.7%) |
| College / Associate Degree | 22 (44.0%) | 0 (0.0%) |
| Bachelor's Degree or higher | 11 (100.0%) | 0 (0.0%) |
| Total | 97 (38.6%) | 3 (1.0%) |
Employment Occupations by Sex in Blythedale
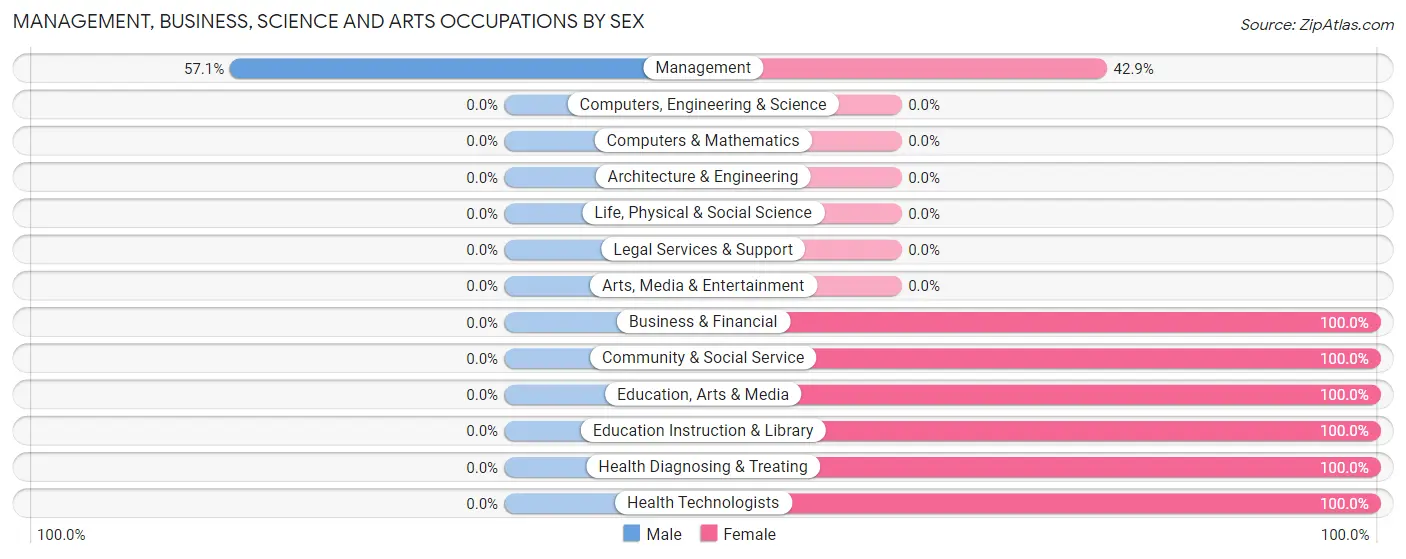
Management, Business, Science and Arts Occupations
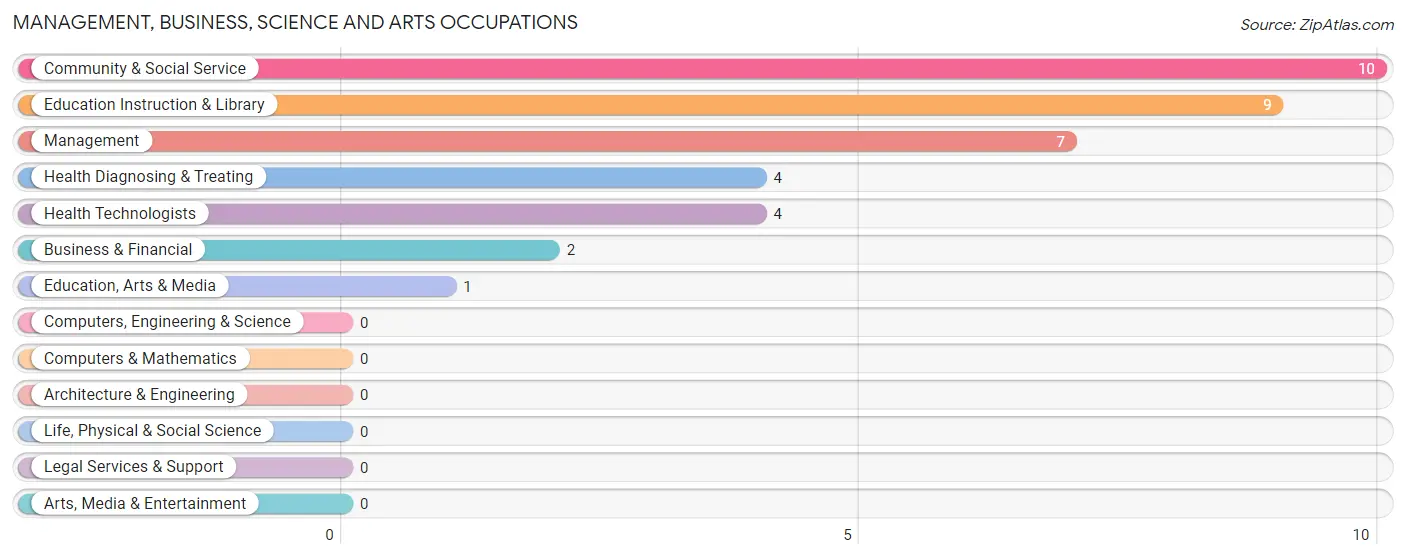
The most common Management, Business, Science and Arts occupations in Blythedale are Community & Social Service (10 | 8.1%), Education Instruction & Library (9 | 7.3%), Management (7 | 5.7%), Health Diagnosing & Treating (4 | 3.2%), and Health Technologists (4 | 3.2%).
Management, Business, Science and Arts Occupations by Sex
| Occupation | Male | Female |
| Management | 4 (57.1%) | 3 (42.9%) |
| Business & Financial | 0 (0.0%) | 2 (100.0%) |
| Computers, Engineering & Science | 0 (0.0%) | 0 (0.0%) |
| Computers & Mathematics | 0 (0.0%) | 0 (0.0%) |
| Architecture & Engineering | 0 (0.0%) | 0 (0.0%) |
| Life, Physical & Social Science | 0 (0.0%) | 0 (0.0%) |
| Community & Social Service | 0 (0.0%) | 10 (100.0%) |
| Education, Arts & Media | 0 (0.0%) | 1 (100.0%) |
| Legal Services & Support | 0 (0.0%) | 0 (0.0%) |
| Education Instruction & Library | 0 (0.0%) | 9 (100.0%) |
| Arts, Media & Entertainment | 0 (0.0%) | 0 (0.0%) |
| Health Diagnosing & Treating | 0 (0.0%) | 4 (100.0%) |
| Health Technologists | 0 (0.0%) | 4 (100.0%) |
| Total (Category) | 4 (17.4%) | 19 (82.6%) |
| Total (Overall) | 63 (50.8%) | 61 (49.2%) |
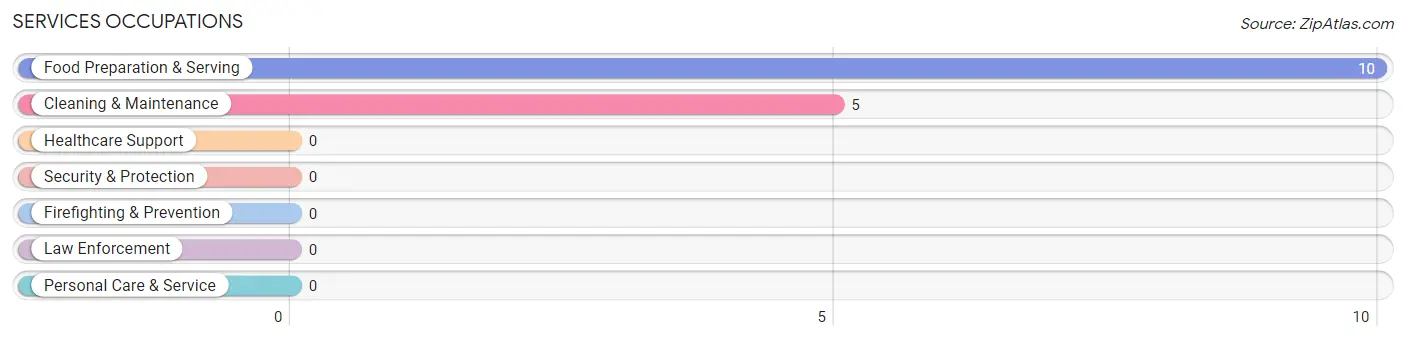
Services Occupations
The most common Services occupations in Blythedale are Food Preparation & Serving (10 | 8.1%), and Cleaning & Maintenance (5 | 4.0%).
Services Occupations by Sex
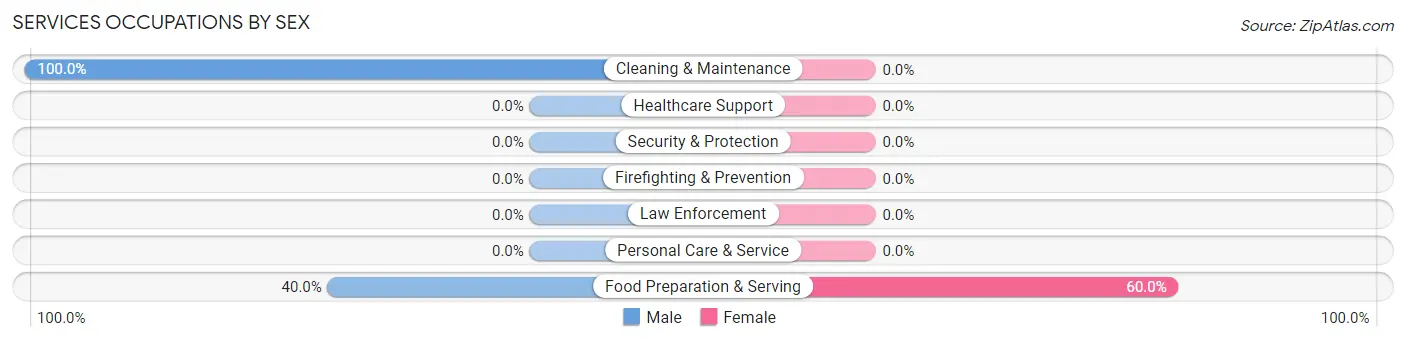
| Occupation | Male | Female |
| Healthcare Support | 0 (0.0%) | 0 (0.0%) |
| Security & Protection | 0 (0.0%) | 0 (0.0%) |
| Firefighting & Prevention | 0 (0.0%) | 0 (0.0%) |
| Law Enforcement | 0 (0.0%) | 0 (0.0%) |
| Food Preparation & Serving | 4 (40.0%) | 6 (60.0%) |
| Cleaning & Maintenance | 5 (100.0%) | 0 (0.0%) |
| Personal Care & Service | 0 (0.0%) | 0 (0.0%) |
| Total (Category) | 9 (60.0%) | 6 (40.0%) |
| Total (Overall) | 63 (50.8%) | 61 (49.2%) |
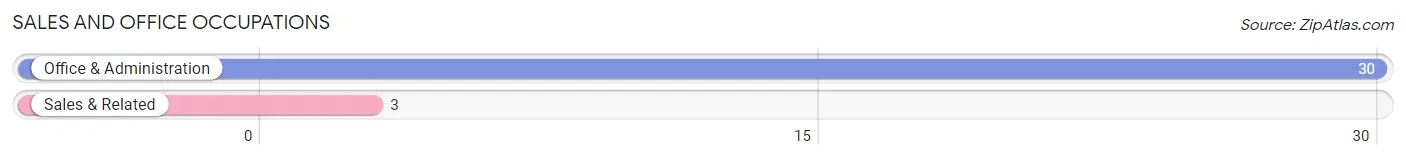
Sales and Office Occupations
The most common Sales and Office occupations in Blythedale are Office & Administration (30 | 24.2%), and Sales & Related (3 | 2.4%).
Sales and Office Occupations by Sex
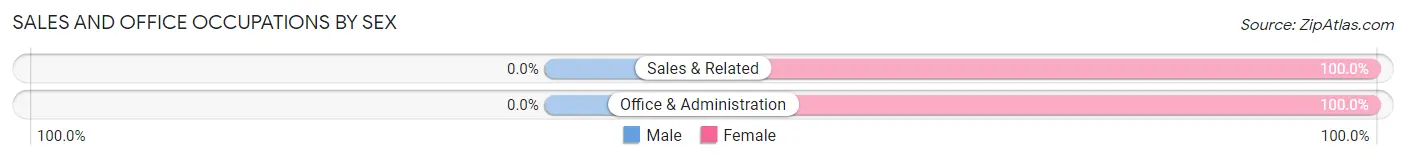
| Occupation | Male | Female |
| Sales & Related | 0 (0.0%) | 3 (100.0%) |
| Office & Administration | 0 (0.0%) | 30 (100.0%) |
| Total (Category) | 0 (0.0%) | 33 (100.0%) |
| Total (Overall) | 63 (50.8%) | 61 (49.2%) |
Natural Resources, Construction and Maintenance Occupations
The most common Natural Resources, Construction and Maintenance occupations in Blythedale are Installation, Maintenance & Repair (7 | 5.7%), and Construction & Extraction (3 | 2.4%).
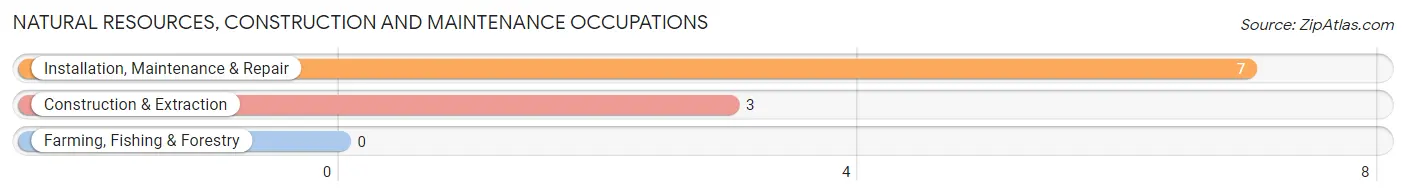
Natural Resources, Construction and Maintenance Occupations by Sex
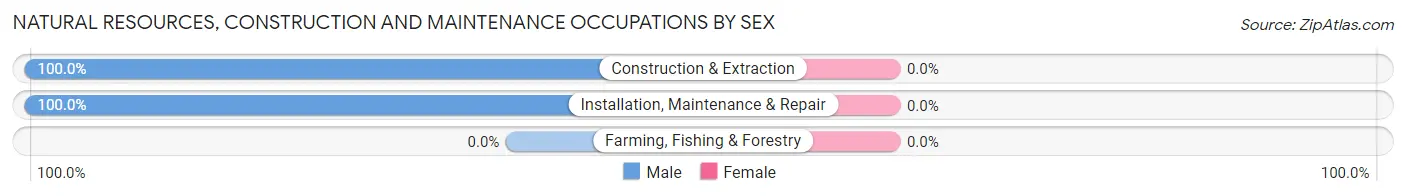
| Occupation | Male | Female |
| Farming, Fishing & Forestry | 0 (0.0%) | 0 (0.0%) |
| Construction & Extraction | 3 (100.0%) | 0 (0.0%) |
| Installation, Maintenance & Repair | 7 (100.0%) | 0 (0.0%) |
| Total (Category) | 10 (100.0%) | 0 (0.0%) |
| Total (Overall) | 63 (50.8%) | 61 (49.2%) |
Production, Transportation and Moving Occupations
The most common Production, Transportation and Moving occupations in Blythedale are Production (32 | 25.8%), Material Moving (7 | 5.7%), and Transportation (4 | 3.2%).
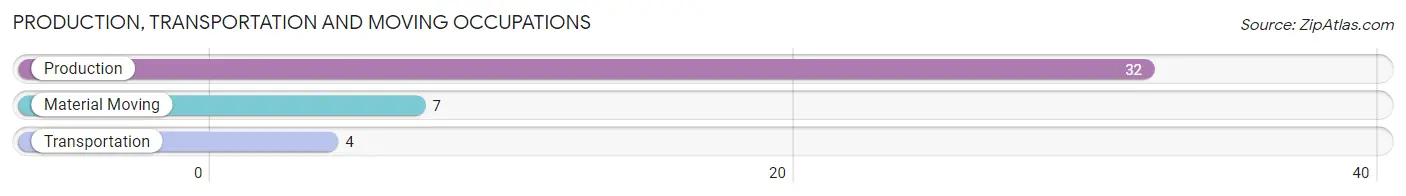
Production, Transportation and Moving Occupations by Sex
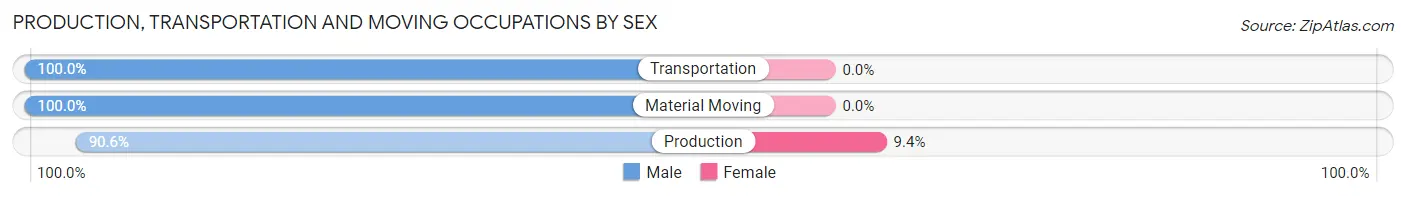
| Occupation | Male | Female |
| Production | 29 (90.6%) | 3 (9.4%) |
| Transportation | 4 (100.0%) | 0 (0.0%) |
| Material Moving | 7 (100.0%) | 0 (0.0%) |
| Total (Category) | 40 (93.0%) | 3 (7.0%) |
| Total (Overall) | 63 (50.8%) | 61 (49.2%) |
Employment Industries by Sex in Blythedale
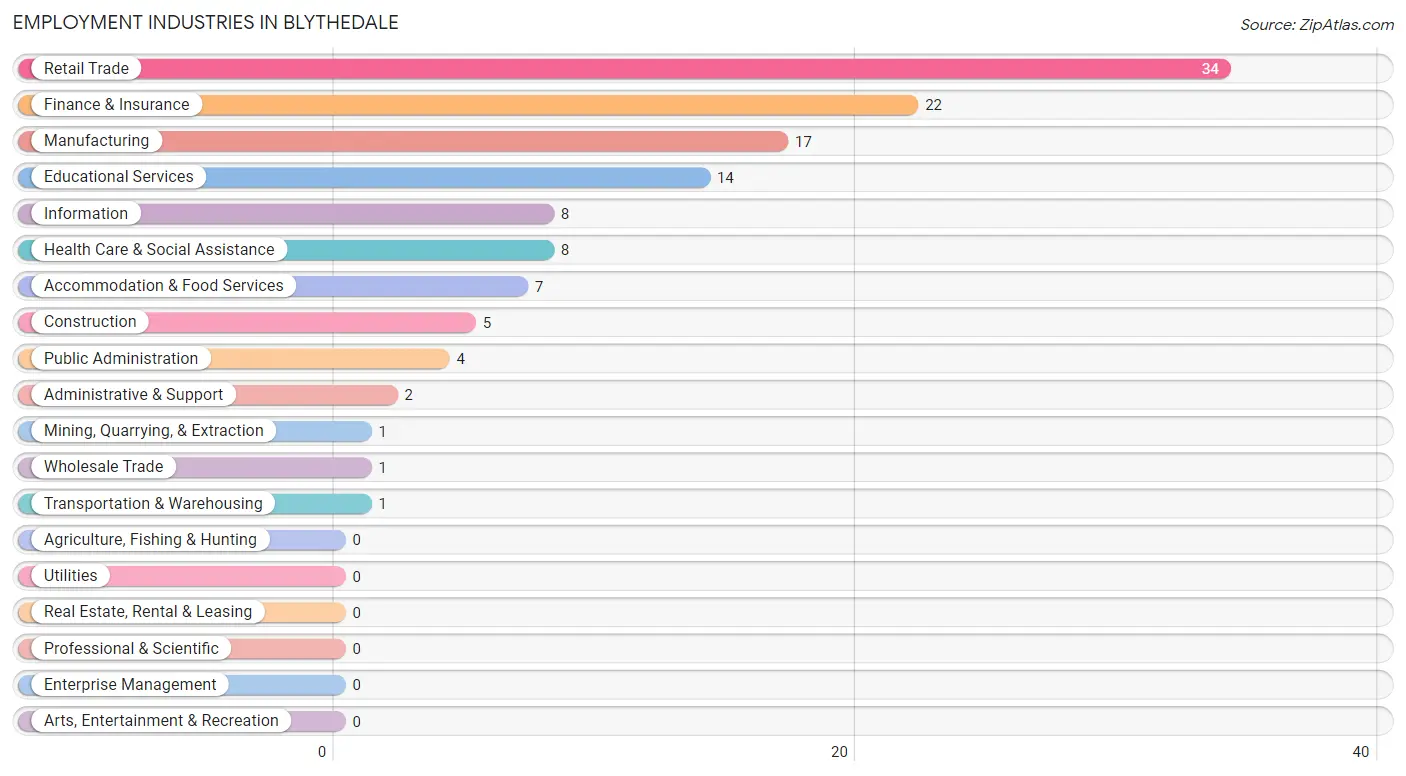
Employment Industries in Blythedale
The major employment industries in Blythedale include Retail Trade (34 | 27.4%), Finance & Insurance (22 | 17.7%), Manufacturing (17 | 13.7%), Educational Services (14 | 11.3%), and Information (8 | 6.5%).
Employment Industries by Sex in Blythedale
The Blythedale industries that see more men than women are Mining, Quarrying, & Extraction (100.0%), Construction (100.0%), and Wholesale Trade (100.0%), whereas the industries that tend to have a higher number of women are Finance & Insurance (100.0%), Administrative & Support (100.0%), and Public Administration (100.0%).
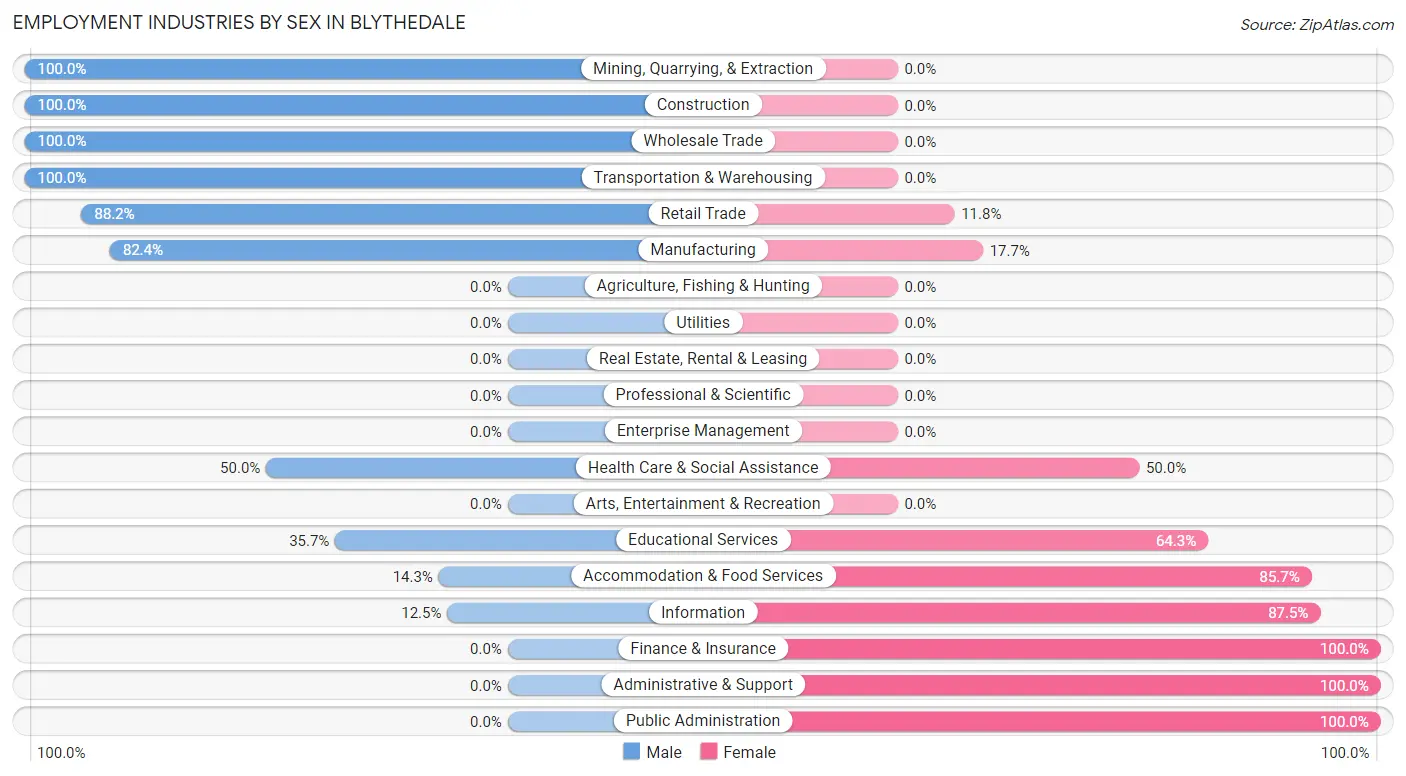
| Industry | Male | Female |
| Agriculture, Fishing & Hunting | 0 (0.0%) | 0 (0.0%) |
| Mining, Quarrying, & Extraction | 1 (100.0%) | 0 (0.0%) |
| Construction | 5 (100.0%) | 0 (0.0%) |
| Manufacturing | 14 (82.4%) | 3 (17.6%) |
| Wholesale Trade | 1 (100.0%) | 0 (0.0%) |
| Retail Trade | 30 (88.2%) | 4 (11.8%) |
| Transportation & Warehousing | 1 (100.0%) | 0 (0.0%) |
| Utilities | 0 (0.0%) | 0 (0.0%) |
| Information | 1 (12.5%) | 7 (87.5%) |
| Finance & Insurance | 0 (0.0%) | 22 (100.0%) |
| Real Estate, Rental & Leasing | 0 (0.0%) | 0 (0.0%) |
| Professional & Scientific | 0 (0.0%) | 0 (0.0%) |
| Enterprise Management | 0 (0.0%) | 0 (0.0%) |
| Administrative & Support | 0 (0.0%) | 2 (100.0%) |
| Educational Services | 5 (35.7%) | 9 (64.3%) |
| Health Care & Social Assistance | 4 (50.0%) | 4 (50.0%) |
| Arts, Entertainment & Recreation | 0 (0.0%) | 0 (0.0%) |
| Accommodation & Food Services | 1 (14.3%) | 6 (85.7%) |
| Public Administration | 0 (0.0%) | 4 (100.0%) |
| Total | 63 (50.8%) | 61 (49.2%) |
Education in Blythedale
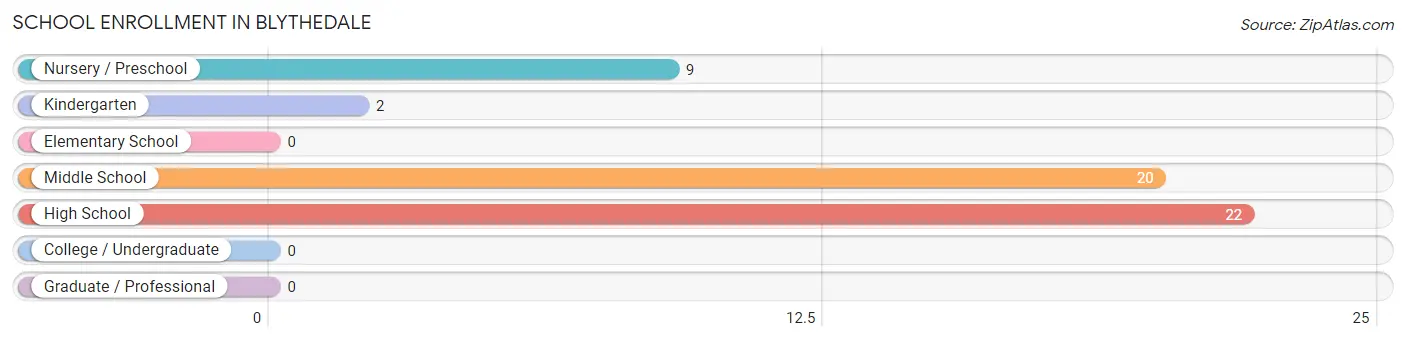
School Enrollment in Blythedale
The most common levels of schooling among the 53 students in Blythedale are high school (22 | 41.5%), middle school (20 | 37.7%), and nursery / preschool (9 | 17.0%).
| School Level | # Students | % Students |
| Nursery / Preschool | 9 | 17.0% |
| Kindergarten | 2 | 3.8% |
| Elementary School | 0 | 0.0% |
| Middle School | 20 | 37.7% |
| High School | 22 | 41.5% |
| College / Undergraduate | 0 | 0.0% |
| Graduate / Professional | 0 | 0.0% |
| Total | 53 | 100.0% |
School Enrollment by Age by Funding Source in Blythedale
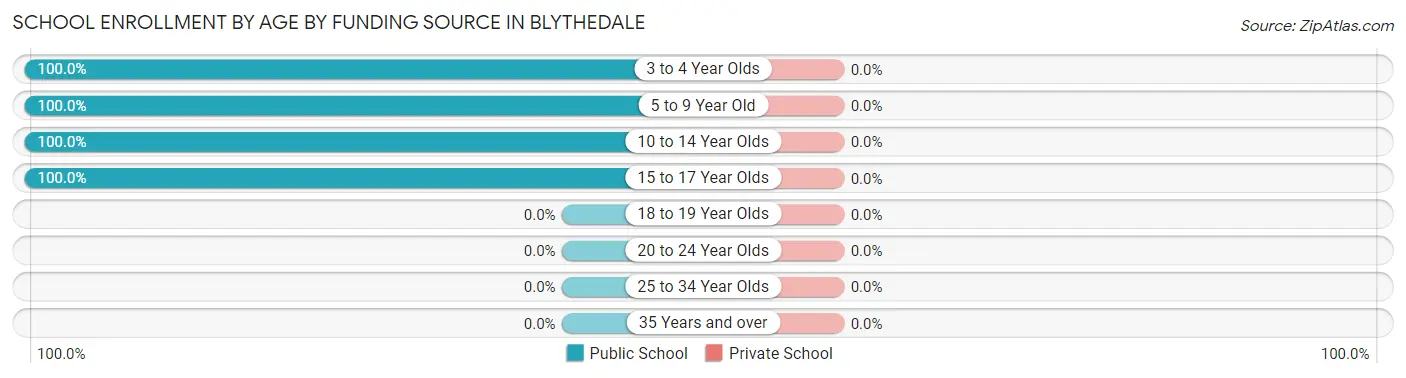
| Age Bracket | Public School | Private School |
| 3 to 4 Year Olds | 9 (100.0%) | 0 (0.0%) |
| 5 to 9 Year Old | 2 (100.0%) | 0 (0.0%) |
| 10 to 14 Year Olds | 20 (100.0%) | 0 (0.0%) |
| 15 to 17 Year Olds | 22 (100.0%) | 0 (0.0%) |
| 18 to 19 Year Olds | 0 (0.0%) | 0 (0.0%) |
| 20 to 24 Year Olds | 0 (0.0%) | 0 (0.0%) |
| 25 to 34 Year Olds | 0 (0.0%) | 0 (0.0%) |
| 35 Years and over | 0 (0.0%) | 0 (0.0%) |
| Total | 53 (100.0%) | 0 (0.0%) |
Educational Attainment by Field of Study in Blythedale
Computers & mathematics (7 | 46.7%), bio, nature & agricultural (5 | 33.3%), psychology (1 | 6.7%), business (1 | 6.7%), and education (1 | 6.7%) are the most common fields of study among 15 individuals in Blythedale who have obtained a bachelor's degree or higher.
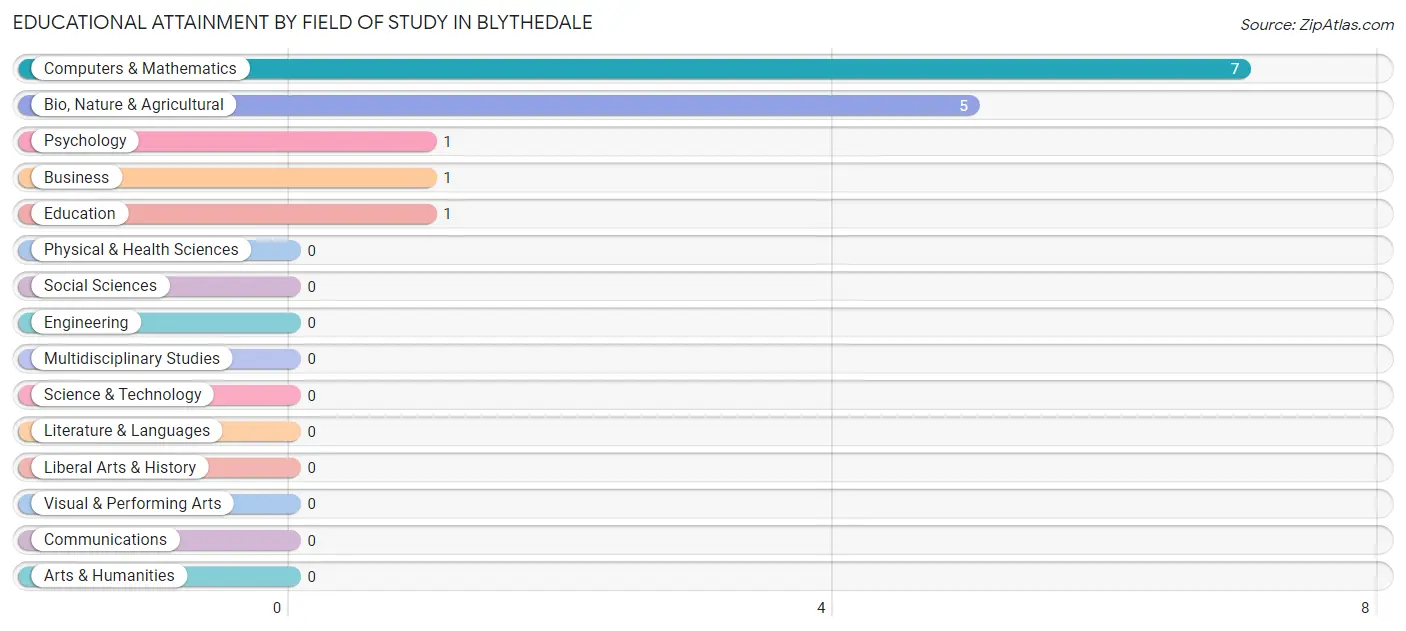
| Field of Study | # Graduates | % Graduates |
| Computers & Mathematics | 7 | 46.7% |
| Bio, Nature & Agricultural | 5 | 33.3% |
| Physical & Health Sciences | 0 | 0.0% |
| Psychology | 1 | 6.7% |
| Social Sciences | 0 | 0.0% |
| Engineering | 0 | 0.0% |
| Multidisciplinary Studies | 0 | 0.0% |
| Science & Technology | 0 | 0.0% |
| Business | 1 | 6.7% |
| Education | 1 | 6.7% |
| Literature & Languages | 0 | 0.0% |
| Liberal Arts & History | 0 | 0.0% |
| Visual & Performing Arts | 0 | 0.0% |
| Communications | 0 | 0.0% |
| Arts & Humanities | 0 | 0.0% |
| Total | 15 | 100.0% |
Transportation & Commute in Blythedale
Vehicle Availability by Sex in Blythedale
The most prevalent vehicle ownership categories in Blythedale are males with 1 vehicle (21, accounting for 32.8%) and females with 1 vehicle (35, making up 34.4%).
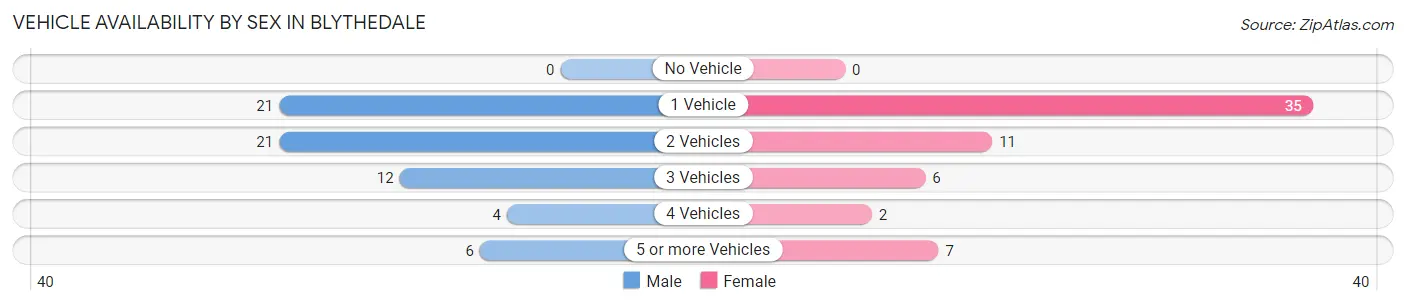
| Vehicles Available | Male | Female |
| No Vehicle | 0 (0.0%) | 0 (0.0%) |
| 1 Vehicle | 21 (32.8%) | 35 (57.4%) |
| 2 Vehicles | 21 (32.8%) | 11 (18.0%) |
| 3 Vehicles | 12 (18.8%) | 6 (9.8%) |
| 4 Vehicles | 4 (6.2%) | 2 (3.3%) |
| 5 or more Vehicles | 6 (9.4%) | 7 (11.5%) |
| Total | 64 (100.0%) | 61 (100.0%) |
Commute Time in Blythedale
The most frequently occuring commute durations in Blythedale are 15 to 19 minutes (33 commuters, 26.8%), 45 to 59 minutes (29 commuters, 23.6%), and 25 to 29 minutes (27 commuters, 22.0%).
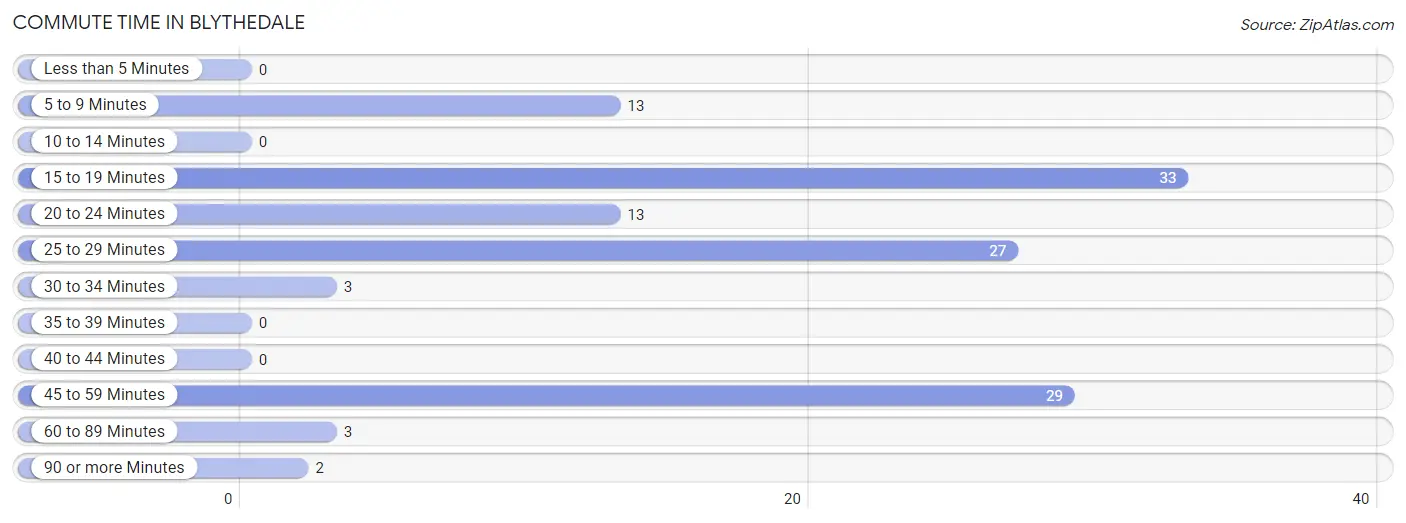
| Commute Time | # Commuters | % Commuters |
| Less than 5 Minutes | 0 | 0.0% |
| 5 to 9 Minutes | 13 | 10.6% |
| 10 to 14 Minutes | 0 | 0.0% |
| 15 to 19 Minutes | 33 | 26.8% |
| 20 to 24 Minutes | 13 | 10.6% |
| 25 to 29 Minutes | 27 | 22.0% |
| 30 to 34 Minutes | 3 | 2.4% |
| 35 to 39 Minutes | 0 | 0.0% |
| 40 to 44 Minutes | 0 | 0.0% |
| 45 to 59 Minutes | 29 | 23.6% |
| 60 to 89 Minutes | 3 | 2.4% |
| 90 or more Minutes | 2 | 1.6% |
Commute Time by Sex in Blythedale
The most common commute times in Blythedale are 15 to 19 minutes (28 commuters, 43.8%) for males and 45 to 59 minutes (25 commuters, 42.4%) for females.
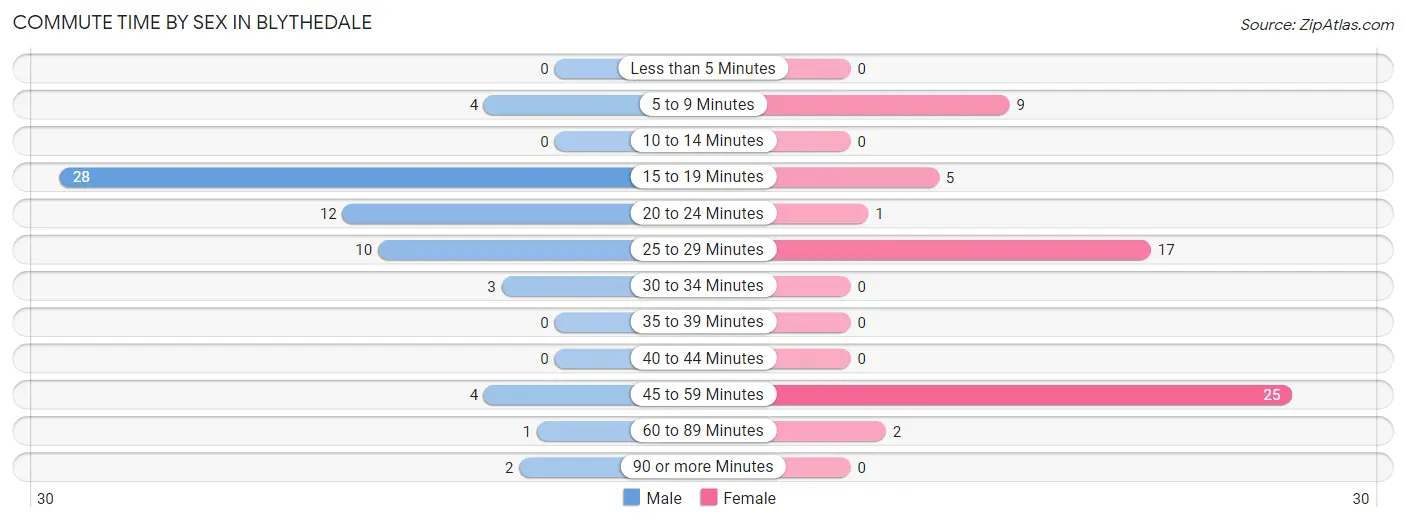
| Commute Time | Male | Female |
| Less than 5 Minutes | 0 (0.0%) | 0 (0.0%) |
| 5 to 9 Minutes | 4 (6.2%) | 9 (15.2%) |
| 10 to 14 Minutes | 0 (0.0%) | 0 (0.0%) |
| 15 to 19 Minutes | 28 (43.8%) | 5 (8.5%) |
| 20 to 24 Minutes | 12 (18.8%) | 1 (1.7%) |
| 25 to 29 Minutes | 10 (15.6%) | 17 (28.8%) |
| 30 to 34 Minutes | 3 (4.7%) | 0 (0.0%) |
| 35 to 39 Minutes | 0 (0.0%) | 0 (0.0%) |
| 40 to 44 Minutes | 0 (0.0%) | 0 (0.0%) |
| 45 to 59 Minutes | 4 (6.2%) | 25 (42.4%) |
| 60 to 89 Minutes | 1 (1.6%) | 2 (3.4%) |
| 90 or more Minutes | 2 (3.1%) | 0 (0.0%) |
Time of Departure to Work by Sex in Blythedale
The most frequent times of departure to work in Blythedale are 6:00 AM to 6:29 AM (27, 42.2%) for males and 7:30 AM to 7:59 AM (34, 57.6%) for females.
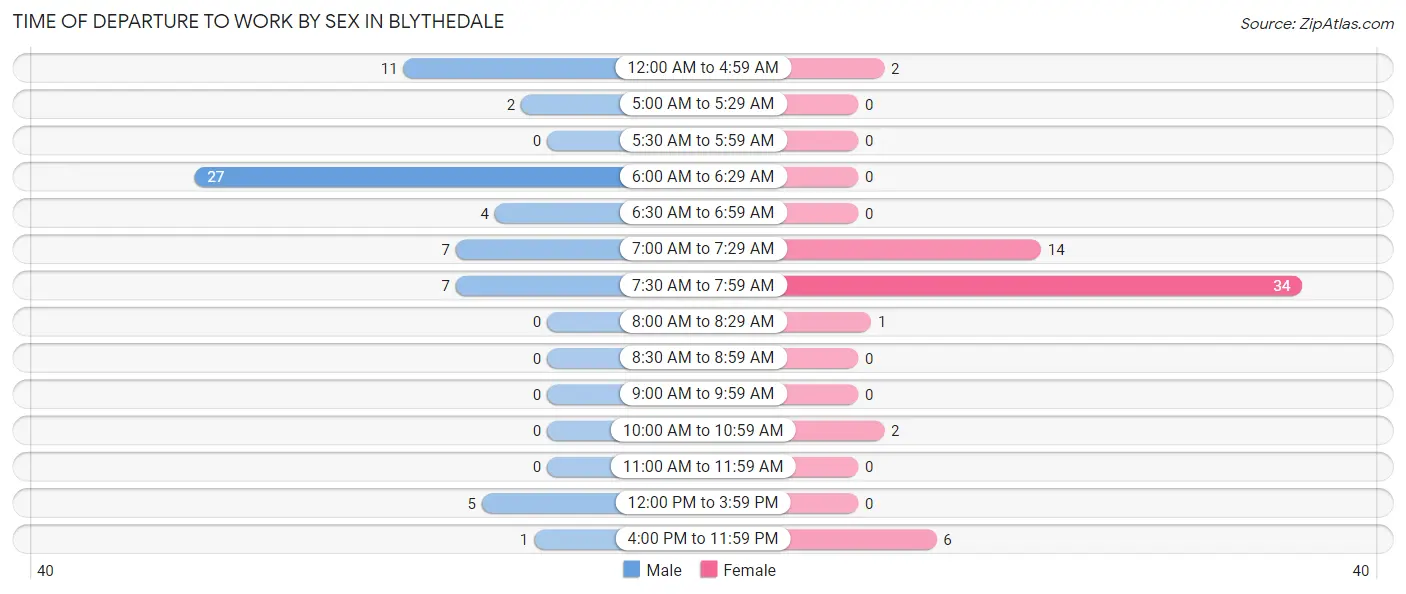
| Time of Departure | Male | Female |
| 12:00 AM to 4:59 AM | 11 (17.2%) | 2 (3.4%) |
| 5:00 AM to 5:29 AM | 2 (3.1%) | 0 (0.0%) |
| 5:30 AM to 5:59 AM | 0 (0.0%) | 0 (0.0%) |
| 6:00 AM to 6:29 AM | 27 (42.2%) | 0 (0.0%) |
| 6:30 AM to 6:59 AM | 4 (6.2%) | 0 (0.0%) |
| 7:00 AM to 7:29 AM | 7 (10.9%) | 14 (23.7%) |
| 7:30 AM to 7:59 AM | 7 (10.9%) | 34 (57.6%) |
| 8:00 AM to 8:29 AM | 0 (0.0%) | 1 (1.7%) |
| 8:30 AM to 8:59 AM | 0 (0.0%) | 0 (0.0%) |
| 9:00 AM to 9:59 AM | 0 (0.0%) | 0 (0.0%) |
| 10:00 AM to 10:59 AM | 0 (0.0%) | 2 (3.4%) |
| 11:00 AM to 11:59 AM | 0 (0.0%) | 0 (0.0%) |
| 12:00 PM to 3:59 PM | 5 (7.8%) | 0 (0.0%) |
| 4:00 PM to 11:59 PM | 1 (1.6%) | 6 (10.2%) |
| Total | 64 (100.0%) | 59 (100.0%) |
Housing Occupancy in Blythedale
Occupancy by Ownership in Blythedale
Of the total 113 dwellings in Blythedale, owner-occupied units account for 73 (64.6%), while renter-occupied units make up 40 (35.4%).
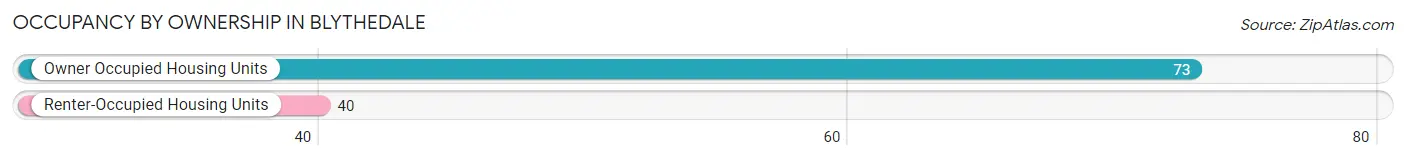
| Occupancy | # Housing Units | % Housing Units |
| Owner Occupied Housing Units | 73 | 64.6% |
| Renter-Occupied Housing Units | 40 | 35.4% |
| Total Occupied Housing Units | 113 | 100.0% |
Occupancy by Household Size in Blythedale
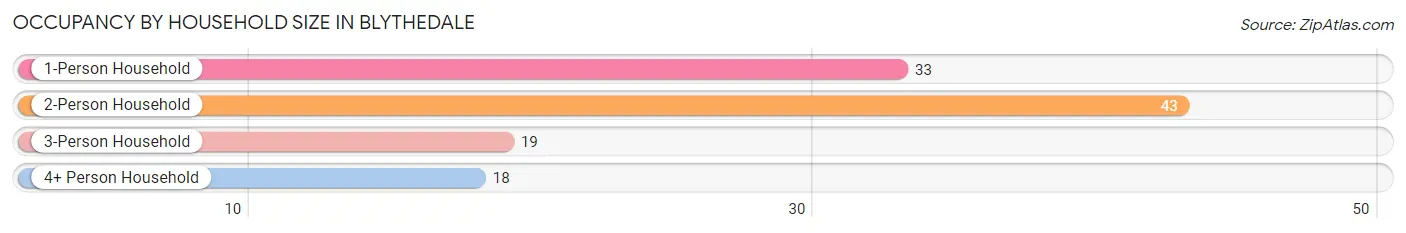
| Household Size | # Housing Units | % Housing Units |
| 1-Person Household | 33 | 29.2% |
| 2-Person Household | 43 | 38.1% |
| 3-Person Household | 19 | 16.8% |
| 4+ Person Household | 18 | 15.9% |
| Total Housing Units | 113 | 100.0% |
Occupancy by Ownership by Household Size in Blythedale
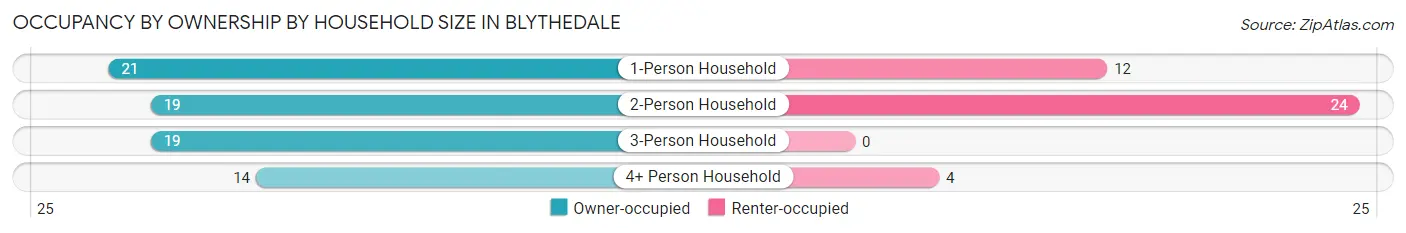
| Household Size | Owner-occupied | Renter-occupied |
| 1-Person Household | 21 (63.6%) | 12 (36.4%) |
| 2-Person Household | 19 (44.2%) | 24 (55.8%) |
| 3-Person Household | 19 (100.0%) | 0 (0.0%) |
| 4+ Person Household | 14 (77.8%) | 4 (22.2%) |
| Total Housing Units | 73 (64.6%) | 40 (35.4%) |
Occupancy by Educational Attainment in Blythedale
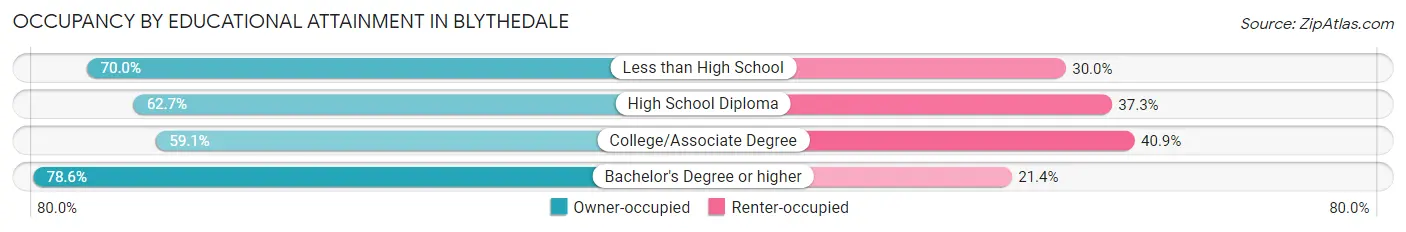
| Household Size | Owner-occupied | Renter-occupied |
| Less than High School | 7 (70.0%) | 3 (30.0%) |
| High School Diploma | 42 (62.7%) | 25 (37.3%) |
| College/Associate Degree | 13 (59.1%) | 9 (40.9%) |
| Bachelor's Degree or higher | 11 (78.6%) | 3 (21.4%) |
Occupancy by Age of Householder in Blythedale
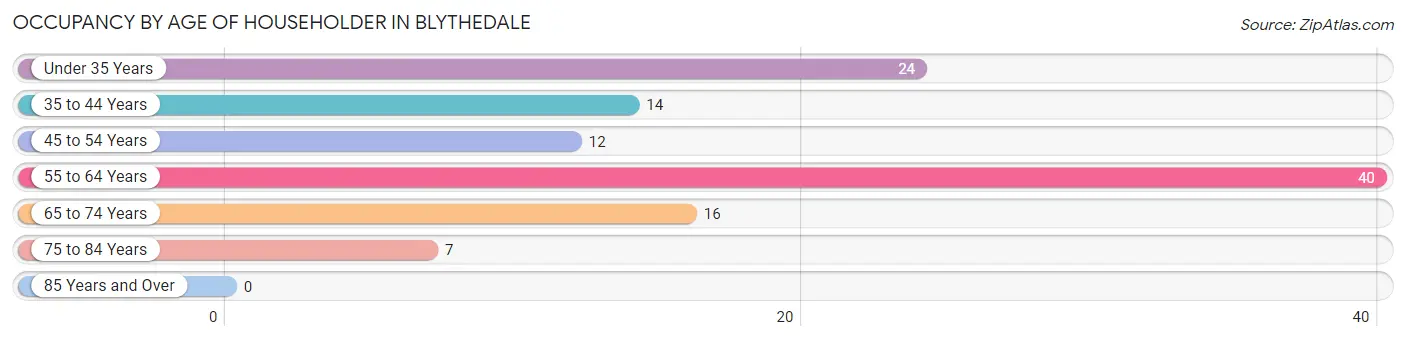
| Age Bracket | # Households | % Households |
| Under 35 Years | 24 | 21.2% |
| 35 to 44 Years | 14 | 12.4% |
| 45 to 54 Years | 12 | 10.6% |
| 55 to 64 Years | 40 | 35.4% |
| 65 to 74 Years | 16 | 14.2% |
| 75 to 84 Years | 7 | 6.2% |
| 85 Years and Over | 0 | 0.0% |
| Total | 113 | 100.0% |
Housing Finances in Blythedale
Median Income by Occupancy in Blythedale
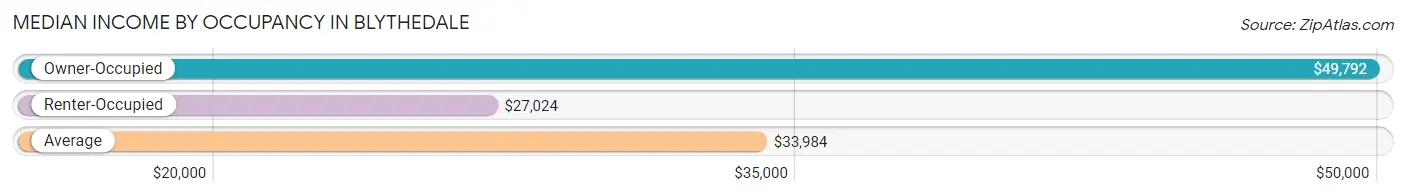
| Occupancy Type | # Households | Median Income |
| Owner-Occupied | 73 (64.6%) | $49,792 |
| Renter-Occupied | 40 (35.4%) | $27,024 |
| Average | 113 (100.0%) | $33,984 |
Occupancy by Householder Income Bracket in Blythedale
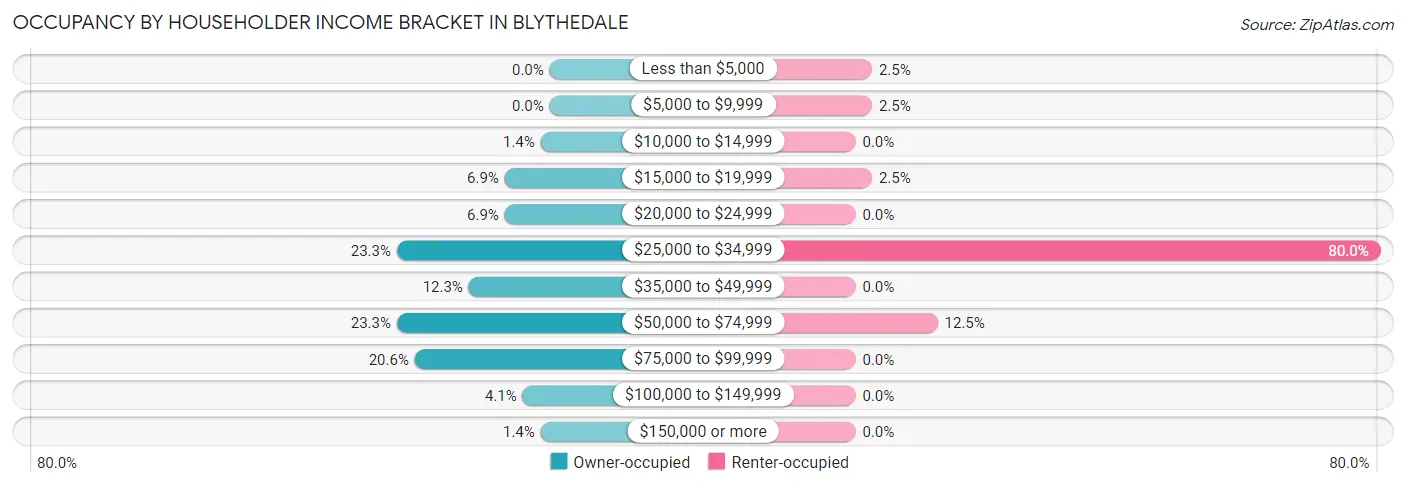
| Income Bracket | Owner-occupied | Renter-occupied |
| Less than $5,000 | 0 (0.0%) | 1 (2.5%) |
| $5,000 to $9,999 | 0 (0.0%) | 1 (2.5%) |
| $10,000 to $14,999 | 1 (1.4%) | 0 (0.0%) |
| $15,000 to $19,999 | 5 (6.9%) | 1 (2.5%) |
| $20,000 to $24,999 | 5 (6.9%) | 0 (0.0%) |
| $25,000 to $34,999 | 17 (23.3%) | 32 (80.0%) |
| $35,000 to $49,999 | 9 (12.3%) | 0 (0.0%) |
| $50,000 to $74,999 | 17 (23.3%) | 5 (12.5%) |
| $75,000 to $99,999 | 15 (20.5%) | 0 (0.0%) |
| $100,000 to $149,999 | 3 (4.1%) | 0 (0.0%) |
| $150,000 or more | 1 (1.4%) | 0 (0.0%) |
| Total | 73 (100.0%) | 40 (100.0%) |
Monthly Housing Cost Tiers in Blythedale
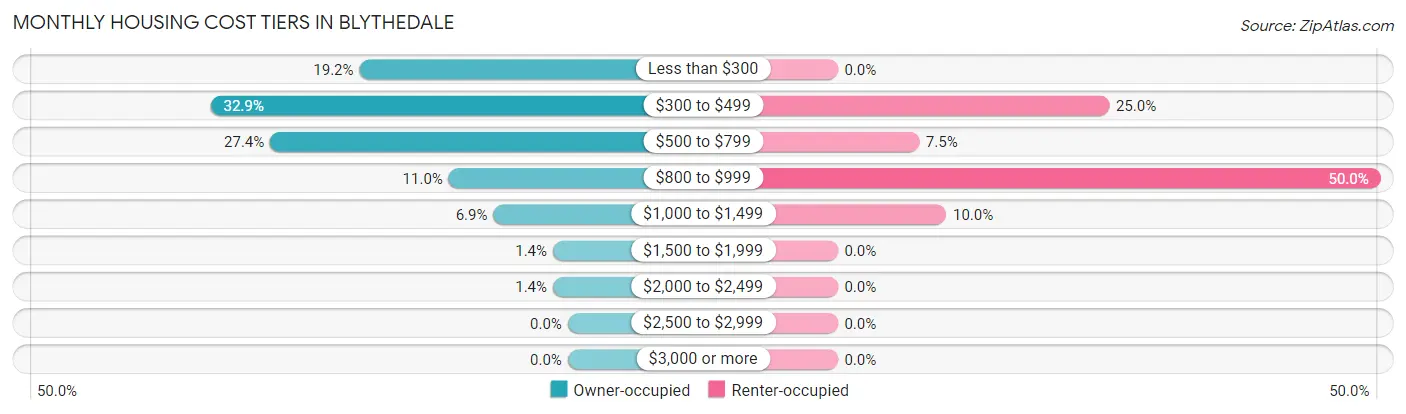
| Monthly Cost | Owner-occupied | Renter-occupied |
| Less than $300 | 14 (19.2%) | 0 (0.0%) |
| $300 to $499 | 24 (32.9%) | 10 (25.0%) |
| $500 to $799 | 20 (27.4%) | 3 (7.5%) |
| $800 to $999 | 8 (11.0%) | 20 (50.0%) |
| $1,000 to $1,499 | 5 (6.9%) | 4 (10.0%) |
| $1,500 to $1,999 | 1 (1.4%) | 0 (0.0%) |
| $2,000 to $2,499 | 1 (1.4%) | 0 (0.0%) |
| $2,500 to $2,999 | 0 (0.0%) | 0 (0.0%) |
| $3,000 or more | 0 (0.0%) | 0 (0.0%) |
| Total | 73 (100.0%) | 40 (100.0%) |
Physical Housing Characteristics in Blythedale
Housing Structures in Blythedale
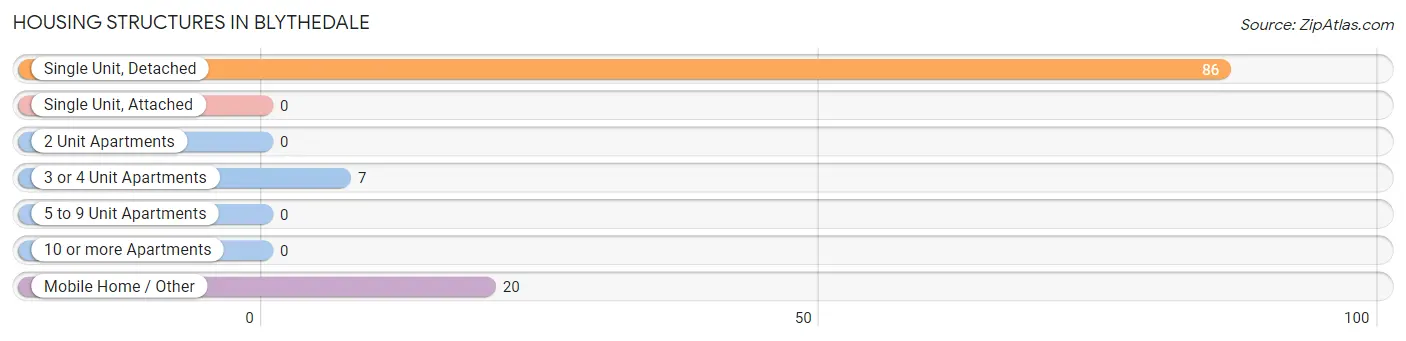
| Structure Type | # Housing Units | % Housing Units |
| Single Unit, Detached | 86 | 76.1% |
| Single Unit, Attached | 0 | 0.0% |
| 2 Unit Apartments | 0 | 0.0% |
| 3 or 4 Unit Apartments | 7 | 6.2% |
| 5 to 9 Unit Apartments | 0 | 0.0% |
| 10 or more Apartments | 0 | 0.0% |
| Mobile Home / Other | 20 | 17.7% |
| Total | 113 | 100.0% |
Housing Structures by Occupancy in Blythedale
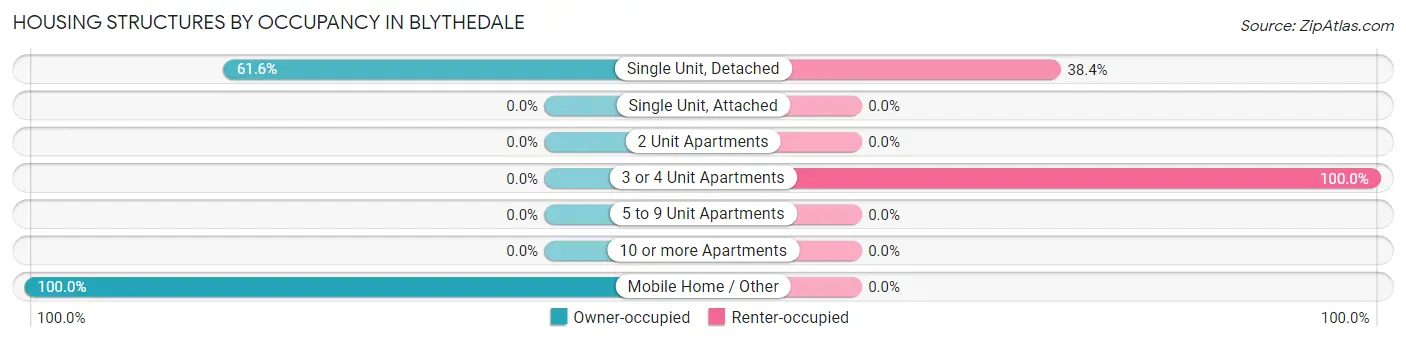
| Structure Type | Owner-occupied | Renter-occupied |
| Single Unit, Detached | 53 (61.6%) | 33 (38.4%) |
| Single Unit, Attached | 0 (0.0%) | 0 (0.0%) |
| 2 Unit Apartments | 0 (0.0%) | 0 (0.0%) |
| 3 or 4 Unit Apartments | 0 (0.0%) | 7 (100.0%) |
| 5 to 9 Unit Apartments | 0 (0.0%) | 0 (0.0%) |
| 10 or more Apartments | 0 (0.0%) | 0 (0.0%) |
| Mobile Home / Other | 20 (100.0%) | 0 (0.0%) |
| Total | 73 (64.6%) | 40 (35.4%) |
Housing Structures by Number of Rooms in Blythedale
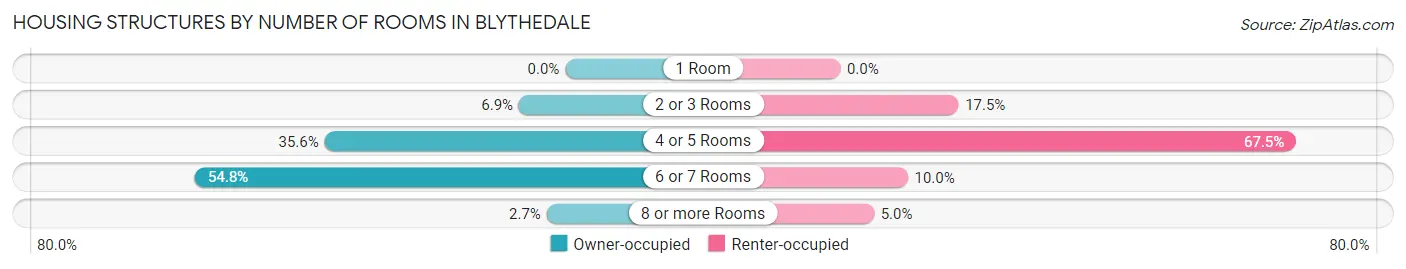
| Number of Rooms | Owner-occupied | Renter-occupied |
| 1 Room | 0 (0.0%) | 0 (0.0%) |
| 2 or 3 Rooms | 5 (6.9%) | 7 (17.5%) |
| 4 or 5 Rooms | 26 (35.6%) | 27 (67.5%) |
| 6 or 7 Rooms | 40 (54.8%) | 4 (10.0%) |
| 8 or more Rooms | 2 (2.7%) | 2 (5.0%) |
| Total | 73 (100.0%) | 40 (100.0%) |
Housing Structure by Heating Type in Blythedale
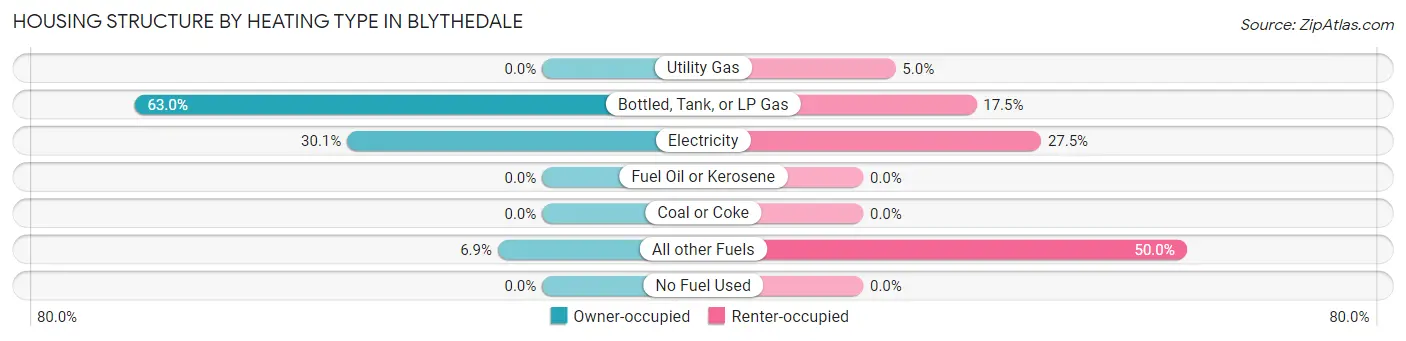
| Heating Type | Owner-occupied | Renter-occupied |
| Utility Gas | 0 (0.0%) | 2 (5.0%) |
| Bottled, Tank, or LP Gas | 46 (63.0%) | 7 (17.5%) |
| Electricity | 22 (30.1%) | 11 (27.5%) |
| Fuel Oil or Kerosene | 0 (0.0%) | 0 (0.0%) |
| Coal or Coke | 0 (0.0%) | 0 (0.0%) |
| All other Fuels | 5 (6.9%) | 20 (50.0%) |
| No Fuel Used | 0 (0.0%) | 0 (0.0%) |
| Total | 73 (100.0%) | 40 (100.0%) |
Household Vehicle Usage in Blythedale
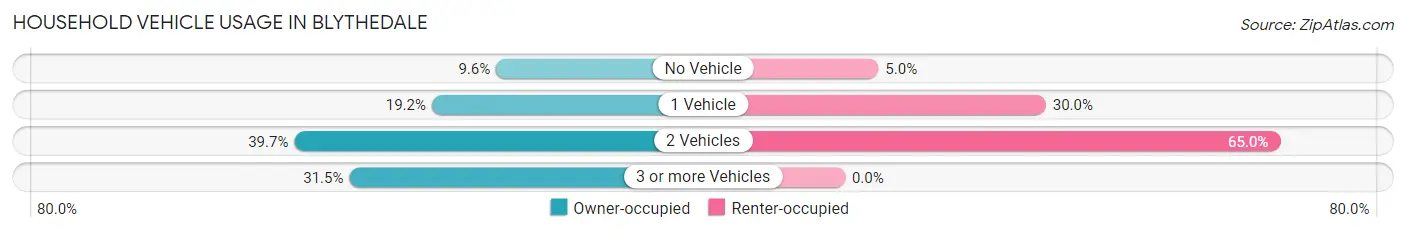
| Vehicles per Household | Owner-occupied | Renter-occupied |
| No Vehicle | 7 (9.6%) | 2 (5.0%) |
| 1 Vehicle | 14 (19.2%) | 12 (30.0%) |
| 2 Vehicles | 29 (39.7%) | 26 (65.0%) |
| 3 or more Vehicles | 23 (31.5%) | 0 (0.0%) |
| Total | 73 (100.0%) | 40 (100.0%) |
Real Estate & Mortgages in Blythedale
Real Estate and Mortgage Overview in Blythedale
| Characteristic | Without Mortgage | With Mortgage |
| Housing Units | 48 | 25 |
| Median Property Value | $22,200 | $79,000 |
| Median Household Income | $47,917 | $1 |
| Monthly Housing Costs | $407 | $0 |
| Real Estate Taxes | $486 | $0 |
Property Value by Mortgage Status in Blythedale
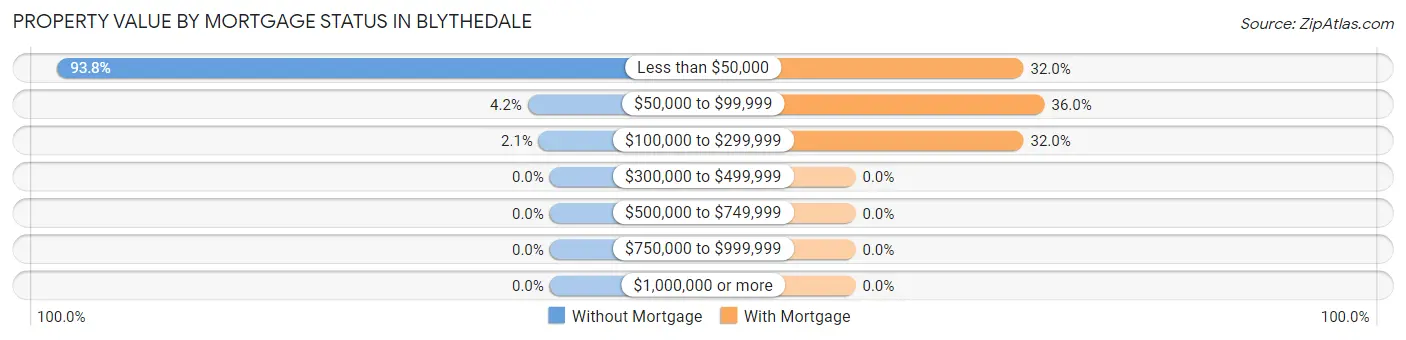
| Property Value | Without Mortgage | With Mortgage |
| Less than $50,000 | 45 (93.8%) | 8 (32.0%) |
| $50,000 to $99,999 | 2 (4.2%) | 9 (36.0%) |
| $100,000 to $299,999 | 1 (2.1%) | 8 (32.0%) |
| $300,000 to $499,999 | 0 (0.0%) | 0 (0.0%) |
| $500,000 to $749,999 | 0 (0.0%) | 0 (0.0%) |
| $750,000 to $999,999 | 0 (0.0%) | 0 (0.0%) |
| $1,000,000 or more | 0 (0.0%) | 0 (0.0%) |
| Total | 48 (100.0%) | 25 (100.0%) |
Household Income by Mortgage Status in Blythedale
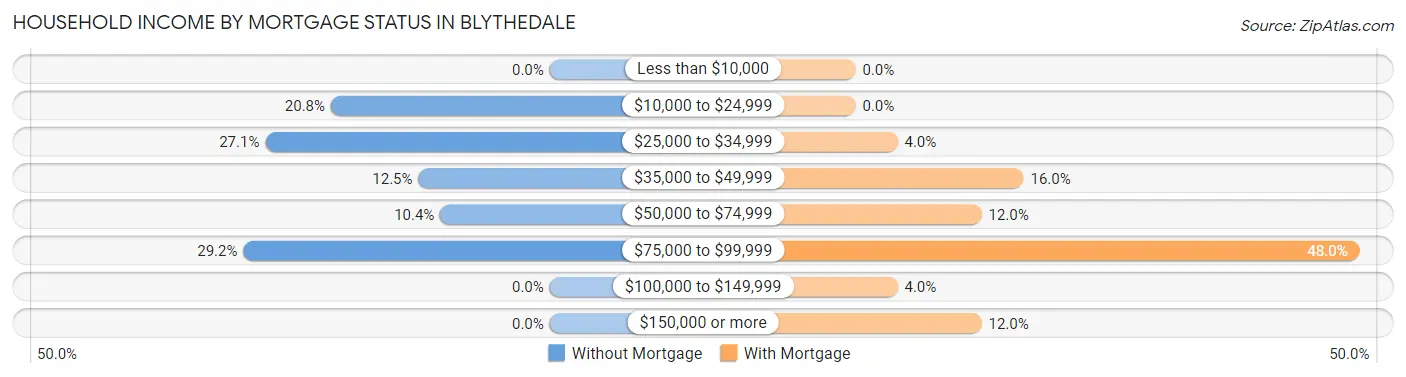
| Household Income | Without Mortgage | With Mortgage |
| Less than $10,000 | 0 (0.0%) | 0 (0.0%) |
| $10,000 to $24,999 | 10 (20.8%) | 0 (0.0%) |
| $25,000 to $34,999 | 13 (27.1%) | 1 (4.0%) |
| $35,000 to $49,999 | 6 (12.5%) | 4 (16.0%) |
| $50,000 to $74,999 | 5 (10.4%) | 3 (12.0%) |
| $75,000 to $99,999 | 14 (29.2%) | 12 (48.0%) |
| $100,000 to $149,999 | 0 (0.0%) | 1 (4.0%) |
| $150,000 or more | 0 (0.0%) | 3 (12.0%) |
| Total | 48 (100.0%) | 25 (100.0%) |
Property Value to Household Income Ratio in Blythedale
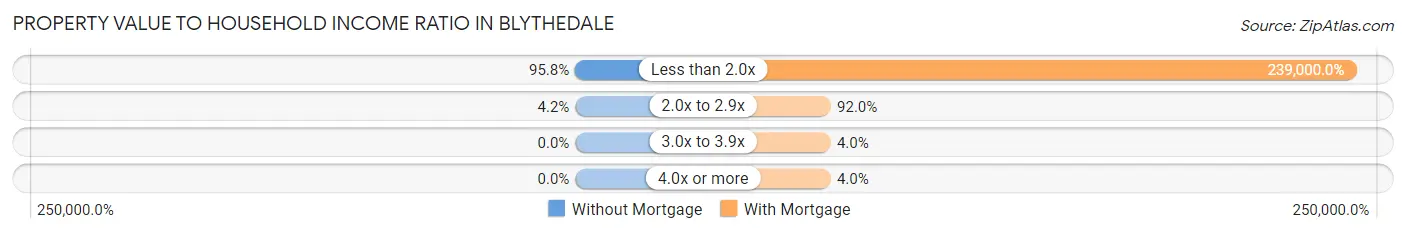
| Value-to-Income Ratio | Without Mortgage | With Mortgage |
| Less than 2.0x | 46 (95.8%) | 59,750 (239,000.0%) |
| 2.0x to 2.9x | 2 (4.2%) | 23 (92.0%) |
| 3.0x to 3.9x | 0 (0.0%) | 1 (4.0%) |
| 4.0x or more | 0 (0.0%) | 1 (4.0%) |
| Total | 48 (100.0%) | 25 (100.0%) |
Real Estate Taxes by Mortgage Status in Blythedale
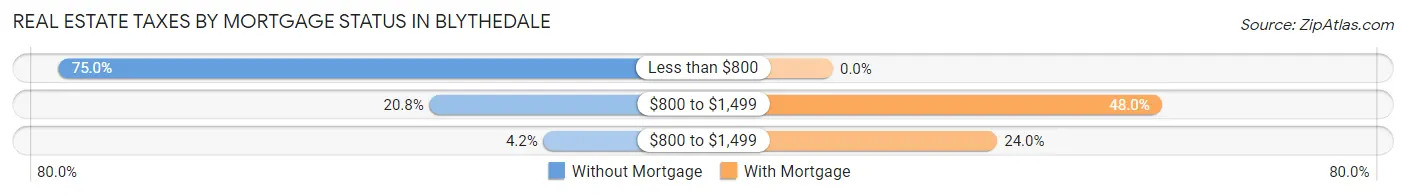
| Property Taxes | Without Mortgage | With Mortgage |
| Less than $800 | 36 (75.0%) | 0 (0.0%) |
| $800 to $1,499 | 10 (20.8%) | 12 (48.0%) |
| $800 to $1,499 | 2 (4.2%) | 6 (24.0%) |
| Total | 48 (100.0%) | 25 (100.0%) |
Health & Disability in Blythedale
Health Insurance Coverage by Age in Blythedale
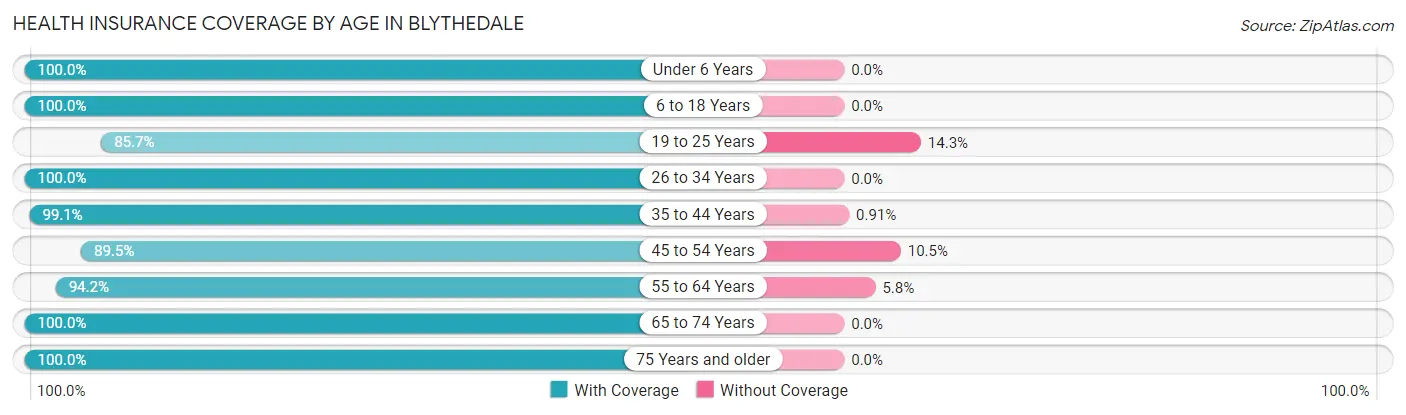
| Age Bracket | With Coverage | Without Coverage |
| Under 6 Years | 17 (100.0%) | 0 (0.0%) |
| 6 to 18 Years | 48 (100.0%) | 0 (0.0%) |
| 19 to 25 Years | 18 (85.7%) | 3 (14.3%) |
| 26 to 34 Years | 30 (100.0%) | 0 (0.0%) |
| 35 to 44 Years | 109 (99.1%) | 1 (0.9%) |
| 45 to 54 Years | 17 (89.5%) | 2 (10.5%) |
| 55 to 64 Years | 81 (94.2%) | 5 (5.8%) |
| 65 to 74 Years | 42 (100.0%) | 0 (0.0%) |
| 75 Years and older | 10 (100.0%) | 0 (0.0%) |
| Total | 372 (97.1%) | 11 (2.9%) |
Health Insurance Coverage by Citizenship Status in Blythedale
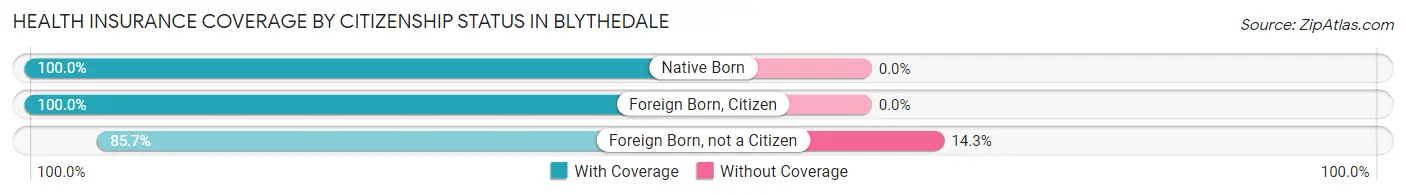
| Citizenship Status | With Coverage | Without Coverage |
| Native Born | 17 (100.0%) | 0 (0.0%) |
| Foreign Born, Citizen | 48 (100.0%) | 0 (0.0%) |
| Foreign Born, not a Citizen | 18 (85.7%) | 3 (14.3%) |
Health Insurance Coverage by Household Income in Blythedale
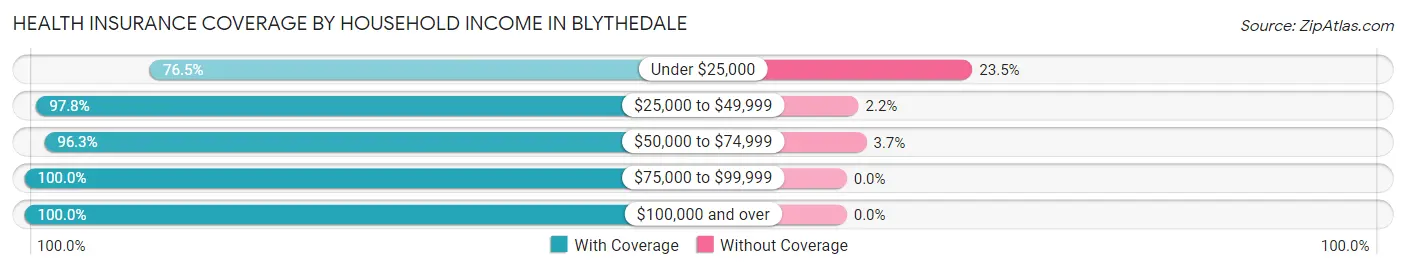
| Household Income | With Coverage | Without Coverage |
| Under $25,000 | 13 (76.5%) | 4 (23.5%) |
| $25,000 to $49,999 | 221 (97.8%) | 5 (2.2%) |
| $50,000 to $74,999 | 52 (96.3%) | 2 (3.7%) |
| $75,000 to $99,999 | 73 (100.0%) | 0 (0.0%) |
| $100,000 and over | 13 (100.0%) | 0 (0.0%) |
Public vs Private Health Insurance Coverage by Age in Blythedale
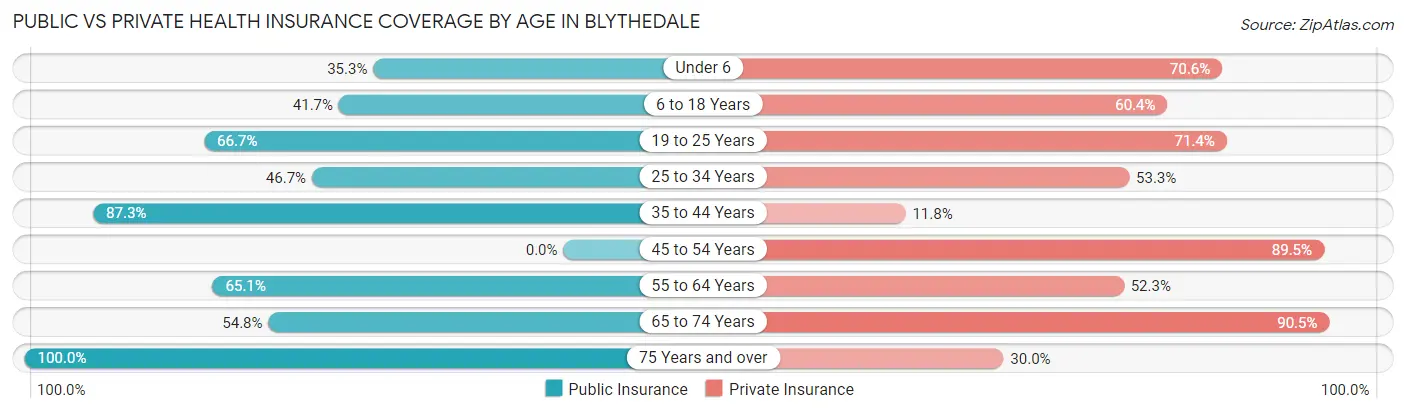
| Age Bracket | Public Insurance | Private Insurance |
| Under 6 | 6 (35.3%) | 12 (70.6%) |
| 6 to 18 Years | 20 (41.7%) | 29 (60.4%) |
| 19 to 25 Years | 14 (66.7%) | 15 (71.4%) |
| 25 to 34 Years | 14 (46.7%) | 16 (53.3%) |
| 35 to 44 Years | 96 (87.3%) | 13 (11.8%) |
| 45 to 54 Years | 0 (0.0%) | 17 (89.5%) |
| 55 to 64 Years | 56 (65.1%) | 45 (52.3%) |
| 65 to 74 Years | 23 (54.8%) | 38 (90.5%) |
| 75 Years and over | 10 (100.0%) | 3 (30.0%) |
| Total | 239 (62.4%) | 188 (49.1%) |
Disability Status by Sex by Age in Blythedale
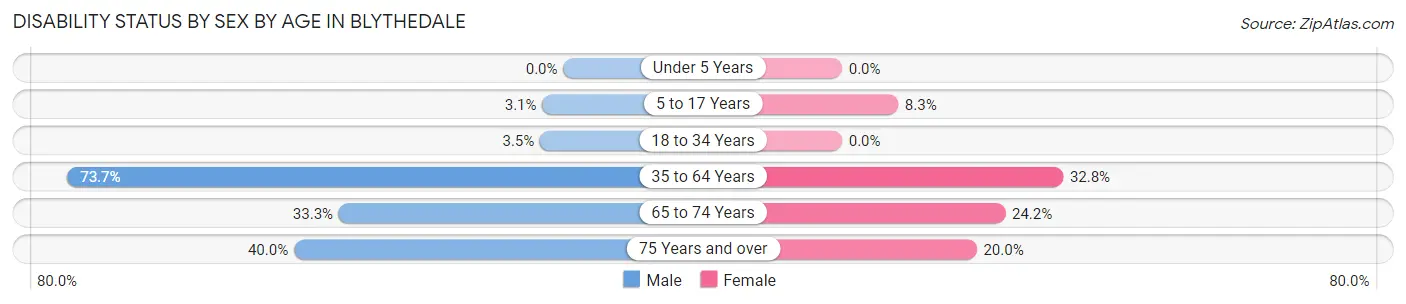
| Age Bracket | Male | Female |
| Under 5 Years | 0 (0.0%) | 0 (0.0%) |
| 5 to 17 Years | 1 (3.1%) | 1 (8.3%) |
| 18 to 34 Years | 1 (3.5%) | 0 (0.0%) |
| 35 to 64 Years | 109 (73.7%) | 22 (32.8%) |
| 65 to 74 Years | 3 (33.3%) | 8 (24.2%) |
| 75 Years and over | 2 (40.0%) | 1 (20.0%) |
Disability Class by Sex by Age in Blythedale
Disability Class: Hearing Difficulty
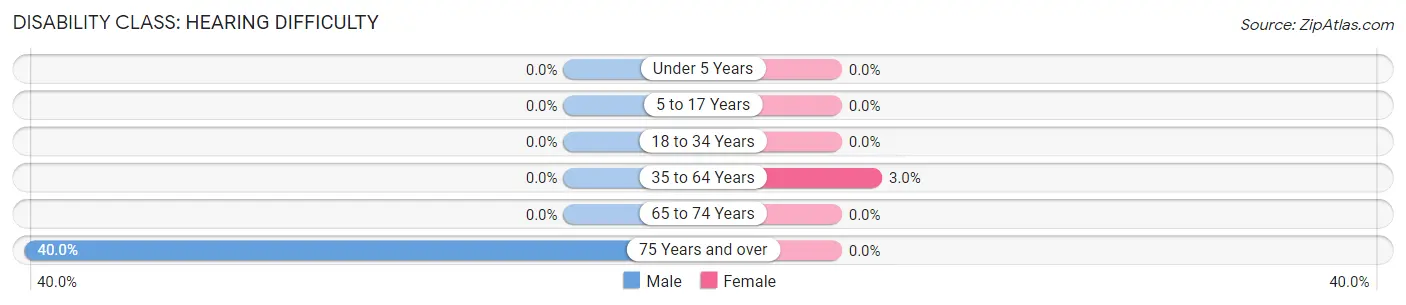
| Age Bracket | Male | Female |
| Under 5 Years | 0 (0.0%) | 0 (0.0%) |
| 5 to 17 Years | 0 (0.0%) | 0 (0.0%) |
| 18 to 34 Years | 0 (0.0%) | 0 (0.0%) |
| 35 to 64 Years | 0 (0.0%) | 2 (3.0%) |
| 65 to 74 Years | 0 (0.0%) | 0 (0.0%) |
| 75 Years and over | 2 (40.0%) | 0 (0.0%) |
Disability Class: Vision Difficulty
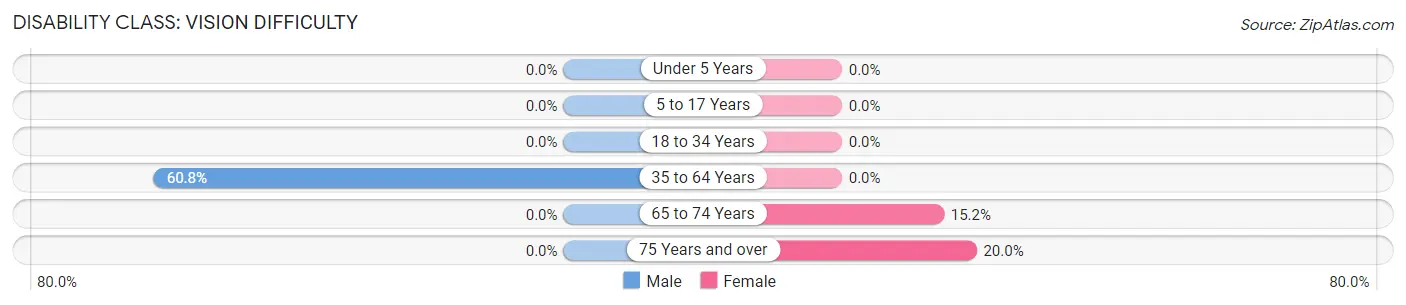
| Age Bracket | Male | Female |
| Under 5 Years | 0 (0.0%) | 0 (0.0%) |
| 5 to 17 Years | 0 (0.0%) | 0 (0.0%) |
| 18 to 34 Years | 0 (0.0%) | 0 (0.0%) |
| 35 to 64 Years | 90 (60.8%) | 0 (0.0%) |
| 65 to 74 Years | 0 (0.0%) | 5 (15.1%) |
| 75 Years and over | 0 (0.0%) | 1 (20.0%) |
Disability Class: Cognitive Difficulty
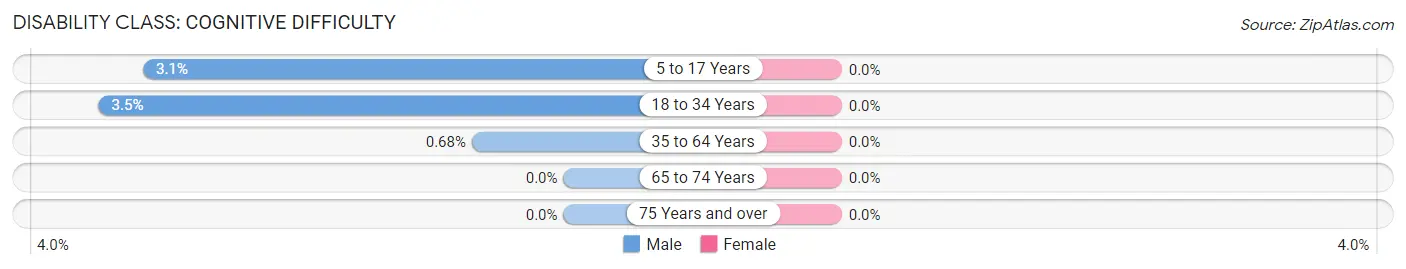
| Age Bracket | Male | Female |
| 5 to 17 Years | 1 (3.1%) | 0 (0.0%) |
| 18 to 34 Years | 1 (3.5%) | 0 (0.0%) |
| 35 to 64 Years | 1 (0.7%) | 0 (0.0%) |
| 65 to 74 Years | 0 (0.0%) | 0 (0.0%) |
| 75 Years and over | 0 (0.0%) | 0 (0.0%) |
Disability Class: Ambulatory Difficulty
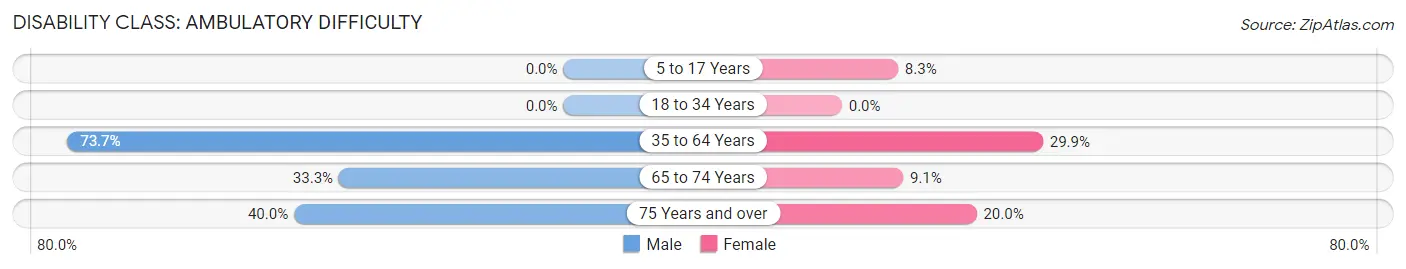
| Age Bracket | Male | Female |
| 5 to 17 Years | 0 (0.0%) | 1 (8.3%) |
| 18 to 34 Years | 0 (0.0%) | 0 (0.0%) |
| 35 to 64 Years | 109 (73.7%) | 20 (29.8%) |
| 65 to 74 Years | 3 (33.3%) | 3 (9.1%) |
| 75 Years and over | 2 (40.0%) | 1 (20.0%) |
Disability Class: Self-Care Difficulty
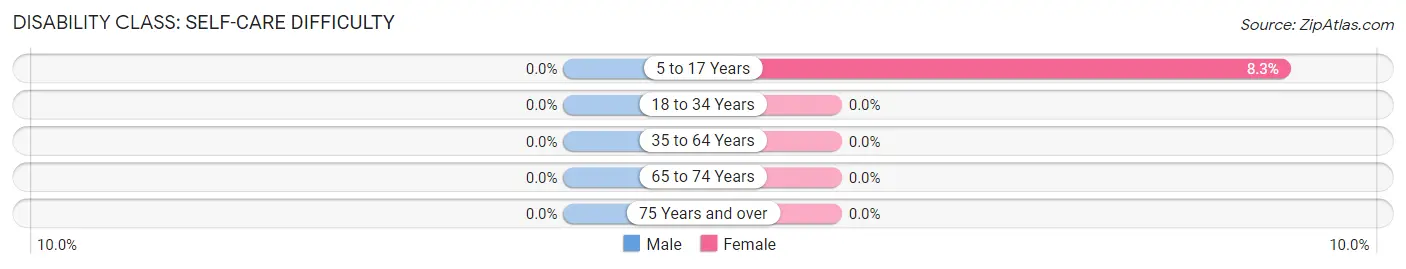
| Age Bracket | Male | Female |
| 5 to 17 Years | 0 (0.0%) | 1 (8.3%) |
| 18 to 34 Years | 0 (0.0%) | 0 (0.0%) |
| 35 to 64 Years | 0 (0.0%) | 0 (0.0%) |
| 65 to 74 Years | 0 (0.0%) | 0 (0.0%) |
| 75 Years and over | 0 (0.0%) | 0 (0.0%) |
Technology Access in Blythedale
Computing Device Access in Blythedale
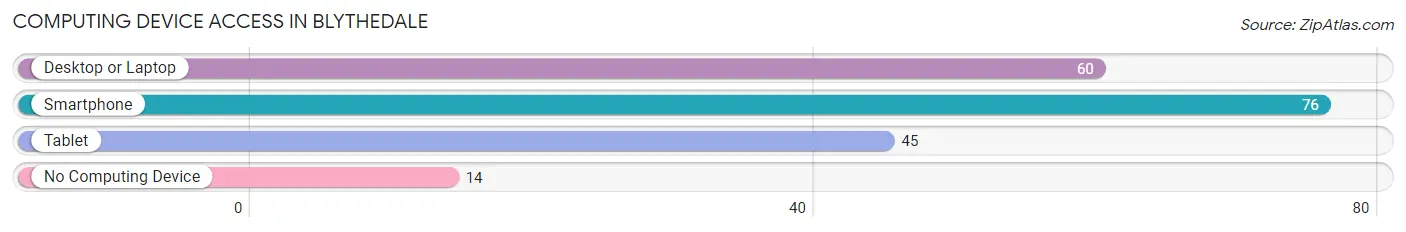
| Device Type | # Households | % Households |
| Desktop or Laptop | 60 | 53.1% |
| Smartphone | 76 | 67.3% |
| Tablet | 45 | 39.8% |
| No Computing Device | 14 | 12.4% |
| Total | 113 | 100.0% |
Internet Access in Blythedale
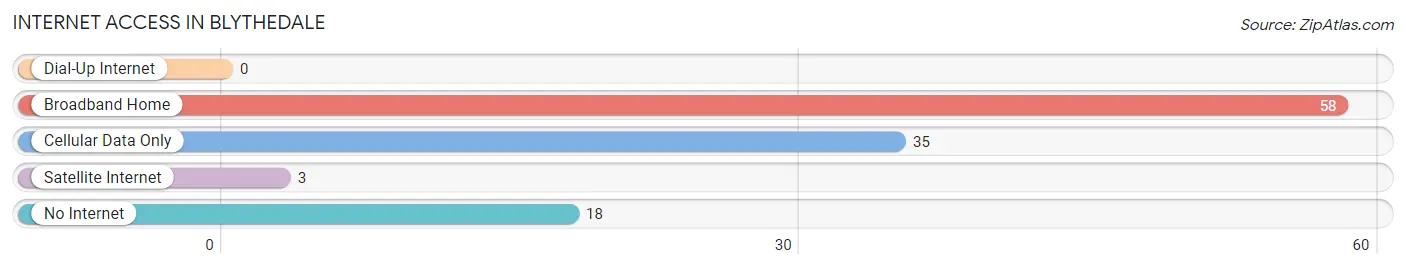
| Internet Type | # Households | % Households |
| Dial-Up Internet | 0 | 0.0% |
| Broadband Home | 58 | 51.3% |
| Cellular Data Only | 35 | 31.0% |
| Satellite Internet | 3 | 2.6% |
| No Internet | 18 | 15.9% |
| Total | 113 | 100.0% |
Blythedale Summary
Blythedale is a small town located in Harrison County, Missouri. It is situated in the northwest corner of the state, near the Iowa border. The town was founded in 1883 and has a population of approximately 500 people.
History
Blythedale was founded in 1883 by a group of settlers from Iowa. The town was named after the Blythe family, who were among the first settlers. The town was originally a farming community, but it soon became a center for the timber industry. The town was also home to a number of small businesses, including a general store, a blacksmith shop, and a hotel.
In the early 1900s, the town experienced a period of growth and prosperity. The timber industry was booming, and the town was home to several sawmills. The town also had a number of churches, schools, and other businesses.
In the 1950s, the timber industry began to decline, and the town began to experience a period of decline. The population began to decline, and many of the businesses closed. In the late 1970s, the town began to experience a period of revitalization. The town was designated as a historic district, and several of the old buildings were restored.
Geography
Blythedale is located in the northwest corner of Missouri, near the Iowa border. The town is situated in the Ozark Plateau, and is surrounded by rolling hills and forests. The town is located near the Chariton River, which is a tributary of the Missouri River.
The town has a total area of 0.7 square miles, all of which is land. The town has a humid continental climate, with hot summers and cold winters.
Economy
The economy of Blythedale is largely based on agriculture. The town is home to several farms, which produce corn, soybeans, and other crops. The town is also home to a number of small businesses, including a general store, a hardware store, and a restaurant.
The town is also home to a number of tourist attractions, including a historic district, a museum, and a number of parks. The town is also home to a number of festivals and events, including the Blythedale Fair and the Blythedale Music Festival.
Demographics
As of the 2010 census, the population of Blythedale was 498. The town has a median household income of $37,500, and the median age is 44. The town is predominantly white, with 95.2% of the population being white. The town also has a small Hispanic population, with 2.2% of the population being Hispanic or Latino. The town also has a small African American population, with 0.8% of the population being African American.
Common Questions
What is Per Capita Income in Blythedale?
Per Capita income in Blythedale is $18,559.
What is the Median Family Income in Blythedale?
Median Family Income in Blythedale is $32,614.
What is the Median Household income in Blythedale?
Median Household Income in Blythedale is $33,984.
What is Inequality or Gini Index in Blythedale?
Inequality or Gini Index in Blythedale is 0.34.
What is the Total Population of Blythedale?
Total Population of Blythedale is 384.
What is the Total Male Population of Blythedale?
Total Male Population of Blythedale is 238.
What is the Total Female Population of Blythedale?
Total Female Population of Blythedale is 146.
What is the Ratio of Males per 100 Females in Blythedale?
There are 163.01 Males per 100 Females in Blythedale.
What is the Ratio of Females per 100 Males in Blythedale?
There are 61.34 Females per 100 Males in Blythedale.
What is the Median Population Age in Blythedale?
Median Population Age in Blythedale is 36.8 Years.
What is the Average Family Size in Blythedale
Average Family Size in Blythedale is 4.0 People.
What is the Average Household Size in Blythedale
Average Household Size in Blythedale is 3.4 People.
How Large is the Labor Force in Blythedale?
There are 130 People in the Labor Forcein in Blythedale.
What is the Percentage of People in the Labor Force in Blythedale?
38.7% of People are in the Labor Force in Blythedale.
What is the Unemployment Rate in Blythedale?
Unemployment Rate in Blythedale is 3.9%.