Bloomfield, MO Map & Demographics
Bloomfield Map
Bloomfield Overview
$19,747
PER CAPITA INCOME
$49,095
AVG FAMILY INCOME
$42,446
AVG HOUSEHOLD INCOME
33.0%
WAGE / INCOME GAP [ % ]
67.0¢/ $1
WAGE / INCOME GAP [ $ ]
$9,681
FAMILY INCOME DEFICIT
0.39
INEQUALITY / GINI INDEX
2,172
TOTAL POPULATION
1,136
MALE POPULATION
1,036
FEMALE POPULATION
109.65
MALES / 100 FEMALES
91.20
FEMALES / 100 MALES
41.5
MEDIAN AGE
3.0
AVG FAMILY SIZE
2.5
AVG HOUSEHOLD SIZE
751
LABOR FORCE [ PEOPLE ]
43.1%
PERCENT IN LABOR FORCE
8.1%
UNEMPLOYMENT RATE
Bloomfield Zip Codes
Bloomfield Area Codes
Income in Bloomfield
Income Overview in Bloomfield
Per Capita Income in Bloomfield is $19,747, while median incomes of families and households are $49,095 and $42,446 respectively.
| Characteristic | Number | Measure |
| Per Capita Income | 2,172 | $19,747 |
| Median Family Income | 551 | $49,095 |
| Mean Family Income | 551 | $59,506 |
| Median Household Income | 829 | $42,446 |
| Mean Household Income | 829 | $50,413 |
| Income Deficit | 551 | $9,681 |
| Wage / Income Gap (%) | 2,172 | 33.00% |
| Wage / Income Gap ($) | 2,172 | 67.00¢ per $1 |
| Gini / Inequality Index | 2,172 | 0.39 |
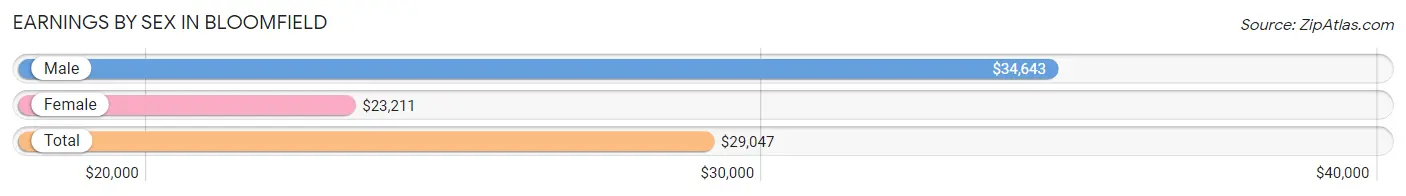
Earnings by Sex in Bloomfield
Average Earnings in Bloomfield are $29,047, $34,643 for men and $23,211 for women, a difference of 33.0%.
| Sex | Number | Average Earnings |
| Male | 452 (55.2%) | $34,643 |
| Female | 367 (44.8%) | $23,211 |
| Total | 819 (100.0%) | $29,047 |
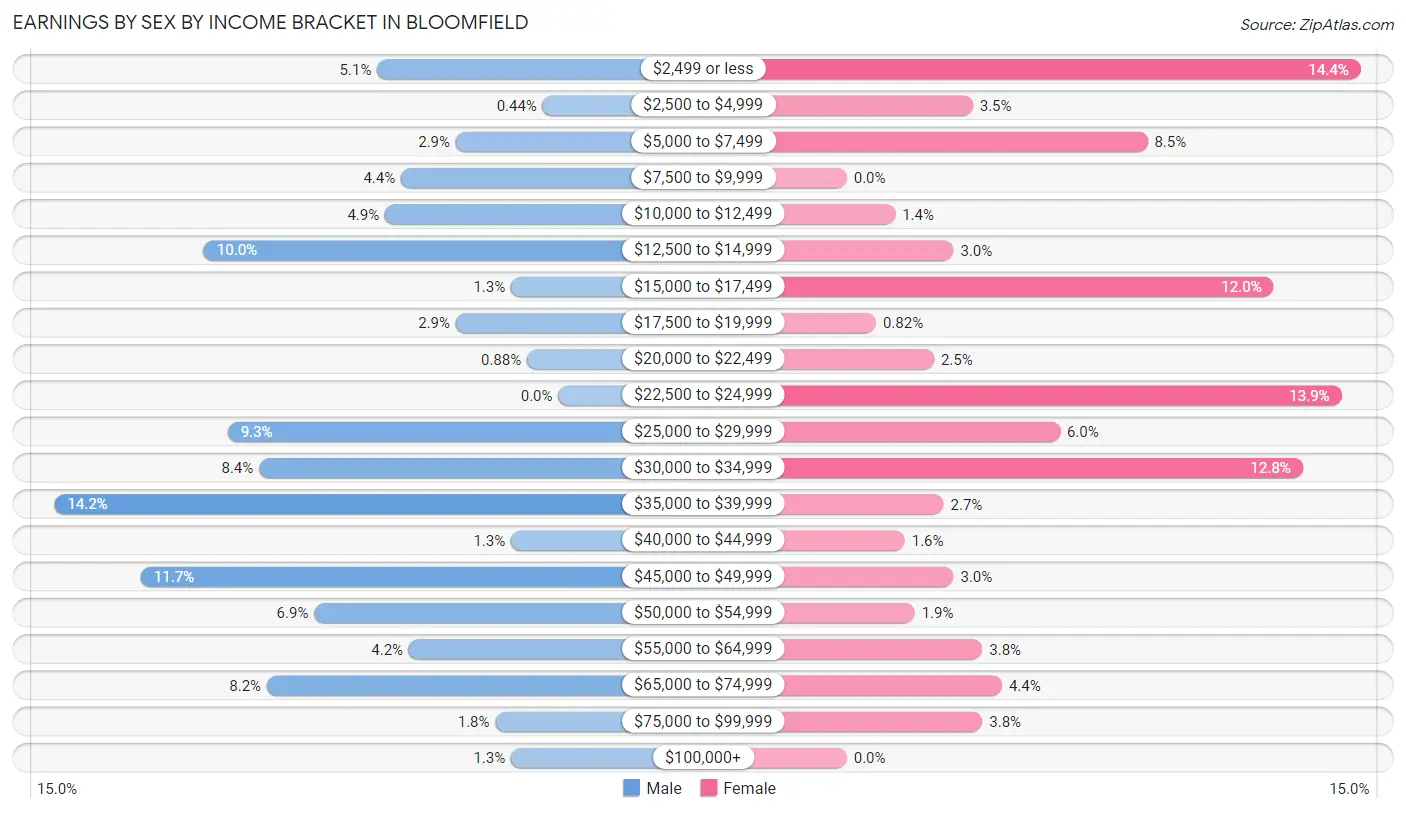
Earnings by Sex by Income Bracket in Bloomfield
The most common earnings brackets in Bloomfield are $35,000 to $39,999 for men (64 | 14.2%) and $2,499 or less for women (53 | 14.4%).
| Income | Male | Female |
| $2,499 or less | 23 (5.1%) | 53 (14.4%) |
| $2,500 to $4,999 | 2 (0.4%) | 13 (3.5%) |
| $5,000 to $7,499 | 13 (2.9%) | 31 (8.5%) |
| $7,500 to $9,999 | 20 (4.4%) | 0 (0.0%) |
| $10,000 to $12,499 | 22 (4.9%) | 5 (1.4%) |
| $12,500 to $14,999 | 45 (10.0%) | 11 (3.0%) |
| $15,000 to $17,499 | 6 (1.3%) | 44 (12.0%) |
| $17,500 to $19,999 | 13 (2.9%) | 3 (0.8%) |
| $20,000 to $22,499 | 4 (0.9%) | 9 (2.5%) |
| $22,500 to $24,999 | 0 (0.0%) | 51 (13.9%) |
| $25,000 to $29,999 | 42 (9.3%) | 22 (6.0%) |
| $30,000 to $34,999 | 38 (8.4%) | 47 (12.8%) |
| $35,000 to $39,999 | 64 (14.2%) | 10 (2.7%) |
| $40,000 to $44,999 | 6 (1.3%) | 6 (1.6%) |
| $45,000 to $49,999 | 53 (11.7%) | 11 (3.0%) |
| $50,000 to $54,999 | 31 (6.9%) | 7 (1.9%) |
| $55,000 to $64,999 | 19 (4.2%) | 14 (3.8%) |
| $65,000 to $74,999 | 37 (8.2%) | 16 (4.4%) |
| $75,000 to $99,999 | 8 (1.8%) | 14 (3.8%) |
| $100,000+ | 6 (1.3%) | 0 (0.0%) |
| Total | 452 (100.0%) | 367 (100.0%) |
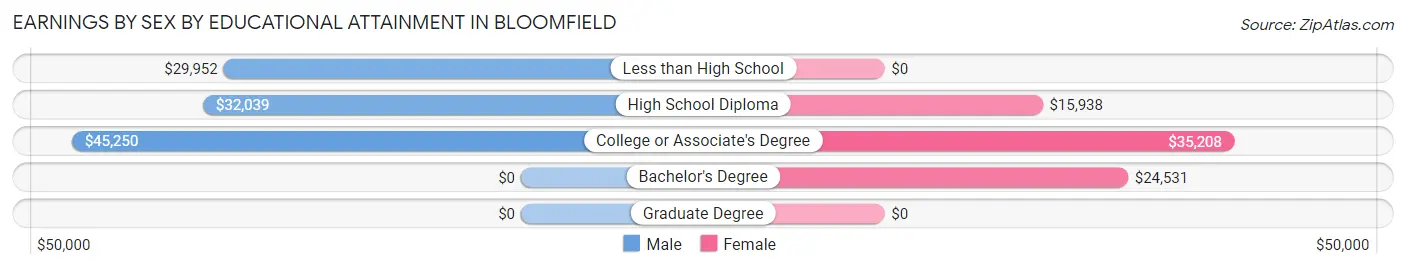
Earnings by Sex by Educational Attainment in Bloomfield
Average earnings in Bloomfield are $35,368 for men and $23,284 for women, a difference of 34.2%. Men with an educational attainment of college or associate's degree enjoy the highest average annual earnings of $45,250, while those with less than high school education earn the least with $29,952. Women with an educational attainment of college or associate's degree earn the most with the average annual earnings of $35,208, while those with high school diploma education have the smallest earnings of $15,938.
| Educational Attainment | Male Income | Female Income |
| Less than High School | $29,952 | $0 |
| High School Diploma | $32,039 | $15,938 |
| College or Associate's Degree | $45,250 | $35,208 |
| Bachelor's Degree | - | - |
| Graduate Degree | - | - |
| Total | $35,368 | $23,284 |
Family Income in Bloomfield
Family Income Brackets in Bloomfield
According to the Bloomfield family income data, there are 94 families falling into the $75,000 to $99,999 income range, which is the most common income bracket and makes up 17.1% of all families.
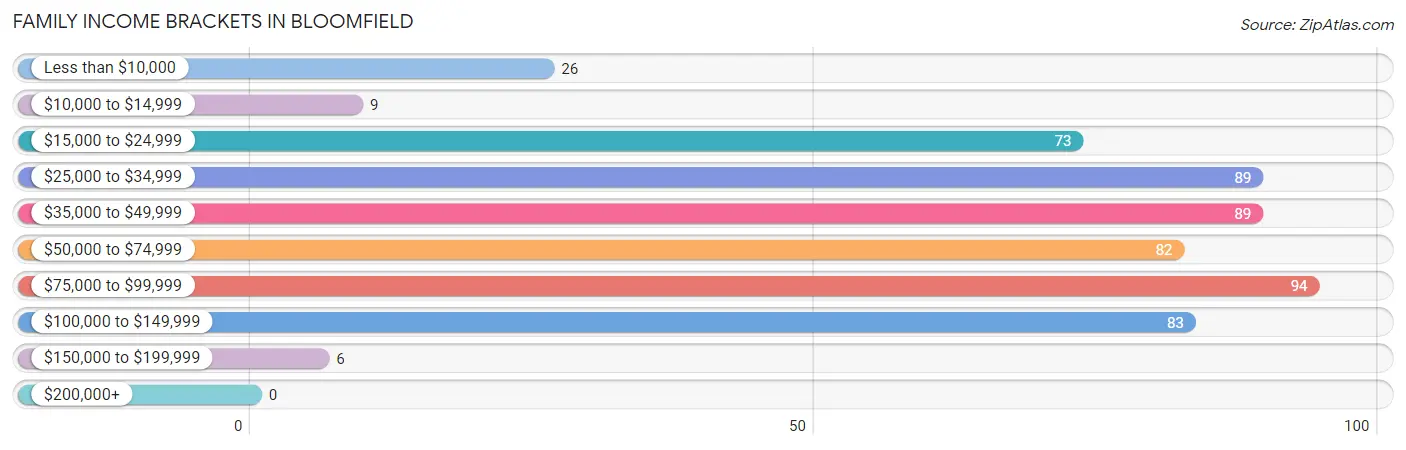
| Income Bracket | # Families | % Families |
| Less than $10,000 | 26 | 4.7% |
| $10,000 to $14,999 | 9 | 1.6% |
| $15,000 to $24,999 | 73 | 13.2% |
| $25,000 to $34,999 | 89 | 16.2% |
| $35,000 to $49,999 | 89 | 16.2% |
| $50,000 to $74,999 | 82 | 14.9% |
| $75,000 to $99,999 | 94 | 17.1% |
| $100,000 to $149,999 | 83 | 15.1% |
| $150,000 to $199,999 | 6 | 1.1% |
| $200,000+ | 0 | 0.0% |
Family Income by Famaliy Size in Bloomfield
4-person families (120 | 21.8%) account for the highest median family income in Bloomfield with $93,060 per family, while 2-person families (269 | 48.8%) have the highest median income of $23,867 per family member.
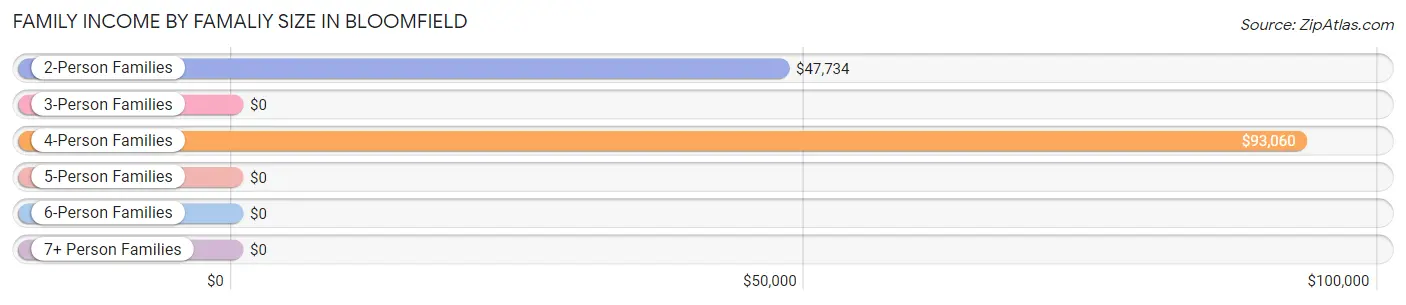
| Income Bracket | # Families | Median Income |
| 2-Person Families | 269 (48.8%) | $47,734 |
| 3-Person Families | 116 (21.0%) | $0 |
| 4-Person Families | 120 (21.8%) | $93,060 |
| 5-Person Families | 35 (6.4%) | $0 |
| 6-Person Families | 11 (2.0%) | $0 |
| 7+ Person Families | 0 (0.0%) | $0 |
| Total | 551 (100.0%) | $49,095 |
Family Income by Number of Earners in Bloomfield
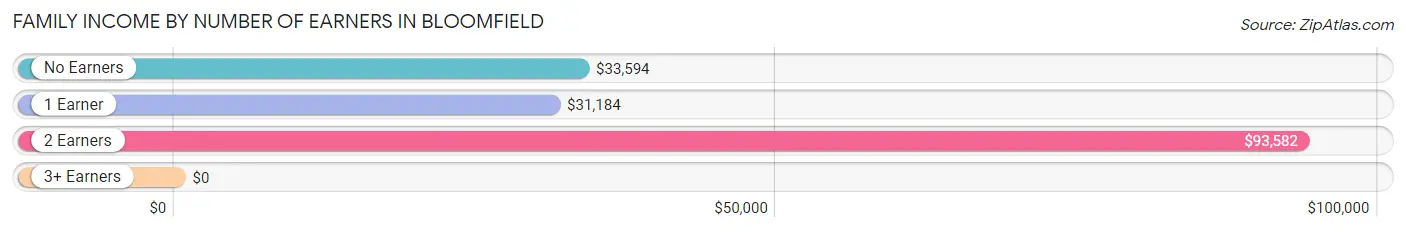
| Number of Earners | # Families | Median Income |
| No Earners | 127 (23.1%) | $33,594 |
| 1 Earner | 198 (35.9%) | $31,184 |
| 2 Earners | 224 (40.6%) | $93,582 |
| 3+ Earners | 2 (0.4%) | $0 |
| Total | 551 (100.0%) | $49,095 |
Household Income in Bloomfield
Household Income Brackets in Bloomfield
With 166 households falling in the category, the $35,000 to $49,999 income range is the most frequent in Bloomfield, accounting for 20.0% of all households.
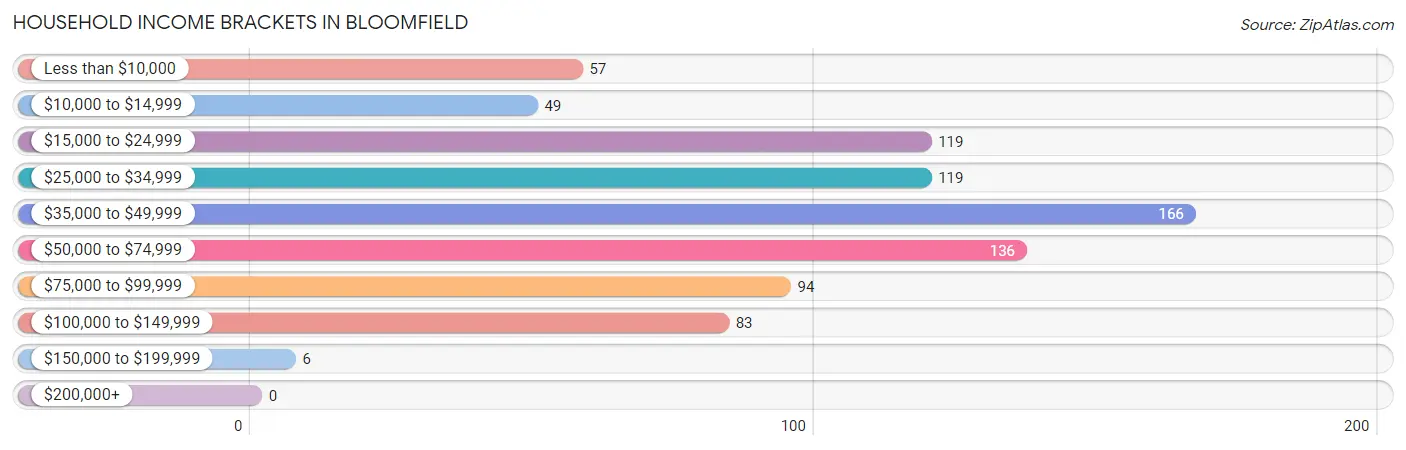
| Income Bracket | # Households | % Households |
| Less than $10,000 | 57 | 6.9% |
| $10,000 to $14,999 | 49 | 5.9% |
| $15,000 to $24,999 | 119 | 14.4% |
| $25,000 to $34,999 | 119 | 14.4% |
| $35,000 to $49,999 | 166 | 20.0% |
| $50,000 to $74,999 | 136 | 16.4% |
| $75,000 to $99,999 | 94 | 11.3% |
| $100,000 to $149,999 | 83 | 10.0% |
| $150,000 to $199,999 | 6 | 0.7% |
| $200,000+ | 0 | 0.0% |
Household Income by Householder Age in Bloomfield
The median household income in Bloomfield is $42,446, with the highest median household income of $50,000 found in the 45 to 64 years age bracket for the primary householder. A total of 262 households (31.6%) fall into this category. Meanwhile, the 15 to 24 years age bracket for the primary householder has the lowest median household income of $0, with 3 households (0.4%) in this group.
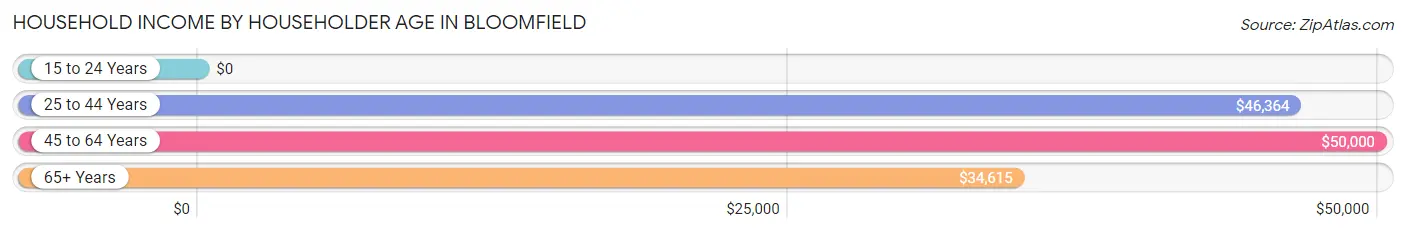
| Income Bracket | # Households | Median Income |
| 15 to 24 Years | 3 (0.4%) | $0 |
| 25 to 44 Years | 224 (27.0%) | $46,364 |
| 45 to 64 Years | 262 (31.6%) | $50,000 |
| 65+ Years | 340 (41.0%) | $34,615 |
| Total | 829 (100.0%) | $42,446 |
Poverty in Bloomfield
Income Below Poverty by Sex and Age in Bloomfield
With 23.3% poverty level for males and 27.1% for females among the residents of Bloomfield, 45 to 54 year old males and 12 to 14 year old females are the most vulnerable to poverty, with 52 males (61.9%) and 21 females (77.8%) in their respective age groups living below the poverty level.
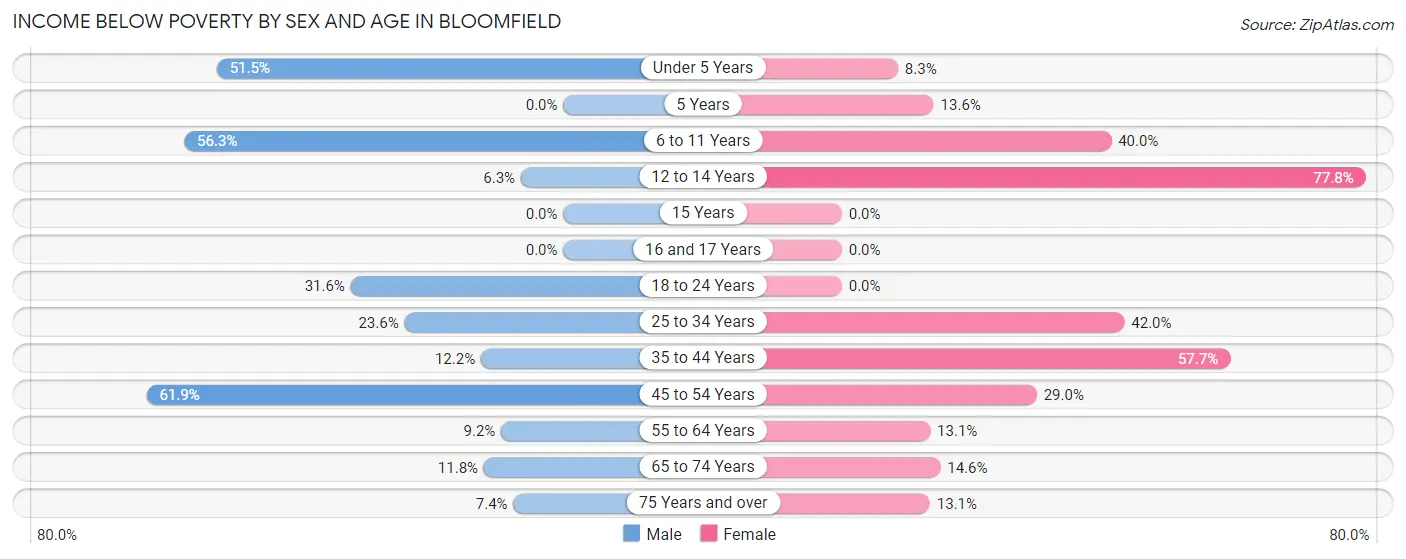
| Age Bracket | Male | Female |
| Under 5 Years | 35 (51.5%) | 2 (8.3%) |
| 5 Years | 0 (0.0%) | 3 (13.6%) |
| 6 to 11 Years | 49 (56.3%) | 26 (40.0%) |
| 12 to 14 Years | 8 (6.3%) | 21 (77.8%) |
| 15 Years | 0 (0.0%) | 0 (0.0%) |
| 16 and 17 Years | 0 (0.0%) | 0 (0.0%) |
| 18 to 24 Years | 6 (31.6%) | 0 (0.0%) |
| 25 to 34 Years | 46 (23.6%) | 60 (42.0%) |
| 35 to 44 Years | 23 (12.2%) | 64 (57.7%) |
| 45 to 54 Years | 52 (61.9%) | 33 (28.9%) |
| 55 to 64 Years | 6 (9.2%) | 21 (13.1%) |
| 65 to 74 Years | 19 (11.8%) | 30 (14.6%) |
| 75 Years and over | 4 (7.4%) | 14 (13.1%) |
| Total | 248 (23.3%) | 274 (27.1%) |
Income Above Poverty by Sex and Age in Bloomfield
According to the poverty statistics in Bloomfield, males aged 15 years and females aged 15 years are the age groups that are most secure financially, with 100.0% of males and 100.0% of females in these age groups living above the poverty line.
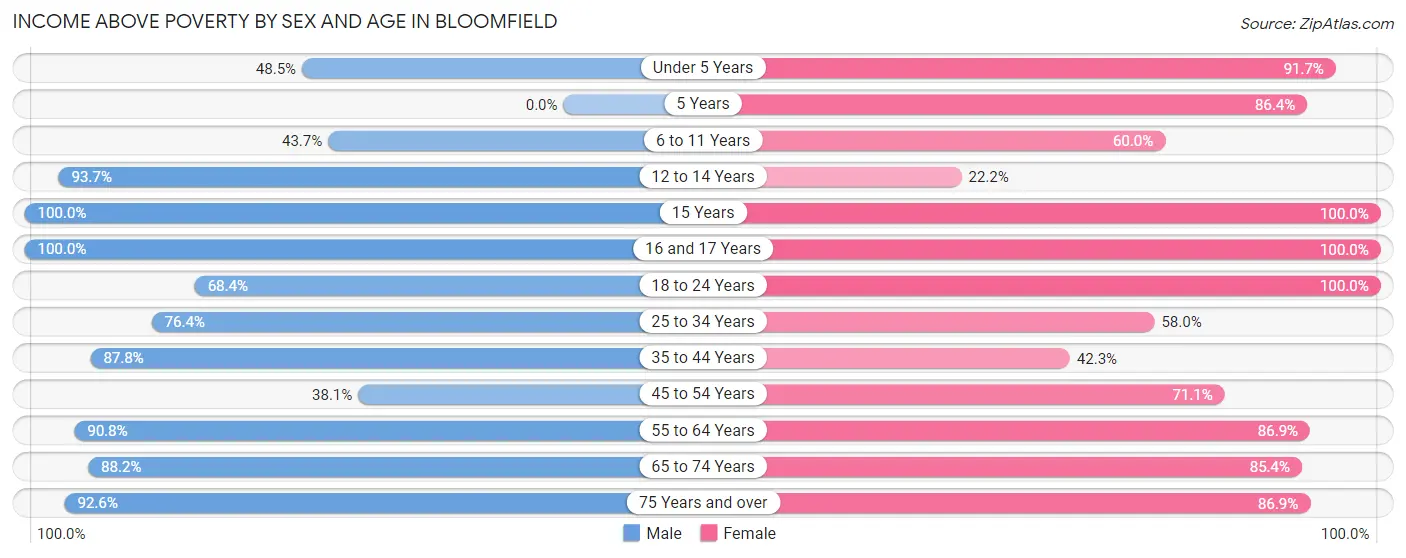
| Age Bracket | Male | Female |
| Under 5 Years | 33 (48.5%) | 22 (91.7%) |
| 5 Years | 0 (0.0%) | 19 (86.4%) |
| 6 to 11 Years | 38 (43.7%) | 39 (60.0%) |
| 12 to 14 Years | 119 (93.7%) | 6 (22.2%) |
| 15 Years | 2 (100.0%) | 8 (100.0%) |
| 16 and 17 Years | 15 (100.0%) | 21 (100.0%) |
| 18 to 24 Years | 13 (68.4%) | 3 (100.0%) |
| 25 to 34 Years | 149 (76.4%) | 83 (58.0%) |
| 35 to 44 Years | 165 (87.8%) | 47 (42.3%) |
| 45 to 54 Years | 32 (38.1%) | 81 (71.1%) |
| 55 to 64 Years | 59 (90.8%) | 139 (86.9%) |
| 65 to 74 Years | 142 (88.2%) | 175 (85.4%) |
| 75 Years and over | 50 (92.6%) | 93 (86.9%) |
| Total | 817 (76.7%) | 736 (72.9%) |
Income Below Poverty Among Married-Couple Families in Bloomfield
The poverty statistics for married-couple families in Bloomfield show that 10.5% or 36 of the total 343 families live below the poverty line. Families with no children have the highest poverty rate of 13.6%, comprising of 24 families. On the other hand, families with 1 or 2 children have the lowest poverty rate of 7.1%, which includes 11 families.
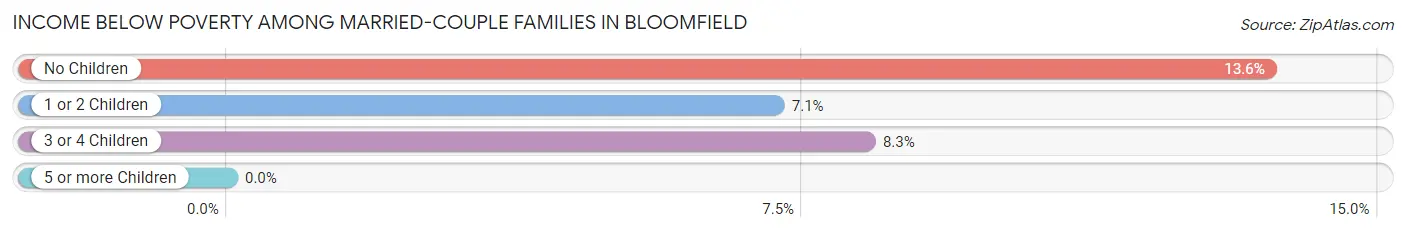
| Children | Above Poverty | Below Poverty |
| No Children | 153 (86.4%) | 24 (13.6%) |
| 1 or 2 Children | 143 (92.9%) | 11 (7.1%) |
| 3 or 4 Children | 11 (91.7%) | 1 (8.3%) |
| 5 or more Children | 0 (0.0%) | 0 (0.0%) |
| Total | 307 (89.5%) | 36 (10.5%) |
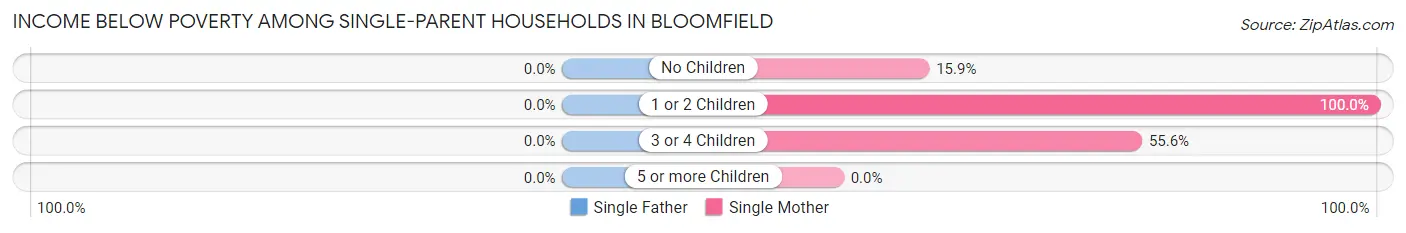
Income Below Poverty Among Single-Parent Households in Bloomfield
| Children | Single Father | Single Mother |
| No Children | 0 (0.0%) | 11 (15.9%) |
| 1 or 2 Children | 0 (0.0%) | 53 (100.0%) |
| 3 or 4 Children | 0 (0.0%) | 15 (55.6%) |
| 5 or more Children | 0 (0.0%) | 0 (0.0%) |
| Total | 0 (0.0%) | 79 (53.0%) |
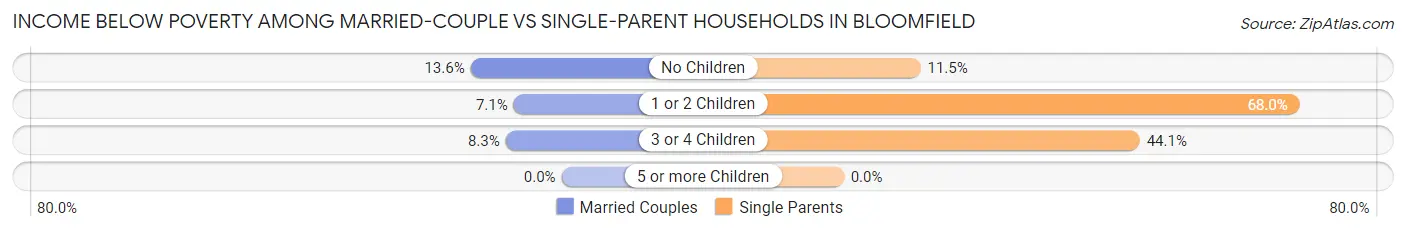
Income Below Poverty Among Married-Couple vs Single-Parent Households in Bloomfield
The poverty data for Bloomfield shows that 36 of the married-couple family households (10.5%) and 79 of the single-parent households (38.0%) are living below the poverty level. Within the married-couple family households, those with no children have the highest poverty rate, with 24 households (13.6%) falling below the poverty line. Among the single-parent households, those with 1 or 2 children have the highest poverty rate, with 53 household (67.9%) living below poverty.
| Children | Married-Couple Families | Single-Parent Households |
| No Children | 24 (13.6%) | 11 (11.5%) |
| 1 or 2 Children | 11 (7.1%) | 53 (67.9%) |
| 3 or 4 Children | 1 (8.3%) | 15 (44.1%) |
| 5 or more Children | 0 (0.0%) | 0 (0.0%) |
| Total | 36 (10.5%) | 79 (38.0%) |
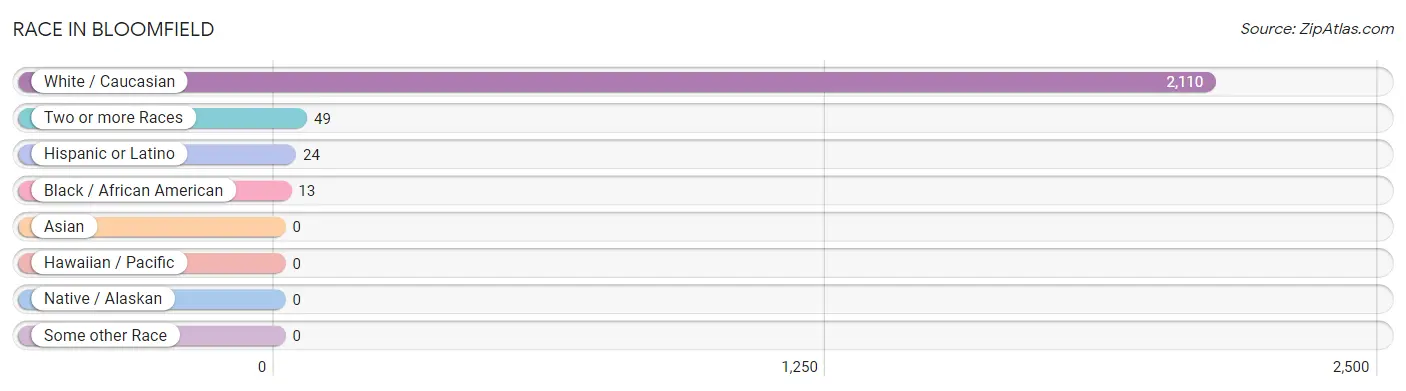
Race in Bloomfield
The most populous races in Bloomfield are White / Caucasian (2,110 | 97.2%), Two or more Races (49 | 2.3%), and Hispanic or Latino (24 | 1.1%).
| Race | # Population | % Population |
| Asian | 0 | 0.0% |
| Black / African American | 13 | 0.6% |
| Hawaiian / Pacific | 0 | 0.0% |
| Hispanic or Latino | 24 | 1.1% |
| Native / Alaskan | 0 | 0.0% |
| White / Caucasian | 2,110 | 97.2% |
| Two or more Races | 49 | 2.3% |
| Some other Race | 0 | 0.0% |
| Total | 2,172 | 100.0% |
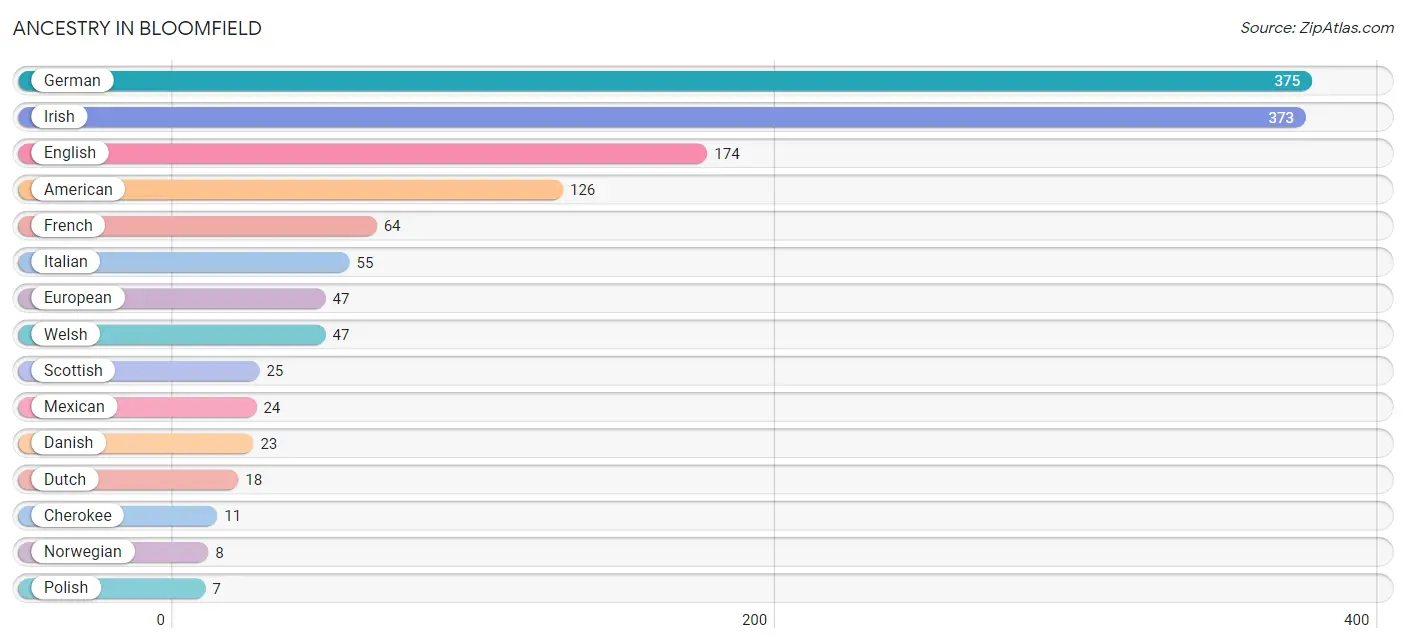
Ancestry in Bloomfield
The most populous ancestries reported in Bloomfield are German (375 | 17.3%), Irish (373 | 17.2%), English (174 | 8.0%), American (126 | 5.8%), and French (64 | 2.9%), together accounting for 51.2% of all Bloomfield residents.
| Ancestry | # Population | % Population |
| African | 2 | 0.1% |
| American | 126 | 5.8% |
| British | 6 | 0.3% |
| Cherokee | 11 | 0.5% |
| Danish | 23 | 1.1% |
| Dutch | 18 | 0.8% |
| English | 174 | 8.0% |
| European | 47 | 2.2% |
| French | 64 | 2.9% |
| German | 375 | 17.3% |
| Irish | 373 | 17.2% |
| Italian | 55 | 2.5% |
| Mexican | 24 | 1.1% |
| Norwegian | 8 | 0.4% |
| Polish | 7 | 0.3% |
| Scandinavian | 7 | 0.3% |
| Scotch-Irish | 3 | 0.1% |
| Scottish | 25 | 1.1% |
| Subsaharan African | 2 | 0.1% |
| Swedish | 3 | 0.1% |
| Welsh | 47 | 2.2% | View All 21 Rows |
Immigrants in Bloomfield

| Immigration Origin | # Population | % Population | View All 0 Rows |
Sex and Age in Bloomfield
Sex and Age in Bloomfield
The most populous age groups in Bloomfield are 10 to 14 Years (151 | 13.3%) for men and 65 to 69 Years (115 | 11.1%) for women.
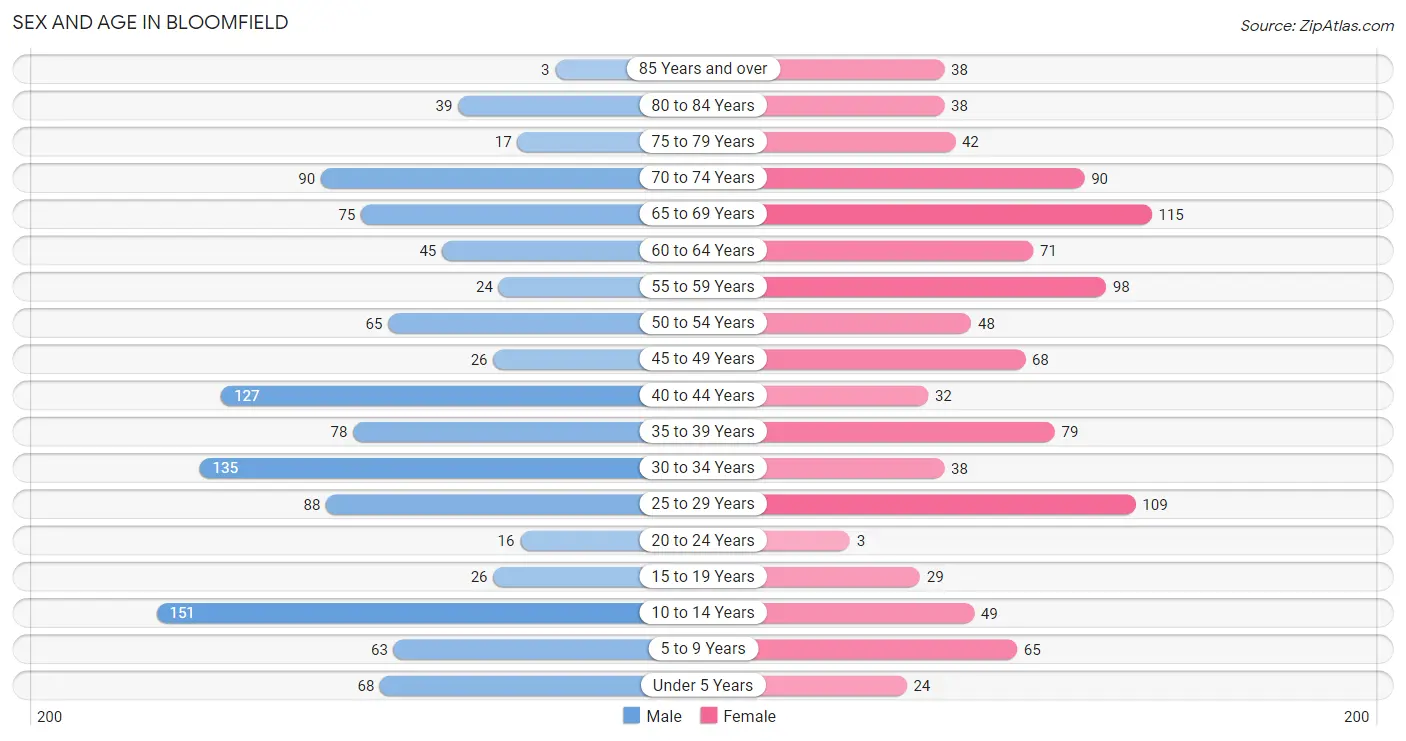
| Age Bracket | Male | Female |
| Under 5 Years | 68 (6.0%) | 24 (2.3%) |
| 5 to 9 Years | 63 (5.6%) | 65 (6.3%) |
| 10 to 14 Years | 151 (13.3%) | 49 (4.7%) |
| 15 to 19 Years | 26 (2.3%) | 29 (2.8%) |
| 20 to 24 Years | 16 (1.4%) | 3 (0.3%) |
| 25 to 29 Years | 88 (7.7%) | 109 (10.5%) |
| 30 to 34 Years | 135 (11.9%) | 38 (3.7%) |
| 35 to 39 Years | 78 (6.9%) | 79 (7.6%) |
| 40 to 44 Years | 127 (11.2%) | 32 (3.1%) |
| 45 to 49 Years | 26 (2.3%) | 68 (6.6%) |
| 50 to 54 Years | 65 (5.7%) | 48 (4.6%) |
| 55 to 59 Years | 24 (2.1%) | 98 (9.5%) |
| 60 to 64 Years | 45 (4.0%) | 71 (6.9%) |
| 65 to 69 Years | 75 (6.6%) | 115 (11.1%) |
| 70 to 74 Years | 90 (7.9%) | 90 (8.7%) |
| 75 to 79 Years | 17 (1.5%) | 42 (4.1%) |
| 80 to 84 Years | 39 (3.4%) | 38 (3.7%) |
| 85 Years and over | 3 (0.3%) | 38 (3.7%) |
| Total | 1,136 (100.0%) | 1,036 (100.0%) |
Families and Households in Bloomfield
Median Family Size in Bloomfield
The median family size in Bloomfield is 3.01 persons per family, with married-couple families (343 | 62.3%) accounting for the largest median family size of 3.12 persons per family. On the other hand, single male/father families (59 | 10.7%) represent the smallest median family size with 2.36 persons per family.
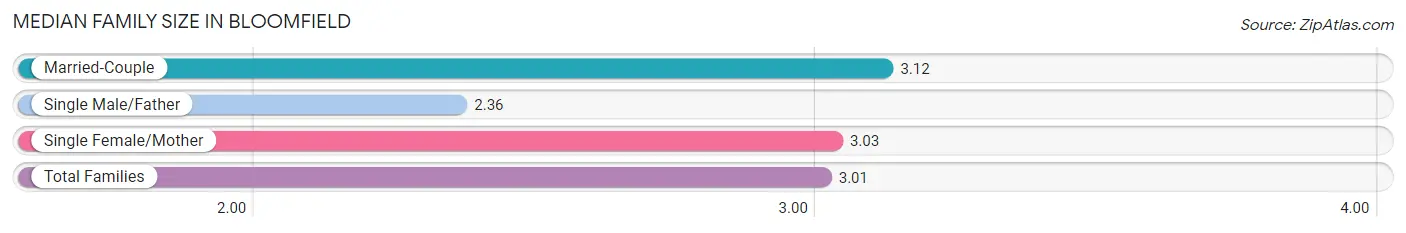
| Family Type | # Families | Family Size |
| Married-Couple | 343 (62.3%) | 3.12 |
| Single Male/Father | 59 (10.7%) | 2.36 |
| Single Female/Mother | 149 (27.0%) | 3.03 |
| Total Families | 551 (100.0%) | 3.01 |
Median Household Size in Bloomfield
The median household size in Bloomfield is 2.49 persons per household, with single female/mother households (149 | 18.0%) accounting for the largest median household size of 3.32 persons per household. non-family households (278 | 33.5%) represent the smallest median household size with 1.16 persons per household.

| Household Type | # Households | Household Size |
| Married-Couple | 343 (41.4%) | 3.13 |
| Single Male/Father | 59 (7.1%) | 2.97 |
| Single Female/Mother | 149 (18.0%) | 3.32 |
| Non-family | 278 (33.5%) | 1.16 |
| Total Households | 829 (100.0%) | 2.49 |
Household Size by Marriage Status in Bloomfield
Out of a total of 829 households in Bloomfield, 551 (66.5%) are family households, while 278 (33.5%) are nonfamily households. The most numerous type of family households are 2-person households, comprising 240, and the most common type of nonfamily households are 1-person households, comprising 236.
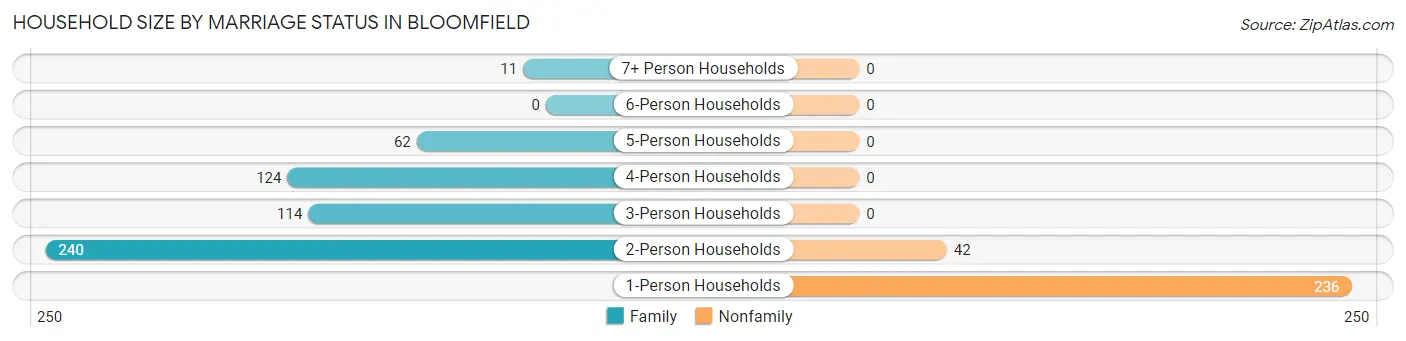
| Household Size | Family Households | Nonfamily Households |
| 1-Person Households | - | 236 (28.5%) |
| 2-Person Households | 240 (28.9%) | 42 (5.1%) |
| 3-Person Households | 114 (13.8%) | 0 (0.0%) |
| 4-Person Households | 124 (15.0%) | 0 (0.0%) |
| 5-Person Households | 62 (7.5%) | 0 (0.0%) |
| 6-Person Households | 0 (0.0%) | 0 (0.0%) |
| 7+ Person Households | 11 (1.3%) | 0 (0.0%) |
| Total | 551 (66.5%) | 278 (33.5%) |
Female Fertility in Bloomfield
Fertility by Age in Bloomfield
Average fertility rate in Bloomfield is 55.0 births per 1,000 women. Women in the age bracket of 20 to 34 years have the highest fertility rate with 133.0 births per 1,000 women. Women in the age bracket of 20 to 34 years acount for 100.0% of all women with births.
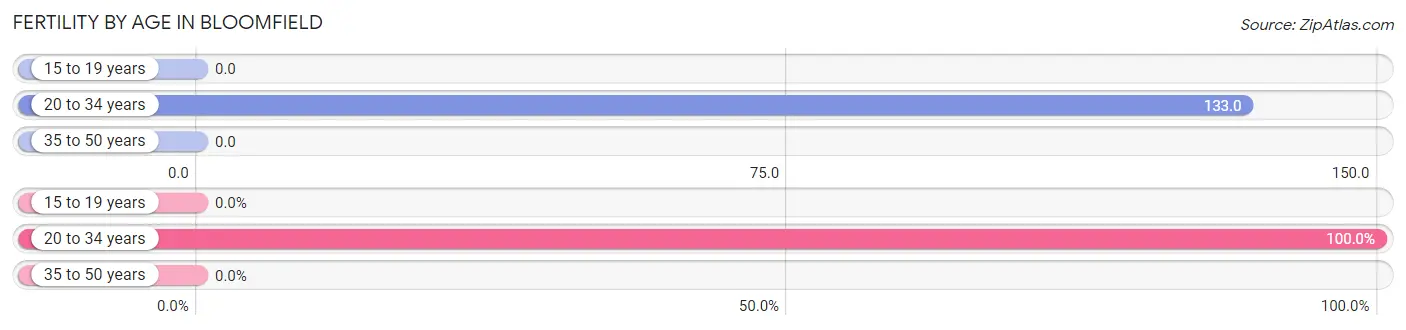
| Age Bracket | Women with Births | Births / 1,000 Women |
| 15 to 19 years | 0 (0.0%) | 0.0 |
| 20 to 34 years | 20 (100.0%) | 133.0 |
| 35 to 50 years | 0 (0.0%) | 0.0 |
| Total | 20 (100.0%) | 55.0 |
Fertility by Age by Marriage Status in Bloomfield
40.0% of women with births (20) in Bloomfield are married. The highest percentage of unmarried women with births falls into 20 to 34 years age bracket with 60.0% of them unmarried at the time of birth, while the lowest percentage of unmarried women with births belong to 20 to 34 years age bracket with 60.0% of them unmarried.
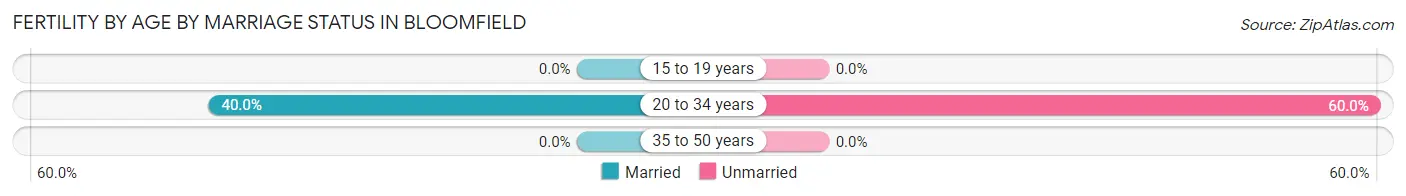
| Age Bracket | Married | Unmarried |
| 15 to 19 years | 0 (0.0%) | 0 (0.0%) |
| 20 to 34 years | 8 (40.0%) | 12 (60.0%) |
| 35 to 50 years | 0 (0.0%) | 0 (0.0%) |
| Total | 8 (40.0%) | 12 (60.0%) |
Fertility by Education in Bloomfield
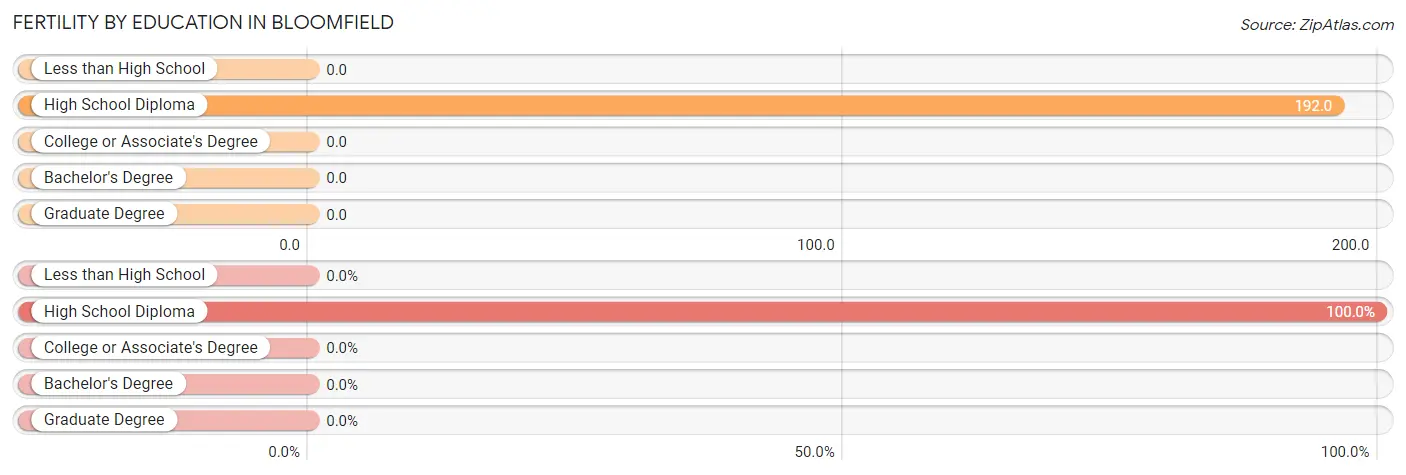
| Educational Attainment | Women with Births | Births / 1,000 Women |
| Less than High School | 0 (0.0%) | 0.0 |
| High School Diploma | 20 (100.0%) | 192.0 |
| College or Associate's Degree | 0 (0.0%) | 0.0 |
| Bachelor's Degree | 0 (0.0%) | 0.0 |
| Graduate Degree | 0 (0.0%) | 0.0 |
| Total | 20 (100.0%) | 55.0 |
Fertility by Education by Marriage Status in Bloomfield
60.0% of women with births in Bloomfield are unmarried. Women with the educational attainment of high school diploma are most likely to be married with 40.0% of them married at childbirth, while women with the educational attainment of high school diploma are least likely to be married with 60.0% of them unmarried at childbirth.
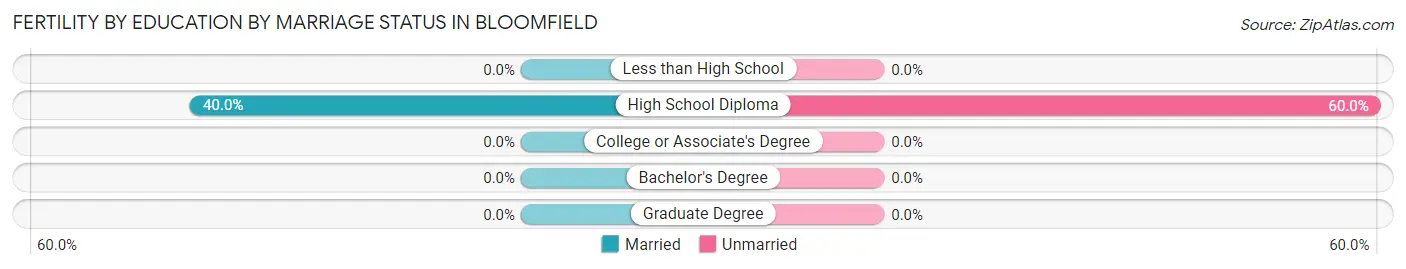
| Educational Attainment | Married | Unmarried |
| Less than High School | 0 (0.0%) | 0 (0.0%) |
| High School Diploma | 8 (40.0%) | 12 (60.0%) |
| College or Associate's Degree | 0 (0.0%) | 0 (0.0%) |
| Bachelor's Degree | 0 (0.0%) | 0 (0.0%) |
| Graduate Degree | 0 (0.0%) | 0 (0.0%) |
| Total | 8 (40.0%) | 12 (60.0%) |
Employment Characteristics in Bloomfield
Employment by Class of Employer in Bloomfield
Among the 687 employed individuals in Bloomfield, private company employees (493 | 71.8%), local government employees (81 | 11.8%), and self-employed (not incorporated) (37 | 5.4%) make up the most common classes of employment.
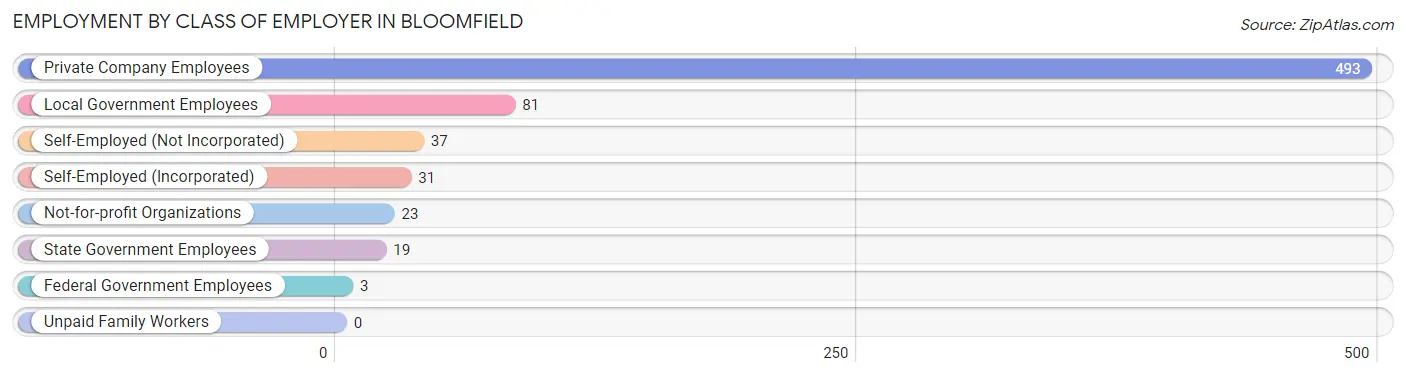
| Employer Class | # Employees | % Employees |
| Private Company Employees | 493 | 71.8% |
| Self-Employed (Incorporated) | 31 | 4.5% |
| Self-Employed (Not Incorporated) | 37 | 5.4% |
| Not-for-profit Organizations | 23 | 3.4% |
| Local Government Employees | 81 | 11.8% |
| State Government Employees | 19 | 2.8% |
| Federal Government Employees | 3 | 0.4% |
| Unpaid Family Workers | 0 | 0.0% |
| Total | 687 | 100.0% |
Employment Status by Age in Bloomfield
According to the labor force statistics for Bloomfield, out of the total population over 16 years of age (1,742), 43.1% or 751 individuals are in the labor force, with 8.1% or 61 of them unemployed. The age group with the highest labor force participation rate is 20 to 24 years, with 100.0% or 19 individuals in the labor force. Within the labor force, the 30 to 34 years age range has the highest percentage of unemployed individuals, with 20.7% or 26 of them being unemployed.
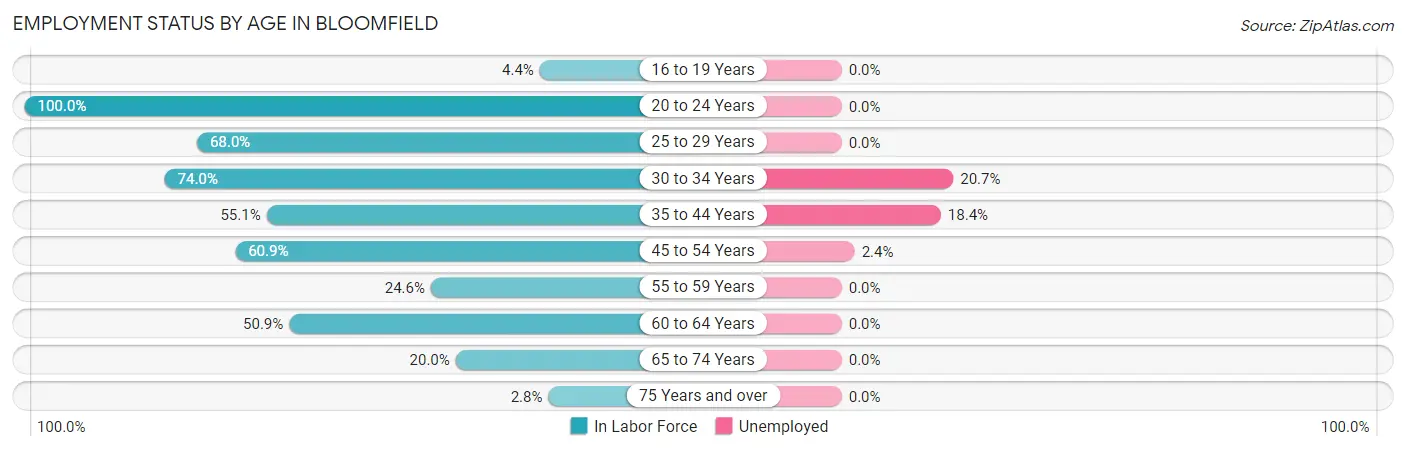
| Age Bracket | In Labor Force | Unemployed |
| 16 to 19 Years | 2 (4.4%) | 0 (0.0%) |
| 20 to 24 Years | 19 (100.0%) | 0 (0.0%) |
| 25 to 29 Years | 134 (68.0%) | 0 (0.0%) |
| 30 to 34 Years | 128 (74.0%) | 26 (20.7%) |
| 35 to 44 Years | 174 (55.1%) | 32 (18.4%) |
| 45 to 54 Years | 126 (60.9%) | 3 (2.4%) |
| 55 to 59 Years | 30 (24.6%) | 0 (0.0%) |
| 60 to 64 Years | 59 (50.9%) | 0 (0.0%) |
| 65 to 74 Years | 74 (20.0%) | 0 (0.0%) |
| 75 Years and over | 5 (2.8%) | 0 (0.0%) |
| Total | 751 (43.1%) | 61 (8.1%) |
Employment Status by Educational Attainment in Bloomfield
According to labor force statistics for Bloomfield, 57.6% of individuals (651) out of the total population between 25 and 64 years of age (1,131) are in the labor force, with 9.3% or 61 of them being unemployed. The group with the highest labor force participation rate are those with the educational attainment of bachelor's degree or higher, with 100.0% or 70 individuals in the labor force. Within the labor force, individuals with high school diploma education have the highest percentage of unemployment, with 15.2% or 37 of them being unemployed.
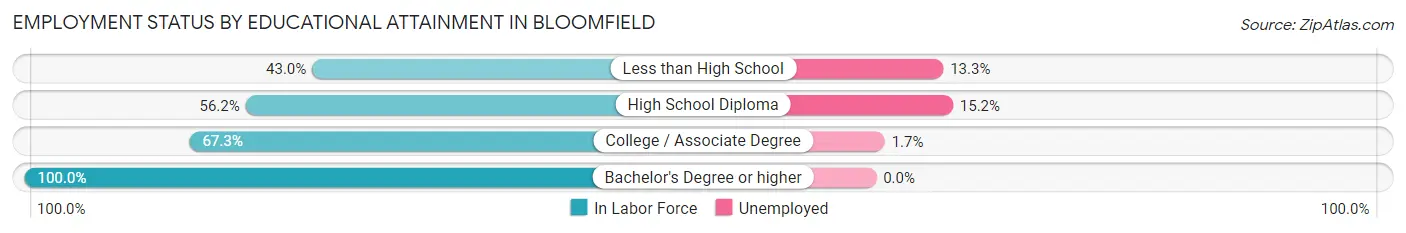
| Educational Attainment | In Labor Force | Unemployed |
| Less than High School | 150 (43.0%) | 46 (13.3%) |
| High School Diploma | 244 (56.2%) | 66 (15.2%) |
| College / Associate Degree | 187 (67.3%) | 5 (1.7%) |
| Bachelor's Degree or higher | 70 (100.0%) | 0 (0.0%) |
| Total | 651 (57.6%) | 105 (9.3%) |
Employment Occupations by Sex in Bloomfield
Management, Business, Science and Arts Occupations
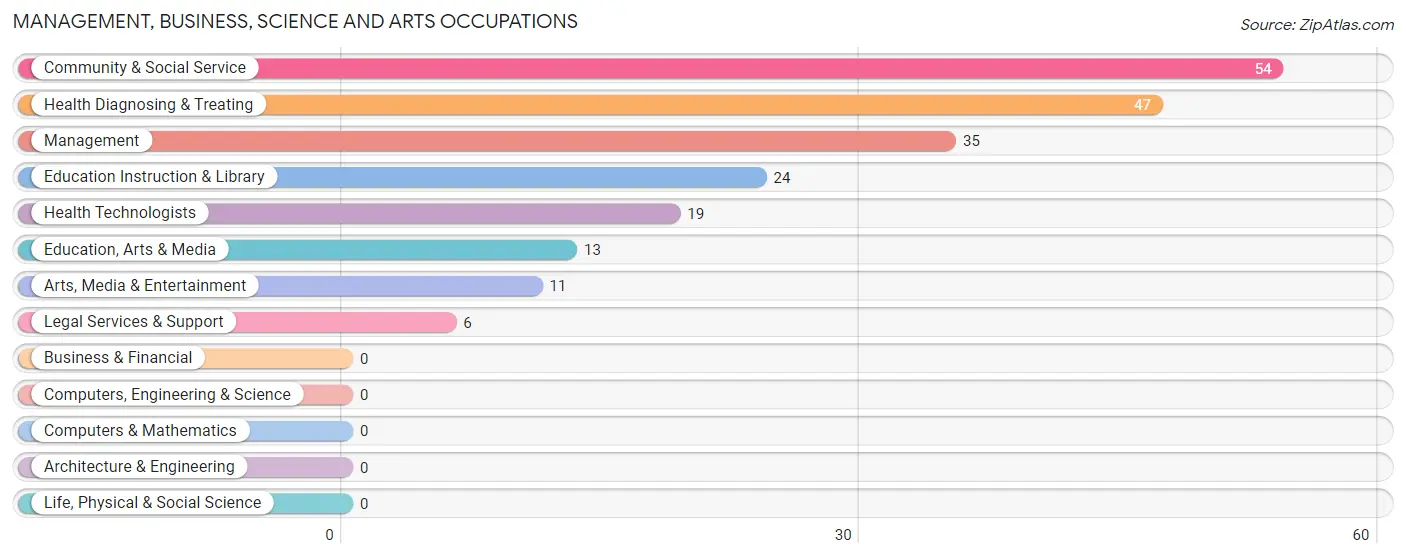
The most common Management, Business, Science and Arts occupations in Bloomfield are Community & Social Service (54 | 7.9%), Health Diagnosing & Treating (47 | 6.9%), Management (35 | 5.1%), Education Instruction & Library (24 | 3.5%), and Health Technologists (19 | 2.8%).
Management, Business, Science and Arts Occupations by Sex
Within the Management, Business, Science and Arts occupations in Bloomfield, the most male-oriented occupations are Legal Services & Support (100.0%), Arts, Media & Entertainment (100.0%), and Management (48.6%), while the most female-oriented occupations are Education Instruction & Library (100.0%), Health Diagnosing & Treating (72.3%), and Education, Arts & Media (69.2%).
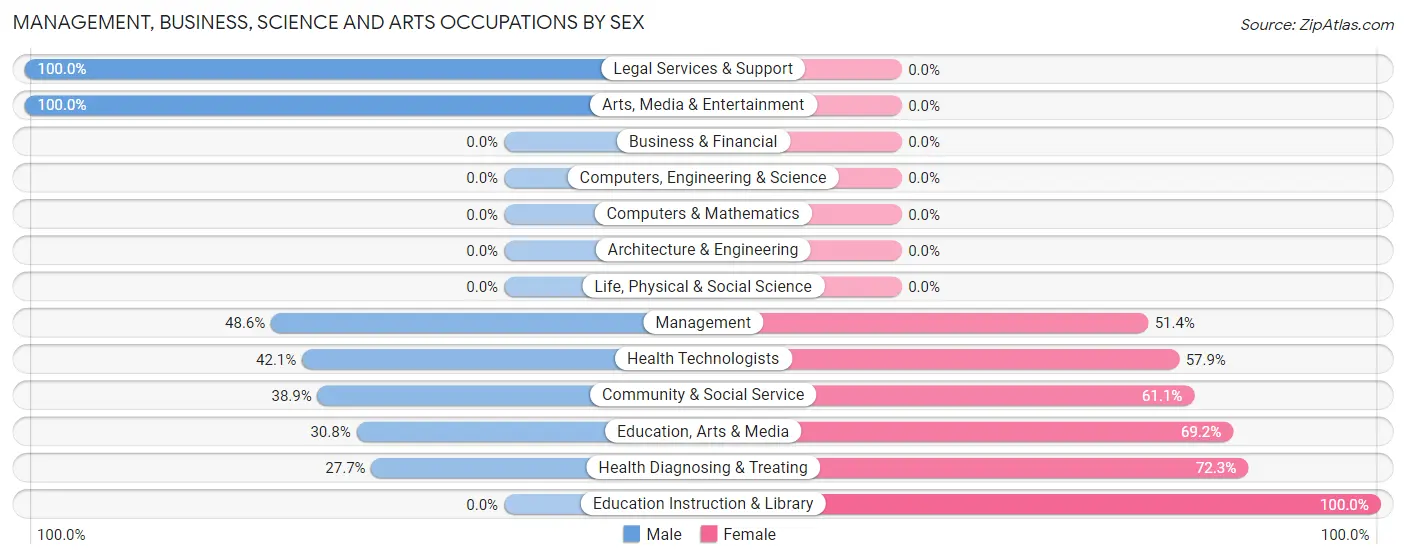
| Occupation | Male | Female |
| Management | 17 (48.6%) | 18 (51.4%) |
| Business & Financial | 0 (0.0%) | 0 (0.0%) |
| Computers, Engineering & Science | 0 (0.0%) | 0 (0.0%) |
| Computers & Mathematics | 0 (0.0%) | 0 (0.0%) |
| Architecture & Engineering | 0 (0.0%) | 0 (0.0%) |
| Life, Physical & Social Science | 0 (0.0%) | 0 (0.0%) |
| Community & Social Service | 21 (38.9%) | 33 (61.1%) |
| Education, Arts & Media | 4 (30.8%) | 9 (69.2%) |
| Legal Services & Support | 6 (100.0%) | 0 (0.0%) |
| Education Instruction & Library | 0 (0.0%) | 24 (100.0%) |
| Arts, Media & Entertainment | 11 (100.0%) | 0 (0.0%) |
| Health Diagnosing & Treating | 13 (27.7%) | 34 (72.3%) |
| Health Technologists | 8 (42.1%) | 11 (57.9%) |
| Total (Category) | 51 (37.5%) | 85 (62.5%) |
| Total (Overall) | 398 (58.2%) | 286 (41.8%) |
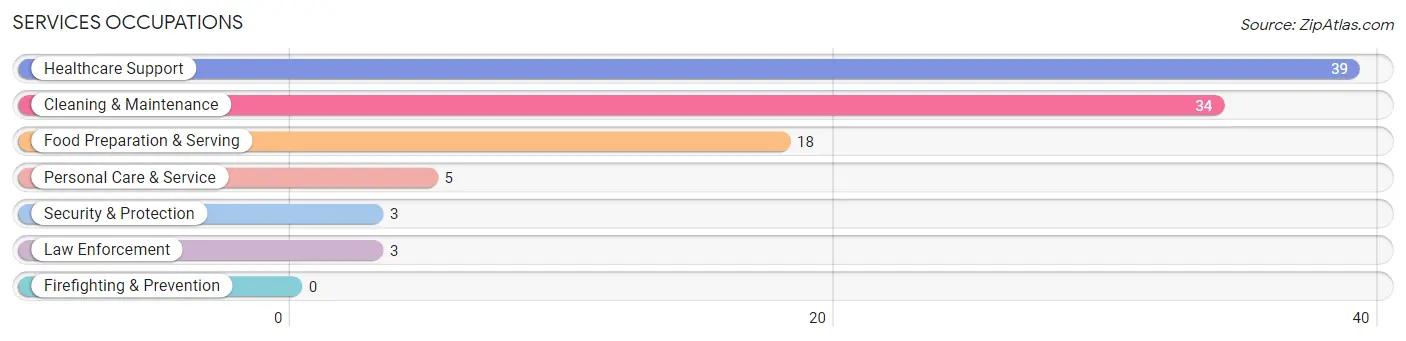
Services Occupations
The most common Services occupations in Bloomfield are Healthcare Support (39 | 5.7%), Cleaning & Maintenance (34 | 5.0%), Food Preparation & Serving (18 | 2.6%), Personal Care & Service (5 | 0.7%), and Security & Protection (3 | 0.4%).
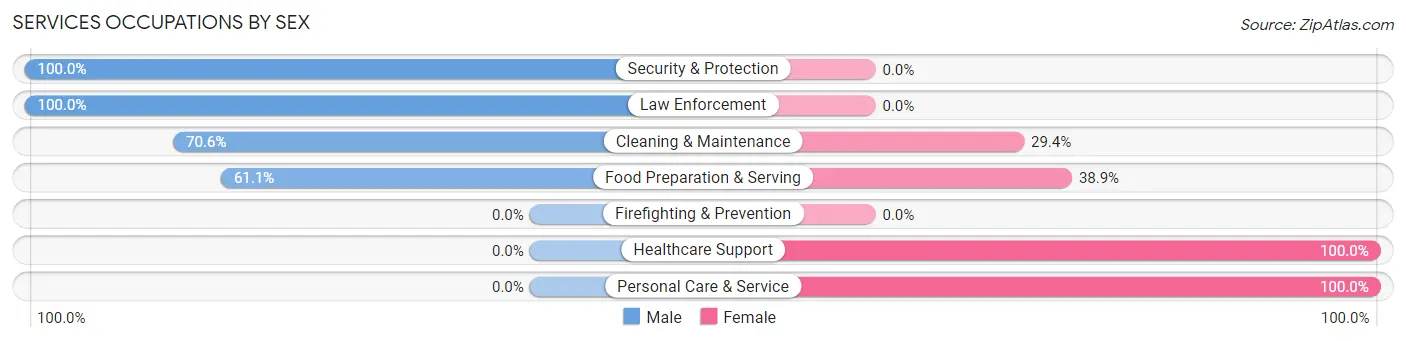
Services Occupations by Sex
Within the Services occupations in Bloomfield, the most male-oriented occupations are Security & Protection (100.0%), Law Enforcement (100.0%), and Cleaning & Maintenance (70.6%), while the most female-oriented occupations are Healthcare Support (100.0%), Personal Care & Service (100.0%), and Food Preparation & Serving (38.9%).
| Occupation | Male | Female |
| Healthcare Support | 0 (0.0%) | 39 (100.0%) |
| Security & Protection | 3 (100.0%) | 0 (0.0%) |
| Firefighting & Prevention | 0 (0.0%) | 0 (0.0%) |
| Law Enforcement | 3 (100.0%) | 0 (0.0%) |
| Food Preparation & Serving | 11 (61.1%) | 7 (38.9%) |
| Cleaning & Maintenance | 24 (70.6%) | 10 (29.4%) |
| Personal Care & Service | 0 (0.0%) | 5 (100.0%) |
| Total (Category) | 38 (38.4%) | 61 (61.6%) |
| Total (Overall) | 398 (58.2%) | 286 (41.8%) |
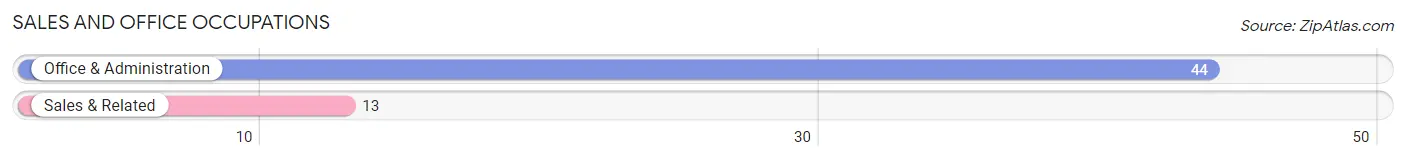
Sales and Office Occupations
The most common Sales and Office occupations in Bloomfield are Office & Administration (44 | 6.4%), and Sales & Related (13 | 1.9%).
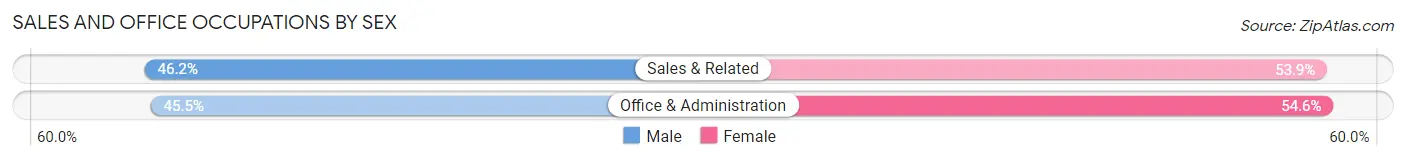
Sales and Office Occupations by Sex
| Occupation | Male | Female |
| Sales & Related | 6 (46.2%) | 7 (53.8%) |
| Office & Administration | 20 (45.5%) | 24 (54.5%) |
| Total (Category) | 26 (45.6%) | 31 (54.4%) |
| Total (Overall) | 398 (58.2%) | 286 (41.8%) |
Natural Resources, Construction and Maintenance Occupations
The most common Natural Resources, Construction and Maintenance occupations in Bloomfield are Construction & Extraction (59 | 8.6%), and Installation, Maintenance & Repair (58 | 8.5%).
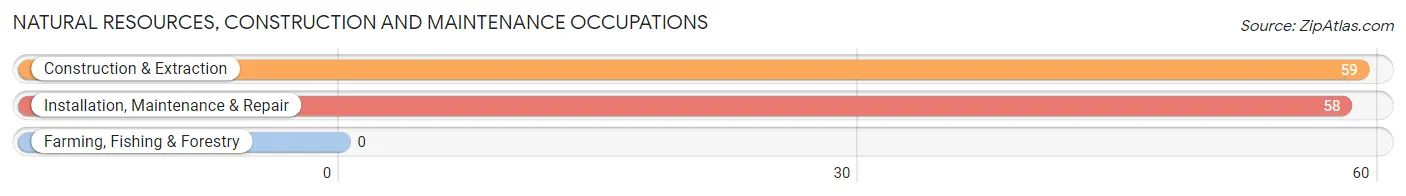
Natural Resources, Construction and Maintenance Occupations by Sex
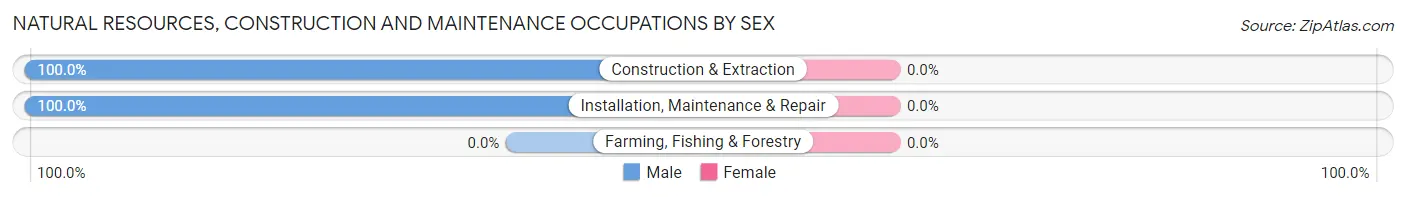
| Occupation | Male | Female |
| Farming, Fishing & Forestry | 0 (0.0%) | 0 (0.0%) |
| Construction & Extraction | 59 (100.0%) | 0 (0.0%) |
| Installation, Maintenance & Repair | 58 (100.0%) | 0 (0.0%) |
| Total (Category) | 117 (100.0%) | 0 (0.0%) |
| Total (Overall) | 398 (58.2%) | 286 (41.8%) |
Production, Transportation and Moving Occupations
The most common Production, Transportation and Moving occupations in Bloomfield are Transportation (126 | 18.4%), Material Moving (77 | 11.3%), and Production (72 | 10.5%).
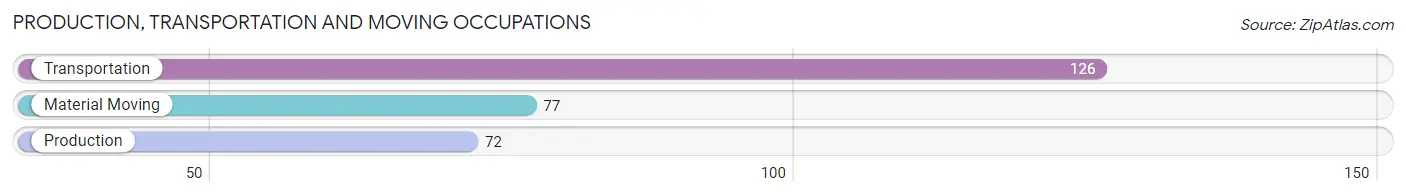
Production, Transportation and Moving Occupations by Sex
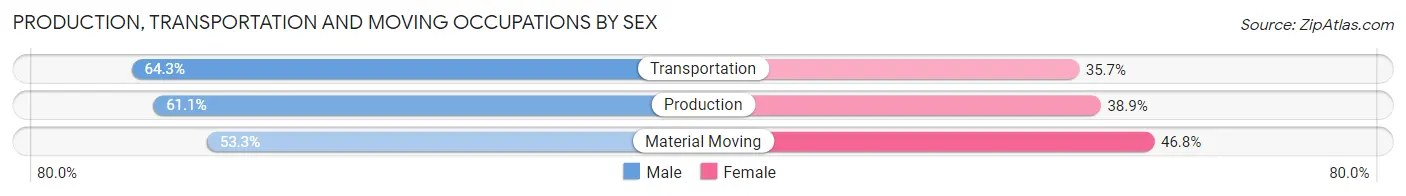
| Occupation | Male | Female |
| Production | 44 (61.1%) | 28 (38.9%) |
| Transportation | 81 (64.3%) | 45 (35.7%) |
| Material Moving | 41 (53.2%) | 36 (46.8%) |
| Total (Category) | 166 (60.4%) | 109 (39.6%) |
| Total (Overall) | 398 (58.2%) | 286 (41.8%) |
Employment Industries by Sex in Bloomfield
Employment Industries in Bloomfield
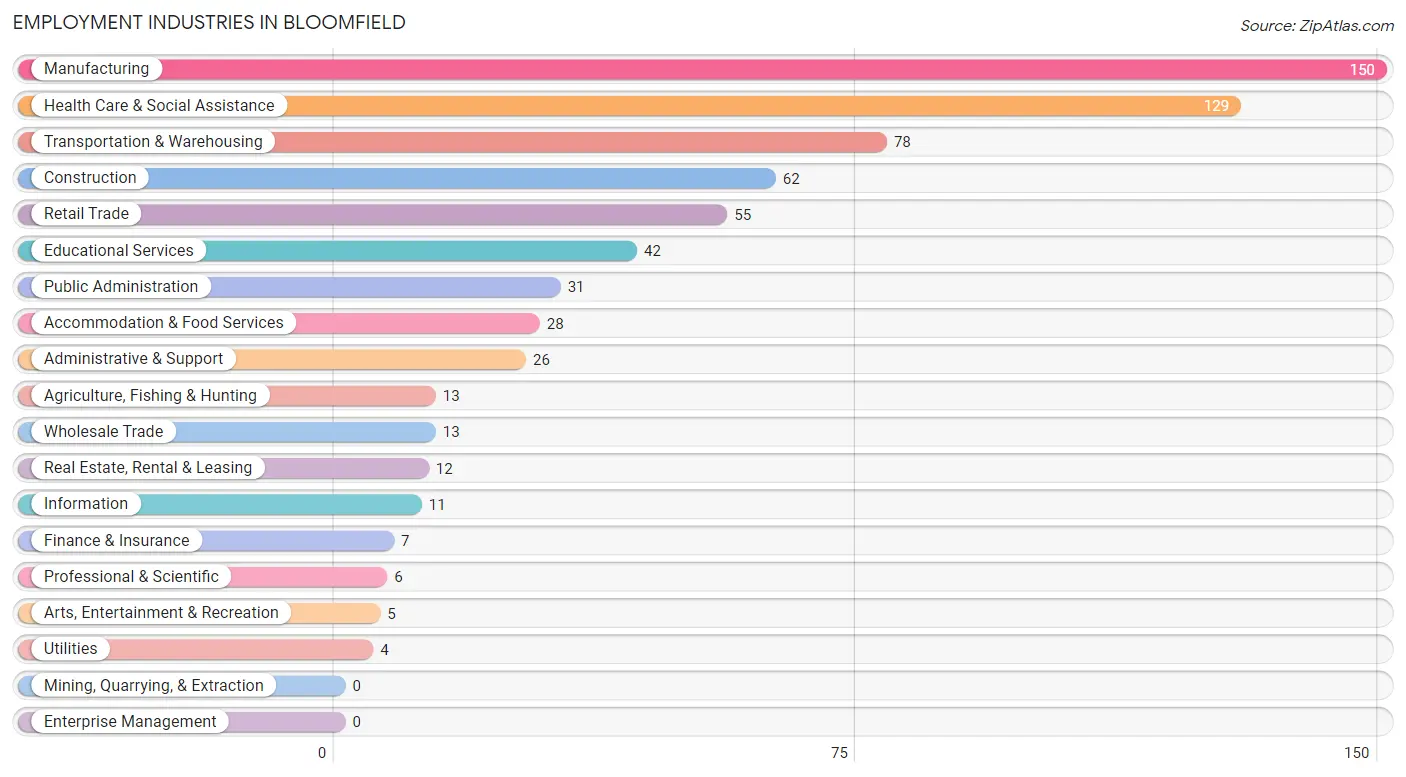
The major employment industries in Bloomfield include Manufacturing (150 | 21.9%), Health Care & Social Assistance (129 | 18.9%), Transportation & Warehousing (78 | 11.4%), Construction (62 | 9.1%), and Retail Trade (55 | 8.0%).
Employment Industries by Sex in Bloomfield
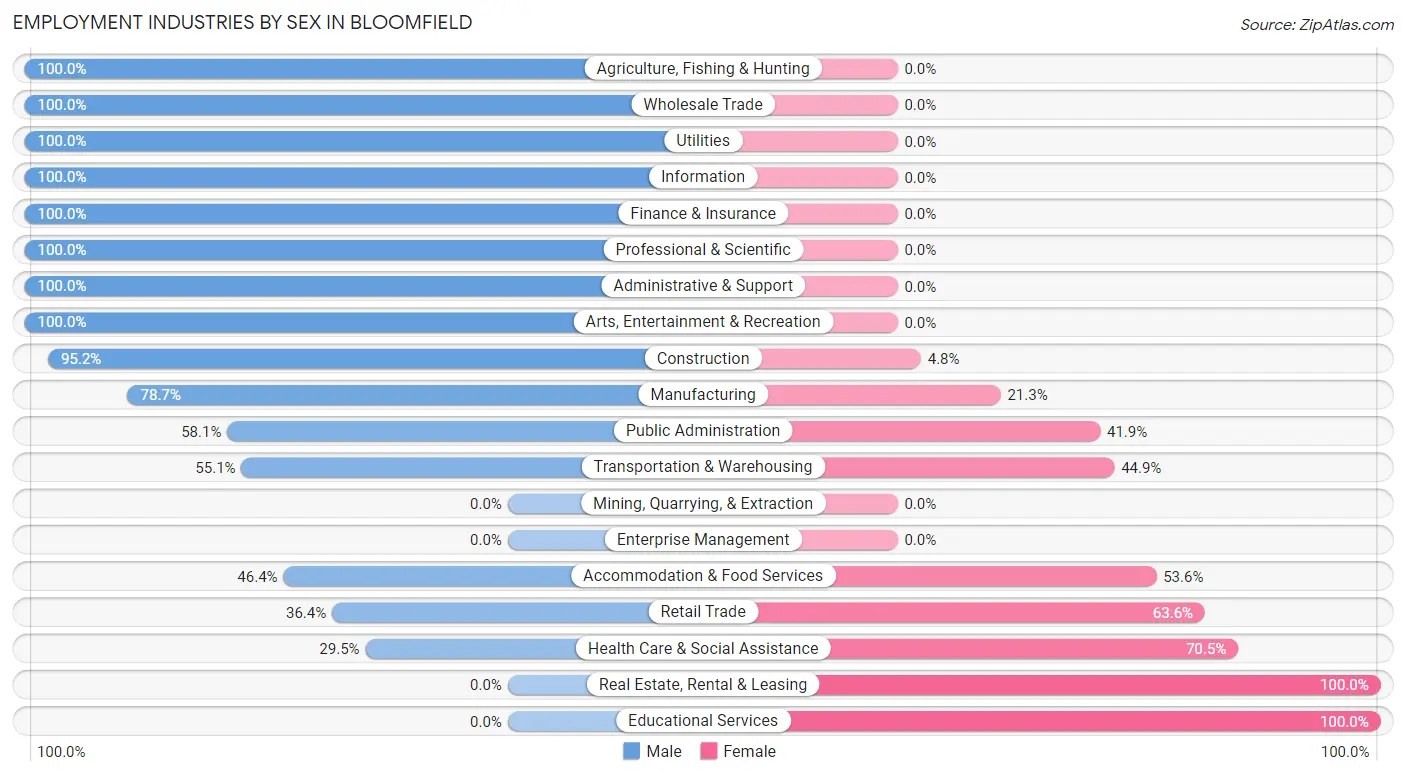
The Bloomfield industries that see more men than women are Agriculture, Fishing & Hunting (100.0%), Wholesale Trade (100.0%), and Utilities (100.0%), whereas the industries that tend to have a higher number of women are Real Estate, Rental & Leasing (100.0%), Educational Services (100.0%), and Health Care & Social Assistance (70.5%).
| Industry | Male | Female |
| Agriculture, Fishing & Hunting | 13 (100.0%) | 0 (0.0%) |
| Mining, Quarrying, & Extraction | 0 (0.0%) | 0 (0.0%) |
| Construction | 59 (95.2%) | 3 (4.8%) |
| Manufacturing | 118 (78.7%) | 32 (21.3%) |
| Wholesale Trade | 13 (100.0%) | 0 (0.0%) |
| Retail Trade | 20 (36.4%) | 35 (63.6%) |
| Transportation & Warehousing | 43 (55.1%) | 35 (44.9%) |
| Utilities | 4 (100.0%) | 0 (0.0%) |
| Information | 11 (100.0%) | 0 (0.0%) |
| Finance & Insurance | 7 (100.0%) | 0 (0.0%) |
| Real Estate, Rental & Leasing | 0 (0.0%) | 12 (100.0%) |
| Professional & Scientific | 6 (100.0%) | 0 (0.0%) |
| Enterprise Management | 0 (0.0%) | 0 (0.0%) |
| Administrative & Support | 26 (100.0%) | 0 (0.0%) |
| Educational Services | 0 (0.0%) | 42 (100.0%) |
| Health Care & Social Assistance | 38 (29.5%) | 91 (70.5%) |
| Arts, Entertainment & Recreation | 5 (100.0%) | 0 (0.0%) |
| Accommodation & Food Services | 13 (46.4%) | 15 (53.6%) |
| Public Administration | 18 (58.1%) | 13 (41.9%) |
| Total | 398 (58.2%) | 286 (41.8%) |
Education in Bloomfield
School Enrollment in Bloomfield
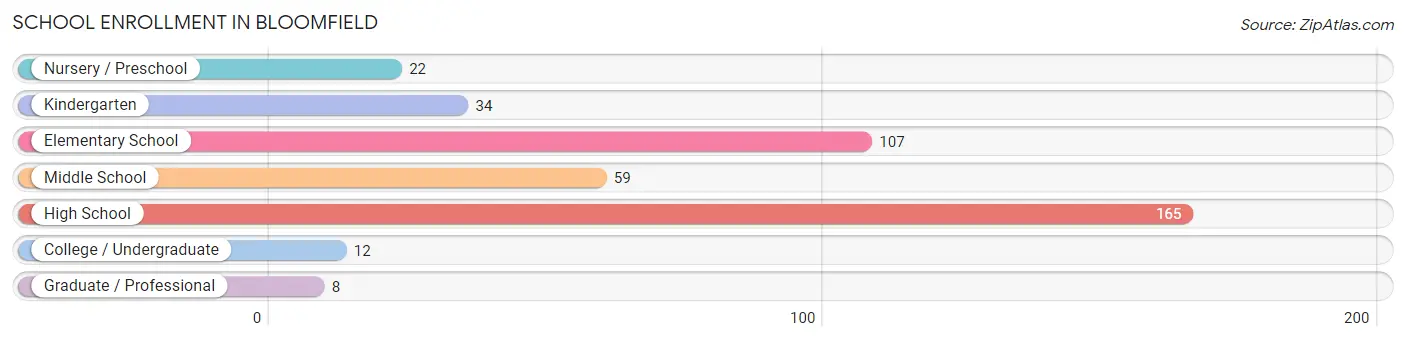
The most common levels of schooling among the 407 students in Bloomfield are high school (165 | 40.5%), elementary school (107 | 26.3%), and middle school (59 | 14.5%).
| School Level | # Students | % Students |
| Nursery / Preschool | 22 | 5.4% |
| Kindergarten | 34 | 8.4% |
| Elementary School | 107 | 26.3% |
| Middle School | 59 | 14.5% |
| High School | 165 | 40.5% |
| College / Undergraduate | 12 | 2.9% |
| Graduate / Professional | 8 | 2.0% |
| Total | 407 | 100.0% |
School Enrollment by Age by Funding Source in Bloomfield
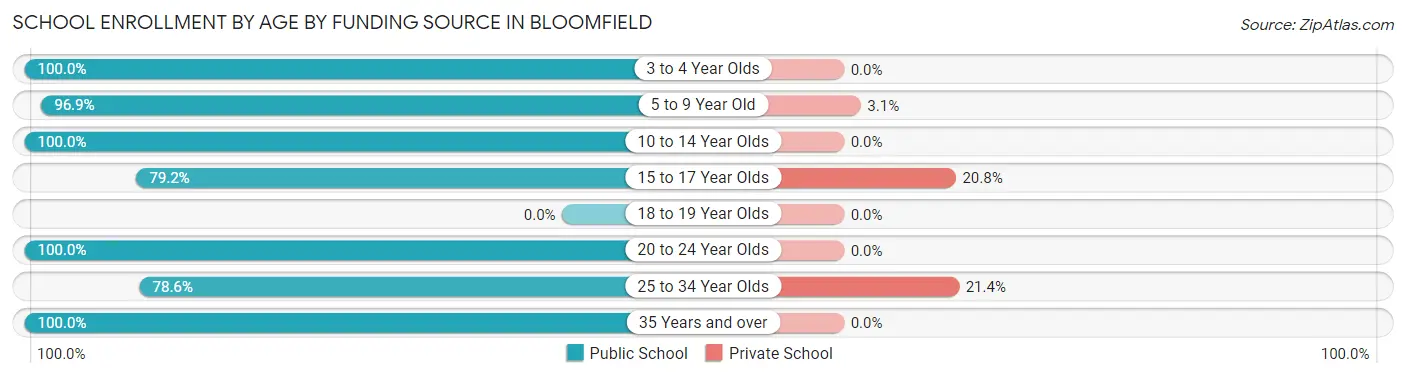
Out of a total of 407 students who are enrolled in schools in Bloomfield, 17 (4.2%) attend a private institution, while the remaining 390 (95.8%) are enrolled in public schools. The age group of 25 to 34 year olds has the highest likelihood of being enrolled in private schools, with 3 (21.4% in the age bracket) enrolled. Conversely, the age group of 3 to 4 year olds has the lowest likelihood of being enrolled in a private school, with 11 (100.0% in the age bracket) attending a public institution.
| Age Bracket | Public School | Private School |
| 3 to 4 Year Olds | 11 (100.0%) | 0 (0.0%) |
| 5 to 9 Year Old | 124 (96.9%) | 4 (3.1%) |
| 10 to 14 Year Olds | 200 (100.0%) | 0 (0.0%) |
| 15 to 17 Year Olds | 38 (79.2%) | 10 (20.8%) |
| 18 to 19 Year Olds | 0 (0.0%) | 0 (0.0%) |
| 20 to 24 Year Olds | 3 (100.0%) | 0 (0.0%) |
| 25 to 34 Year Olds | 11 (78.6%) | 3 (21.4%) |
| 35 Years and over | 3 (100.0%) | 0 (0.0%) |
| Total | 390 (95.8%) | 17 (4.2%) |
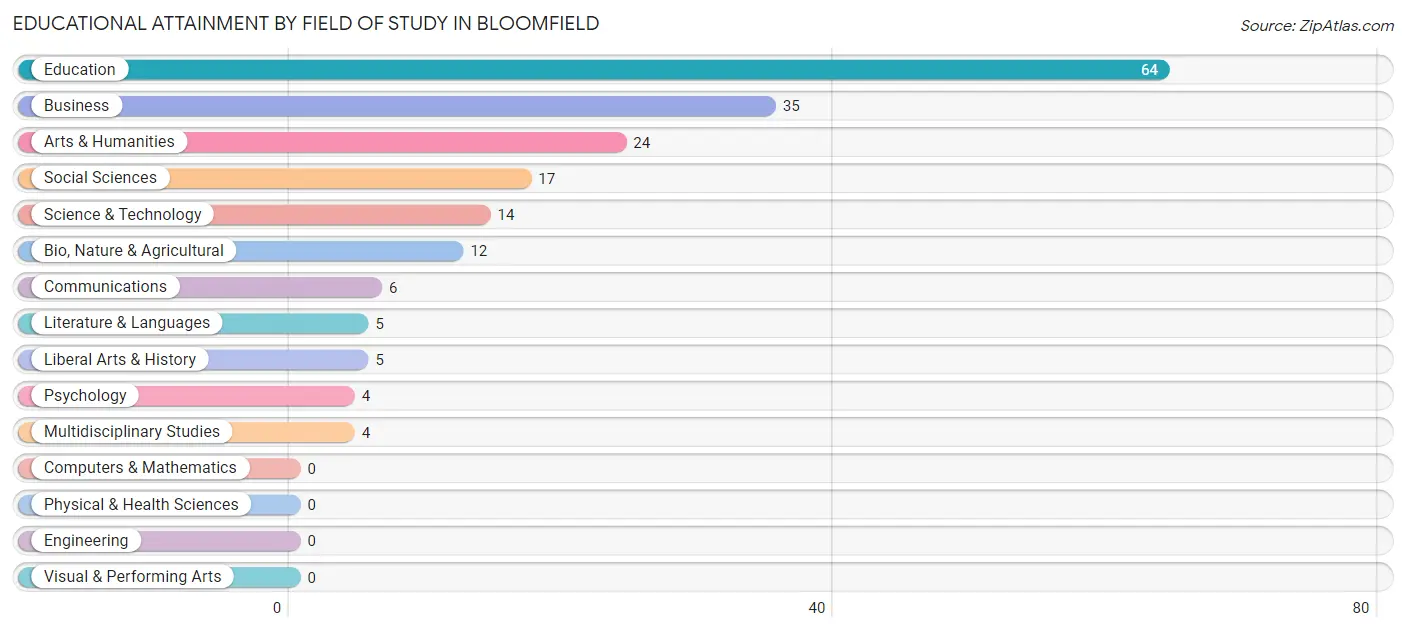
Educational Attainment by Field of Study in Bloomfield
Education (64 | 33.7%), business (35 | 18.4%), arts & humanities (24 | 12.6%), social sciences (17 | 8.9%), and science & technology (14 | 7.4%) are the most common fields of study among 190 individuals in Bloomfield who have obtained a bachelor's degree or higher.
| Field of Study | # Graduates | % Graduates |
| Computers & Mathematics | 0 | 0.0% |
| Bio, Nature & Agricultural | 12 | 6.3% |
| Physical & Health Sciences | 0 | 0.0% |
| Psychology | 4 | 2.1% |
| Social Sciences | 17 | 8.9% |
| Engineering | 0 | 0.0% |
| Multidisciplinary Studies | 4 | 2.1% |
| Science & Technology | 14 | 7.4% |
| Business | 35 | 18.4% |
| Education | 64 | 33.7% |
| Literature & Languages | 5 | 2.6% |
| Liberal Arts & History | 5 | 2.6% |
| Visual & Performing Arts | 0 | 0.0% |
| Communications | 6 | 3.2% |
| Arts & Humanities | 24 | 12.6% |
| Total | 190 | 100.0% |
Transportation & Commute in Bloomfield
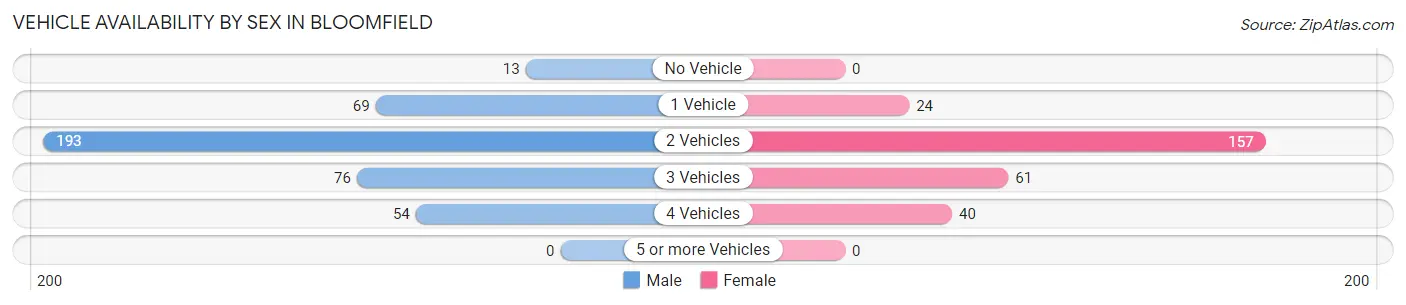
Vehicle Availability by Sex in Bloomfield
The most prevalent vehicle ownership categories in Bloomfield are males with 2 vehicles (193, accounting for 47.6%) and females with 2 vehicles (157, making up 68.4%).
| Vehicles Available | Male | Female |
| No Vehicle | 13 (3.2%) | 0 (0.0%) |
| 1 Vehicle | 69 (17.0%) | 24 (8.5%) |
| 2 Vehicles | 193 (47.6%) | 157 (55.7%) |
| 3 Vehicles | 76 (18.8%) | 61 (21.6%) |
| 4 Vehicles | 54 (13.3%) | 40 (14.2%) |
| 5 or more Vehicles | 0 (0.0%) | 0 (0.0%) |
| Total | 405 (100.0%) | 282 (100.0%) |
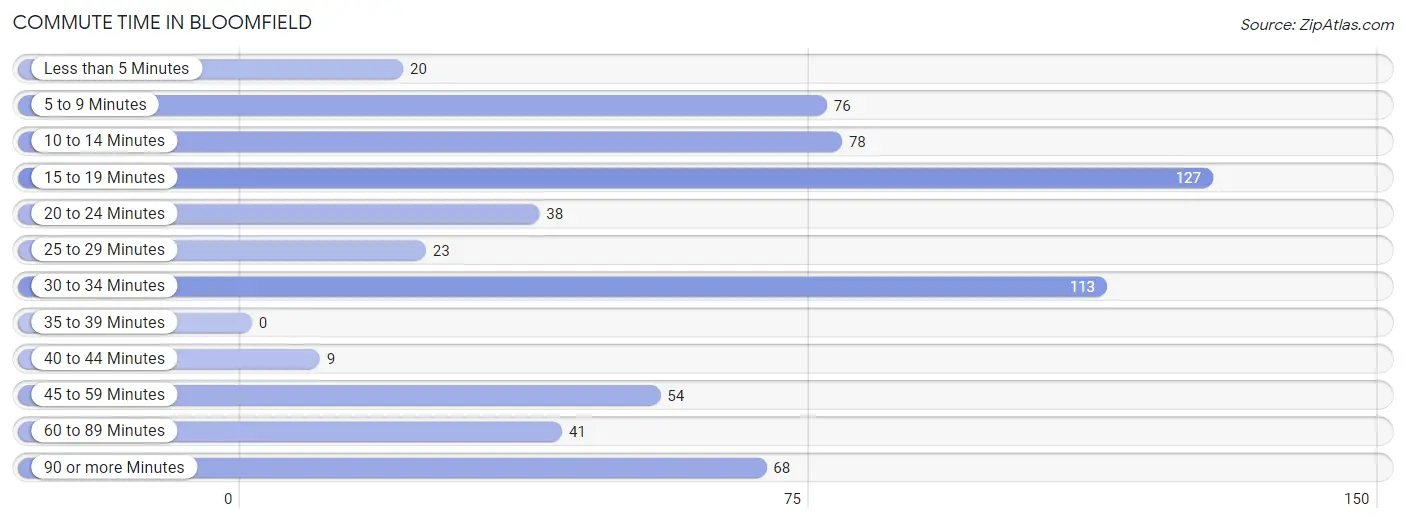
Commute Time in Bloomfield
The most frequently occuring commute durations in Bloomfield are 15 to 19 minutes (127 commuters, 19.6%), 30 to 34 minutes (113 commuters, 17.5%), and 10 to 14 minutes (78 commuters, 12.1%).
| Commute Time | # Commuters | % Commuters |
| Less than 5 Minutes | 20 | 3.1% |
| 5 to 9 Minutes | 76 | 11.7% |
| 10 to 14 Minutes | 78 | 12.1% |
| 15 to 19 Minutes | 127 | 19.6% |
| 20 to 24 Minutes | 38 | 5.9% |
| 25 to 29 Minutes | 23 | 3.5% |
| 30 to 34 Minutes | 113 | 17.5% |
| 35 to 39 Minutes | 0 | 0.0% |
| 40 to 44 Minutes | 9 | 1.4% |
| 45 to 59 Minutes | 54 | 8.4% |
| 60 to 89 Minutes | 41 | 6.3% |
| 90 or more Minutes | 68 | 10.5% |
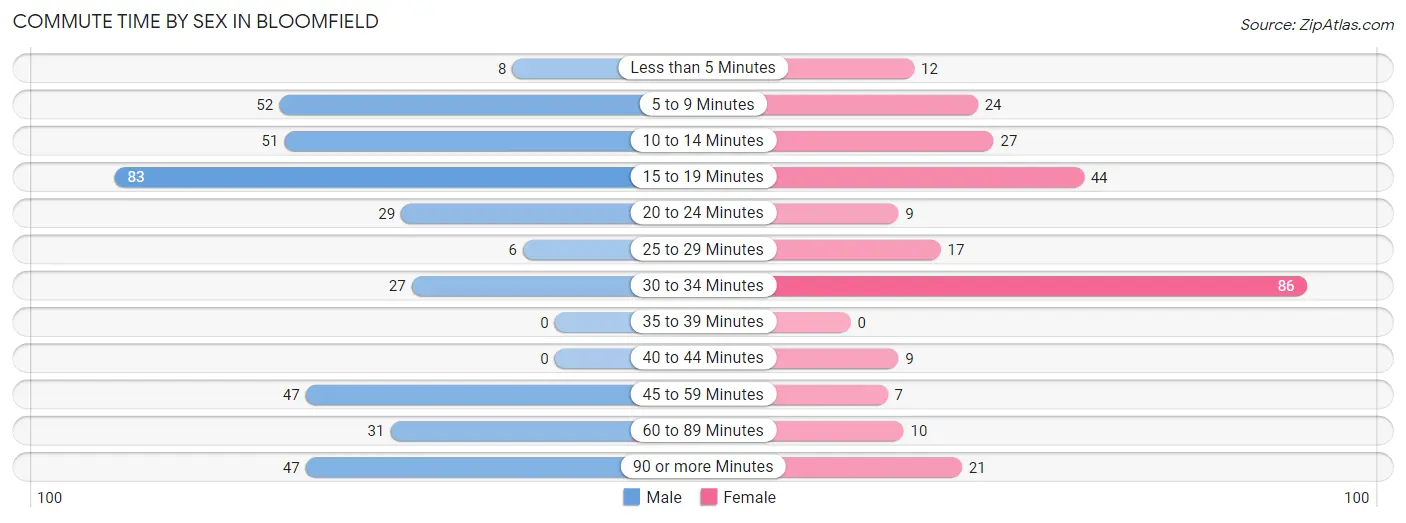
Commute Time by Sex in Bloomfield
The most common commute times in Bloomfield are 15 to 19 minutes (83 commuters, 21.8%) for males and 30 to 34 minutes (86 commuters, 32.3%) for females.
| Commute Time | Male | Female |
| Less than 5 Minutes | 8 (2.1%) | 12 (4.5%) |
| 5 to 9 Minutes | 52 (13.7%) | 24 (9.0%) |
| 10 to 14 Minutes | 51 (13.4%) | 27 (10.2%) |
| 15 to 19 Minutes | 83 (21.8%) | 44 (16.5%) |
| 20 to 24 Minutes | 29 (7.6%) | 9 (3.4%) |
| 25 to 29 Minutes | 6 (1.6%) | 17 (6.4%) |
| 30 to 34 Minutes | 27 (7.1%) | 86 (32.3%) |
| 35 to 39 Minutes | 0 (0.0%) | 0 (0.0%) |
| 40 to 44 Minutes | 0 (0.0%) | 9 (3.4%) |
| 45 to 59 Minutes | 47 (12.3%) | 7 (2.6%) |
| 60 to 89 Minutes | 31 (8.1%) | 10 (3.8%) |
| 90 or more Minutes | 47 (12.3%) | 21 (7.9%) |
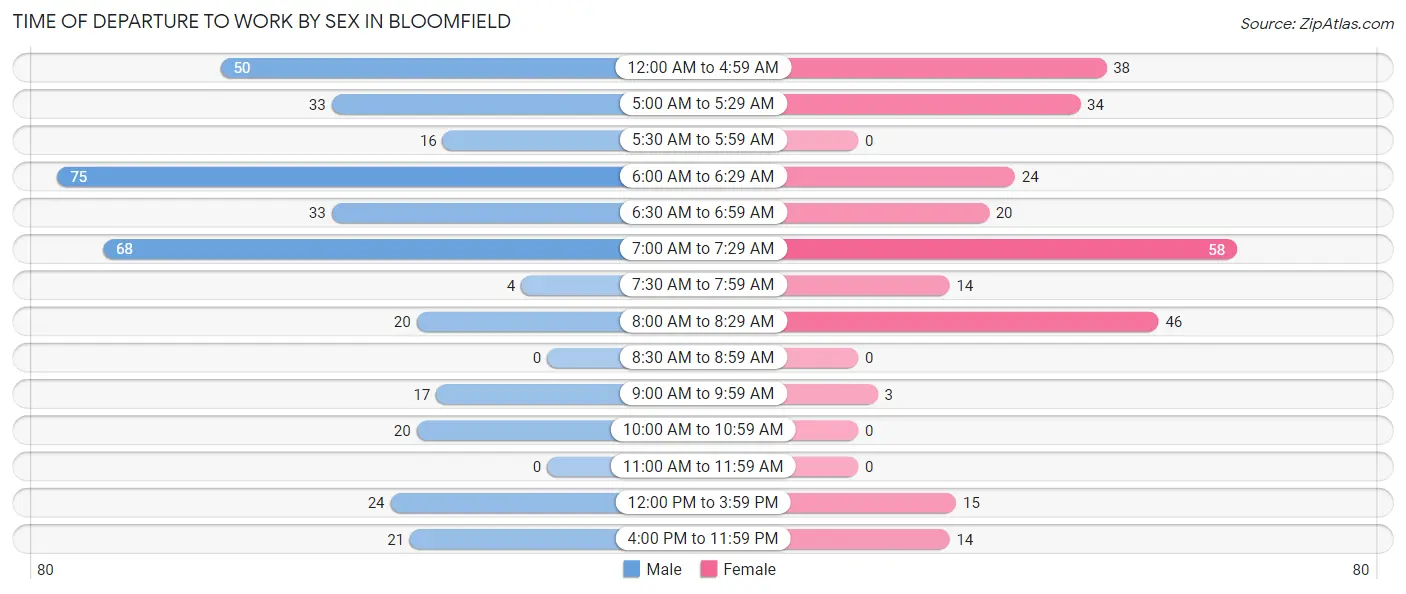
Time of Departure to Work by Sex in Bloomfield
The most frequent times of departure to work in Bloomfield are 6:00 AM to 6:29 AM (75, 19.7%) for males and 7:00 AM to 7:29 AM (58, 21.8%) for females.
| Time of Departure | Male | Female |
| 12:00 AM to 4:59 AM | 50 (13.1%) | 38 (14.3%) |
| 5:00 AM to 5:29 AM | 33 (8.7%) | 34 (12.8%) |
| 5:30 AM to 5:59 AM | 16 (4.2%) | 0 (0.0%) |
| 6:00 AM to 6:29 AM | 75 (19.7%) | 24 (9.0%) |
| 6:30 AM to 6:59 AM | 33 (8.7%) | 20 (7.5%) |
| 7:00 AM to 7:29 AM | 68 (17.8%) | 58 (21.8%) |
| 7:30 AM to 7:59 AM | 4 (1.1%) | 14 (5.3%) |
| 8:00 AM to 8:29 AM | 20 (5.2%) | 46 (17.3%) |
| 8:30 AM to 8:59 AM | 0 (0.0%) | 0 (0.0%) |
| 9:00 AM to 9:59 AM | 17 (4.5%) | 3 (1.1%) |
| 10:00 AM to 10:59 AM | 20 (5.2%) | 0 (0.0%) |
| 11:00 AM to 11:59 AM | 0 (0.0%) | 0 (0.0%) |
| 12:00 PM to 3:59 PM | 24 (6.3%) | 15 (5.6%) |
| 4:00 PM to 11:59 PM | 21 (5.5%) | 14 (5.3%) |
| Total | 381 (100.0%) | 266 (100.0%) |
Housing Occupancy in Bloomfield
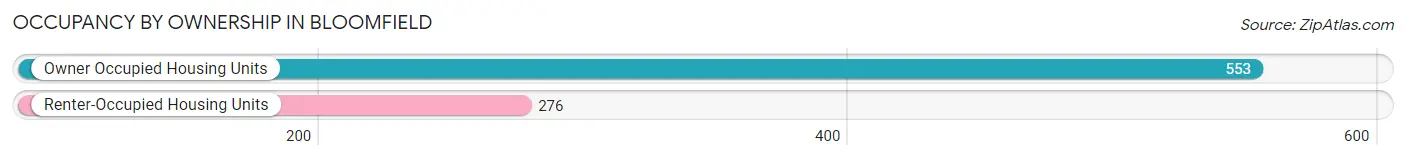
Occupancy by Ownership in Bloomfield
Of the total 829 dwellings in Bloomfield, owner-occupied units account for 553 (66.7%), while renter-occupied units make up 276 (33.3%).
| Occupancy | # Housing Units | % Housing Units |
| Owner Occupied Housing Units | 553 | 66.7% |
| Renter-Occupied Housing Units | 276 | 33.3% |
| Total Occupied Housing Units | 829 | 100.0% |
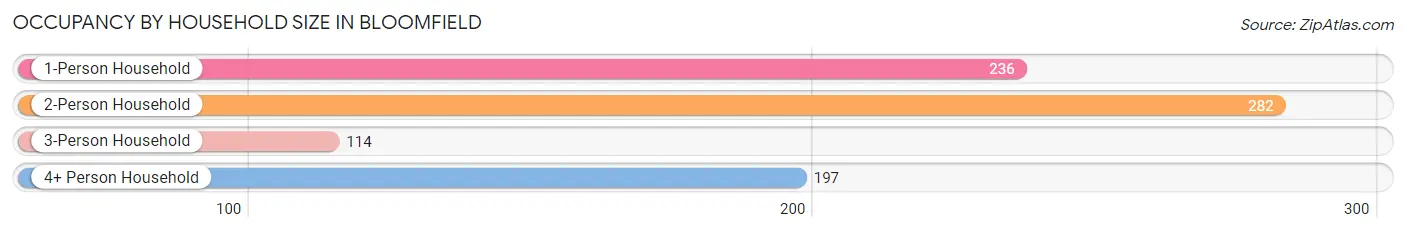
Occupancy by Household Size in Bloomfield
| Household Size | # Housing Units | % Housing Units |
| 1-Person Household | 236 | 28.5% |
| 2-Person Household | 282 | 34.0% |
| 3-Person Household | 114 | 13.8% |
| 4+ Person Household | 197 | 23.8% |
| Total Housing Units | 829 | 100.0% |
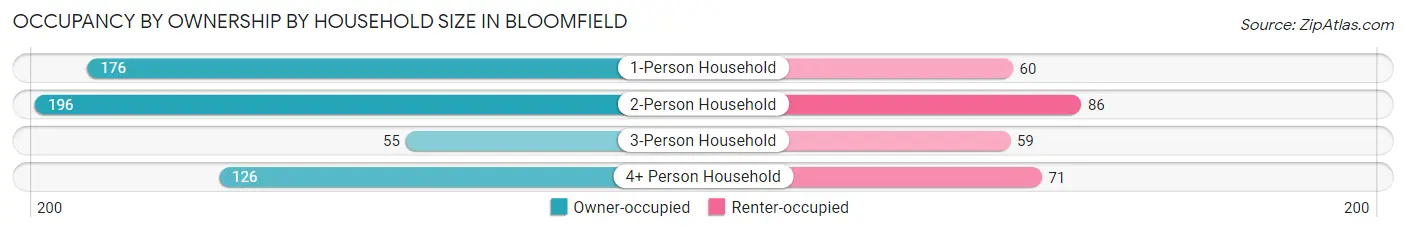
Occupancy by Ownership by Household Size in Bloomfield
| Household Size | Owner-occupied | Renter-occupied |
| 1-Person Household | 176 (74.6%) | 60 (25.4%) |
| 2-Person Household | 196 (69.5%) | 86 (30.5%) |
| 3-Person Household | 55 (48.2%) | 59 (51.7%) |
| 4+ Person Household | 126 (64.0%) | 71 (36.0%) |
| Total Housing Units | 553 (66.7%) | 276 (33.3%) |
Occupancy by Educational Attainment in Bloomfield
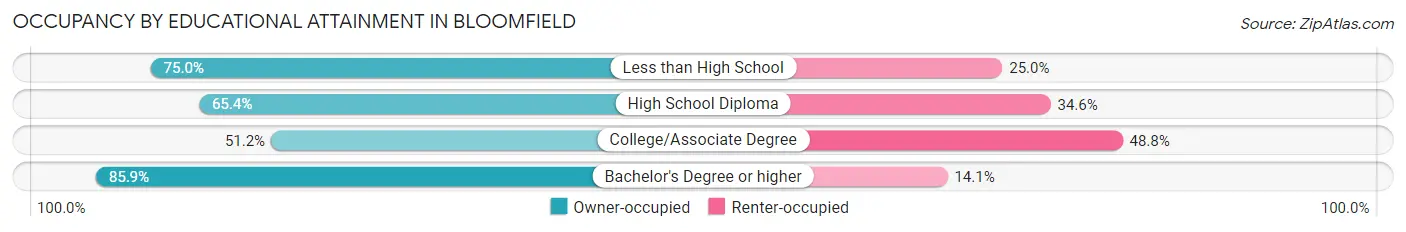
| Household Size | Owner-occupied | Renter-occupied |
| Less than High School | 165 (75.0%) | 55 (25.0%) |
| High School Diploma | 193 (65.4%) | 102 (34.6%) |
| College/Associate Degree | 110 (51.2%) | 105 (48.8%) |
| Bachelor's Degree or higher | 85 (85.9%) | 14 (14.1%) |
Occupancy by Age of Householder in Bloomfield
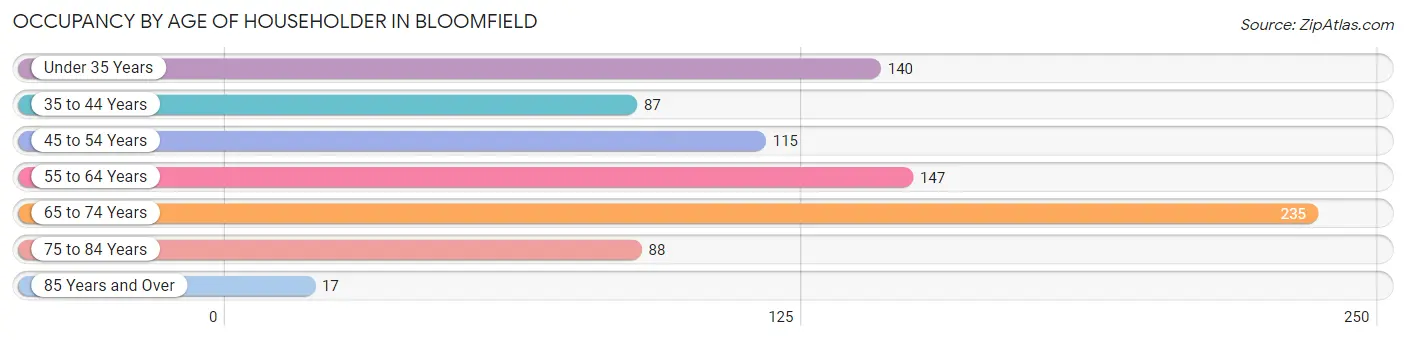
| Age Bracket | # Households | % Households |
| Under 35 Years | 140 | 16.9% |
| 35 to 44 Years | 87 | 10.5% |
| 45 to 54 Years | 115 | 13.9% |
| 55 to 64 Years | 147 | 17.7% |
| 65 to 74 Years | 235 | 28.3% |
| 75 to 84 Years | 88 | 10.6% |
| 85 Years and Over | 17 | 2.1% |
| Total | 829 | 100.0% |
Housing Finances in Bloomfield
Median Income by Occupancy in Bloomfield
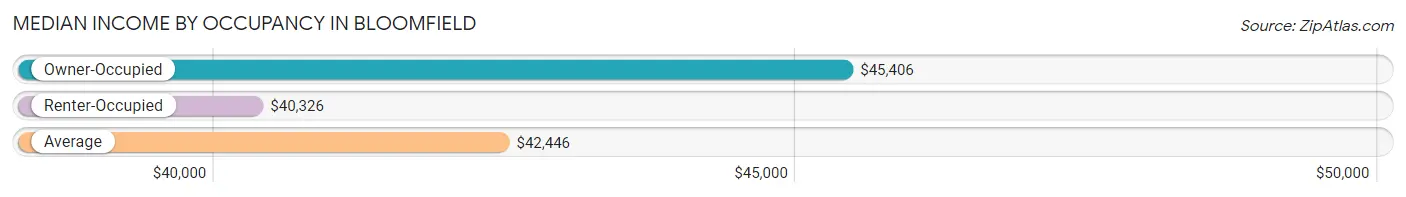
| Occupancy Type | # Households | Median Income |
| Owner-Occupied | 553 (66.7%) | $45,406 |
| Renter-Occupied | 276 (33.3%) | $40,326 |
| Average | 829 (100.0%) | $42,446 |
Occupancy by Householder Income Bracket in Bloomfield
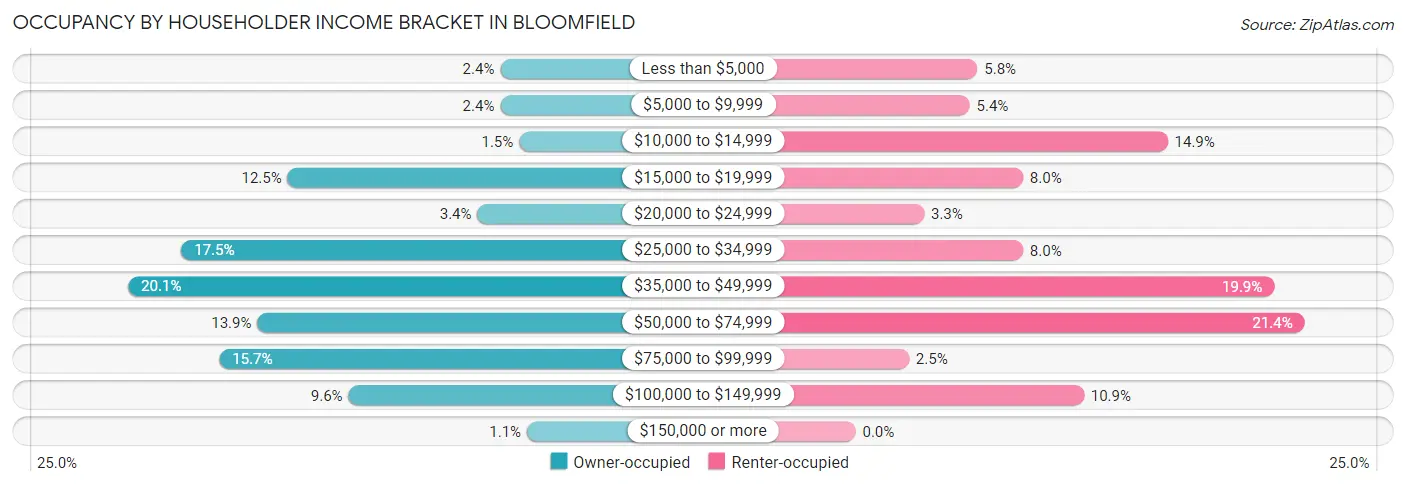
| Income Bracket | Owner-occupied | Renter-occupied |
| Less than $5,000 | 13 (2.4%) | 16 (5.8%) |
| $5,000 to $9,999 | 13 (2.4%) | 15 (5.4%) |
| $10,000 to $14,999 | 8 (1.5%) | 41 (14.9%) |
| $15,000 to $19,999 | 69 (12.5%) | 22 (8.0%) |
| $20,000 to $24,999 | 19 (3.4%) | 9 (3.3%) |
| $25,000 to $34,999 | 97 (17.5%) | 22 (8.0%) |
| $35,000 to $49,999 | 111 (20.1%) | 55 (19.9%) |
| $50,000 to $74,999 | 77 (13.9%) | 59 (21.4%) |
| $75,000 to $99,999 | 87 (15.7%) | 7 (2.5%) |
| $100,000 to $149,999 | 53 (9.6%) | 30 (10.9%) |
| $150,000 or more | 6 (1.1%) | 0 (0.0%) |
| Total | 553 (100.0%) | 276 (100.0%) |
Monthly Housing Cost Tiers in Bloomfield
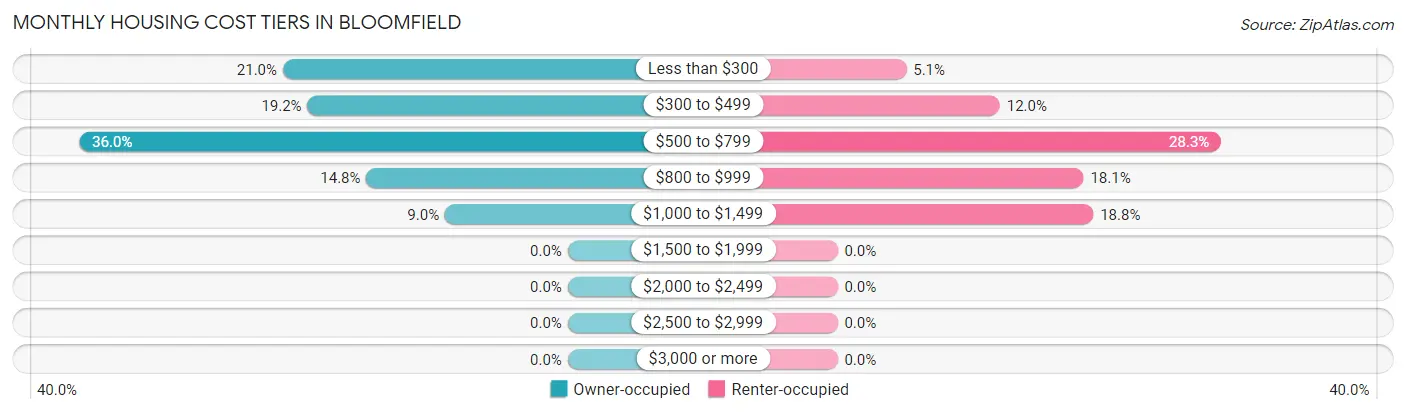
| Monthly Cost | Owner-occupied | Renter-occupied |
| Less than $300 | 116 (21.0%) | 14 (5.1%) |
| $300 to $499 | 106 (19.2%) | 33 (12.0%) |
| $500 to $799 | 199 (36.0%) | 78 (28.3%) |
| $800 to $999 | 82 (14.8%) | 50 (18.1%) |
| $1,000 to $1,499 | 50 (9.0%) | 52 (18.8%) |
| $1,500 to $1,999 | 0 (0.0%) | 0 (0.0%) |
| $2,000 to $2,499 | 0 (0.0%) | 0 (0.0%) |
| $2,500 to $2,999 | 0 (0.0%) | 0 (0.0%) |
| $3,000 or more | 0 (0.0%) | 0 (0.0%) |
| Total | 553 (100.0%) | 276 (100.0%) |
Physical Housing Characteristics in Bloomfield
Housing Structures in Bloomfield
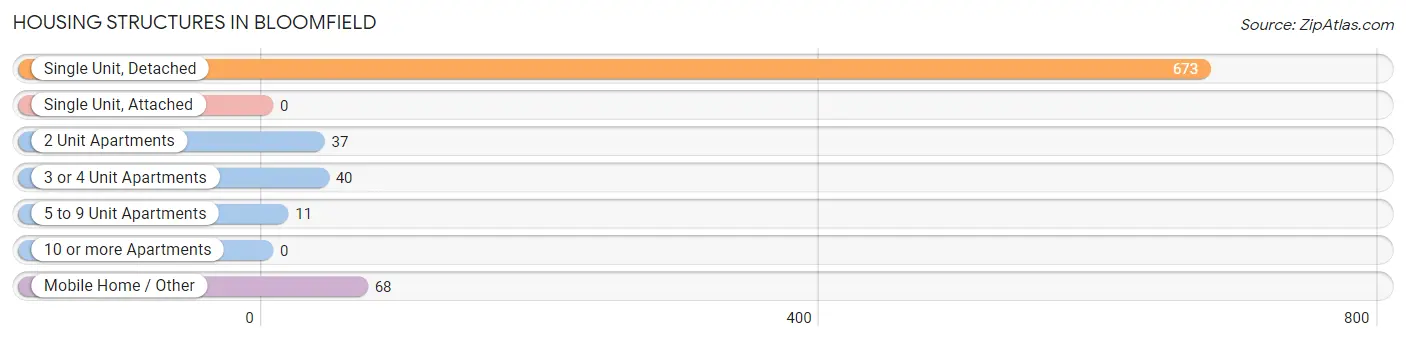
| Structure Type | # Housing Units | % Housing Units |
| Single Unit, Detached | 673 | 81.2% |
| Single Unit, Attached | 0 | 0.0% |
| 2 Unit Apartments | 37 | 4.5% |
| 3 or 4 Unit Apartments | 40 | 4.8% |
| 5 to 9 Unit Apartments | 11 | 1.3% |
| 10 or more Apartments | 0 | 0.0% |
| Mobile Home / Other | 68 | 8.2% |
| Total | 829 | 100.0% |
Housing Structures by Occupancy in Bloomfield
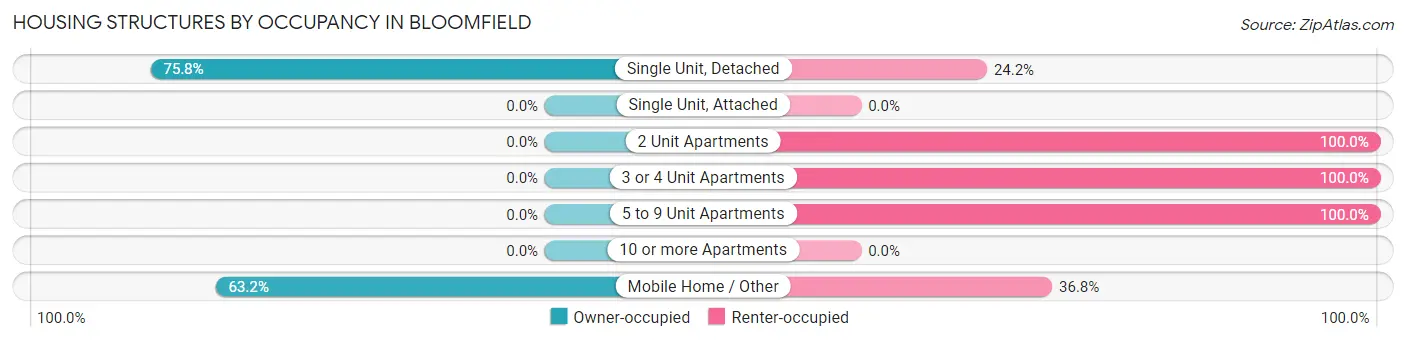
| Structure Type | Owner-occupied | Renter-occupied |
| Single Unit, Detached | 510 (75.8%) | 163 (24.2%) |
| Single Unit, Attached | 0 (0.0%) | 0 (0.0%) |
| 2 Unit Apartments | 0 (0.0%) | 37 (100.0%) |
| 3 or 4 Unit Apartments | 0 (0.0%) | 40 (100.0%) |
| 5 to 9 Unit Apartments | 0 (0.0%) | 11 (100.0%) |
| 10 or more Apartments | 0 (0.0%) | 0 (0.0%) |
| Mobile Home / Other | 43 (63.2%) | 25 (36.8%) |
| Total | 553 (66.7%) | 276 (33.3%) |
Housing Structures by Number of Rooms in Bloomfield
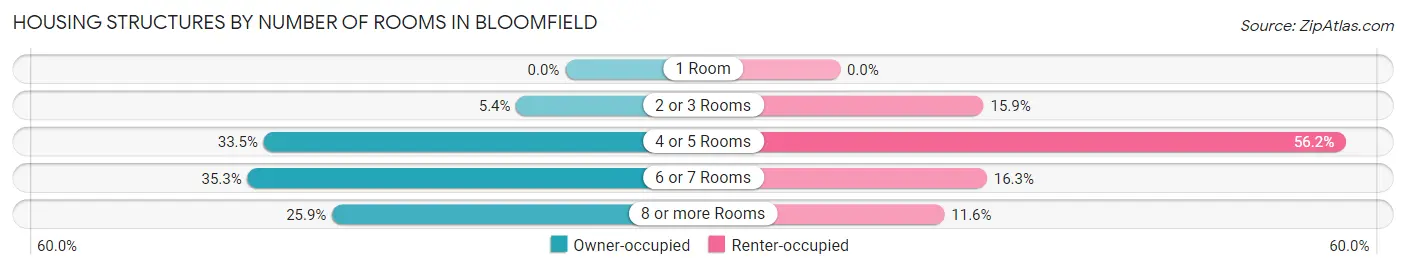
| Number of Rooms | Owner-occupied | Renter-occupied |
| 1 Room | 0 (0.0%) | 0 (0.0%) |
| 2 or 3 Rooms | 30 (5.4%) | 44 (15.9%) |
| 4 or 5 Rooms | 185 (33.5%) | 155 (56.2%) |
| 6 or 7 Rooms | 195 (35.3%) | 45 (16.3%) |
| 8 or more Rooms | 143 (25.9%) | 32 (11.6%) |
| Total | 553 (100.0%) | 276 (100.0%) |
Housing Structure by Heating Type in Bloomfield

| Heating Type | Owner-occupied | Renter-occupied |
| Utility Gas | 376 (68.0%) | 117 (42.4%) |
| Bottled, Tank, or LP Gas | 7 (1.3%) | 0 (0.0%) |
| Electricity | 150 (27.1%) | 159 (57.6%) |
| Fuel Oil or Kerosene | 0 (0.0%) | 0 (0.0%) |
| Coal or Coke | 0 (0.0%) | 0 (0.0%) |
| All other Fuels | 16 (2.9%) | 0 (0.0%) |
| No Fuel Used | 4 (0.7%) | 0 (0.0%) |
| Total | 553 (100.0%) | 276 (100.0%) |
Household Vehicle Usage in Bloomfield
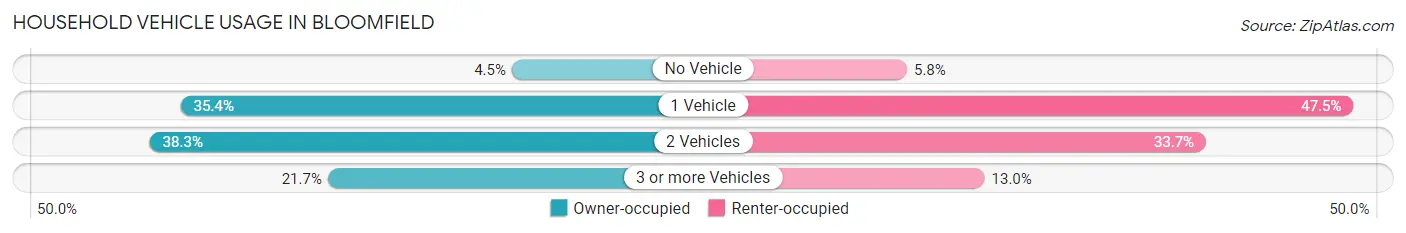
| Vehicles per Household | Owner-occupied | Renter-occupied |
| No Vehicle | 25 (4.5%) | 16 (5.8%) |
| 1 Vehicle | 196 (35.4%) | 131 (47.5%) |
| 2 Vehicles | 212 (38.3%) | 93 (33.7%) |
| 3 or more Vehicles | 120 (21.7%) | 36 (13.0%) |
| Total | 553 (100.0%) | 276 (100.0%) |
Real Estate & Mortgages in Bloomfield
Real Estate and Mortgage Overview in Bloomfield
| Characteristic | Without Mortgage | With Mortgage |
| Housing Units | 343 | 210 |
| Median Property Value | $65,100 | $66,700 |
| Median Household Income | $44,625 | $6 |
| Monthly Housing Costs | $352 | $0 |
| Real Estate Taxes | $502 | $11 |
Property Value by Mortgage Status in Bloomfield
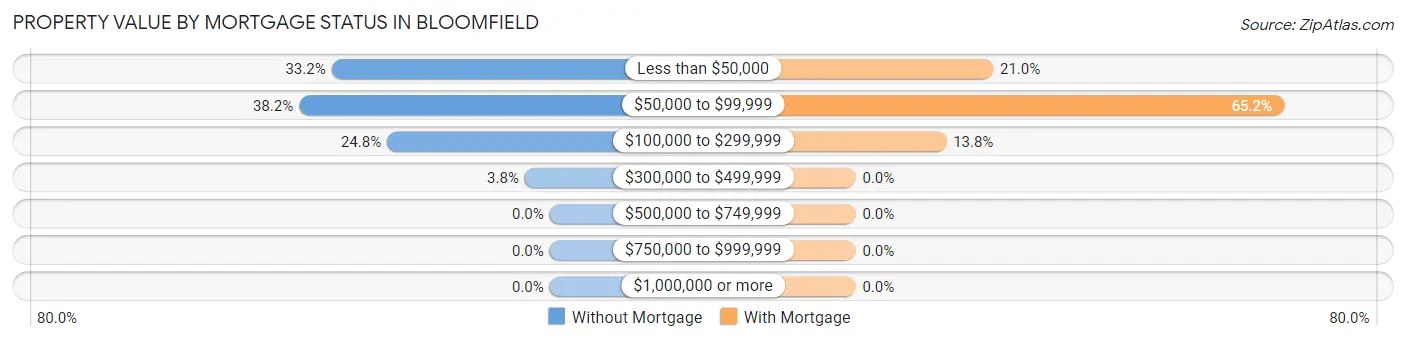
| Property Value | Without Mortgage | With Mortgage |
| Less than $50,000 | 114 (33.2%) | 44 (20.9%) |
| $50,000 to $99,999 | 131 (38.2%) | 137 (65.2%) |
| $100,000 to $299,999 | 85 (24.8%) | 29 (13.8%) |
| $300,000 to $499,999 | 13 (3.8%) | 0 (0.0%) |
| $500,000 to $749,999 | 0 (0.0%) | 0 (0.0%) |
| $750,000 to $999,999 | 0 (0.0%) | 0 (0.0%) |
| $1,000,000 or more | 0 (0.0%) | 0 (0.0%) |
| Total | 343 (100.0%) | 210 (100.0%) |
Household Income by Mortgage Status in Bloomfield
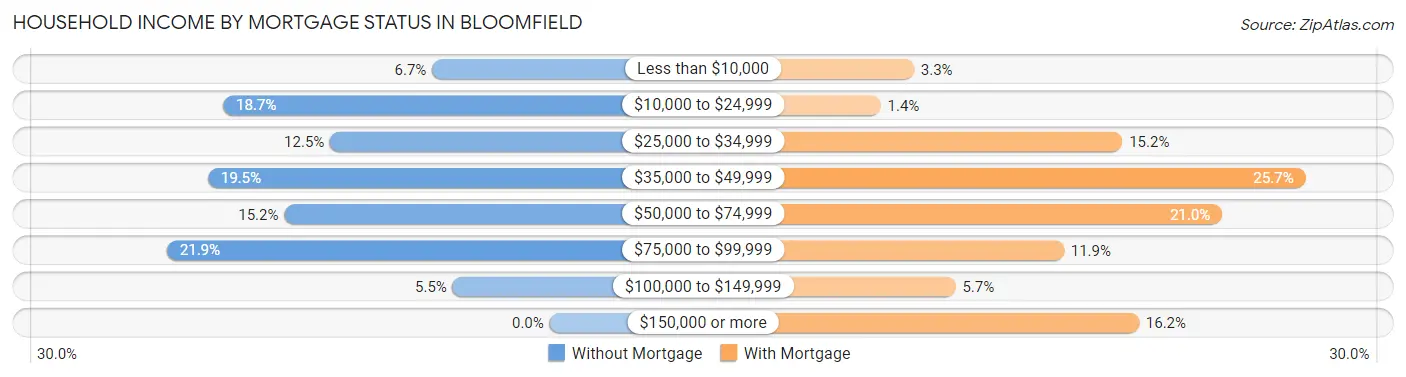
| Household Income | Without Mortgage | With Mortgage |
| Less than $10,000 | 23 (6.7%) | 7 (3.3%) |
| $10,000 to $24,999 | 64 (18.7%) | 3 (1.4%) |
| $25,000 to $34,999 | 43 (12.5%) | 32 (15.2%) |
| $35,000 to $49,999 | 67 (19.5%) | 54 (25.7%) |
| $50,000 to $74,999 | 52 (15.2%) | 44 (20.9%) |
| $75,000 to $99,999 | 75 (21.9%) | 25 (11.9%) |
| $100,000 to $149,999 | 19 (5.5%) | 12 (5.7%) |
| $150,000 or more | 0 (0.0%) | 34 (16.2%) |
| Total | 343 (100.0%) | 210 (100.0%) |
Property Value to Household Income Ratio in Bloomfield
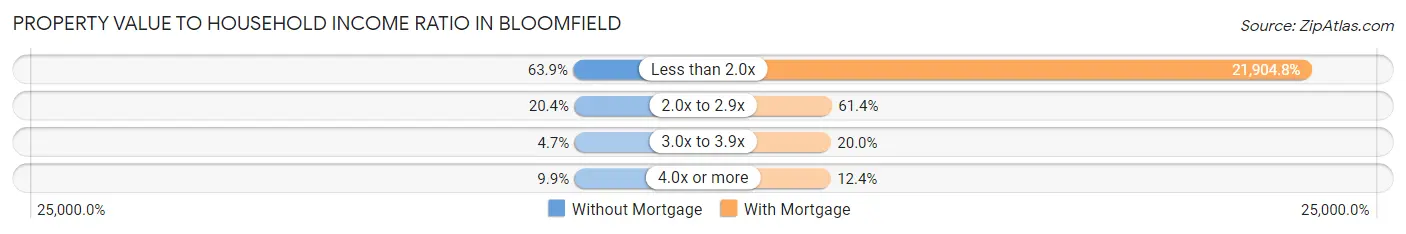
| Value-to-Income Ratio | Without Mortgage | With Mortgage |
| Less than 2.0x | 219 (63.8%) | 46,000 (21,904.8%) |
| 2.0x to 2.9x | 70 (20.4%) | 129 (61.4%) |
| 3.0x to 3.9x | 16 (4.7%) | 42 (20.0%) |
| 4.0x or more | 34 (9.9%) | 26 (12.4%) |
| Total | 343 (100.0%) | 210 (100.0%) |
Real Estate Taxes by Mortgage Status in Bloomfield
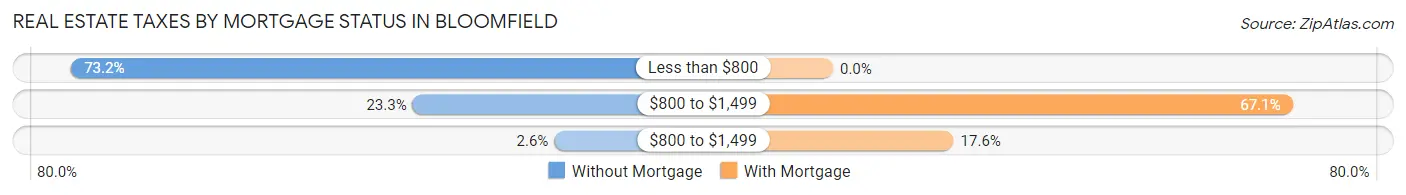
| Property Taxes | Without Mortgage | With Mortgage |
| Less than $800 | 251 (73.2%) | 0 (0.0%) |
| $800 to $1,499 | 80 (23.3%) | 141 (67.1%) |
| $800 to $1,499 | 9 (2.6%) | 37 (17.6%) |
| Total | 343 (100.0%) | 210 (100.0%) |
Health & Disability in Bloomfield
Health Insurance Coverage by Age in Bloomfield
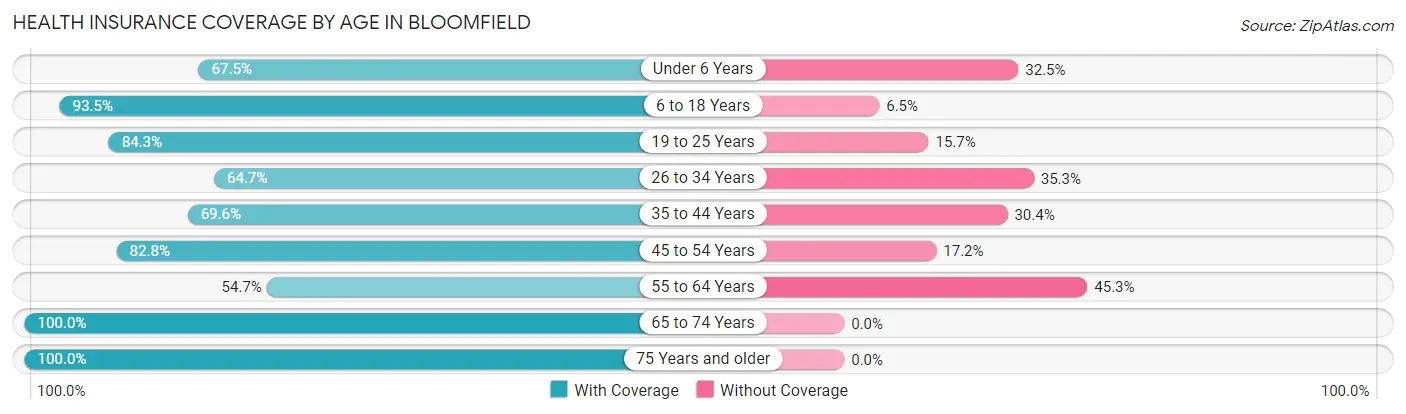
| Age Bracket | With Coverage | Without Coverage |
| Under 6 Years | 77 (67.5%) | 37 (32.5%) |
| 6 to 18 Years | 329 (93.5%) | 23 (6.5%) |
| 19 to 25 Years | 59 (84.3%) | 11 (15.7%) |
| 26 to 34 Years | 183 (64.7%) | 100 (35.3%) |
| 35 to 44 Years | 208 (69.6%) | 91 (30.4%) |
| 45 to 54 Years | 164 (82.8%) | 34 (17.2%) |
| 55 to 64 Years | 123 (54.7%) | 102 (45.3%) |
| 65 to 74 Years | 366 (100.0%) | 0 (0.0%) |
| 75 Years and older | 161 (100.0%) | 0 (0.0%) |
| Total | 1,670 (80.7%) | 398 (19.3%) |
Health Insurance Coverage by Citizenship Status in Bloomfield
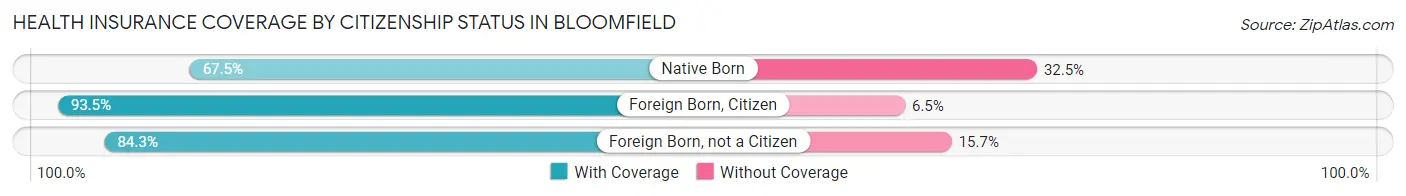
| Citizenship Status | With Coverage | Without Coverage |
| Native Born | 77 (67.5%) | 37 (32.5%) |
| Foreign Born, Citizen | 329 (93.5%) | 23 (6.5%) |
| Foreign Born, not a Citizen | 59 (84.3%) | 11 (15.7%) |
Health Insurance Coverage by Household Income in Bloomfield
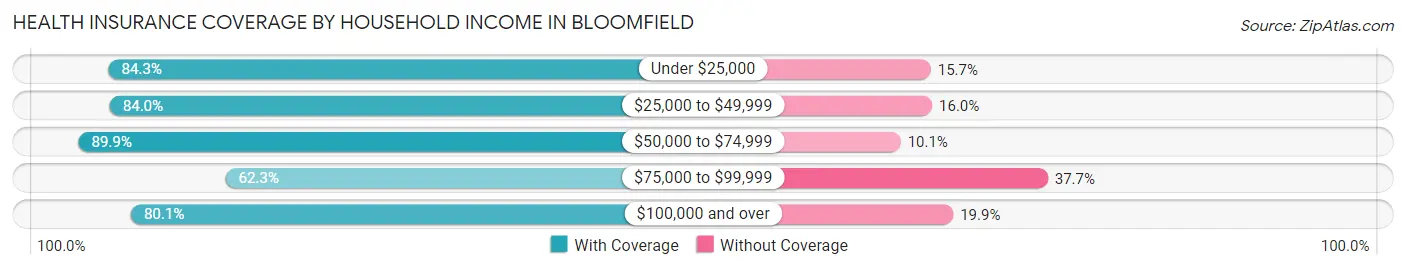
| Household Income | With Coverage | Without Coverage |
| Under $25,000 | 364 (84.3%) | 68 (15.7%) |
| $25,000 to $49,999 | 594 (84.0%) | 113 (16.0%) |
| $50,000 to $74,999 | 267 (89.9%) | 30 (10.1%) |
| $75,000 to $99,999 | 192 (62.3%) | 116 (37.7%) |
| $100,000 and over | 253 (80.1%) | 63 (19.9%) |
Public vs Private Health Insurance Coverage by Age in Bloomfield
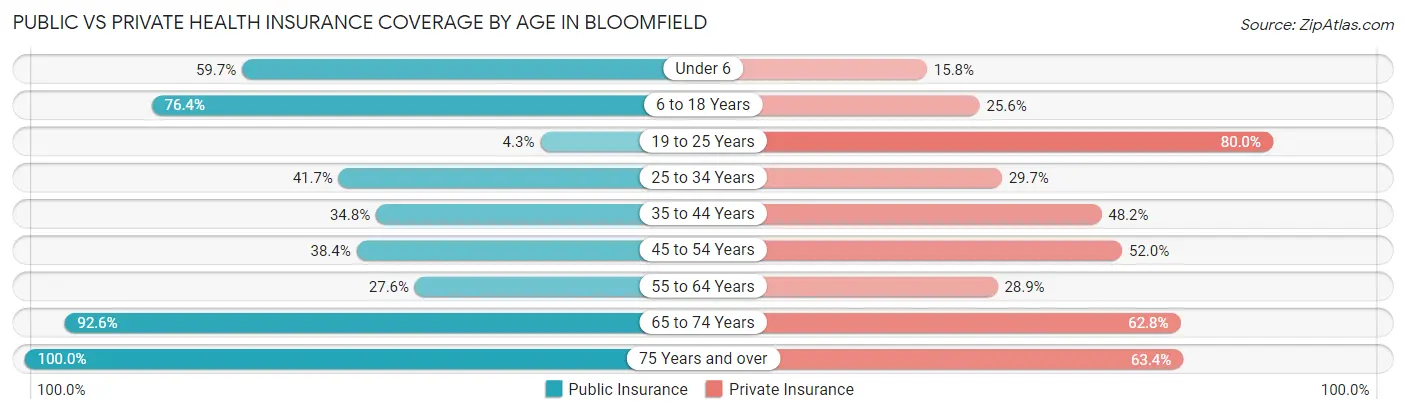
| Age Bracket | Public Insurance | Private Insurance |
| Under 6 | 68 (59.7%) | 18 (15.8%) |
| 6 to 18 Years | 269 (76.4%) | 90 (25.6%) |
| 19 to 25 Years | 3 (4.3%) | 56 (80.0%) |
| 25 to 34 Years | 118 (41.7%) | 84 (29.7%) |
| 35 to 44 Years | 104 (34.8%) | 144 (48.2%) |
| 45 to 54 Years | 76 (38.4%) | 103 (52.0%) |
| 55 to 64 Years | 62 (27.6%) | 65 (28.9%) |
| 65 to 74 Years | 339 (92.6%) | 230 (62.8%) |
| 75 Years and over | 161 (100.0%) | 102 (63.3%) |
| Total | 1,200 (58.0%) | 892 (43.1%) |
Disability Status by Sex by Age in Bloomfield
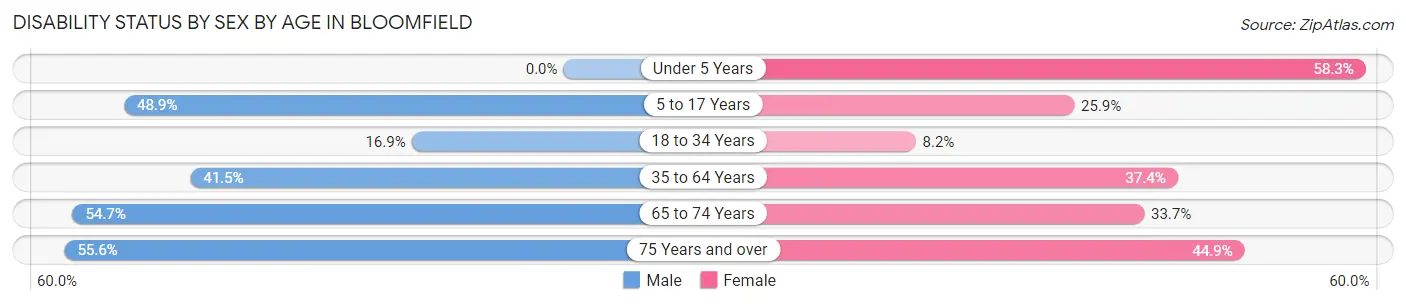
| Age Bracket | Male | Female |
| Under 5 Years | 0 (0.0%) | 14 (58.3%) |
| 5 to 17 Years | 113 (48.9%) | 37 (25.9%) |
| 18 to 34 Years | 35 (16.9%) | 12 (8.2%) |
| 35 to 64 Years | 140 (41.5%) | 144 (37.4%) |
| 65 to 74 Years | 88 (54.7%) | 69 (33.7%) |
| 75 Years and over | 30 (55.6%) | 48 (44.9%) |
Disability Class by Sex by Age in Bloomfield
Disability Class: Hearing Difficulty
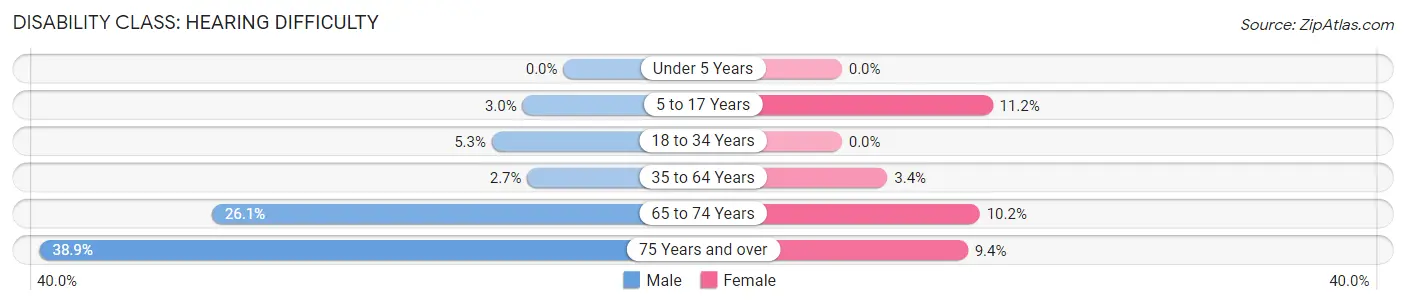
| Age Bracket | Male | Female |
| Under 5 Years | 0 (0.0%) | 0 (0.0%) |
| 5 to 17 Years | 7 (3.0%) | 16 (11.2%) |
| 18 to 34 Years | 11 (5.3%) | 0 (0.0%) |
| 35 to 64 Years | 9 (2.7%) | 13 (3.4%) |
| 65 to 74 Years | 42 (26.1%) | 21 (10.2%) |
| 75 Years and over | 21 (38.9%) | 10 (9.3%) |
Disability Class: Vision Difficulty
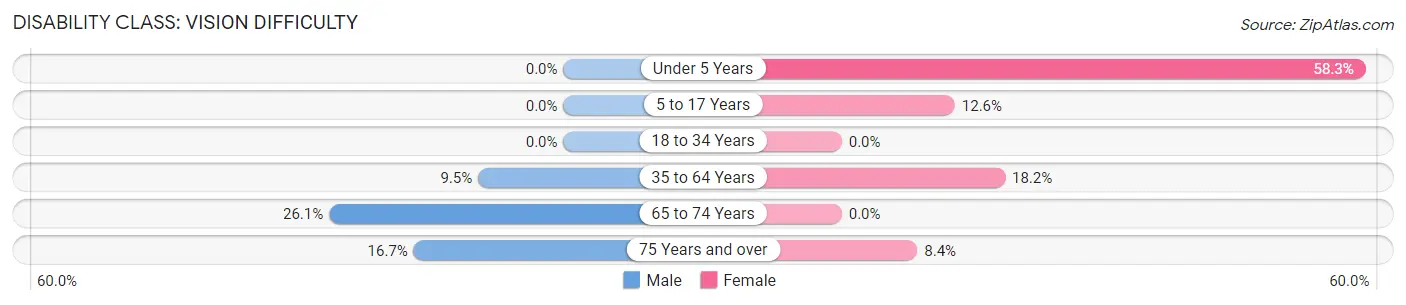
| Age Bracket | Male | Female |
| Under 5 Years | 0 (0.0%) | 14 (58.3%) |
| 5 to 17 Years | 0 (0.0%) | 18 (12.6%) |
| 18 to 34 Years | 0 (0.0%) | 0 (0.0%) |
| 35 to 64 Years | 32 (9.5%) | 70 (18.2%) |
| 65 to 74 Years | 42 (26.1%) | 0 (0.0%) |
| 75 Years and over | 9 (16.7%) | 9 (8.4%) |
Disability Class: Cognitive Difficulty
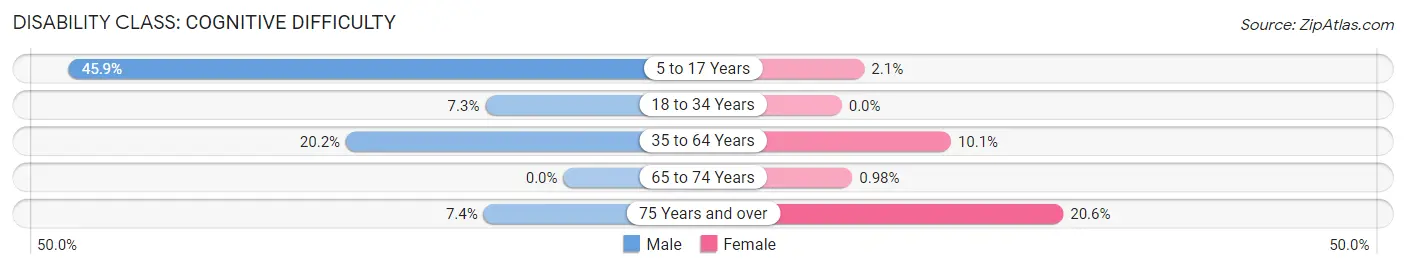
| Age Bracket | Male | Female |
| 5 to 17 Years | 106 (45.9%) | 3 (2.1%) |
| 18 to 34 Years | 15 (7.2%) | 0 (0.0%) |
| 35 to 64 Years | 68 (20.2%) | 39 (10.1%) |
| 65 to 74 Years | 0 (0.0%) | 2 (1.0%) |
| 75 Years and over | 4 (7.4%) | 22 (20.6%) |
Disability Class: Ambulatory Difficulty
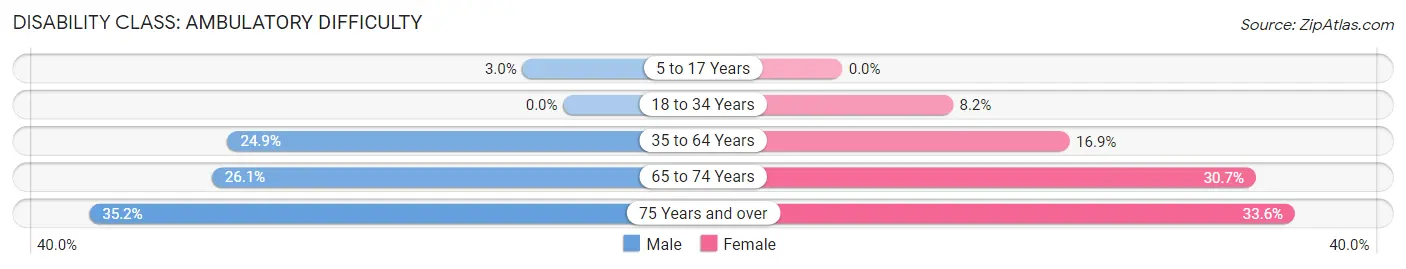
| Age Bracket | Male | Female |
| 5 to 17 Years | 7 (3.0%) | 0 (0.0%) |
| 18 to 34 Years | 0 (0.0%) | 12 (8.2%) |
| 35 to 64 Years | 84 (24.9%) | 65 (16.9%) |
| 65 to 74 Years | 42 (26.1%) | 63 (30.7%) |
| 75 Years and over | 19 (35.2%) | 36 (33.6%) |
Disability Class: Self-Care Difficulty
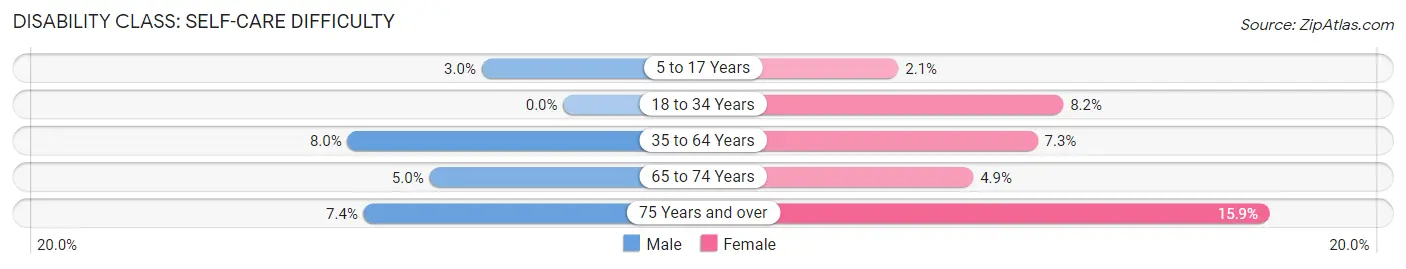
| Age Bracket | Male | Female |
| 5 to 17 Years | 7 (3.0%) | 3 (2.1%) |
| 18 to 34 Years | 0 (0.0%) | 12 (8.2%) |
| 35 to 64 Years | 27 (8.0%) | 28 (7.3%) |
| 65 to 74 Years | 8 (5.0%) | 10 (4.9%) |
| 75 Years and over | 4 (7.4%) | 17 (15.9%) |
Technology Access in Bloomfield
Computing Device Access in Bloomfield
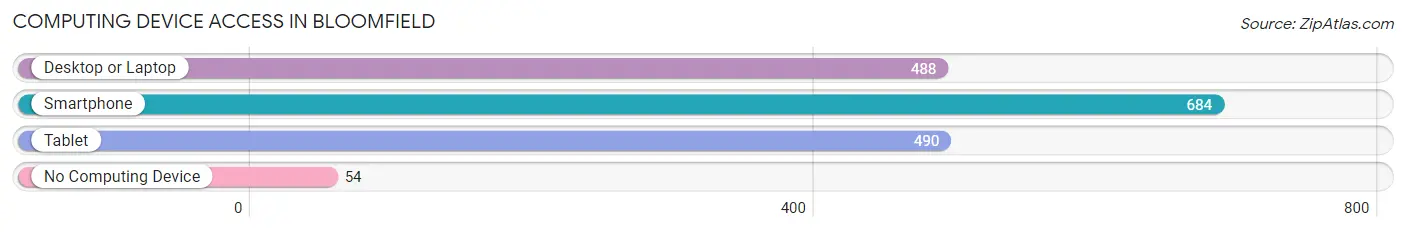
| Device Type | # Households | % Households |
| Desktop or Laptop | 488 | 58.9% |
| Smartphone | 684 | 82.5% |
| Tablet | 490 | 59.1% |
| No Computing Device | 54 | 6.5% |
| Total | 829 | 100.0% |
Internet Access in Bloomfield
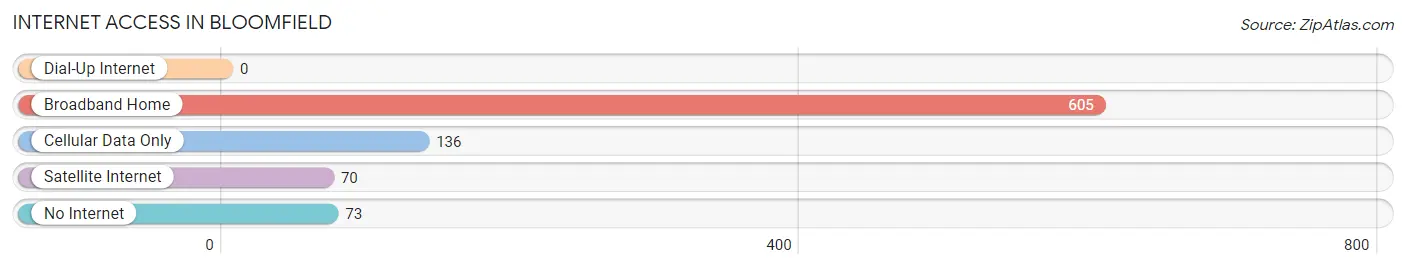
| Internet Type | # Households | % Households |
| Dial-Up Internet | 0 | 0.0% |
| Broadband Home | 605 | 73.0% |
| Cellular Data Only | 136 | 16.4% |
| Satellite Internet | 70 | 8.4% |
| No Internet | 73 | 8.8% |
| Total | 829 | 100.0% |
Bloomfield Summary
Bloomfield, Missouri is a small town located in Stoddard County in the southeastern corner of the state. It is situated on the banks of the Castor River, and is surrounded by rolling hills and farmland. The town has a population of approximately 1,500 people, and is known for its friendly atmosphere and rural charm.
History
Bloomfield was founded in 1837 by a group of settlers from Kentucky and Tennessee. The town was named after the blooming wildflowers that grew in the area. The first post office was established in 1845, and the town was officially incorporated in 1871.
In the late 19th century, Bloomfield was a thriving agricultural community. The town was home to several cotton gins, a grist mill, and a sawmill. The town also had a thriving business district, with several stores, a hotel, and a bank.
In the early 20th century, Bloomfield experienced a period of growth and prosperity. The town was home to several factories, including a shoe factory, a furniture factory, and a canning factory. The town also had a movie theater, a bowling alley, and a public library.
Geography
Bloomfield is located in Stoddard County in the southeastern corner of Missouri. The town is situated on the banks of the Castor River, and is surrounded by rolling hills and farmland. The town is located approximately 30 miles from the Mississippi River, and is about an hour’s drive from the cities of Cape Girardeau and Sikeston.
The climate in Bloomfield is humid subtropical, with hot, humid summers and mild winters. The average annual temperature is around 64 degrees Fahrenheit, and the average annual precipitation is around 45 inches.
Economy
The economy of Bloomfield is largely based on agriculture. The town is home to several farms, and the surrounding area is known for its production of cotton, soybeans, corn, and wheat. The town also has several small businesses, including a grocery store, a hardware store, and a restaurant.
Demographics
As of the 2010 census, the population of Bloomfield was 1,521. The racial makeup of the town was 97.3% White, 0.7% African American, 0.3% Native American, 0.2% Asian, 0.1% Pacific Islander, and 1.4% from other races. The median household income was $30,938, and the median family income was $37,813.
Conclusion
Bloomfield, Missouri is a small town located in Stoddard County in the southeastern corner of the state. It is situated on the banks of the Castor River, and is surrounded by rolling hills and farmland. The town has a population of approximately 1,500 people, and is known for its friendly atmosphere and rural charm. The economy of Bloomfield is largely based on agriculture, and the town is home to several small businesses. The racial makeup of the town is predominantly White, with a small percentage of African American, Native American, Asian, and Pacific Islander residents.
Common Questions
What is Per Capita Income in Bloomfield?
Per Capita income in Bloomfield is $19,747.
What is the Median Family Income in Bloomfield?
Median Family Income in Bloomfield is $49,095.
What is the Median Household income in Bloomfield?
Median Household Income in Bloomfield is $42,446.
What is Income or Wage Gap in Bloomfield?
Income or Wage Gap in Bloomfield is 33.0%.
Women in Bloomfield earn 67.0 cents for every dollar earned by a man.
What is Family Income Deficit in Bloomfield?
Family Income Deficit in Bloomfield is $9,681.
Families that are below poverty line in Bloomfield earn $9,681 less on average than the poverty threshold level.
What is Inequality or Gini Index in Bloomfield?
Inequality or Gini Index in Bloomfield is 0.39.
What is the Total Population of Bloomfield?
Total Population of Bloomfield is 2,172.
What is the Total Male Population of Bloomfield?
Total Male Population of Bloomfield is 1,136.
What is the Total Female Population of Bloomfield?
Total Female Population of Bloomfield is 1,036.
What is the Ratio of Males per 100 Females in Bloomfield?
There are 109.65 Males per 100 Females in Bloomfield.
What is the Ratio of Females per 100 Males in Bloomfield?
There are 91.20 Females per 100 Males in Bloomfield.
What is the Median Population Age in Bloomfield?
Median Population Age in Bloomfield is 41.5 Years.
What is the Average Family Size in Bloomfield
Average Family Size in Bloomfield is 3.0 People.
What is the Average Household Size in Bloomfield
Average Household Size in Bloomfield is 2.5 People.
How Large is the Labor Force in Bloomfield?
There are 751 People in the Labor Forcein in Bloomfield.
What is the Percentage of People in the Labor Force in Bloomfield?
43.1% of People are in the Labor Force in Bloomfield.
What is the Unemployment Rate in Bloomfield?
Unemployment Rate in Bloomfield is 8.1%.