Bevier, MO Map & Demographics
Bevier Map
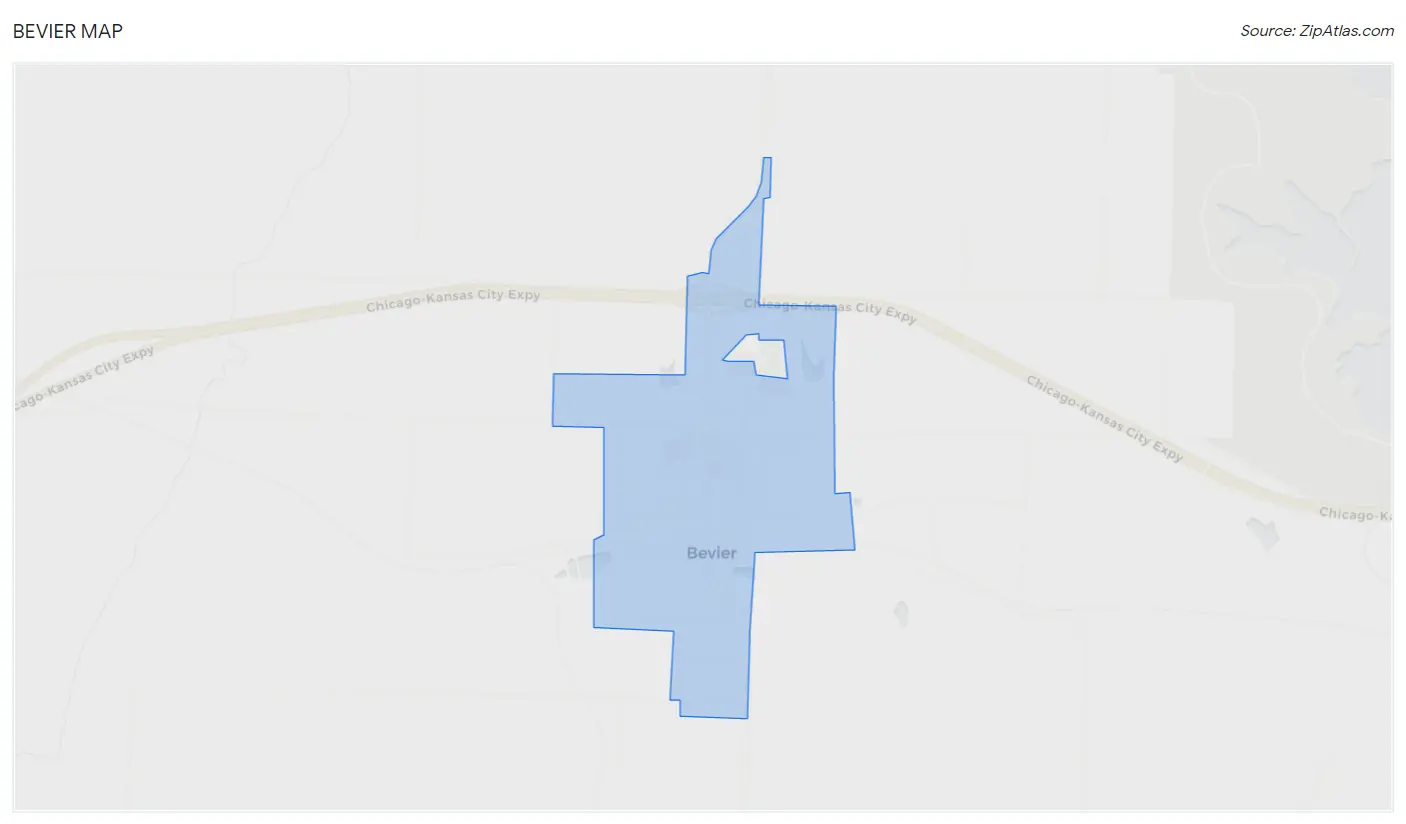
Bevier Overview
$33,189
PER CAPITA INCOME
$71,806
AVG FAMILY INCOME
$50,417
AVG HOUSEHOLD INCOME
37.8%
WAGE / INCOME GAP [ % ]
62.2¢/ $1
WAGE / INCOME GAP [ $ ]
0.46
INEQUALITY / GINI INDEX
633
TOTAL POPULATION
309
MALE POPULATION
324
FEMALE POPULATION
95.37
MALES / 100 FEMALES
104.85
FEMALES / 100 MALES
51.7
MEDIAN AGE
3.3
AVG FAMILY SIZE
2.3
AVG HOUSEHOLD SIZE
301
LABOR FORCE [ PEOPLE ]
54.4%
PERCENT IN LABOR FORCE
6.0%
UNEMPLOYMENT RATE
Bevier Zip Codes
Bevier Area Codes
Income in Bevier
Income Overview in Bevier
Per Capita Income in Bevier is $33,189, while median incomes of families and households are $71,806 and $50,417 respectively.
| Characteristic | Number | Measure |
| Per Capita Income | 633 | $33,189 |
| Median Family Income | 125 | $71,806 |
| Mean Family Income | 125 | $75,704 |
| Median Household Income | 273 | $50,417 |
| Mean Household Income | 273 | $69,595 |
| Income Deficit | 125 | $0 |
| Wage / Income Gap (%) | 633 | 37.78% |
| Wage / Income Gap ($) | 633 | 62.22¢ per $1 |
| Gini / Inequality Index | 633 | 0.46 |
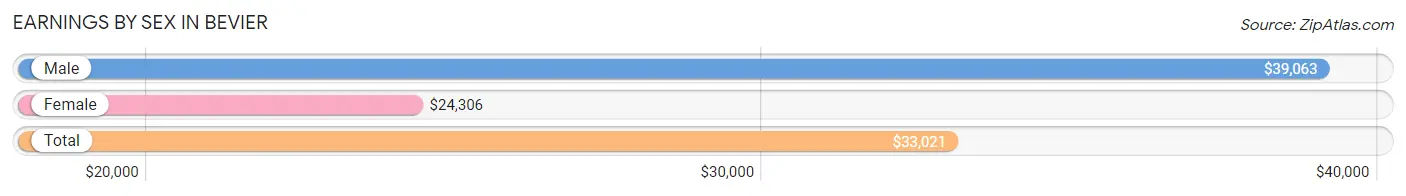
Earnings by Sex in Bevier
Average Earnings in Bevier are $33,021, $39,063 for men and $24,306 for women, a difference of 37.8%.
| Sex | Number | Average Earnings |
| Male | 192 (61.0%) | $39,063 |
| Female | 123 (39.1%) | $24,306 |
| Total | 315 (100.0%) | $33,021 |
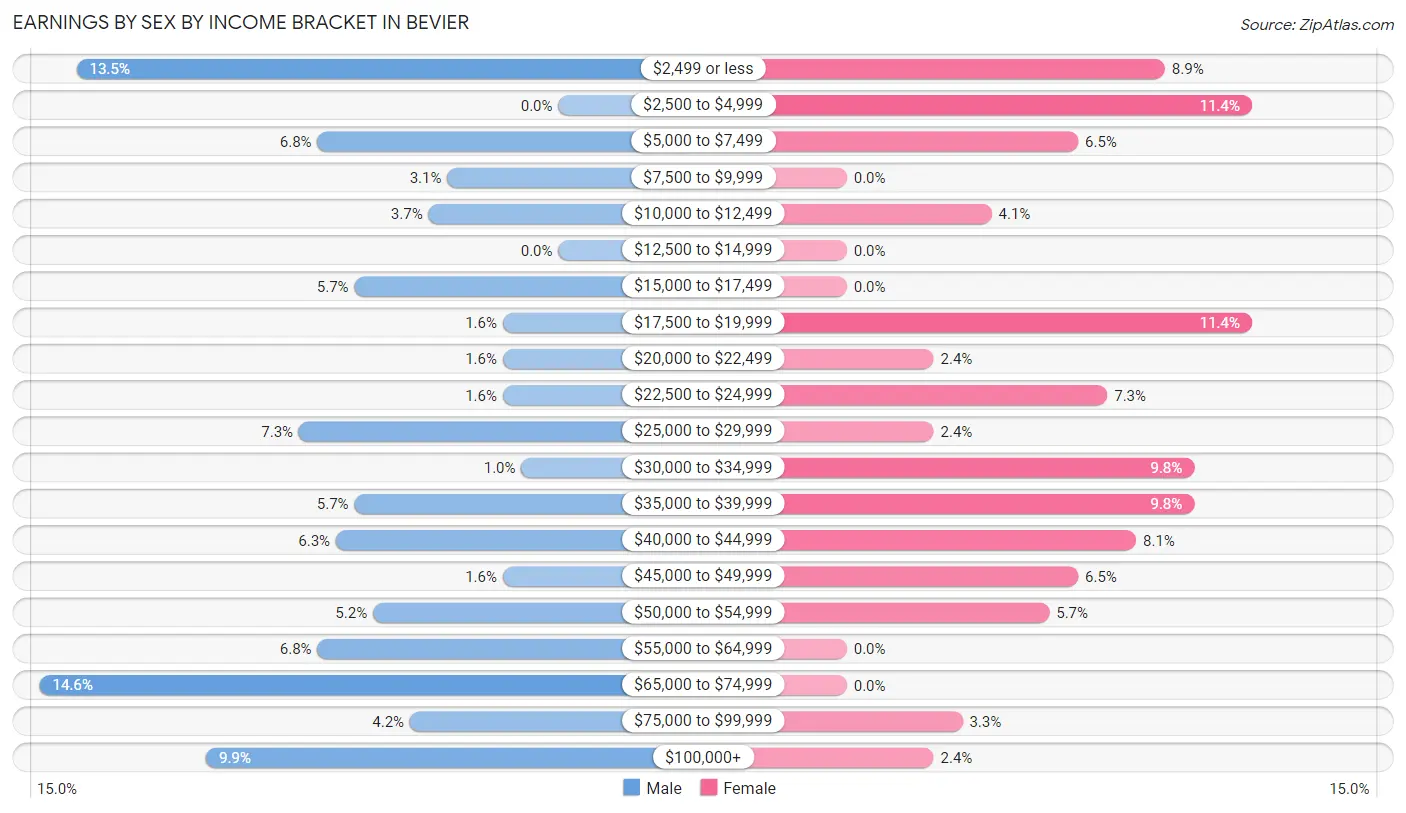
Earnings by Sex by Income Bracket in Bevier
The most common earnings brackets in Bevier are $65,000 to $74,999 for men (28 | 14.6%) and $2,500 to $4,999 for women (14 | 11.4%).
| Income | Male | Female |
| $2,499 or less | 26 (13.5%) | 11 (8.9%) |
| $2,500 to $4,999 | 0 (0.0%) | 14 (11.4%) |
| $5,000 to $7,499 | 13 (6.8%) | 8 (6.5%) |
| $7,500 to $9,999 | 6 (3.1%) | 0 (0.0%) |
| $10,000 to $12,499 | 7 (3.6%) | 5 (4.1%) |
| $12,500 to $14,999 | 0 (0.0%) | 0 (0.0%) |
| $15,000 to $17,499 | 11 (5.7%) | 0 (0.0%) |
| $17,500 to $19,999 | 3 (1.6%) | 14 (11.4%) |
| $20,000 to $22,499 | 3 (1.6%) | 3 (2.4%) |
| $22,500 to $24,999 | 3 (1.6%) | 9 (7.3%) |
| $25,000 to $29,999 | 14 (7.3%) | 3 (2.4%) |
| $30,000 to $34,999 | 2 (1.0%) | 12 (9.8%) |
| $35,000 to $39,999 | 11 (5.7%) | 12 (9.8%) |
| $40,000 to $44,999 | 12 (6.2%) | 10 (8.1%) |
| $45,000 to $49,999 | 3 (1.6%) | 8 (6.5%) |
| $50,000 to $54,999 | 10 (5.2%) | 7 (5.7%) |
| $55,000 to $64,999 | 13 (6.8%) | 0 (0.0%) |
| $65,000 to $74,999 | 28 (14.6%) | 0 (0.0%) |
| $75,000 to $99,999 | 8 (4.2%) | 4 (3.3%) |
| $100,000+ | 19 (9.9%) | 3 (2.4%) |
| Total | 192 (100.0%) | 123 (100.0%) |
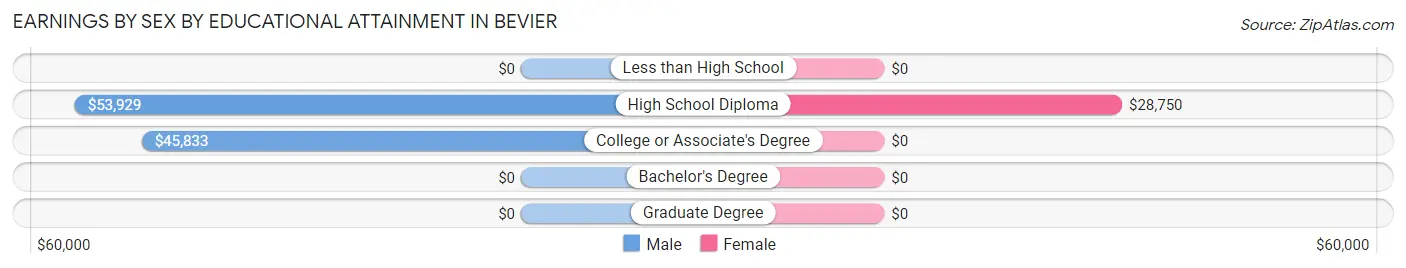
Earnings by Sex by Educational Attainment in Bevier
Average earnings in Bevier are $58,125 for men and $23,889 for women, a difference of 58.9%. Men with an educational attainment of high school diploma enjoy the highest average annual earnings of $53,929, while those with college or associate's degree education earn the least with $45,833. Women with an educational attainment of high school diploma earn the most with the average annual earnings of $28,750, while those with high school diploma education have the smallest earnings of $28,750.
| Educational Attainment | Male Income | Female Income |
| Less than High School | - | - |
| High School Diploma | $53,929 | $28,750 |
| College or Associate's Degree | $45,833 | $0 |
| Bachelor's Degree | - | - |
| Graduate Degree | - | - |
| Total | $58,125 | $23,889 |
Family Income in Bevier
Family Income Brackets in Bevier
According to the Bevier family income data, there are 28 families falling into the $100,000 to $149,999 income range, which is the most common income bracket and makes up 22.4% of all families.
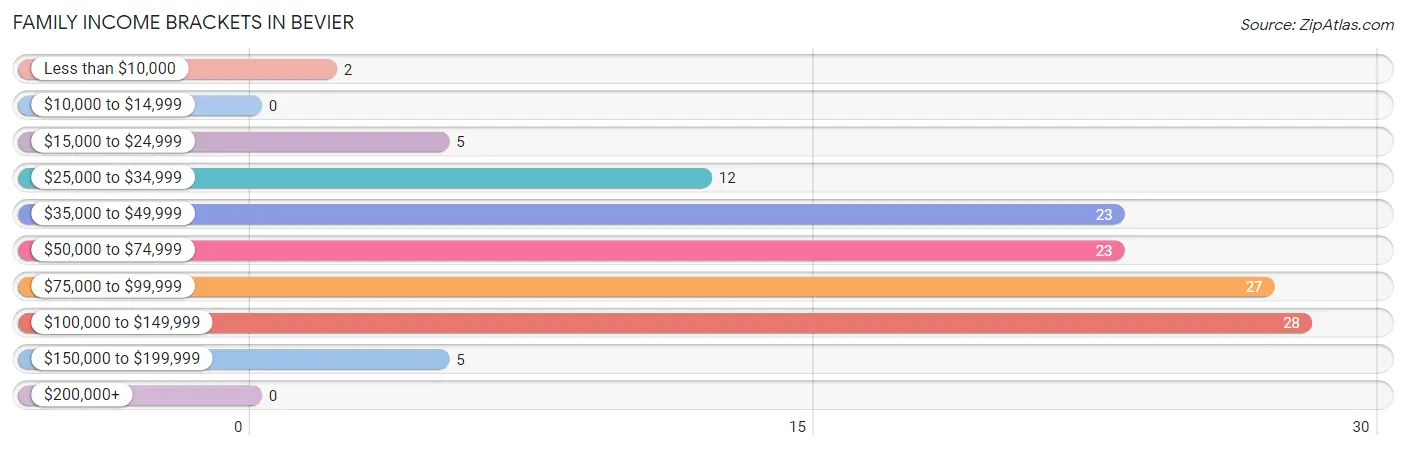
| Income Bracket | # Families | % Families |
| Less than $10,000 | 2 | 1.6% |
| $10,000 to $14,999 | 0 | 0.0% |
| $15,000 to $24,999 | 5 | 4.0% |
| $25,000 to $34,999 | 12 | 9.6% |
| $35,000 to $49,999 | 23 | 18.4% |
| $50,000 to $74,999 | 23 | 18.4% |
| $75,000 to $99,999 | 27 | 21.6% |
| $100,000 to $149,999 | 28 | 22.4% |
| $150,000 to $199,999 | 5 | 4.0% |
| $200,000+ | 0 | 0.0% |
Family Income by Famaliy Size in Bevier
4-person families (11 | 8.8%) account for the highest median family income in Bevier with $92,917 per family, while 2-person families (93 | 74.4%) have the highest median income of $33,125 per family member.
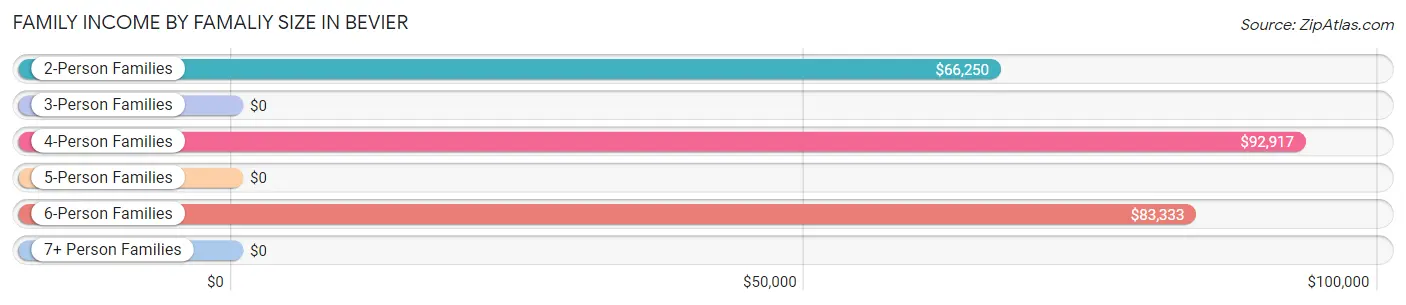
| Income Bracket | # Families | Median Income |
| 2-Person Families | 93 (74.4%) | $66,250 |
| 3-Person Families | 4 (3.2%) | $0 |
| 4-Person Families | 11 (8.8%) | $92,917 |
| 5-Person Families | 5 (4.0%) | $0 |
| 6-Person Families | 12 (9.6%) | $83,333 |
| 7+ Person Families | 0 (0.0%) | $0 |
| Total | 125 (100.0%) | $71,806 |
Family Income by Number of Earners in Bevier
The median family income in Bevier is $71,806, with families comprising 2 earners (39) having the highest median family income of $92,917, while families with no earners (29) have the lowest median family income of $44,583, accounting for 31.2% and 23.2% of families, respectively.
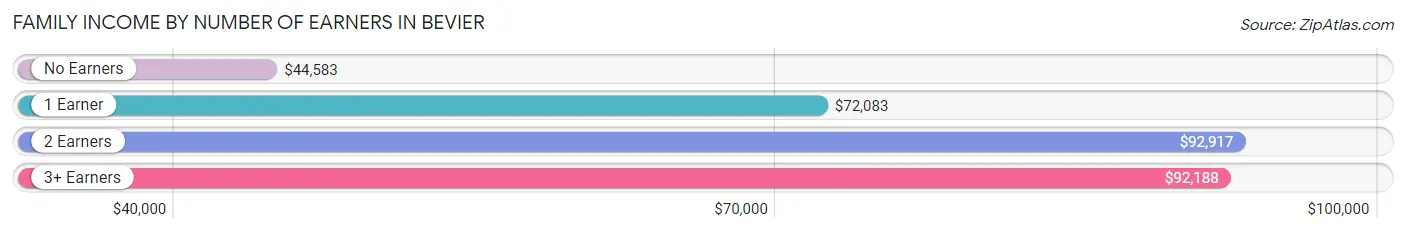
| Number of Earners | # Families | Median Income |
| No Earners | 29 (23.2%) | $44,583 |
| 1 Earner | 38 (30.4%) | $72,083 |
| 2 Earners | 39 (31.2%) | $92,917 |
| 3+ Earners | 19 (15.2%) | $92,188 |
| Total | 125 (100.0%) | $71,806 |
Household Income in Bevier
Household Income Brackets in Bevier
With 53 households falling in the category, the $50,000 to $74,999 income range is the most frequent in Bevier, accounting for 19.4% of all households. In contrast, only 4 households (1.5%) fall into the $200,000+ income bracket, making it the least populous group.
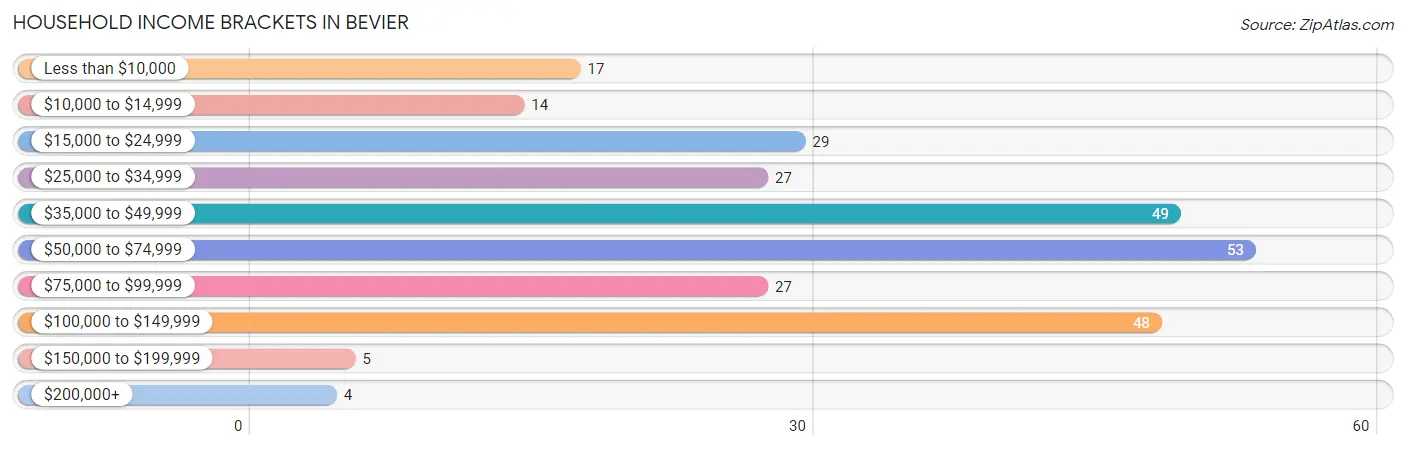
| Income Bracket | # Households | % Households |
| Less than $10,000 | 17 | 6.2% |
| $10,000 to $14,999 | 14 | 5.1% |
| $15,000 to $24,999 | 29 | 10.6% |
| $25,000 to $34,999 | 27 | 9.9% |
| $35,000 to $49,999 | 49 | 17.9% |
| $50,000 to $74,999 | 53 | 19.4% |
| $75,000 to $99,999 | 27 | 9.9% |
| $100,000 to $149,999 | 48 | 17.6% |
| $150,000 to $199,999 | 5 | 1.8% |
| $200,000+ | 4 | 1.5% |
Household Income by Householder Age in Bevier
The median household income in Bevier is $50,417, with the highest median household income of $71,806 found in the 45 to 64 years age bracket for the primary householder. A total of 111 households (40.7%) fall into this category. Meanwhile, the 15 to 24 years age bracket for the primary householder has the lowest median household income of $43,393, with 15 households (5.5%) in this group.
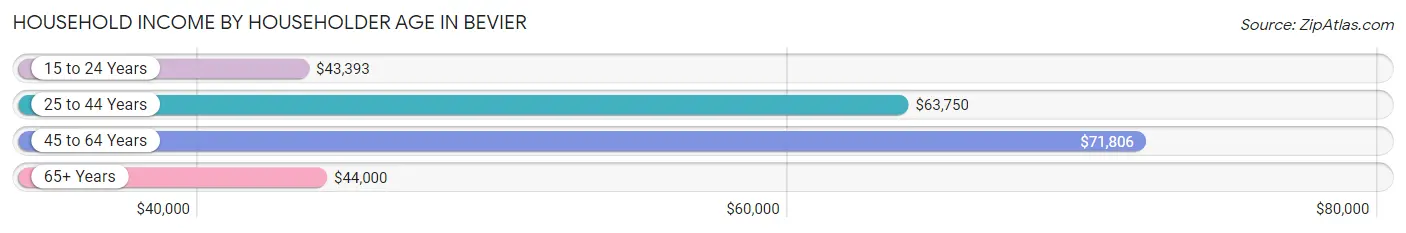
| Income Bracket | # Households | Median Income |
| 15 to 24 Years | 15 (5.5%) | $43,393 |
| 25 to 44 Years | 57 (20.9%) | $63,750 |
| 45 to 64 Years | 111 (40.7%) | $71,806 |
| 65+ Years | 90 (33.0%) | $44,000 |
| Total | 273 (100.0%) | $50,417 |
Poverty in Bevier
Income Below Poverty by Sex and Age in Bevier
With 8.4% poverty level for males and 11.7% for females among the residents of Bevier, 6 to 11 year old males and 45 to 54 year old females are the most vulnerable to poverty, with 3 males (33.3%) and 16 females (43.2%) in their respective age groups living below the poverty level.
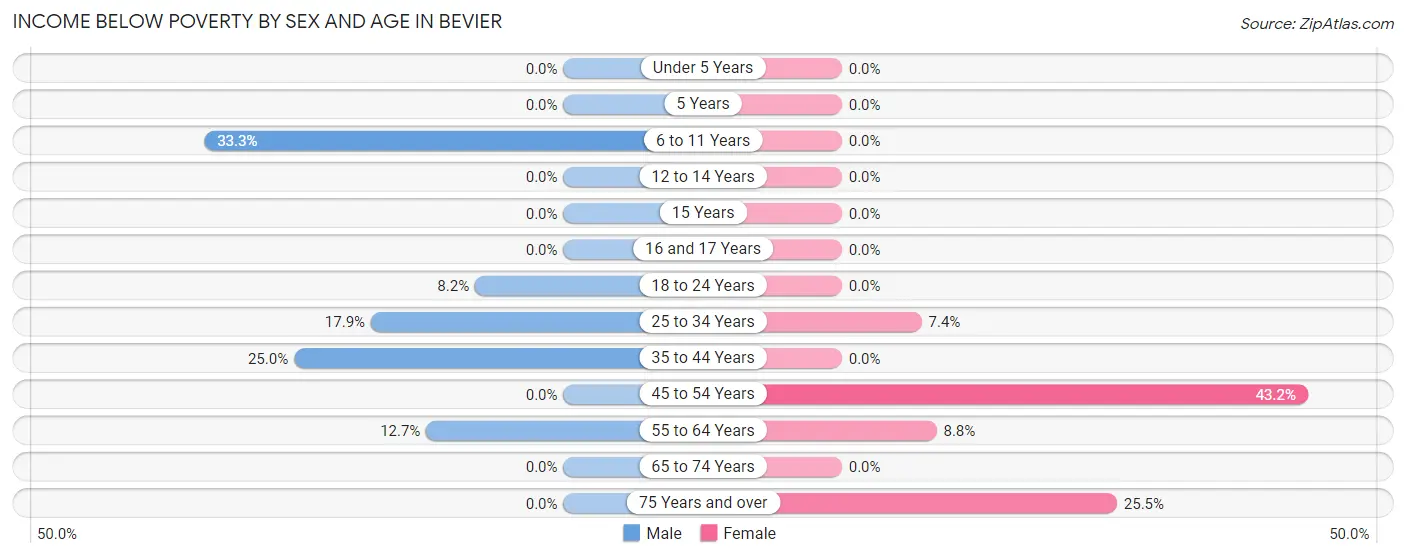
| Age Bracket | Male | Female |
| Under 5 Years | 0 (0.0%) | 0 (0.0%) |
| 5 Years | 0 (0.0%) | 0 (0.0%) |
| 6 to 11 Years | 3 (33.3%) | 0 (0.0%) |
| 12 to 14 Years | 0 (0.0%) | 0 (0.0%) |
| 15 Years | 0 (0.0%) | 0 (0.0%) |
| 16 and 17 Years | 0 (0.0%) | 0 (0.0%) |
| 18 to 24 Years | 5 (8.2%) | 0 (0.0%) |
| 25 to 34 Years | 5 (17.9%) | 2 (7.4%) |
| 35 to 44 Years | 6 (25.0%) | 0 (0.0%) |
| 45 to 54 Years | 0 (0.0%) | 16 (43.2%) |
| 55 to 64 Years | 7 (12.7%) | 8 (8.8%) |
| 65 to 74 Years | 0 (0.0%) | 0 (0.0%) |
| 75 Years and over | 0 (0.0%) | 12 (25.5%) |
| Total | 26 (8.4%) | 38 (11.7%) |
Income Above Poverty by Sex and Age in Bevier
According to the poverty statistics in Bevier, males aged under 5 years and females aged under 5 years are the age groups that are most secure financially, with 100.0% of males and 100.0% of females in these age groups living above the poverty line.
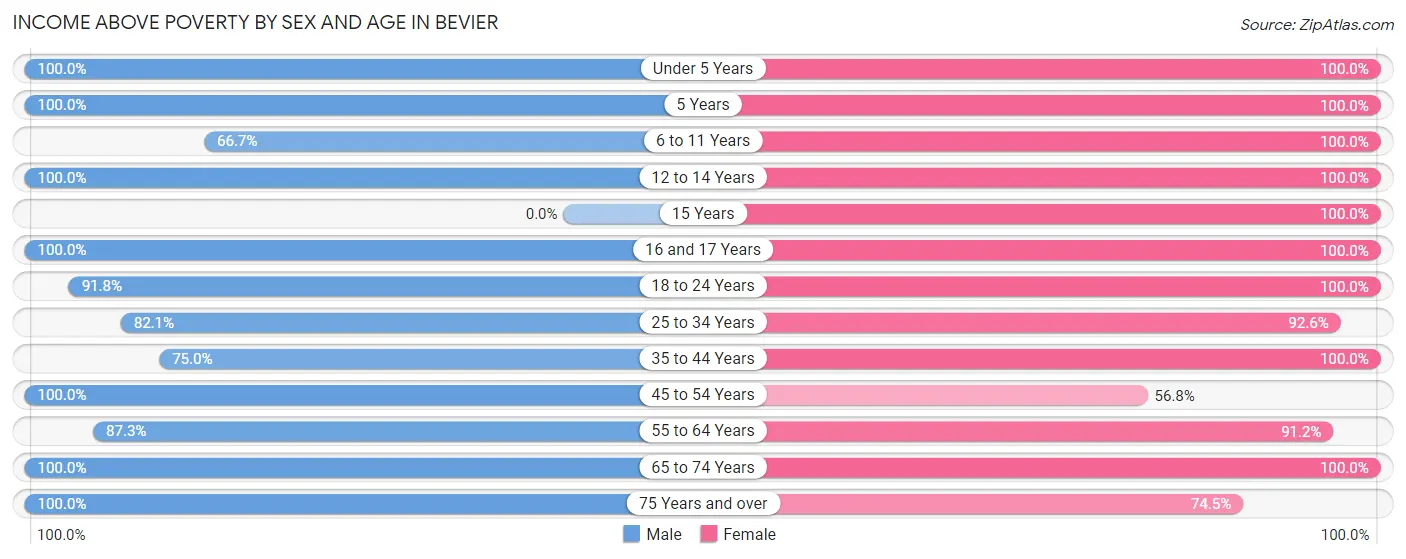
| Age Bracket | Male | Female |
| Under 5 Years | 14 (100.0%) | 4 (100.0%) |
| 5 Years | 4 (100.0%) | 13 (100.0%) |
| 6 to 11 Years | 6 (66.7%) | 22 (100.0%) |
| 12 to 14 Years | 6 (100.0%) | 5 (100.0%) |
| 15 Years | 0 (0.0%) | 3 (100.0%) |
| 16 and 17 Years | 13 (100.0%) | 3 (100.0%) |
| 18 to 24 Years | 56 (91.8%) | 13 (100.0%) |
| 25 to 34 Years | 23 (82.1%) | 25 (92.6%) |
| 35 to 44 Years | 18 (75.0%) | 32 (100.0%) |
| 45 to 54 Years | 39 (100.0%) | 21 (56.8%) |
| 55 to 64 Years | 48 (87.3%) | 83 (91.2%) |
| 65 to 74 Years | 39 (100.0%) | 27 (100.0%) |
| 75 Years and over | 17 (100.0%) | 35 (74.5%) |
| Total | 283 (91.6%) | 286 (88.3%) |
Income Below Poverty Among Married-Couple Families in Bevier
The poverty statistics for married-couple families in Bevier show that 2.7% or 3 of the total 111 families live below the poverty line. Families with no children have the highest poverty rate of 3.5%, comprising of 3 families. On the other hand, families with 1 or 2 children have the lowest poverty rate of 0.0%, which includes 0 families.
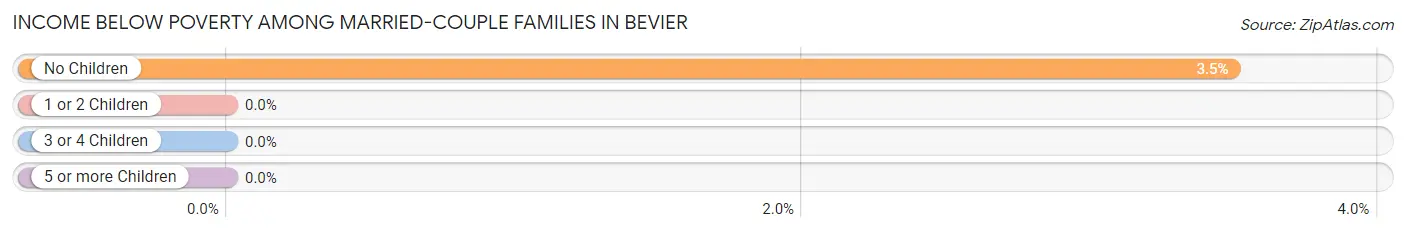
| Children | Above Poverty | Below Poverty |
| No Children | 83 (96.5%) | 3 (3.5%) |
| 1 or 2 Children | 17 (100.0%) | 0 (0.0%) |
| 3 or 4 Children | 8 (100.0%) | 0 (0.0%) |
| 5 or more Children | 0 (0.0%) | 0 (0.0%) |
| Total | 108 (97.3%) | 3 (2.7%) |
Income Below Poverty Among Single-Parent Households in Bevier
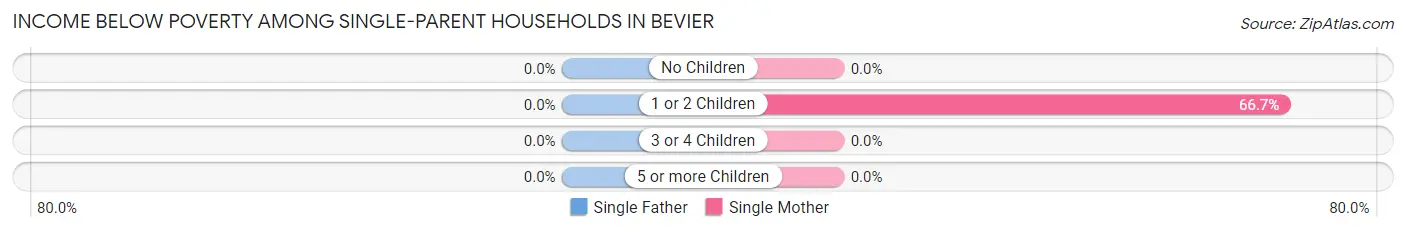
| Children | Single Father | Single Mother |
| No Children | 0 (0.0%) | 0 (0.0%) |
| 1 or 2 Children | 0 (0.0%) | 2 (66.7%) |
| 3 or 4 Children | 0 (0.0%) | 0 (0.0%) |
| 5 or more Children | 0 (0.0%) | 0 (0.0%) |
| Total | 0 (0.0%) | 2 (28.6%) |
Income Below Poverty Among Married-Couple vs Single-Parent Households in Bevier
The poverty data for Bevier shows that 3 of the married-couple family households (2.7%) and 2 of the single-parent households (14.3%) are living below the poverty level. Within the married-couple family households, those with no children have the highest poverty rate, with 3 households (3.5%) falling below the poverty line. Among the single-parent households, those with 1 or 2 children have the highest poverty rate, with 2 household (33.3%) living below poverty.
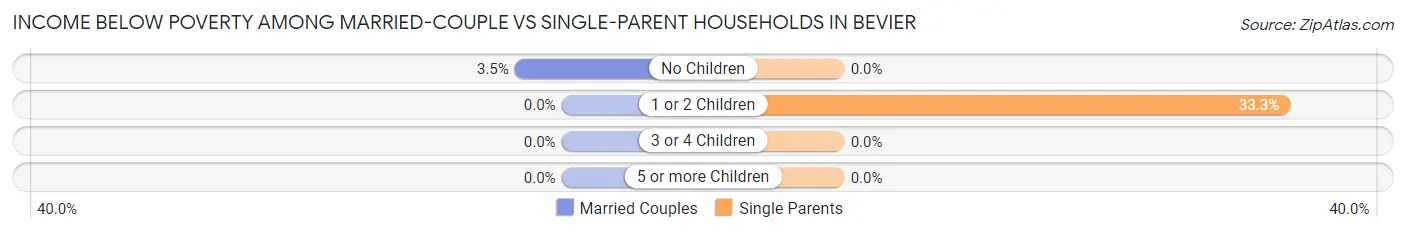
| Children | Married-Couple Families | Single-Parent Households |
| No Children | 3 (3.5%) | 0 (0.0%) |
| 1 or 2 Children | 0 (0.0%) | 2 (33.3%) |
| 3 or 4 Children | 0 (0.0%) | 0 (0.0%) |
| 5 or more Children | 0 (0.0%) | 0 (0.0%) |
| Total | 3 (2.7%) | 2 (14.3%) |
Race in Bevier
The most populous races in Bevier are White / Caucasian (617 | 97.5%), Two or more Races (9 | 1.4%), and Black / African American (6 | 0.9%).
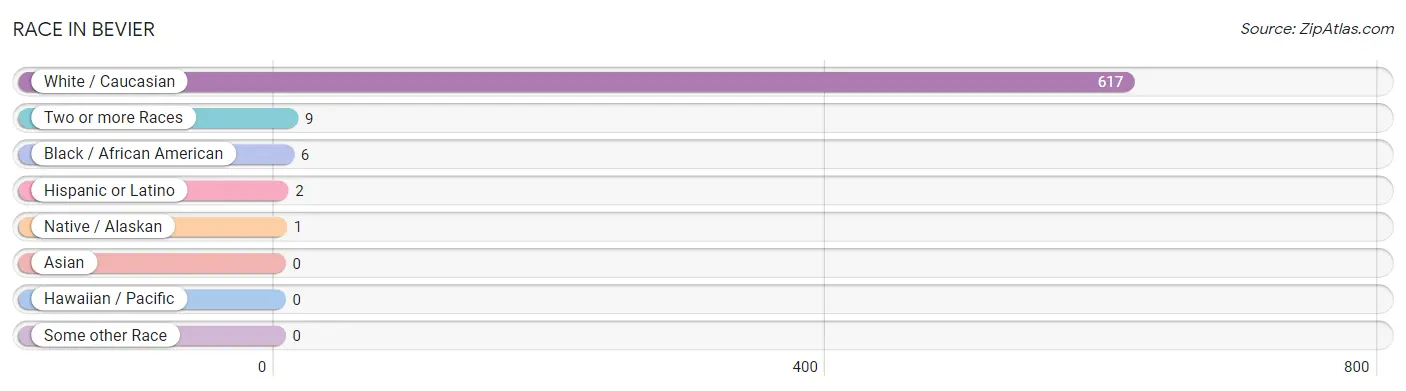
| Race | # Population | % Population |
| Asian | 0 | 0.0% |
| Black / African American | 6 | 0.9% |
| Hawaiian / Pacific | 0 | 0.0% |
| Hispanic or Latino | 2 | 0.3% |
| Native / Alaskan | 1 | 0.2% |
| White / Caucasian | 617 | 97.5% |
| Two or more Races | 9 | 1.4% |
| Some other Race | 0 | 0.0% |
| Total | 633 | 100.0% |
Ancestry in Bevier
The most populous ancestries reported in Bevier are German (136 | 21.5%), Irish (96 | 15.2%), English (72 | 11.4%), American (47 | 7.4%), and Italian (24 | 3.8%), together accounting for 59.2% of all Bevier residents.
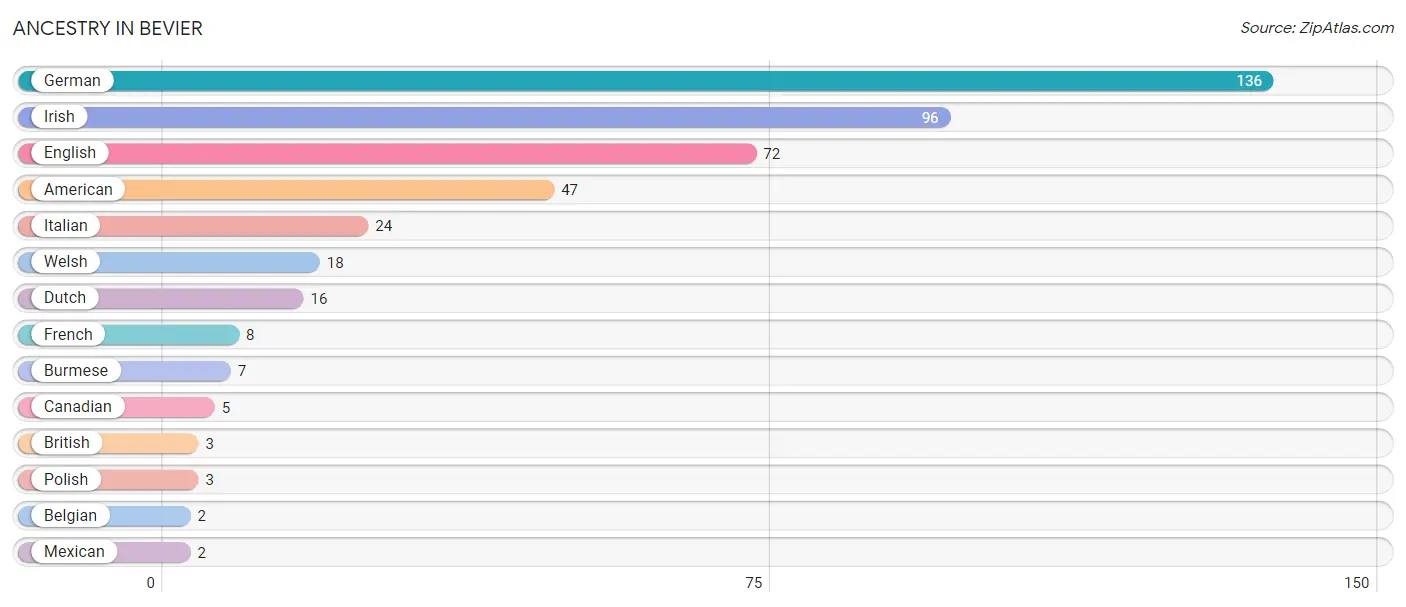
| Ancestry | # Population | % Population |
| American | 47 | 7.4% |
| Belgian | 2 | 0.3% |
| British | 3 | 0.5% |
| Burmese | 7 | 1.1% |
| Canadian | 5 | 0.8% |
| Dutch | 16 | 2.5% |
| English | 72 | 11.4% |
| French | 8 | 1.3% |
| German | 136 | 21.5% |
| Irish | 96 | 15.2% |
| Italian | 24 | 3.8% |
| Mexican | 2 | 0.3% |
| Polish | 3 | 0.5% |
| Welsh | 18 | 2.8% | View All 14 Rows |
Immigrants in Bevier

| Immigration Origin | # Population | % Population | View All 0 Rows |
Sex and Age in Bevier
Sex and Age in Bevier
The most populous age groups in Bevier are 20 to 24 Years (49 | 15.9%) for men and 60 to 64 Years (64 | 19.8%) for women.
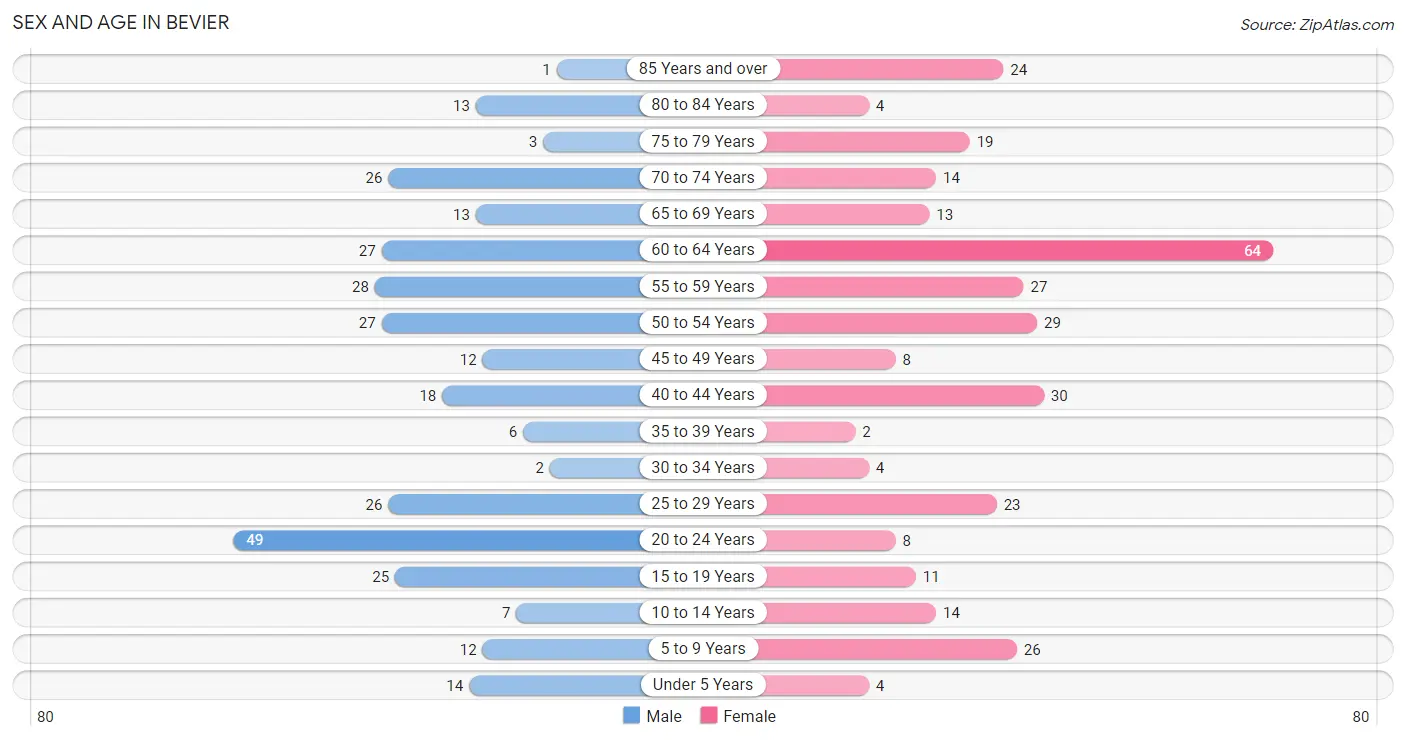
| Age Bracket | Male | Female |
| Under 5 Years | 14 (4.5%) | 4 (1.2%) |
| 5 to 9 Years | 12 (3.9%) | 26 (8.0%) |
| 10 to 14 Years | 7 (2.3%) | 14 (4.3%) |
| 15 to 19 Years | 25 (8.1%) | 11 (3.4%) |
| 20 to 24 Years | 49 (15.9%) | 8 (2.5%) |
| 25 to 29 Years | 26 (8.4%) | 23 (7.1%) |
| 30 to 34 Years | 2 (0.6%) | 4 (1.2%) |
| 35 to 39 Years | 6 (1.9%) | 2 (0.6%) |
| 40 to 44 Years | 18 (5.8%) | 30 (9.3%) |
| 45 to 49 Years | 12 (3.9%) | 8 (2.5%) |
| 50 to 54 Years | 27 (8.7%) | 29 (8.9%) |
| 55 to 59 Years | 28 (9.1%) | 27 (8.3%) |
| 60 to 64 Years | 27 (8.7%) | 64 (19.8%) |
| 65 to 69 Years | 13 (4.2%) | 13 (4.0%) |
| 70 to 74 Years | 26 (8.4%) | 14 (4.3%) |
| 75 to 79 Years | 3 (1.0%) | 19 (5.9%) |
| 80 to 84 Years | 13 (4.2%) | 4 (1.2%) |
| 85 Years and over | 1 (0.3%) | 24 (7.4%) |
| Total | 309 (100.0%) | 324 (100.0%) |
Families and Households in Bevier
Median Family Size in Bevier
The median family size in Bevier is 3.30 persons per family, with married-couple families (111 | 88.8%) accounting for the largest median family size of 3.32 persons per family. On the other hand, single female/mother families (7 | 5.6%) represent the smallest median family size with 3.14 persons per family.
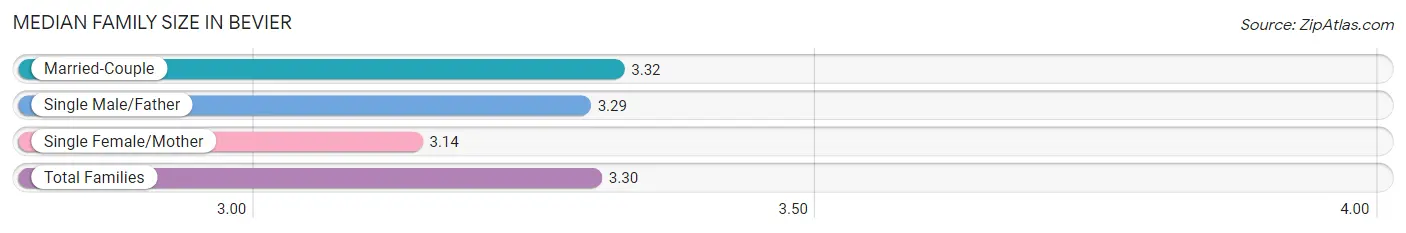
| Family Type | # Families | Family Size |
| Married-Couple | 111 (88.8%) | 3.32 |
| Single Male/Father | 7 (5.6%) | 3.29 |
| Single Female/Mother | 7 (5.6%) | 3.14 |
| Total Families | 125 (100.0%) | 3.30 |
Median Household Size in Bevier
The median household size in Bevier is 2.32 persons per household, with single male/father households (7 | 2.6%) accounting for the largest median household size of 4.86 persons per household. non-family households (148 | 54.2%) represent the smallest median household size with 1.40 persons per household.
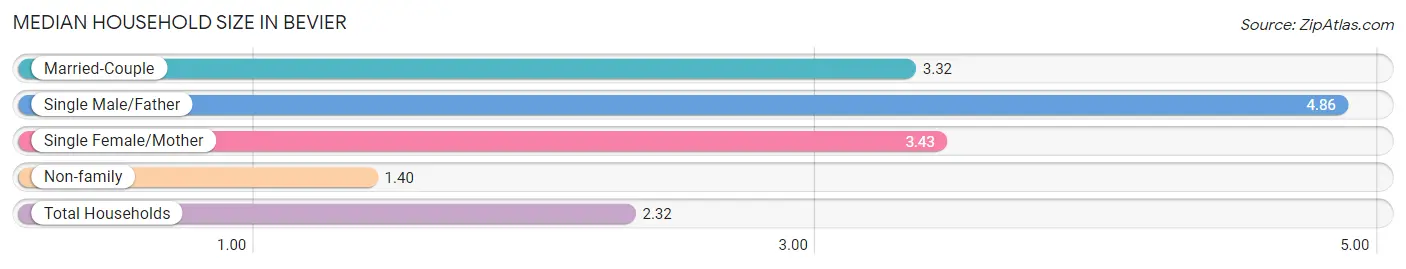
| Household Type | # Households | Household Size |
| Married-Couple | 111 (40.7%) | 3.32 |
| Single Male/Father | 7 (2.6%) | 4.86 |
| Single Female/Mother | 7 (2.6%) | 3.43 |
| Non-family | 148 (54.2%) | 1.40 |
| Total Households | 273 (100.0%) | 2.32 |
Household Size by Marriage Status in Bevier
Out of a total of 273 households in Bevier, 125 (45.8%) are family households, while 148 (54.2%) are nonfamily households. The most numerous type of family households are 2-person households, comprising 90, and the most common type of nonfamily households are 1-person households, comprising 121.
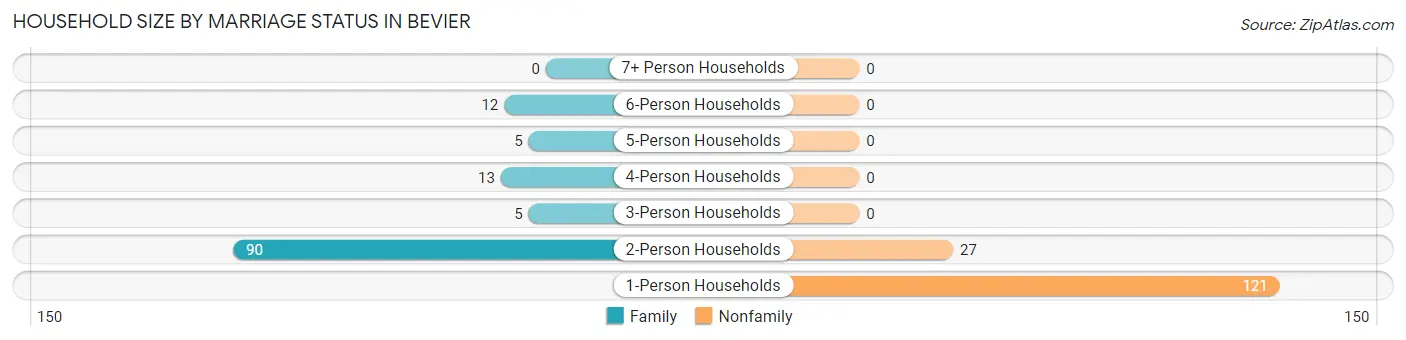
| Household Size | Family Households | Nonfamily Households |
| 1-Person Households | - | 121 (44.3%) |
| 2-Person Households | 90 (33.0%) | 27 (9.9%) |
| 3-Person Households | 5 (1.8%) | 0 (0.0%) |
| 4-Person Households | 13 (4.8%) | 0 (0.0%) |
| 5-Person Households | 5 (1.8%) | 0 (0.0%) |
| 6-Person Households | 12 (4.4%) | 0 (0.0%) |
| 7+ Person Households | 0 (0.0%) | 0 (0.0%) |
| Total | 125 (45.8%) | 148 (54.2%) |
Female Fertility in Bevier
Fertility by Age in Bevier
| Age Bracket | Women with Births | Births / 1,000 Women |
| 15 to 19 years | 0 (0.0%) | 0.0 |
| 20 to 34 years | 0 (0.0%) | 0.0 |
| 35 to 50 years | 0 (0.0%) | 0.0 |
| Total | 0 (0.0%) | 0.0 |
Fertility by Age by Marriage Status in Bevier
| Age Bracket | Married | Unmarried |
| 15 to 19 years | 0 (0.0%) | 0 (0.0%) |
| 20 to 34 years | 0 (0.0%) | 0 (0.0%) |
| 35 to 50 years | 0 (0.0%) | 0 (0.0%) |
| Total | 0 (0.0%) | 0 (0.0%) |
Fertility by Education in Bevier
| Educational Attainment | Women with Births | Births / 1,000 Women |
| Less than High School | 0 (0.0%) | 0.0 |
| High School Diploma | 0 (0.0%) | 0.0 |
| College or Associate's Degree | 0 (0.0%) | 0.0 |
| Bachelor's Degree | 0 (0.0%) | 0.0 |
| Graduate Degree | 0 (0.0%) | 0.0 |
| Total | 0 (0.0%) | 0.0 |
Fertility by Education by Marriage Status in Bevier
| Educational Attainment | Married | Unmarried |
| Less than High School | 0 (0.0%) | 0 (0.0%) |
| High School Diploma | 0 (0.0%) | 0 (0.0%) |
| College or Associate's Degree | 0 (0.0%) | 0 (0.0%) |
| Bachelor's Degree | 0 (0.0%) | 0 (0.0%) |
| Graduate Degree | 0 (0.0%) | 0 (0.0%) |
| Total | 0 (0.0%) | 0 (0.0%) |
Employment Characteristics in Bevier
Employment by Class of Employer in Bevier
Among the 283 employed individuals in Bevier, private company employees (210 | 74.2%), self-employed (incorporated) (19 | 6.7%), and not-for-profit organizations (17 | 6.0%) make up the most common classes of employment.
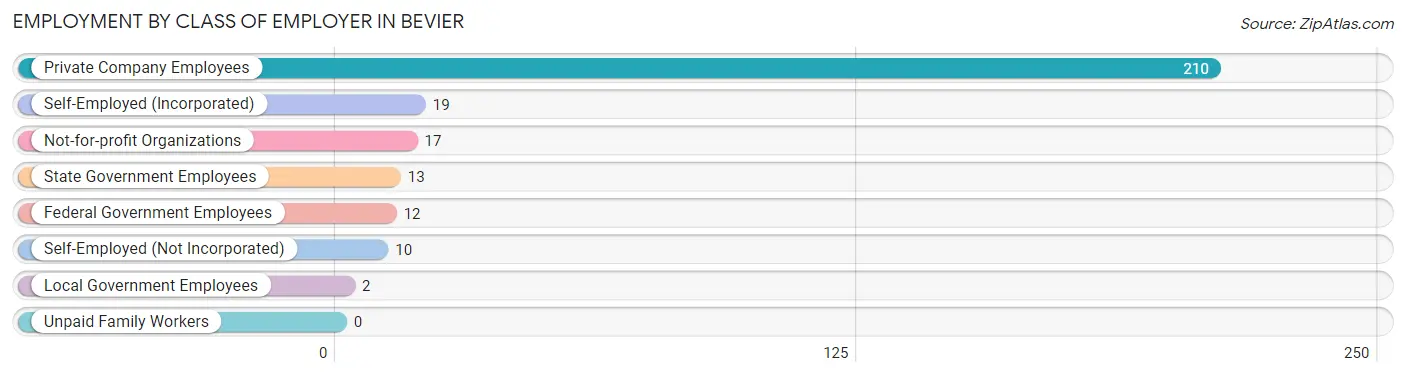
| Employer Class | # Employees | % Employees |
| Private Company Employees | 210 | 74.2% |
| Self-Employed (Incorporated) | 19 | 6.7% |
| Self-Employed (Not Incorporated) | 10 | 3.5% |
| Not-for-profit Organizations | 17 | 6.0% |
| Local Government Employees | 2 | 0.7% |
| State Government Employees | 13 | 4.6% |
| Federal Government Employees | 12 | 4.2% |
| Unpaid Family Workers | 0 | 0.0% |
| Total | 283 | 100.0% |
Employment Status by Age in Bevier
According to the labor force statistics for Bevier, out of the total population over 16 years of age (553), 54.4% or 301 individuals are in the labor force, with 6.0% or 18 of them unemployed. The age group with the highest labor force participation rate is 30 to 34 years, with 100.0% or 6 individuals in the labor force. Within the labor force, the 20 to 24 years age range has the highest percentage of unemployed individuals, with 18.6% or 8 of them being unemployed.
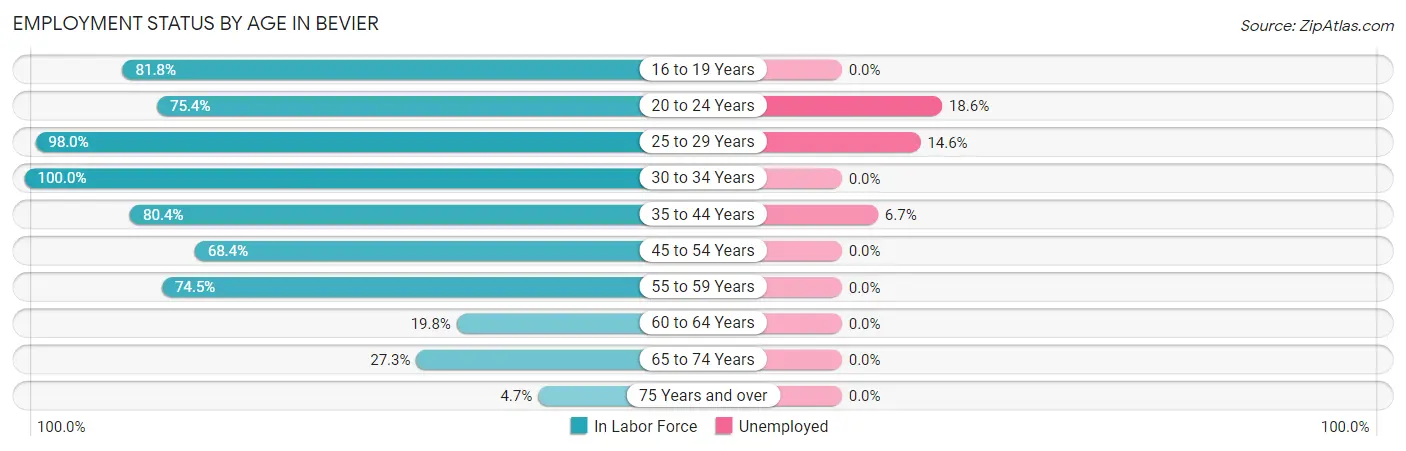
| Age Bracket | In Labor Force | Unemployed |
| 16 to 19 Years | 27 (81.8%) | 0 (0.0%) |
| 20 to 24 Years | 43 (75.4%) | 8 (18.6%) |
| 25 to 29 Years | 48 (98.0%) | 7 (14.6%) |
| 30 to 34 Years | 6 (100.0%) | 0 (0.0%) |
| 35 to 44 Years | 45 (80.4%) | 3 (6.7%) |
| 45 to 54 Years | 52 (68.4%) | 0 (0.0%) |
| 55 to 59 Years | 41 (74.5%) | 0 (0.0%) |
| 60 to 64 Years | 18 (19.8%) | 0 (0.0%) |
| 65 to 74 Years | 18 (27.3%) | 0 (0.0%) |
| 75 Years and over | 3 (4.7%) | 0 (0.0%) |
| Total | 301 (54.4%) | 18 (6.0%) |
Employment Status by Educational Attainment in Bevier
According to labor force statistics for Bevier, 63.1% of individuals (210) out of the total population between 25 and 64 years of age (333) are in the labor force, with 4.8% or 10 of them being unemployed. The group with the highest labor force participation rate are those with the educational attainment of bachelor's degree or higher, with 86.1% or 31 individuals in the labor force. Within the labor force, individuals with high school diploma education have the highest percentage of unemployment, with 6.1% or 7 of them being unemployed.
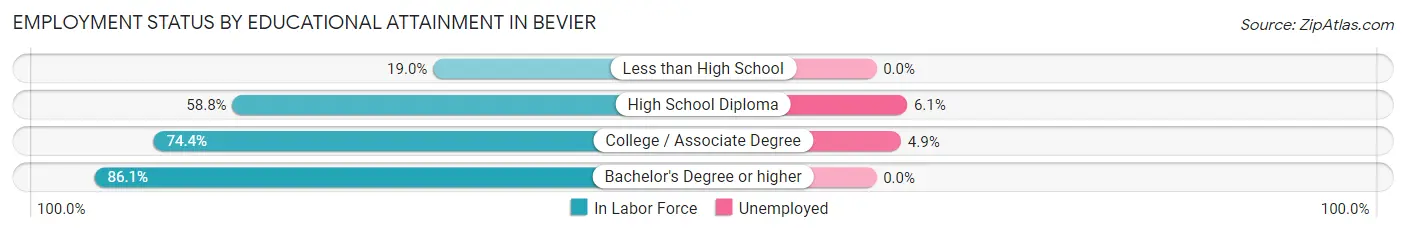
| Educational Attainment | In Labor Force | Unemployed |
| Less than High School | 4 (19.0%) | 0 (0.0%) |
| High School Diploma | 114 (58.8%) | 12 (6.1%) |
| College / Associate Degree | 61 (74.4%) | 4 (4.9%) |
| Bachelor's Degree or higher | 31 (86.1%) | 0 (0.0%) |
| Total | 210 (63.1%) | 16 (4.8%) |
Employment Occupations by Sex in Bevier
Management, Business, Science and Arts Occupations
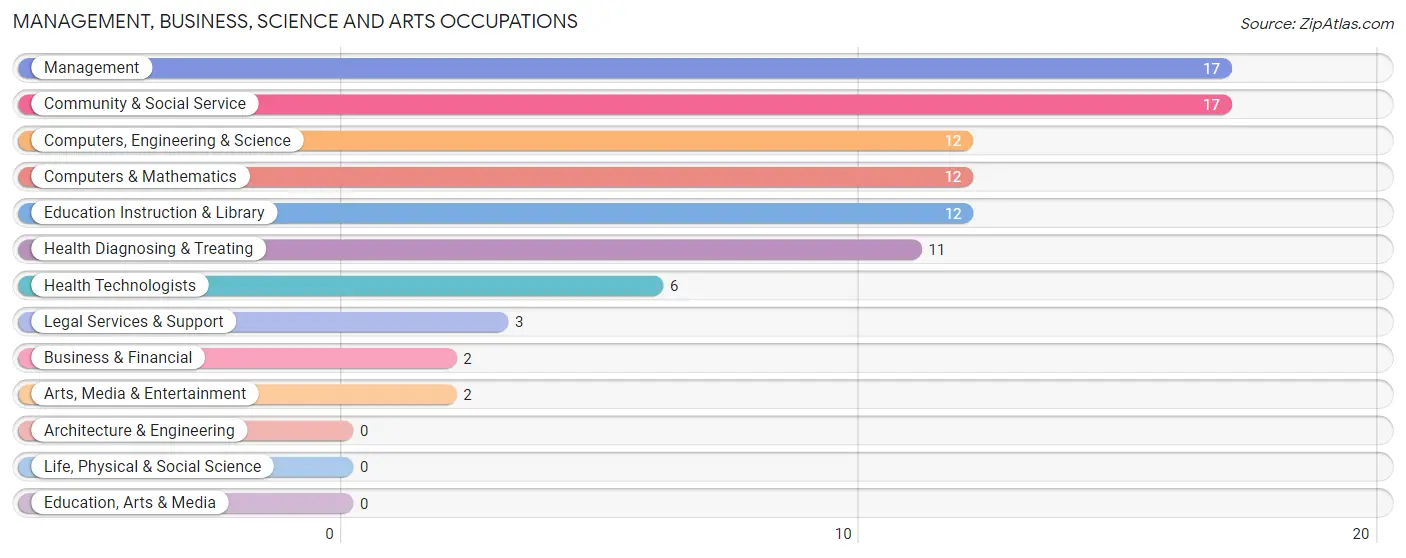
The most common Management, Business, Science and Arts occupations in Bevier are Management (17 | 6.0%), Community & Social Service (17 | 6.0%), Computers, Engineering & Science (12 | 4.2%), Computers & Mathematics (12 | 4.2%), and Education Instruction & Library (12 | 4.2%).
Management, Business, Science and Arts Occupations by Sex
Within the Management, Business, Science and Arts occupations in Bevier, the most male-oriented occupations are Management (100.0%), Computers, Engineering & Science (75.0%), and Computers & Mathematics (75.0%), while the most female-oriented occupations are Business & Financial (100.0%), Legal Services & Support (100.0%), and Arts, Media & Entertainment (100.0%).
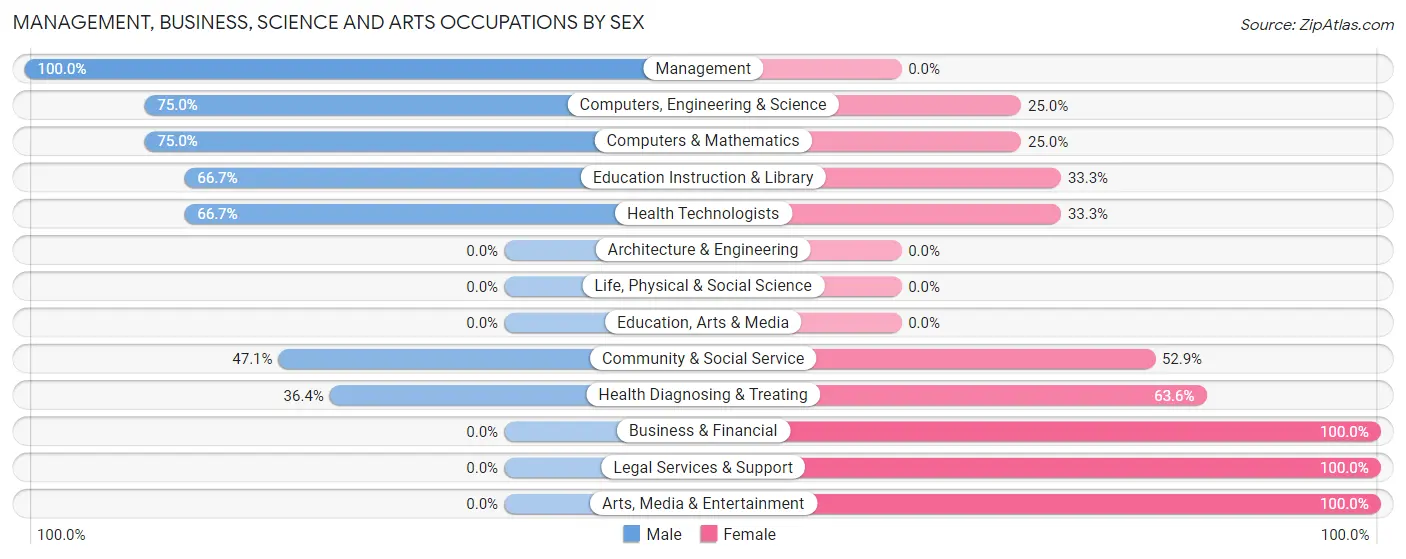
| Occupation | Male | Female |
| Management | 17 (100.0%) | 0 (0.0%) |
| Business & Financial | 0 (0.0%) | 2 (100.0%) |
| Computers, Engineering & Science | 9 (75.0%) | 3 (25.0%) |
| Computers & Mathematics | 9 (75.0%) | 3 (25.0%) |
| Architecture & Engineering | 0 (0.0%) | 0 (0.0%) |
| Life, Physical & Social Science | 0 (0.0%) | 0 (0.0%) |
| Community & Social Service | 8 (47.1%) | 9 (52.9%) |
| Education, Arts & Media | 0 (0.0%) | 0 (0.0%) |
| Legal Services & Support | 0 (0.0%) | 3 (100.0%) |
| Education Instruction & Library | 8 (66.7%) | 4 (33.3%) |
| Arts, Media & Entertainment | 0 (0.0%) | 2 (100.0%) |
| Health Diagnosing & Treating | 4 (36.4%) | 7 (63.6%) |
| Health Technologists | 4 (66.7%) | 2 (33.3%) |
| Total (Category) | 38 (64.4%) | 21 (35.6%) |
| Total (Overall) | 168 (59.4%) | 115 (40.6%) |
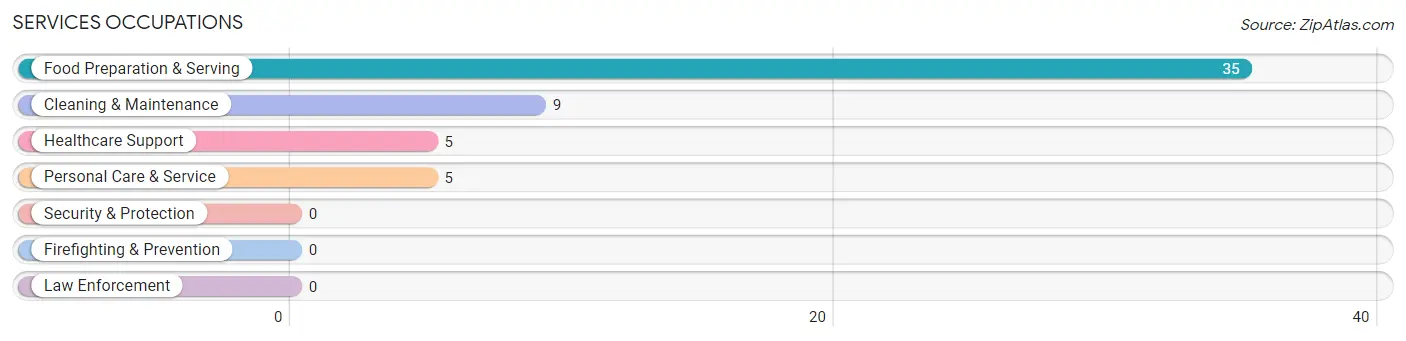
Services Occupations
The most common Services occupations in Bevier are Food Preparation & Serving (35 | 12.4%), Cleaning & Maintenance (9 | 3.2%), Healthcare Support (5 | 1.8%), and Personal Care & Service (5 | 1.8%).
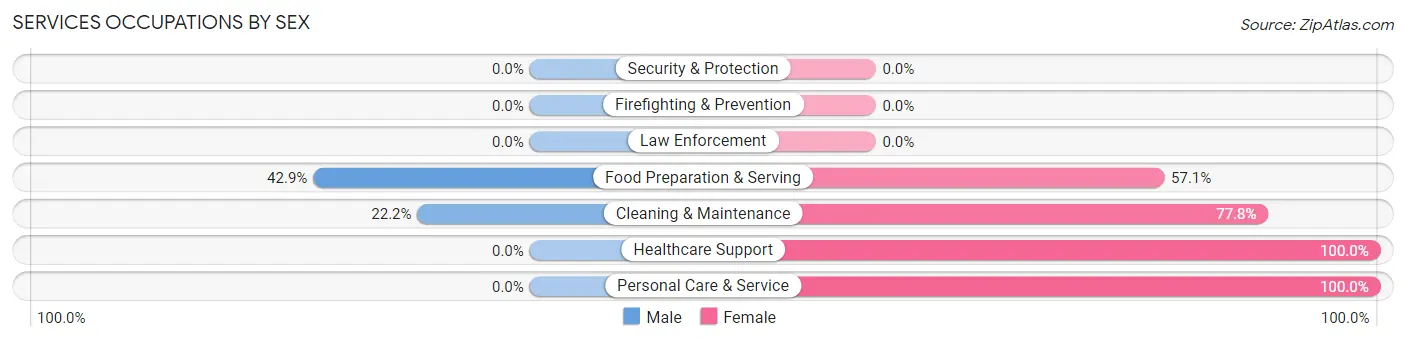
Services Occupations by Sex
Within the Services occupations in Bevier, the most male-oriented occupations are Food Preparation & Serving (42.9%), and Cleaning & Maintenance (22.2%), while the most female-oriented occupations are Healthcare Support (100.0%), Personal Care & Service (100.0%), and Cleaning & Maintenance (77.8%).
| Occupation | Male | Female |
| Healthcare Support | 0 (0.0%) | 5 (100.0%) |
| Security & Protection | 0 (0.0%) | 0 (0.0%) |
| Firefighting & Prevention | 0 (0.0%) | 0 (0.0%) |
| Law Enforcement | 0 (0.0%) | 0 (0.0%) |
| Food Preparation & Serving | 15 (42.9%) | 20 (57.1%) |
| Cleaning & Maintenance | 2 (22.2%) | 7 (77.8%) |
| Personal Care & Service | 0 (0.0%) | 5 (100.0%) |
| Total (Category) | 17 (31.5%) | 37 (68.5%) |
| Total (Overall) | 168 (59.4%) | 115 (40.6%) |
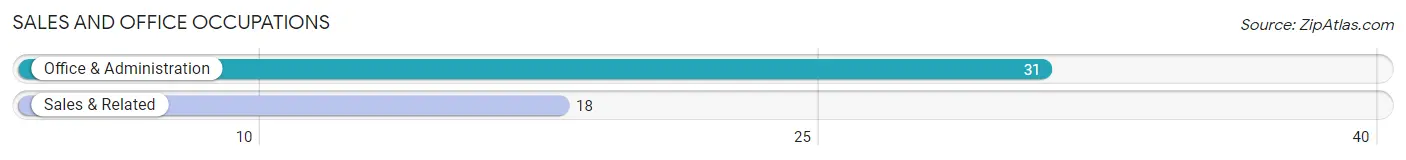
Sales and Office Occupations
The most common Sales and Office occupations in Bevier are Office & Administration (31 | 11.0%), and Sales & Related (18 | 6.4%).
Sales and Office Occupations by Sex
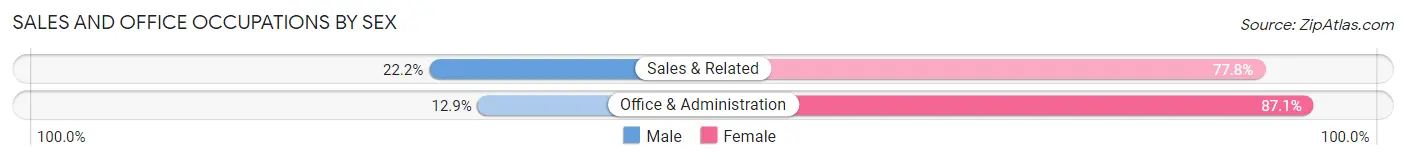
| Occupation | Male | Female |
| Sales & Related | 4 (22.2%) | 14 (77.8%) |
| Office & Administration | 4 (12.9%) | 27 (87.1%) |
| Total (Category) | 8 (16.3%) | 41 (83.7%) |
| Total (Overall) | 168 (59.4%) | 115 (40.6%) |
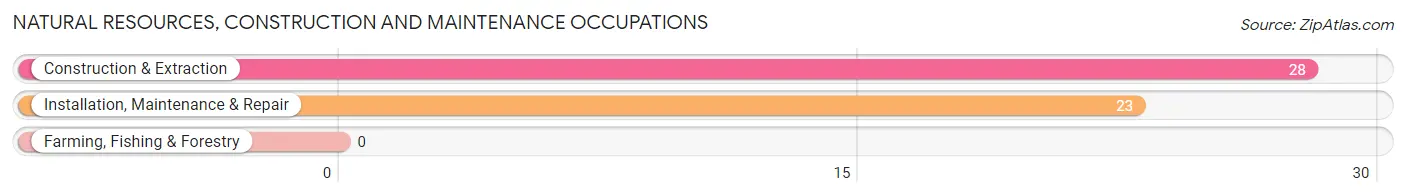
Natural Resources, Construction and Maintenance Occupations
The most common Natural Resources, Construction and Maintenance occupations in Bevier are Construction & Extraction (28 | 9.9%), and Installation, Maintenance & Repair (23 | 8.1%).
Natural Resources, Construction and Maintenance Occupations by Sex
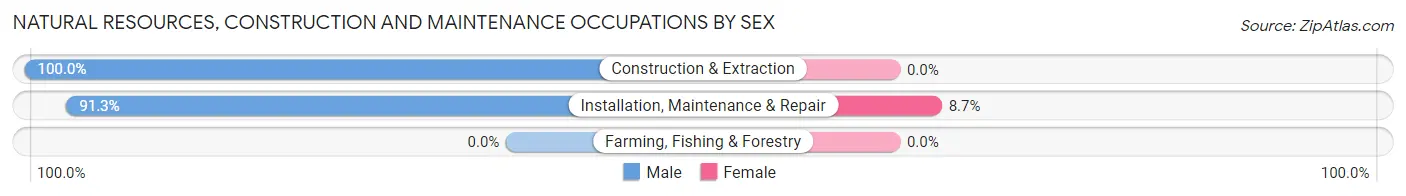
| Occupation | Male | Female |
| Farming, Fishing & Forestry | 0 (0.0%) | 0 (0.0%) |
| Construction & Extraction | 28 (100.0%) | 0 (0.0%) |
| Installation, Maintenance & Repair | 21 (91.3%) | 2 (8.7%) |
| Total (Category) | 49 (96.1%) | 2 (3.9%) |
| Total (Overall) | 168 (59.4%) | 115 (40.6%) |
Production, Transportation and Moving Occupations
The most common Production, Transportation and Moving occupations in Bevier are Material Moving (28 | 9.9%), Production (22 | 7.8%), and Transportation (20 | 7.1%).
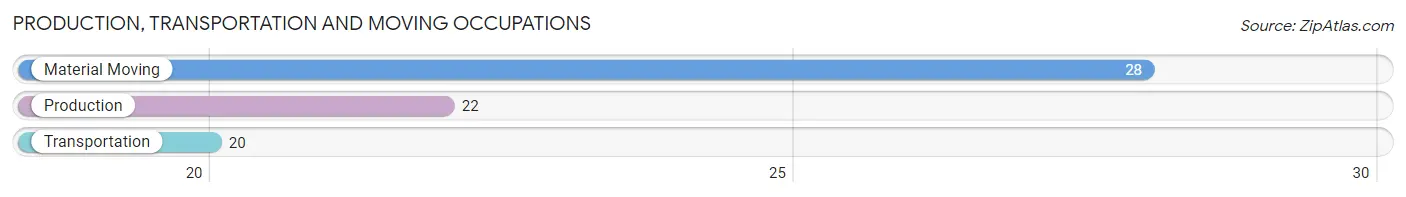
Production, Transportation and Moving Occupations by Sex
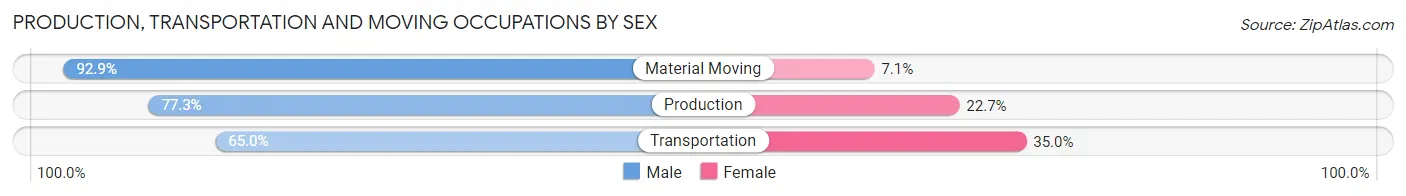
| Occupation | Male | Female |
| Production | 17 (77.3%) | 5 (22.7%) |
| Transportation | 13 (65.0%) | 7 (35.0%) |
| Material Moving | 26 (92.9%) | 2 (7.1%) |
| Total (Category) | 56 (80.0%) | 14 (20.0%) |
| Total (Overall) | 168 (59.4%) | 115 (40.6%) |
Employment Industries by Sex in Bevier
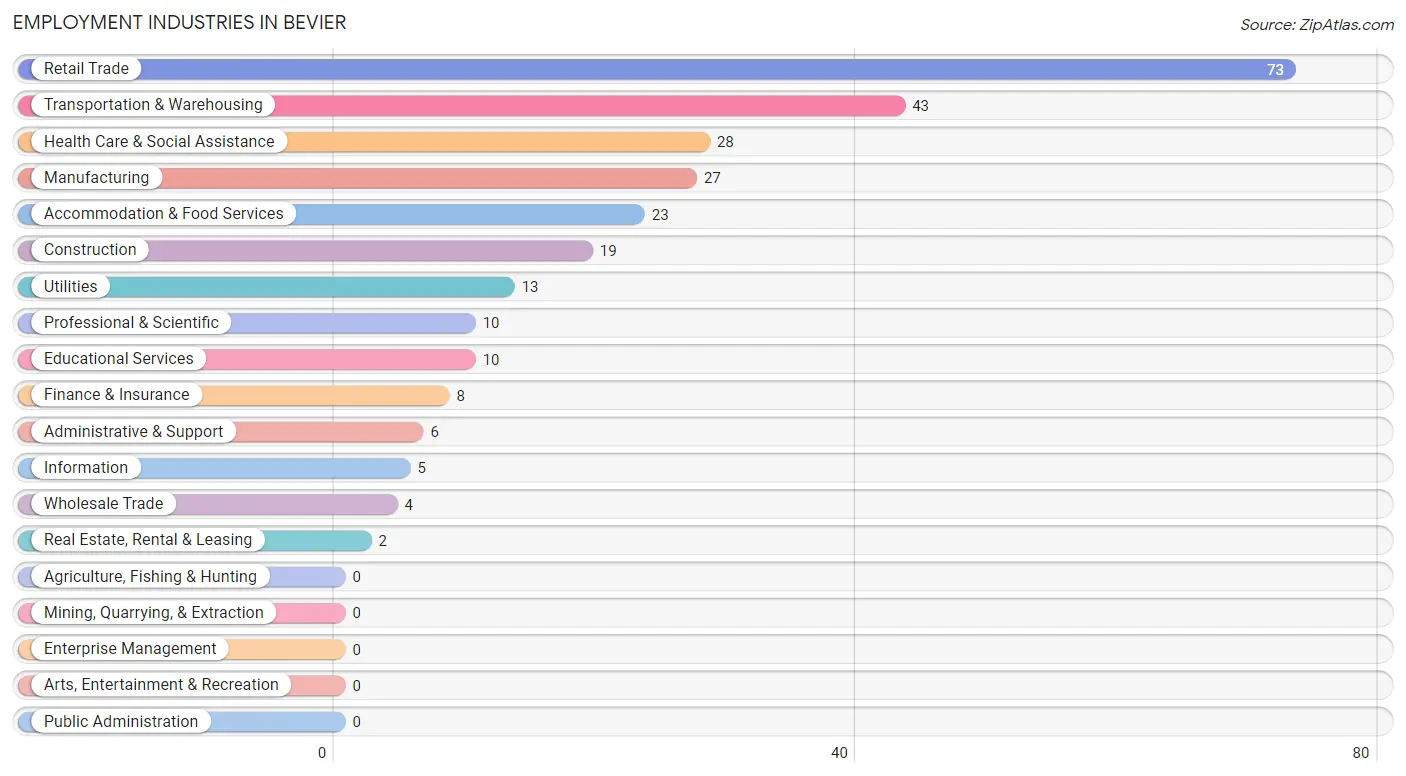
Employment Industries in Bevier
The major employment industries in Bevier include Retail Trade (73 | 25.8%), Transportation & Warehousing (43 | 15.2%), Health Care & Social Assistance (28 | 9.9%), Manufacturing (27 | 9.5%), and Accommodation & Food Services (23 | 8.1%).
Employment Industries by Sex in Bevier
The Bevier industries that see more men than women are Construction (100.0%), Utilities (100.0%), and Information (100.0%), whereas the industries that tend to have a higher number of women are Finance & Insurance (100.0%), Real Estate, Rental & Leasing (100.0%), and Health Care & Social Assistance (100.0%).
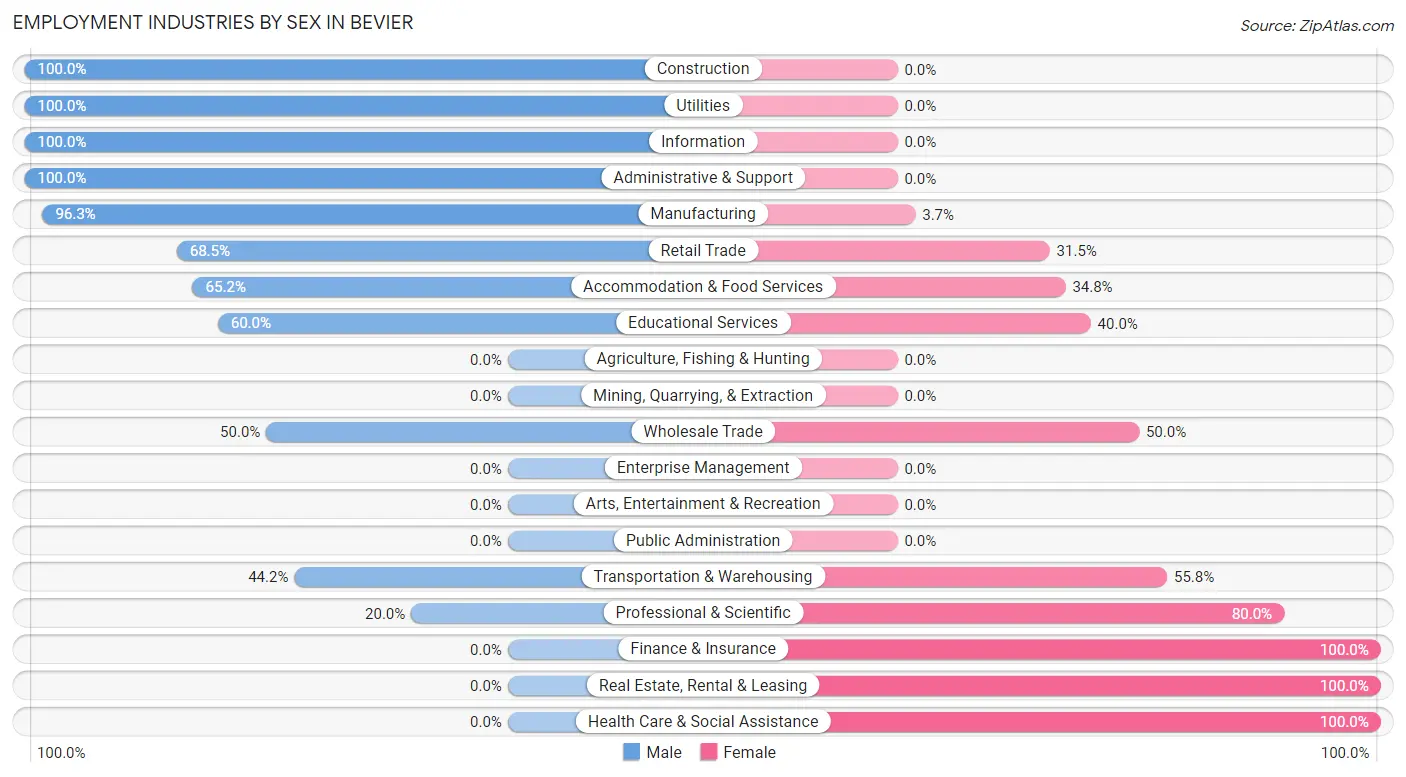
| Industry | Male | Female |
| Agriculture, Fishing & Hunting | 0 (0.0%) | 0 (0.0%) |
| Mining, Quarrying, & Extraction | 0 (0.0%) | 0 (0.0%) |
| Construction | 19 (100.0%) | 0 (0.0%) |
| Manufacturing | 26 (96.3%) | 1 (3.7%) |
| Wholesale Trade | 2 (50.0%) | 2 (50.0%) |
| Retail Trade | 50 (68.5%) | 23 (31.5%) |
| Transportation & Warehousing | 19 (44.2%) | 24 (55.8%) |
| Utilities | 13 (100.0%) | 0 (0.0%) |
| Information | 5 (100.0%) | 0 (0.0%) |
| Finance & Insurance | 0 (0.0%) | 8 (100.0%) |
| Real Estate, Rental & Leasing | 0 (0.0%) | 2 (100.0%) |
| Professional & Scientific | 2 (20.0%) | 8 (80.0%) |
| Enterprise Management | 0 (0.0%) | 0 (0.0%) |
| Administrative & Support | 6 (100.0%) | 0 (0.0%) |
| Educational Services | 6 (60.0%) | 4 (40.0%) |
| Health Care & Social Assistance | 0 (0.0%) | 28 (100.0%) |
| Arts, Entertainment & Recreation | 0 (0.0%) | 0 (0.0%) |
| Accommodation & Food Services | 15 (65.2%) | 8 (34.8%) |
| Public Administration | 0 (0.0%) | 0 (0.0%) |
| Total | 168 (59.4%) | 115 (40.6%) |
Education in Bevier
School Enrollment in Bevier
The most common levels of schooling among the 89 students in Bevier are elementary school (21 | 23.6%), middle school (19 | 21.3%), and high school (17 | 19.1%).
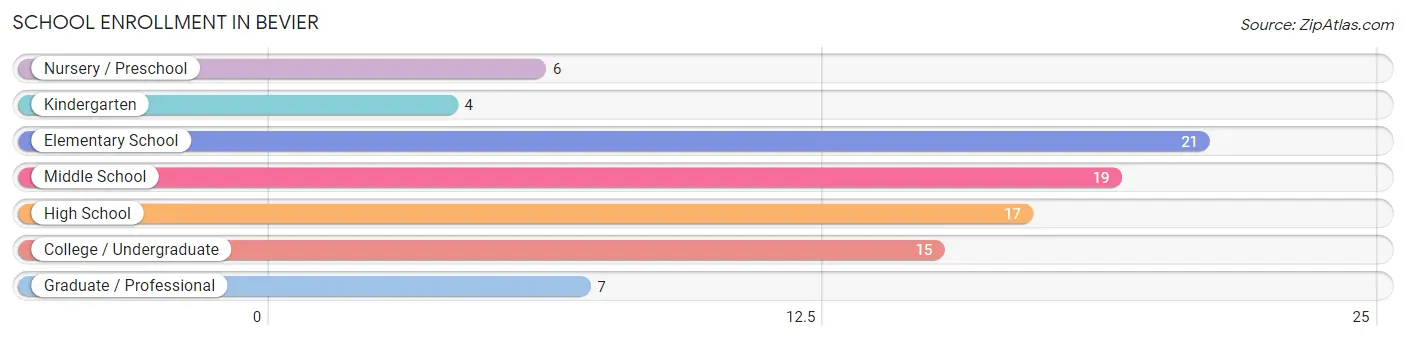
| School Level | # Students | % Students |
| Nursery / Preschool | 6 | 6.7% |
| Kindergarten | 4 | 4.5% |
| Elementary School | 21 | 23.6% |
| Middle School | 19 | 21.3% |
| High School | 17 | 19.1% |
| College / Undergraduate | 15 | 16.9% |
| Graduate / Professional | 7 | 7.9% |
| Total | 89 | 100.0% |
School Enrollment by Age by Funding Source in Bevier
Out of a total of 89 students who are enrolled in schools in Bevier, 9 (10.1%) attend a private institution, while the remaining 80 (89.9%) are enrolled in public schools. The age group of 25 to 34 year olds has the highest likelihood of being enrolled in private schools, with 4 (44.4% in the age bracket) enrolled. Conversely, the age group of 5 to 9 year old has the lowest likelihood of being enrolled in a private school, with 31 (100.0% in the age bracket) attending a public institution.
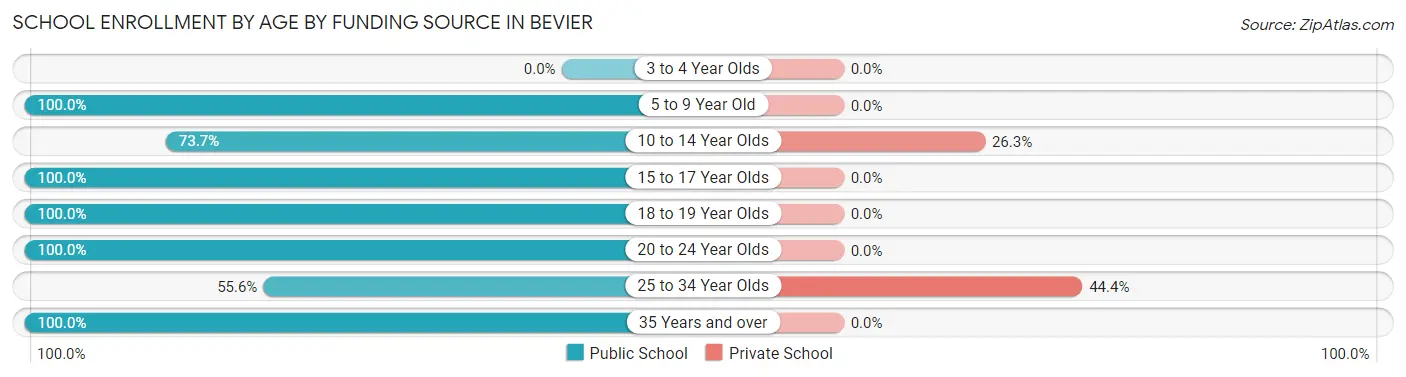
| Age Bracket | Public School | Private School |
| 3 to 4 Year Olds | 0 (0.0%) | 0 (0.0%) |
| 5 to 9 Year Old | 31 (100.0%) | 0 (0.0%) |
| 10 to 14 Year Olds | 14 (73.7%) | 5 (26.3%) |
| 15 to 17 Year Olds | 14 (100.0%) | 0 (0.0%) |
| 18 to 19 Year Olds | 5 (100.0%) | 0 (0.0%) |
| 20 to 24 Year Olds | 8 (100.0%) | 0 (0.0%) |
| 25 to 34 Year Olds | 5 (55.6%) | 4 (44.4%) |
| 35 Years and over | 3 (100.0%) | 0 (0.0%) |
| Total | 80 (89.9%) | 9 (10.1%) |
Educational Attainment by Field of Study in Bevier
Education (20 | 33.3%), liberal arts & history (17 | 28.3%), science & technology (9 | 15.0%), bio, nature & agricultural (4 | 6.7%), and social sciences (4 | 6.7%) are the most common fields of study among 60 individuals in Bevier who have obtained a bachelor's degree or higher.
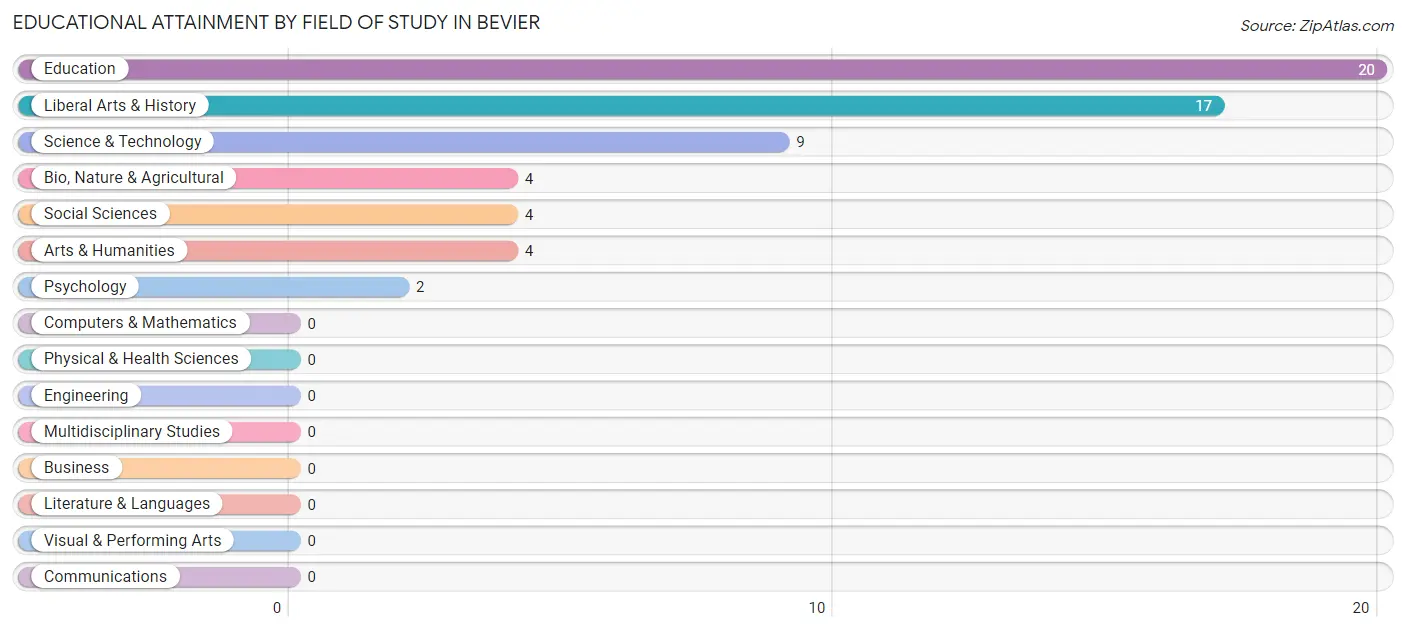
| Field of Study | # Graduates | % Graduates |
| Computers & Mathematics | 0 | 0.0% |
| Bio, Nature & Agricultural | 4 | 6.7% |
| Physical & Health Sciences | 0 | 0.0% |
| Psychology | 2 | 3.3% |
| Social Sciences | 4 | 6.7% |
| Engineering | 0 | 0.0% |
| Multidisciplinary Studies | 0 | 0.0% |
| Science & Technology | 9 | 15.0% |
| Business | 0 | 0.0% |
| Education | 20 | 33.3% |
| Literature & Languages | 0 | 0.0% |
| Liberal Arts & History | 17 | 28.3% |
| Visual & Performing Arts | 0 | 0.0% |
| Communications | 0 | 0.0% |
| Arts & Humanities | 4 | 6.7% |
| Total | 60 | 100.0% |
Transportation & Commute in Bevier
Vehicle Availability by Sex in Bevier
The most prevalent vehicle ownership categories in Bevier are males with 2 vehicles (74, accounting for 44.1%) and females with 2 vehicles (54, making up 64.3%).
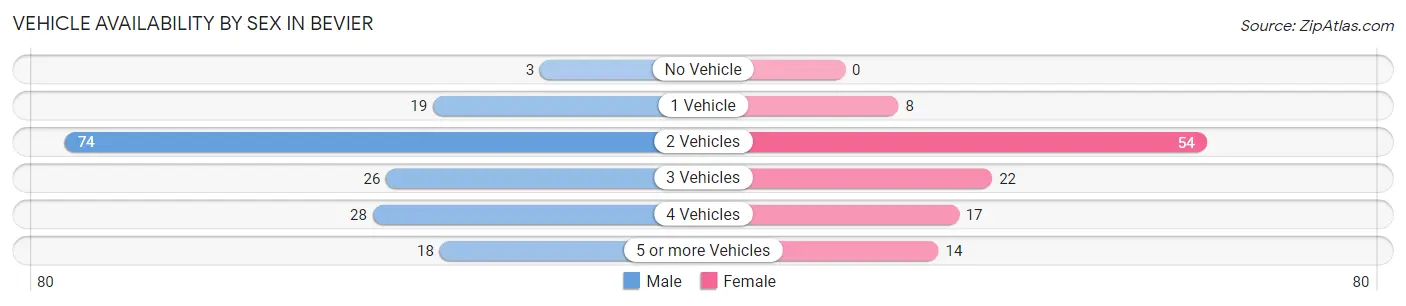
| Vehicles Available | Male | Female |
| No Vehicle | 3 (1.8%) | 0 (0.0%) |
| 1 Vehicle | 19 (11.3%) | 8 (7.0%) |
| 2 Vehicles | 74 (44.1%) | 54 (47.0%) |
| 3 Vehicles | 26 (15.5%) | 22 (19.1%) |
| 4 Vehicles | 28 (16.7%) | 17 (14.8%) |
| 5 or more Vehicles | 18 (10.7%) | 14 (12.2%) |
| Total | 168 (100.0%) | 115 (100.0%) |
Commute Time in Bevier
The most frequently occuring commute durations in Bevier are 10 to 14 minutes (59 commuters, 23.4%), 15 to 19 minutes (35 commuters, 13.9%), and 20 to 24 minutes (35 commuters, 13.9%).
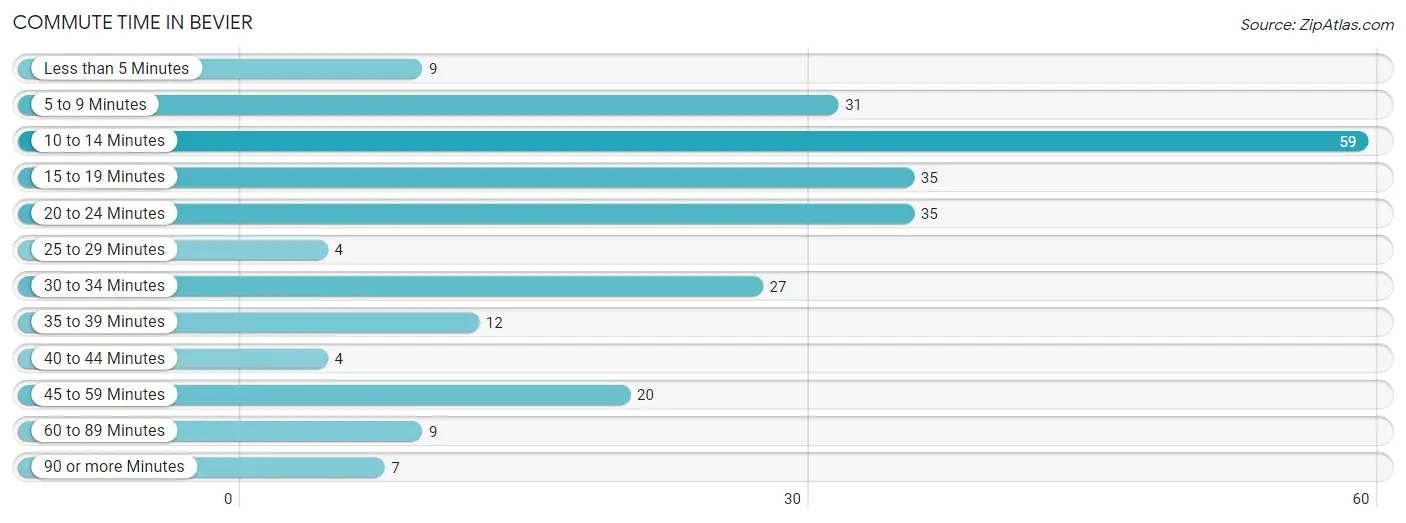
| Commute Time | # Commuters | % Commuters |
| Less than 5 Minutes | 9 | 3.6% |
| 5 to 9 Minutes | 31 | 12.3% |
| 10 to 14 Minutes | 59 | 23.4% |
| 15 to 19 Minutes | 35 | 13.9% |
| 20 to 24 Minutes | 35 | 13.9% |
| 25 to 29 Minutes | 4 | 1.6% |
| 30 to 34 Minutes | 27 | 10.7% |
| 35 to 39 Minutes | 12 | 4.8% |
| 40 to 44 Minutes | 4 | 1.6% |
| 45 to 59 Minutes | 20 | 7.9% |
| 60 to 89 Minutes | 9 | 3.6% |
| 90 or more Minutes | 7 | 2.8% |
Commute Time by Sex in Bevier
The most common commute times in Bevier are 10 to 14 minutes (26 commuters, 17.8%) for males and 10 to 14 minutes (33 commuters, 31.1%) for females.
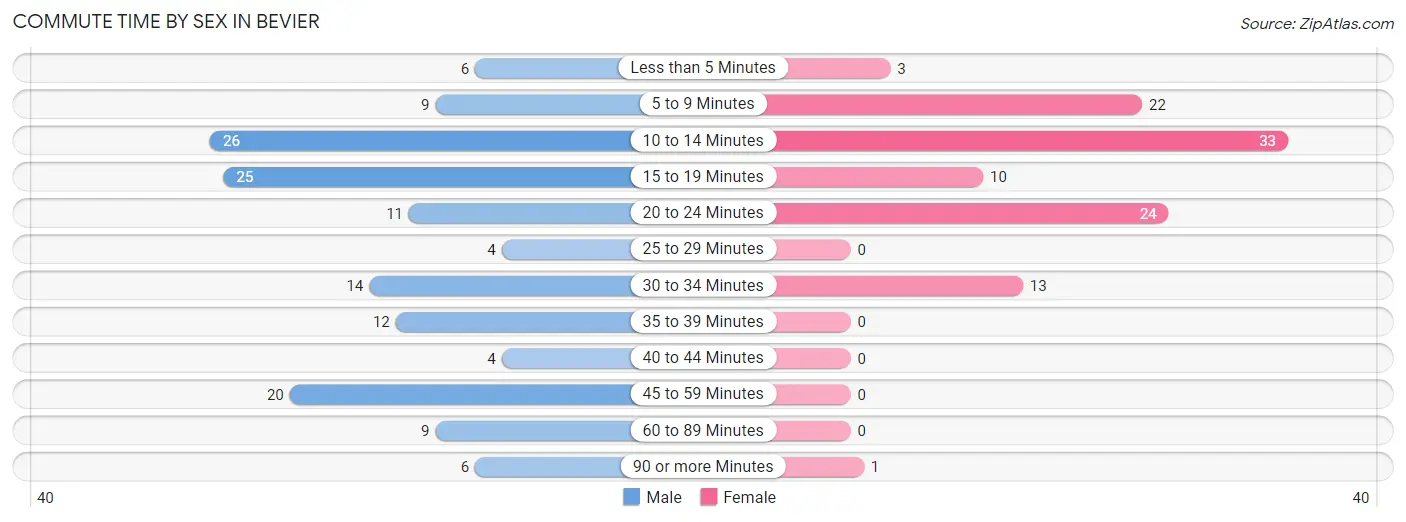
| Commute Time | Male | Female |
| Less than 5 Minutes | 6 (4.1%) | 3 (2.8%) |
| 5 to 9 Minutes | 9 (6.2%) | 22 (20.7%) |
| 10 to 14 Minutes | 26 (17.8%) | 33 (31.1%) |
| 15 to 19 Minutes | 25 (17.1%) | 10 (9.4%) |
| 20 to 24 Minutes | 11 (7.5%) | 24 (22.6%) |
| 25 to 29 Minutes | 4 (2.7%) | 0 (0.0%) |
| 30 to 34 Minutes | 14 (9.6%) | 13 (12.3%) |
| 35 to 39 Minutes | 12 (8.2%) | 0 (0.0%) |
| 40 to 44 Minutes | 4 (2.7%) | 0 (0.0%) |
| 45 to 59 Minutes | 20 (13.7%) | 0 (0.0%) |
| 60 to 89 Minutes | 9 (6.2%) | 0 (0.0%) |
| 90 or more Minutes | 6 (4.1%) | 1 (0.9%) |
Time of Departure to Work by Sex in Bevier
The most frequent times of departure to work in Bevier are 4:00 PM to 11:59 PM (49, 33.6%) for males and 7:30 AM to 7:59 AM (30, 28.3%) for females.
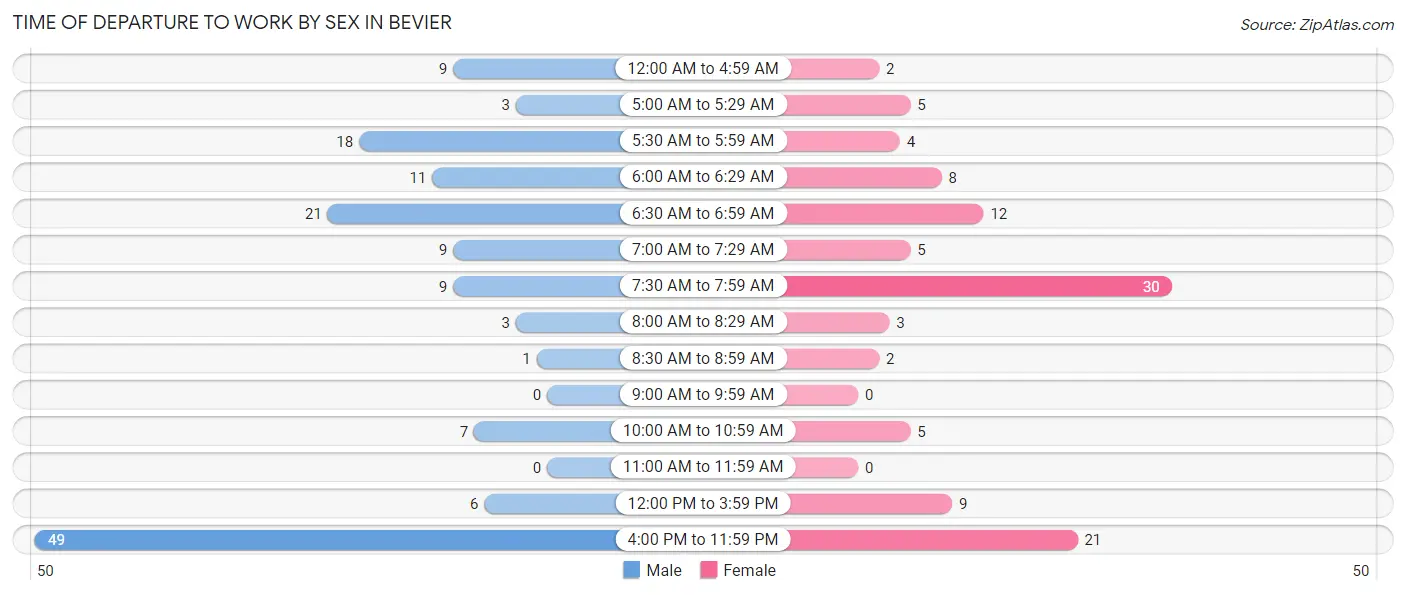
| Time of Departure | Male | Female |
| 12:00 AM to 4:59 AM | 9 (6.2%) | 2 (1.9%) |
| 5:00 AM to 5:29 AM | 3 (2.1%) | 5 (4.7%) |
| 5:30 AM to 5:59 AM | 18 (12.3%) | 4 (3.8%) |
| 6:00 AM to 6:29 AM | 11 (7.5%) | 8 (7.5%) |
| 6:30 AM to 6:59 AM | 21 (14.4%) | 12 (11.3%) |
| 7:00 AM to 7:29 AM | 9 (6.2%) | 5 (4.7%) |
| 7:30 AM to 7:59 AM | 9 (6.2%) | 30 (28.3%) |
| 8:00 AM to 8:29 AM | 3 (2.1%) | 3 (2.8%) |
| 8:30 AM to 8:59 AM | 1 (0.7%) | 2 (1.9%) |
| 9:00 AM to 9:59 AM | 0 (0.0%) | 0 (0.0%) |
| 10:00 AM to 10:59 AM | 7 (4.8%) | 5 (4.7%) |
| 11:00 AM to 11:59 AM | 0 (0.0%) | 0 (0.0%) |
| 12:00 PM to 3:59 PM | 6 (4.1%) | 9 (8.5%) |
| 4:00 PM to 11:59 PM | 49 (33.6%) | 21 (19.8%) |
| Total | 146 (100.0%) | 106 (100.0%) |
Housing Occupancy in Bevier
Occupancy by Ownership in Bevier
Of the total 273 dwellings in Bevier, owner-occupied units account for 223 (81.7%), while renter-occupied units make up 50 (18.3%).
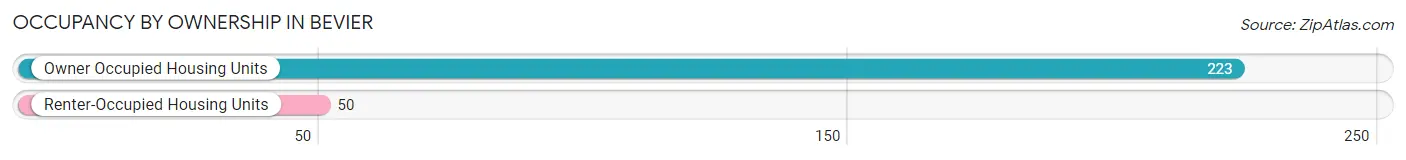
| Occupancy | # Housing Units | % Housing Units |
| Owner Occupied Housing Units | 223 | 81.7% |
| Renter-Occupied Housing Units | 50 | 18.3% |
| Total Occupied Housing Units | 273 | 100.0% |
Occupancy by Household Size in Bevier
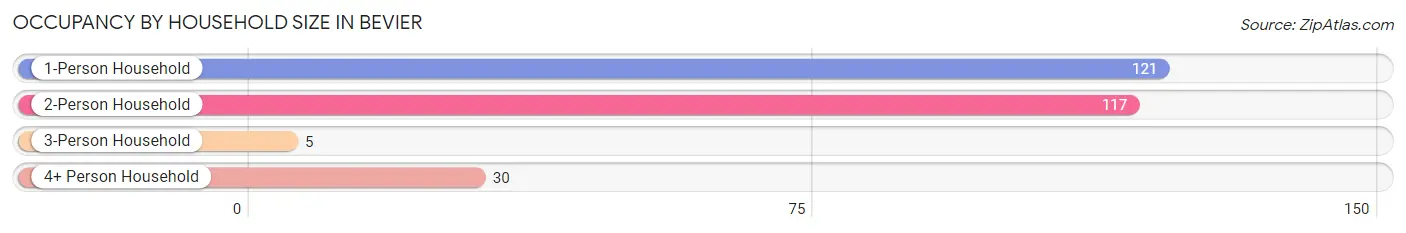
| Household Size | # Housing Units | % Housing Units |
| 1-Person Household | 121 | 44.3% |
| 2-Person Household | 117 | 42.9% |
| 3-Person Household | 5 | 1.8% |
| 4+ Person Household | 30 | 11.0% |
| Total Housing Units | 273 | 100.0% |
Occupancy by Ownership by Household Size in Bevier
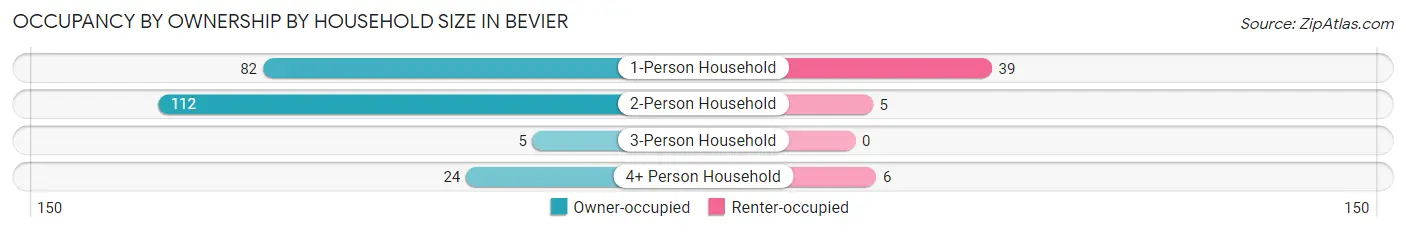
| Household Size | Owner-occupied | Renter-occupied |
| 1-Person Household | 82 (67.8%) | 39 (32.2%) |
| 2-Person Household | 112 (95.7%) | 5 (4.3%) |
| 3-Person Household | 5 (100.0%) | 0 (0.0%) |
| 4+ Person Household | 24 (80.0%) | 6 (20.0%) |
| Total Housing Units | 223 (81.7%) | 50 (18.3%) |
Occupancy by Educational Attainment in Bevier
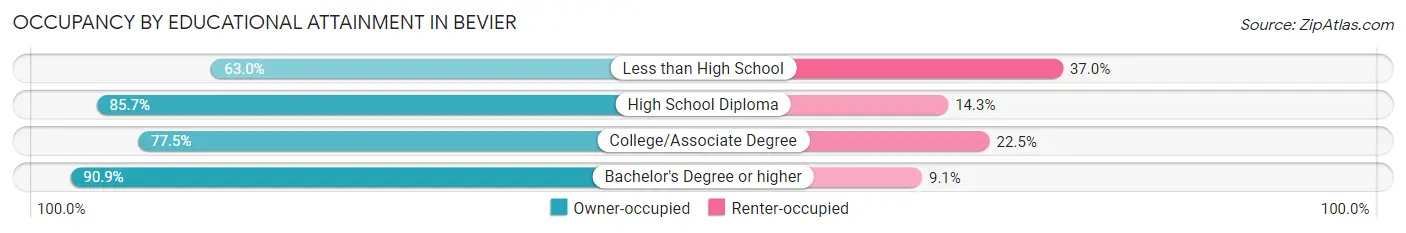
| Household Size | Owner-occupied | Renter-occupied |
| Less than High School | 17 (63.0%) | 10 (37.0%) |
| High School Diploma | 114 (85.7%) | 19 (14.3%) |
| College/Associate Degree | 62 (77.5%) | 18 (22.5%) |
| Bachelor's Degree or higher | 30 (90.9%) | 3 (9.1%) |
Occupancy by Age of Householder in Bevier
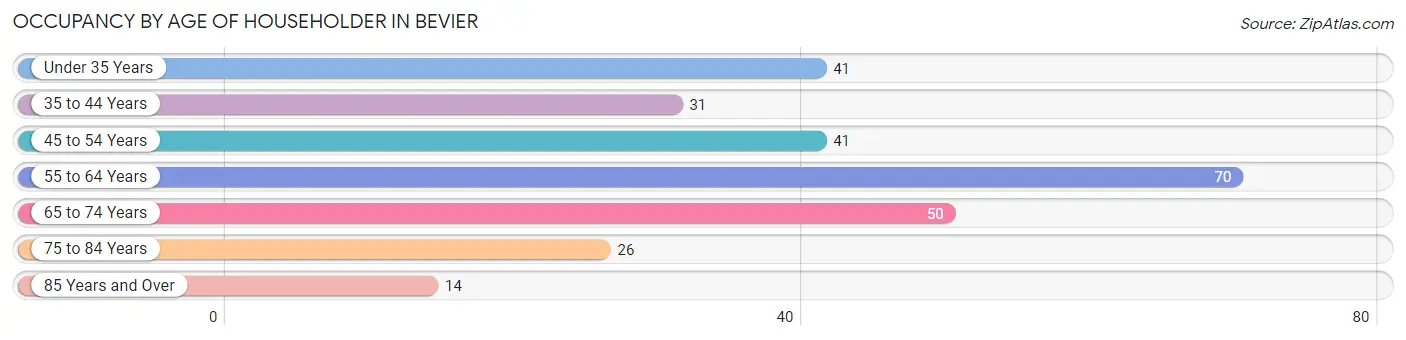
| Age Bracket | # Households | % Households |
| Under 35 Years | 41 | 15.0% |
| 35 to 44 Years | 31 | 11.4% |
| 45 to 54 Years | 41 | 15.0% |
| 55 to 64 Years | 70 | 25.6% |
| 65 to 74 Years | 50 | 18.3% |
| 75 to 84 Years | 26 | 9.5% |
| 85 Years and Over | 14 | 5.1% |
| Total | 273 | 100.0% |
Housing Finances in Bevier
Median Income by Occupancy in Bevier
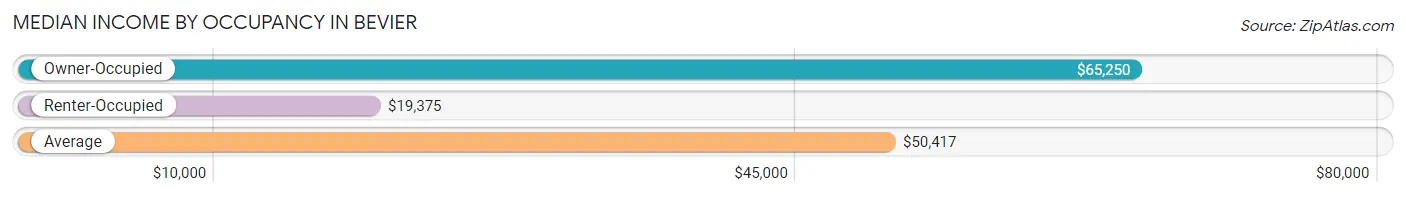
| Occupancy Type | # Households | Median Income |
| Owner-Occupied | 223 (81.7%) | $65,250 |
| Renter-Occupied | 50 (18.3%) | $19,375 |
| Average | 273 (100.0%) | $50,417 |
Occupancy by Householder Income Bracket in Bevier
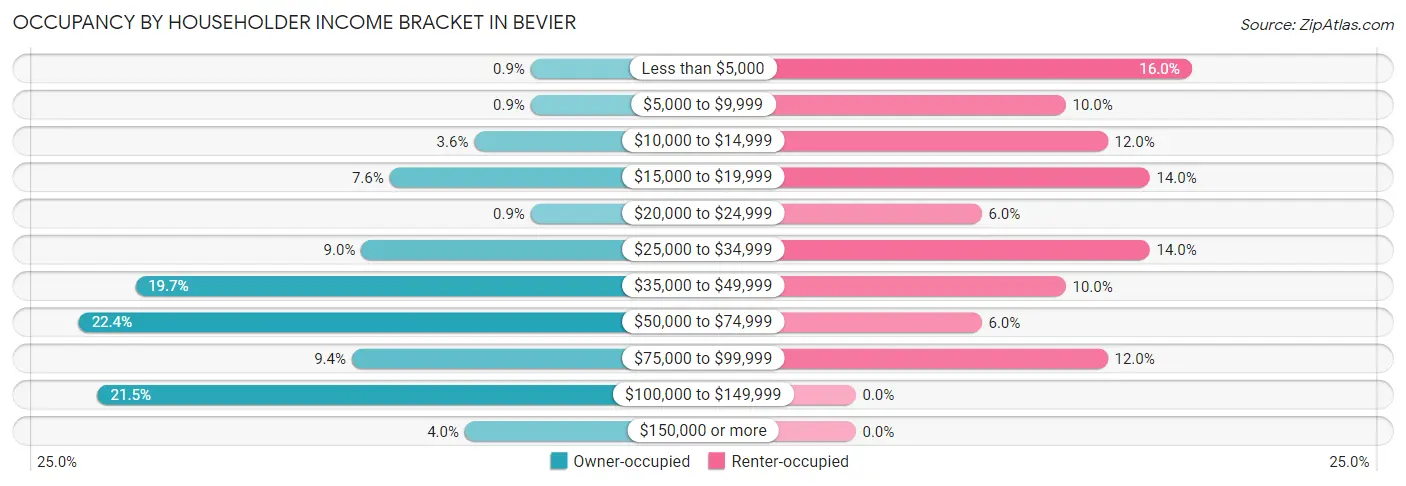
| Income Bracket | Owner-occupied | Renter-occupied |
| Less than $5,000 | 2 (0.9%) | 8 (16.0%) |
| $5,000 to $9,999 | 2 (0.9%) | 5 (10.0%) |
| $10,000 to $14,999 | 8 (3.6%) | 6 (12.0%) |
| $15,000 to $19,999 | 17 (7.6%) | 7 (14.0%) |
| $20,000 to $24,999 | 2 (0.9%) | 3 (6.0%) |
| $25,000 to $34,999 | 20 (9.0%) | 7 (14.0%) |
| $35,000 to $49,999 | 44 (19.7%) | 5 (10.0%) |
| $50,000 to $74,999 | 50 (22.4%) | 3 (6.0%) |
| $75,000 to $99,999 | 21 (9.4%) | 6 (12.0%) |
| $100,000 to $149,999 | 48 (21.5%) | 0 (0.0%) |
| $150,000 or more | 9 (4.0%) | 0 (0.0%) |
| Total | 223 (100.0%) | 50 (100.0%) |
Monthly Housing Cost Tiers in Bevier
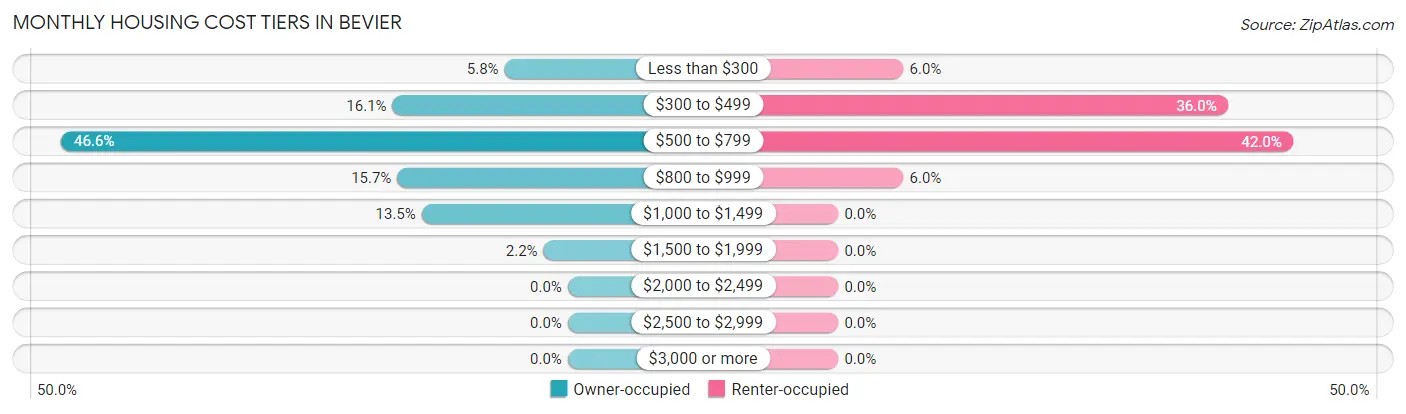
| Monthly Cost | Owner-occupied | Renter-occupied |
| Less than $300 | 13 (5.8%) | 3 (6.0%) |
| $300 to $499 | 36 (16.1%) | 18 (36.0%) |
| $500 to $799 | 104 (46.6%) | 21 (42.0%) |
| $800 to $999 | 35 (15.7%) | 3 (6.0%) |
| $1,000 to $1,499 | 30 (13.5%) | 0 (0.0%) |
| $1,500 to $1,999 | 5 (2.2%) | 0 (0.0%) |
| $2,000 to $2,499 | 0 (0.0%) | 0 (0.0%) |
| $2,500 to $2,999 | 0 (0.0%) | 0 (0.0%) |
| $3,000 or more | 0 (0.0%) | 0 (0.0%) |
| Total | 223 (100.0%) | 50 (100.0%) |
Physical Housing Characteristics in Bevier
Housing Structures in Bevier
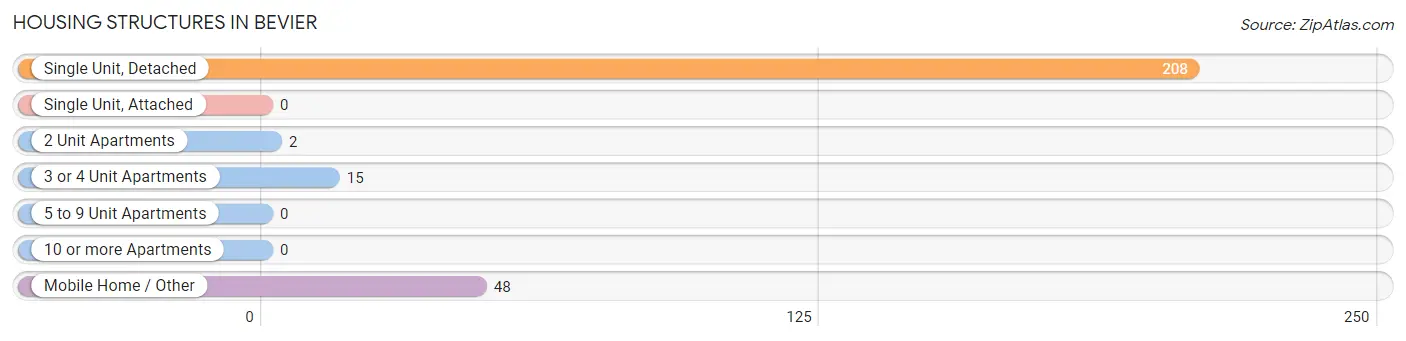
| Structure Type | # Housing Units | % Housing Units |
| Single Unit, Detached | 208 | 76.2% |
| Single Unit, Attached | 0 | 0.0% |
| 2 Unit Apartments | 2 | 0.7% |
| 3 or 4 Unit Apartments | 15 | 5.5% |
| 5 to 9 Unit Apartments | 0 | 0.0% |
| 10 or more Apartments | 0 | 0.0% |
| Mobile Home / Other | 48 | 17.6% |
| Total | 273 | 100.0% |
Housing Structures by Occupancy in Bevier
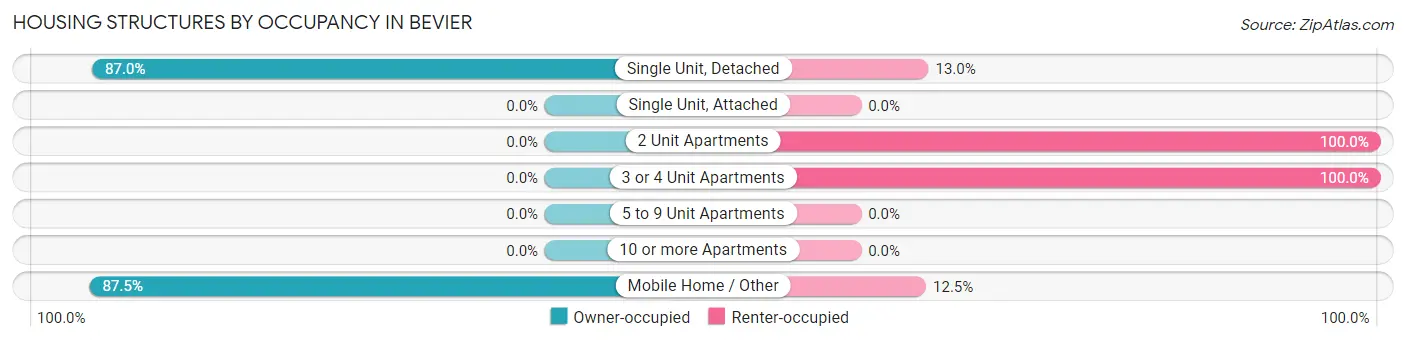
| Structure Type | Owner-occupied | Renter-occupied |
| Single Unit, Detached | 181 (87.0%) | 27 (13.0%) |
| Single Unit, Attached | 0 (0.0%) | 0 (0.0%) |
| 2 Unit Apartments | 0 (0.0%) | 2 (100.0%) |
| 3 or 4 Unit Apartments | 0 (0.0%) | 15 (100.0%) |
| 5 to 9 Unit Apartments | 0 (0.0%) | 0 (0.0%) |
| 10 or more Apartments | 0 (0.0%) | 0 (0.0%) |
| Mobile Home / Other | 42 (87.5%) | 6 (12.5%) |
| Total | 223 (81.7%) | 50 (18.3%) |
Housing Structures by Number of Rooms in Bevier
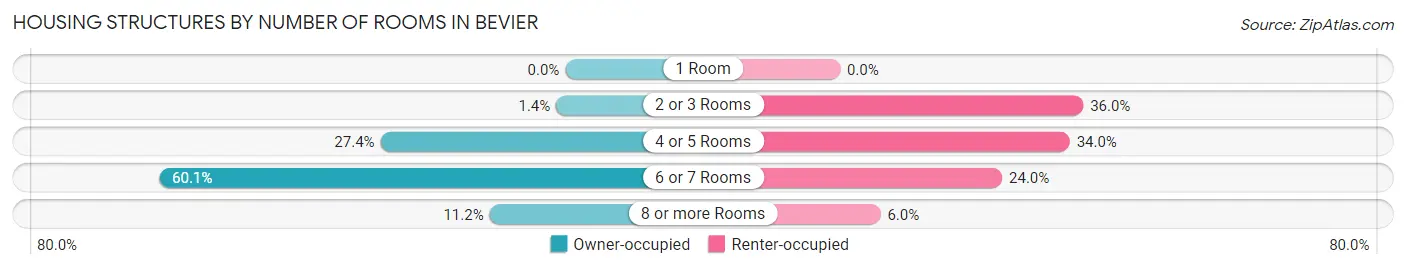
| Number of Rooms | Owner-occupied | Renter-occupied |
| 1 Room | 0 (0.0%) | 0 (0.0%) |
| 2 or 3 Rooms | 3 (1.3%) | 18 (36.0%) |
| 4 or 5 Rooms | 61 (27.4%) | 17 (34.0%) |
| 6 or 7 Rooms | 134 (60.1%) | 12 (24.0%) |
| 8 or more Rooms | 25 (11.2%) | 3 (6.0%) |
| Total | 223 (100.0%) | 50 (100.0%) |
Housing Structure by Heating Type in Bevier
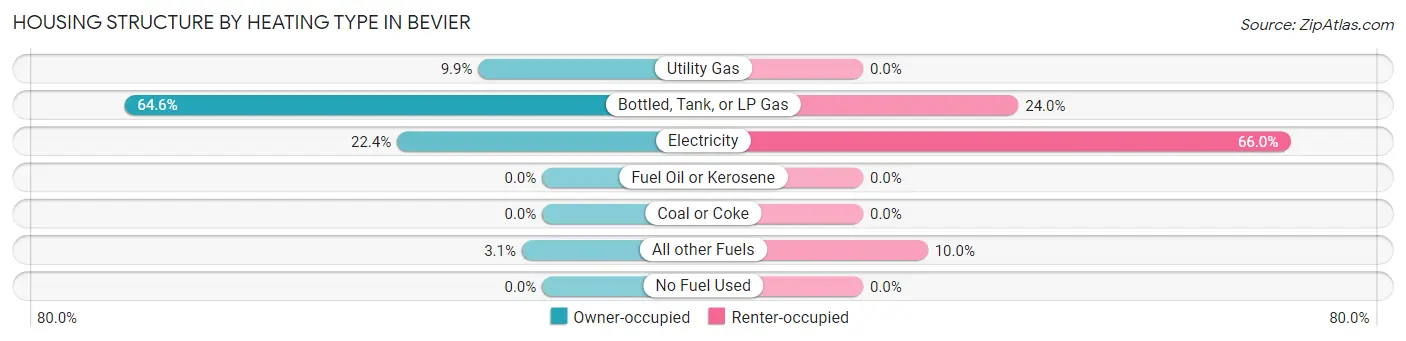
| Heating Type | Owner-occupied | Renter-occupied |
| Utility Gas | 22 (9.9%) | 0 (0.0%) |
| Bottled, Tank, or LP Gas | 144 (64.6%) | 12 (24.0%) |
| Electricity | 50 (22.4%) | 33 (66.0%) |
| Fuel Oil or Kerosene | 0 (0.0%) | 0 (0.0%) |
| Coal or Coke | 0 (0.0%) | 0 (0.0%) |
| All other Fuels | 7 (3.1%) | 5 (10.0%) |
| No Fuel Used | 0 (0.0%) | 0 (0.0%) |
| Total | 223 (100.0%) | 50 (100.0%) |
Household Vehicle Usage in Bevier
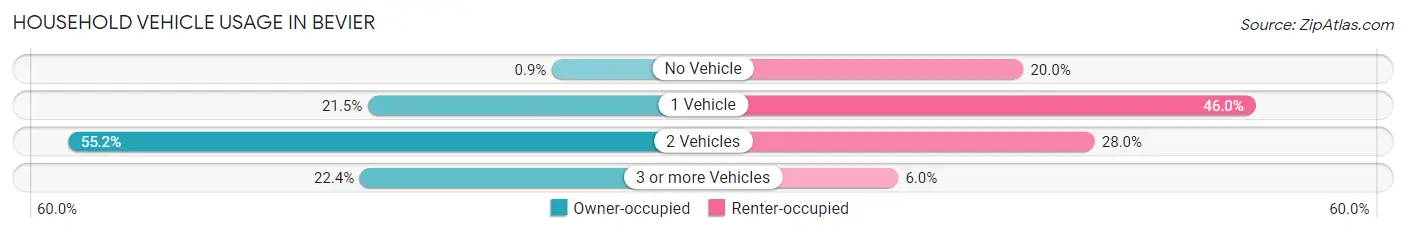
| Vehicles per Household | Owner-occupied | Renter-occupied |
| No Vehicle | 2 (0.9%) | 10 (20.0%) |
| 1 Vehicle | 48 (21.5%) | 23 (46.0%) |
| 2 Vehicles | 123 (55.2%) | 14 (28.0%) |
| 3 or more Vehicles | 50 (22.4%) | 3 (6.0%) |
| Total | 223 (100.0%) | 50 (100.0%) |
Real Estate & Mortgages in Bevier
Real Estate and Mortgage Overview in Bevier
| Characteristic | Without Mortgage | With Mortgage |
| Housing Units | 114 | 109 |
| Median Property Value | $108,300 | $85,000 |
| Median Household Income | $68,750 | $2 |
| Monthly Housing Costs | $561 | $0 |
| Real Estate Taxes | $800 | $9 |
Property Value by Mortgage Status in Bevier
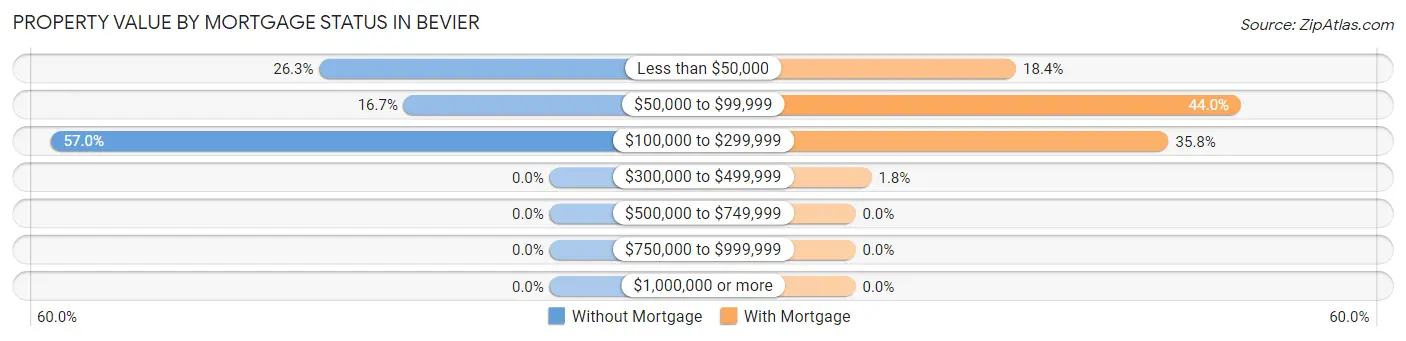
| Property Value | Without Mortgage | With Mortgage |
| Less than $50,000 | 30 (26.3%) | 20 (18.3%) |
| $50,000 to $99,999 | 19 (16.7%) | 48 (44.0%) |
| $100,000 to $299,999 | 65 (57.0%) | 39 (35.8%) |
| $300,000 to $499,999 | 0 (0.0%) | 2 (1.8%) |
| $500,000 to $749,999 | 0 (0.0%) | 0 (0.0%) |
| $750,000 to $999,999 | 0 (0.0%) | 0 (0.0%) |
| $1,000,000 or more | 0 (0.0%) | 0 (0.0%) |
| Total | 114 (100.0%) | 109 (100.0%) |
Household Income by Mortgage Status in Bevier
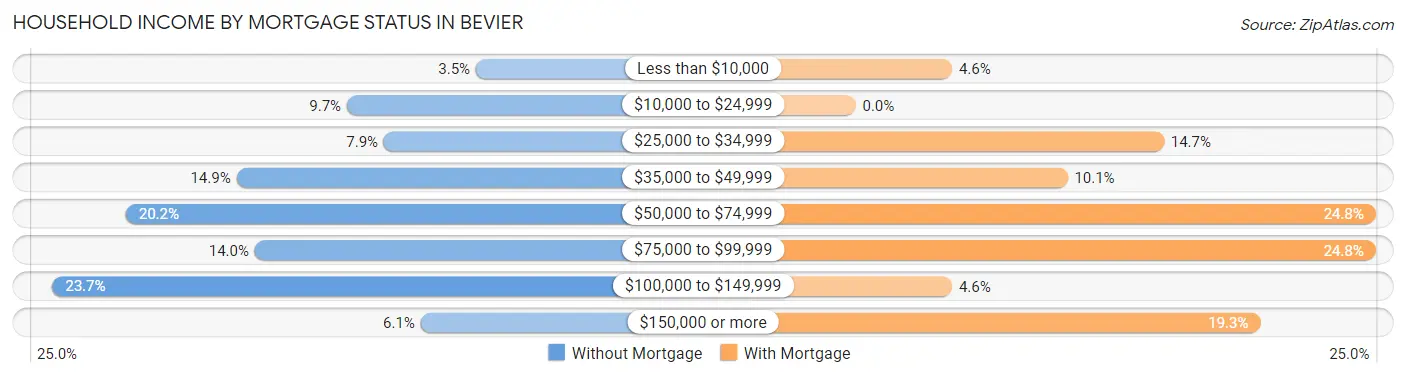
| Household Income | Without Mortgage | With Mortgage |
| Less than $10,000 | 4 (3.5%) | 5 (4.6%) |
| $10,000 to $24,999 | 11 (9.7%) | 0 (0.0%) |
| $25,000 to $34,999 | 9 (7.9%) | 16 (14.7%) |
| $35,000 to $49,999 | 17 (14.9%) | 11 (10.1%) |
| $50,000 to $74,999 | 23 (20.2%) | 27 (24.8%) |
| $75,000 to $99,999 | 16 (14.0%) | 27 (24.8%) |
| $100,000 to $149,999 | 27 (23.7%) | 5 (4.6%) |
| $150,000 or more | 7 (6.1%) | 21 (19.3%) |
| Total | 114 (100.0%) | 109 (100.0%) |
Property Value to Household Income Ratio in Bevier
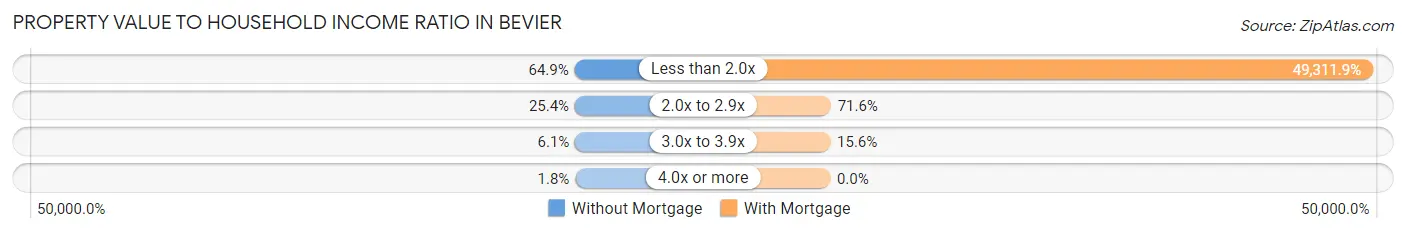
| Value-to-Income Ratio | Without Mortgage | With Mortgage |
| Less than 2.0x | 74 (64.9%) | 53,750 (49,311.9%) |
| 2.0x to 2.9x | 29 (25.4%) | 78 (71.6%) |
| 3.0x to 3.9x | 7 (6.1%) | 17 (15.6%) |
| 4.0x or more | 2 (1.8%) | 0 (0.0%) |
| Total | 114 (100.0%) | 109 (100.0%) |
Real Estate Taxes by Mortgage Status in Bevier
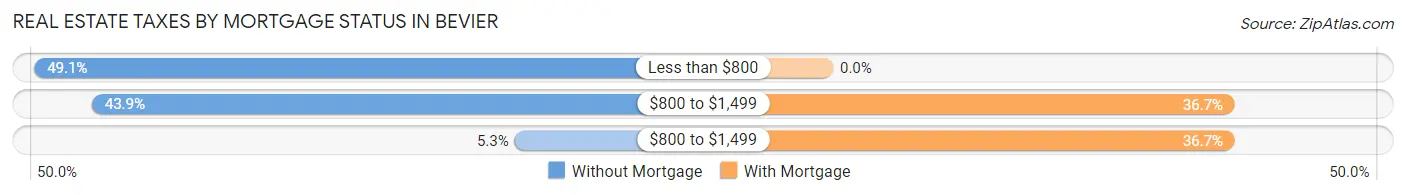
| Property Taxes | Without Mortgage | With Mortgage |
| Less than $800 | 56 (49.1%) | 0 (0.0%) |
| $800 to $1,499 | 50 (43.9%) | 40 (36.7%) |
| $800 to $1,499 | 6 (5.3%) | 40 (36.7%) |
| Total | 114 (100.0%) | 109 (100.0%) |
Health & Disability in Bevier
Health Insurance Coverage by Age in Bevier
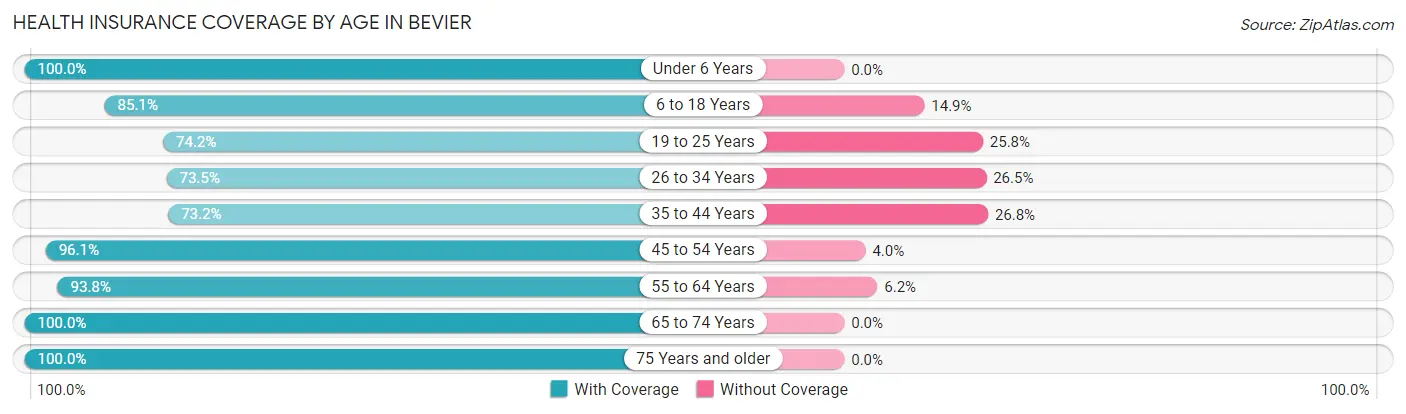
| Age Bracket | With Coverage | Without Coverage |
| Under 6 Years | 35 (100.0%) | 0 (0.0%) |
| 6 to 18 Years | 57 (85.1%) | 10 (14.9%) |
| 19 to 25 Years | 66 (74.2%) | 23 (25.8%) |
| 26 to 34 Years | 25 (73.5%) | 9 (26.5%) |
| 35 to 44 Years | 41 (73.2%) | 15 (26.8%) |
| 45 to 54 Years | 73 (96.1%) | 3 (4.0%) |
| 55 to 64 Years | 137 (93.8%) | 9 (6.2%) |
| 65 to 74 Years | 66 (100.0%) | 0 (0.0%) |
| 75 Years and older | 64 (100.0%) | 0 (0.0%) |
| Total | 564 (89.1%) | 69 (10.9%) |
Health Insurance Coverage by Citizenship Status in Bevier
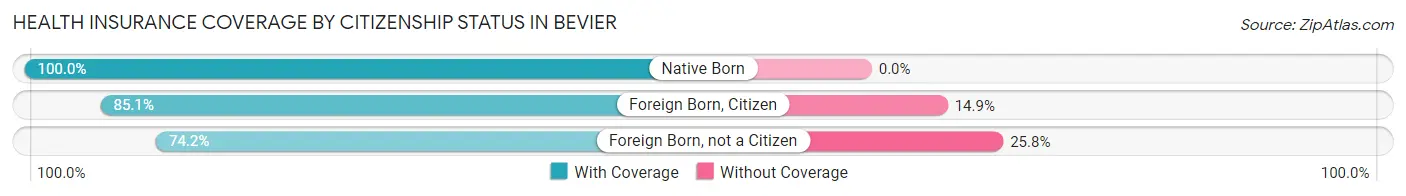
| Citizenship Status | With Coverage | Without Coverage |
| Native Born | 35 (100.0%) | 0 (0.0%) |
| Foreign Born, Citizen | 57 (85.1%) | 10 (14.9%) |
| Foreign Born, not a Citizen | 66 (74.2%) | 23 (25.8%) |
Health Insurance Coverage by Household Income in Bevier
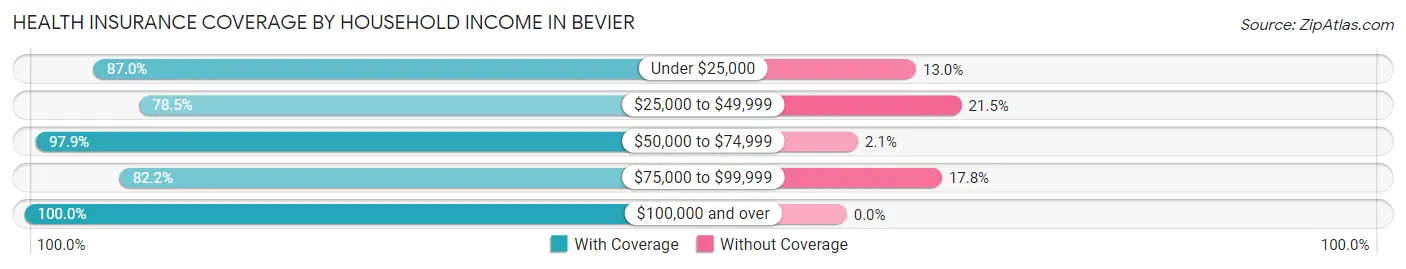
| Household Income | With Coverage | Without Coverage |
| Under $25,000 | 67 (87.0%) | 10 (13.0%) |
| $25,000 to $49,999 | 124 (78.5%) | 34 (21.5%) |
| $50,000 to $74,999 | 92 (97.9%) | 2 (2.1%) |
| $75,000 to $99,999 | 106 (82.2%) | 23 (17.8%) |
| $100,000 and over | 175 (100.0%) | 0 (0.0%) |
Public vs Private Health Insurance Coverage by Age in Bevier
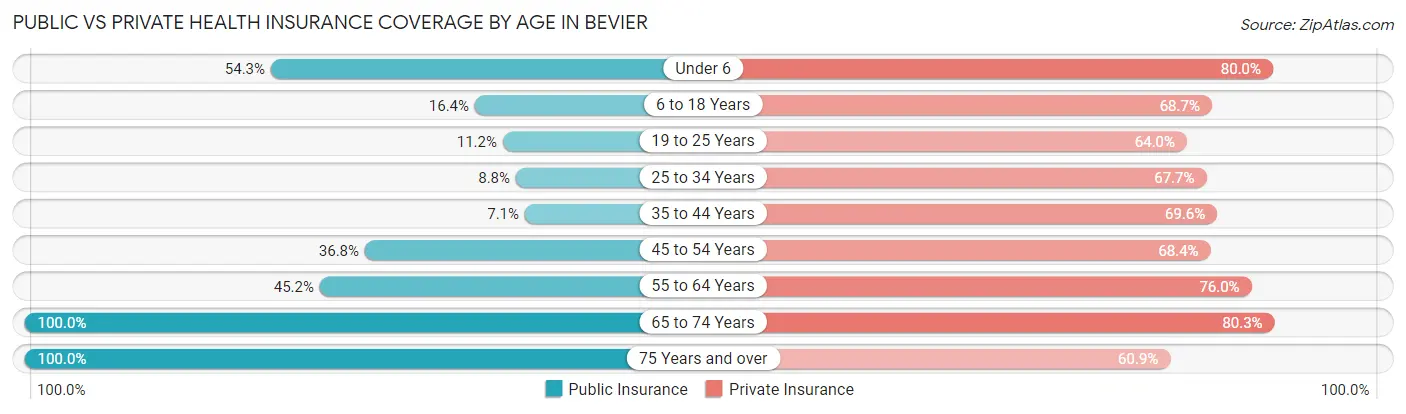
| Age Bracket | Public Insurance | Private Insurance |
| Under 6 | 19 (54.3%) | 28 (80.0%) |
| 6 to 18 Years | 11 (16.4%) | 46 (68.7%) |
| 19 to 25 Years | 10 (11.2%) | 57 (64.0%) |
| 25 to 34 Years | 3 (8.8%) | 23 (67.6%) |
| 35 to 44 Years | 4 (7.1%) | 39 (69.6%) |
| 45 to 54 Years | 28 (36.8%) | 52 (68.4%) |
| 55 to 64 Years | 66 (45.2%) | 111 (76.0%) |
| 65 to 74 Years | 66 (100.0%) | 53 (80.3%) |
| 75 Years and over | 64 (100.0%) | 39 (60.9%) |
| Total | 271 (42.8%) | 448 (70.8%) |
Disability Status by Sex by Age in Bevier
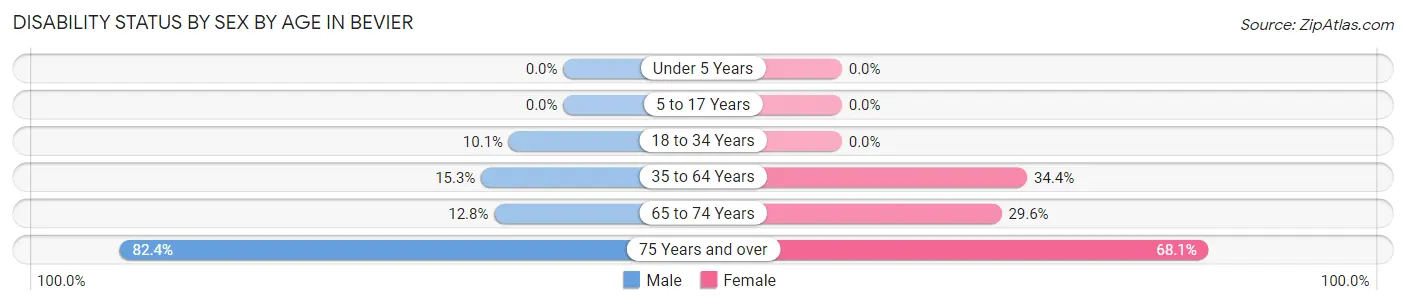
| Age Bracket | Male | Female |
| Under 5 Years | 0 (0.0%) | 0 (0.0%) |
| 5 to 17 Years | 0 (0.0%) | 0 (0.0%) |
| 18 to 34 Years | 9 (10.1%) | 0 (0.0%) |
| 35 to 64 Years | 18 (15.2%) | 55 (34.4%) |
| 65 to 74 Years | 5 (12.8%) | 8 (29.6%) |
| 75 Years and over | 14 (82.4%) | 32 (68.1%) |
Disability Class by Sex by Age in Bevier
Disability Class: Hearing Difficulty
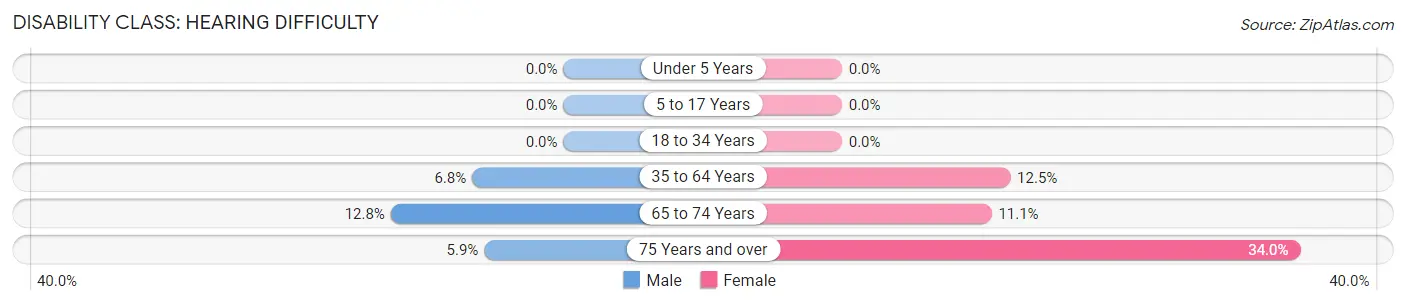
| Age Bracket | Male | Female |
| Under 5 Years | 0 (0.0%) | 0 (0.0%) |
| 5 to 17 Years | 0 (0.0%) | 0 (0.0%) |
| 18 to 34 Years | 0 (0.0%) | 0 (0.0%) |
| 35 to 64 Years | 8 (6.8%) | 20 (12.5%) |
| 65 to 74 Years | 5 (12.8%) | 3 (11.1%) |
| 75 Years and over | 1 (5.9%) | 16 (34.0%) |
Disability Class: Vision Difficulty
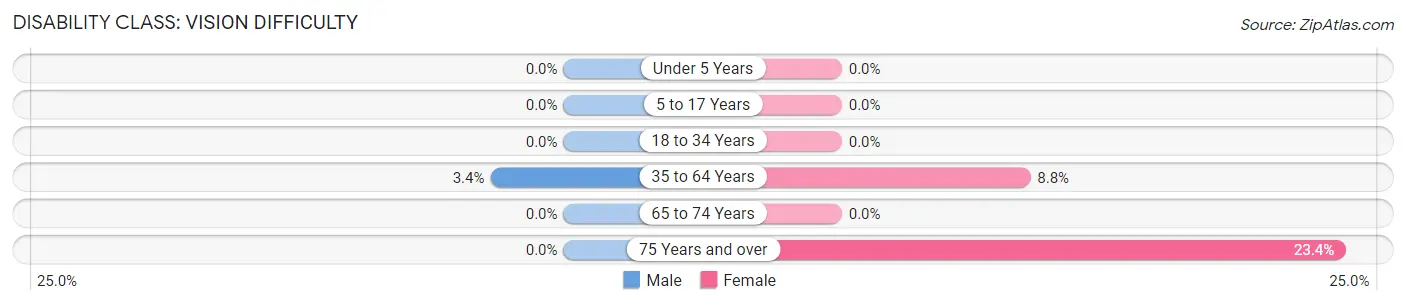
| Age Bracket | Male | Female |
| Under 5 Years | 0 (0.0%) | 0 (0.0%) |
| 5 to 17 Years | 0 (0.0%) | 0 (0.0%) |
| 18 to 34 Years | 0 (0.0%) | 0 (0.0%) |
| 35 to 64 Years | 4 (3.4%) | 14 (8.7%) |
| 65 to 74 Years | 0 (0.0%) | 0 (0.0%) |
| 75 Years and over | 0 (0.0%) | 11 (23.4%) |
Disability Class: Cognitive Difficulty
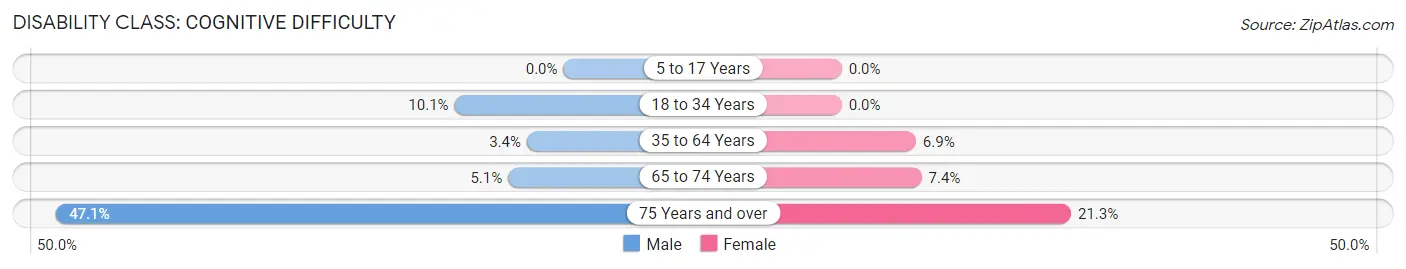
| Age Bracket | Male | Female |
| 5 to 17 Years | 0 (0.0%) | 0 (0.0%) |
| 18 to 34 Years | 9 (10.1%) | 0 (0.0%) |
| 35 to 64 Years | 4 (3.4%) | 11 (6.9%) |
| 65 to 74 Years | 2 (5.1%) | 2 (7.4%) |
| 75 Years and over | 8 (47.1%) | 10 (21.3%) |
Disability Class: Ambulatory Difficulty
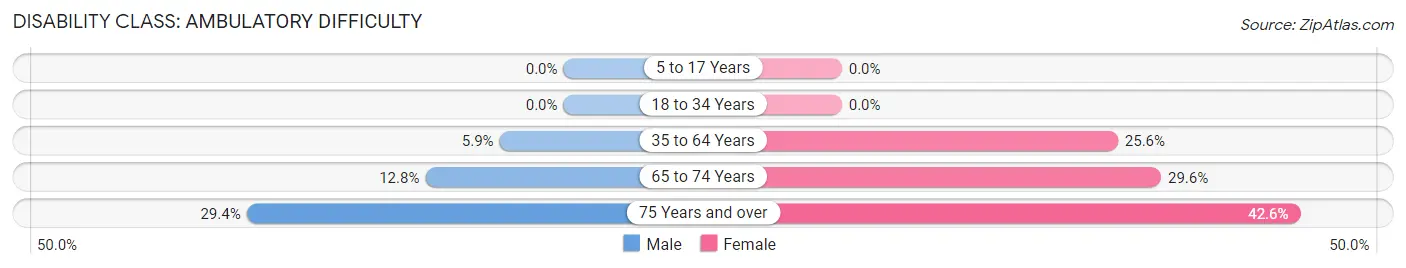
| Age Bracket | Male | Female |
| 5 to 17 Years | 0 (0.0%) | 0 (0.0%) |
| 18 to 34 Years | 0 (0.0%) | 0 (0.0%) |
| 35 to 64 Years | 7 (5.9%) | 41 (25.6%) |
| 65 to 74 Years | 5 (12.8%) | 8 (29.6%) |
| 75 Years and over | 5 (29.4%) | 20 (42.5%) |
Disability Class: Self-Care Difficulty
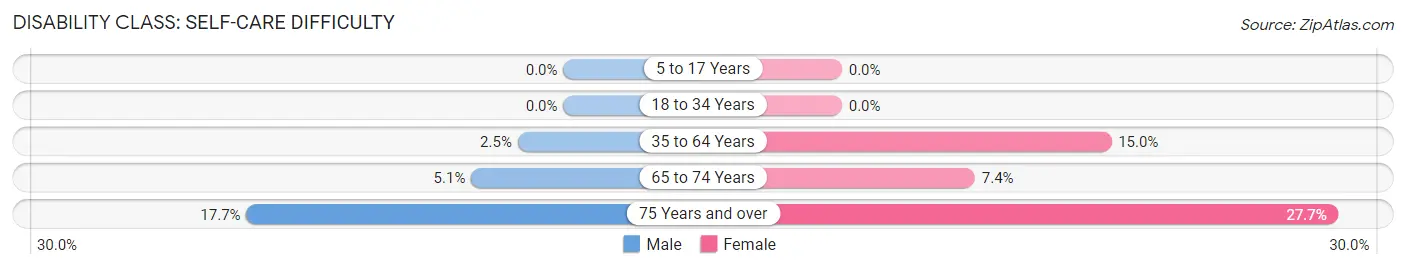
| Age Bracket | Male | Female |
| 5 to 17 Years | 0 (0.0%) | 0 (0.0%) |
| 18 to 34 Years | 0 (0.0%) | 0 (0.0%) |
| 35 to 64 Years | 3 (2.5%) | 24 (15.0%) |
| 65 to 74 Years | 2 (5.1%) | 2 (7.4%) |
| 75 Years and over | 3 (17.6%) | 13 (27.7%) |
Technology Access in Bevier
Computing Device Access in Bevier
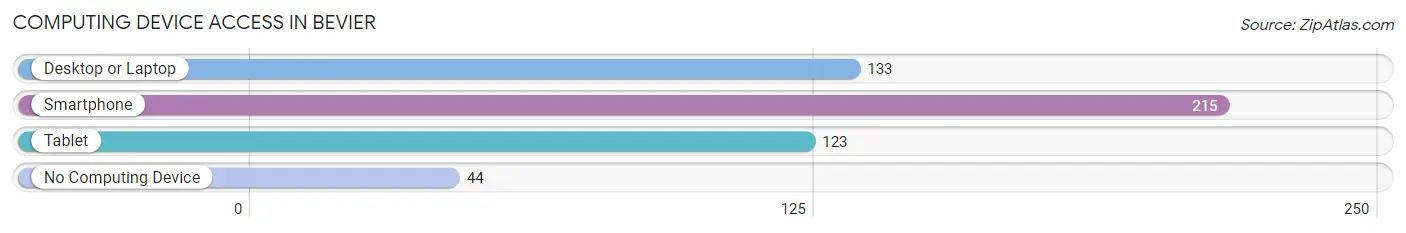
| Device Type | # Households | % Households |
| Desktop or Laptop | 133 | 48.7% |
| Smartphone | 215 | 78.7% |
| Tablet | 123 | 45.1% |
| No Computing Device | 44 | 16.1% |
| Total | 273 | 100.0% |
Internet Access in Bevier
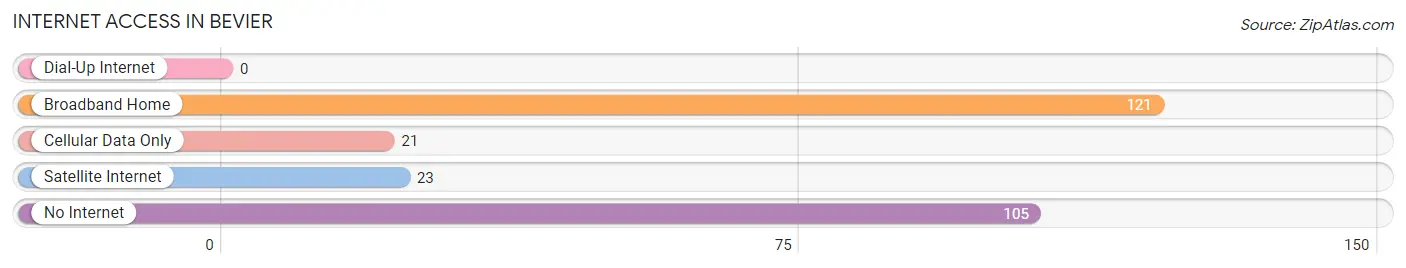
| Internet Type | # Households | % Households |
| Dial-Up Internet | 0 | 0.0% |
| Broadband Home | 121 | 44.3% |
| Cellular Data Only | 21 | 7.7% |
| Satellite Internet | 23 | 8.4% |
| No Internet | 105 | 38.5% |
| Total | 273 | 100.0% |
Bevier Summary
Bevier is a small city located in Macon County, Missouri. It is situated in the north-central part of the state, about 40 miles northeast of Columbia. The city has a population of approximately 1,000 people and is part of the Kirksville Micropolitan Statistical Area.
History
Bevier was founded in 1871 by William Bevier, a local farmer. He named the town after his father, who had served in the War of 1812. The town was incorporated in 1876 and quickly grew to become a thriving agricultural center. The town was home to several businesses, including a flour mill, a sawmill, a blacksmith shop, and a general store.
In the early 1900s, Bevier experienced a period of growth and prosperity. The town was home to several churches, a bank, a hotel, and a movie theater. The town also had a thriving agricultural industry, with many farmers growing corn, wheat, and other crops.
In the 1950s, Bevier began to decline. The town's population decreased as people moved away in search of better economic opportunities. The decline continued until the late 1990s, when the town began to experience a resurgence.
Geography
Bevier is located in north-central Missouri, about 40 miles northeast of Columbia. The city is situated in the rolling hills of Macon County, with the Chariton River running through the town. The city has a total area of 1.2 square miles, all of which is land.
The climate in Bevier is typical of the Midwest, with hot, humid summers and cold, snowy winters. The average annual temperature is around 50 degrees Fahrenheit, with average highs in the summer reaching into the mid-80s and lows in the winter dipping into the mid-teens.
Economy
The economy of Bevier is largely based on agriculture. The town is home to several farms, which grow corn, wheat, soybeans, and other crops. The town also has a few small businesses, including a grocery store, a hardware store, and a few restaurants.
The town is also home to a few manufacturing companies, including a furniture factory and a plastics factory. These companies provide jobs for many of the town's residents.
Demographics
As of the 2010 census, Bevier had a population of 1,000 people. The racial makeup of the town was 97.2% White, 0.7% African American, 0.2% Native American, 0.2% Asian, 0.2% from other races, and 1.7% from two or more races. Hispanic or Latino of any race were 0.7% of the population.
The median household income in Bevier was $37,500, and the median family income was $45,000. The per capita income was $18,000. About 11.2% of families and 14.2% of the population were below the poverty line, including 18.2% of those under age 18 and 8.2% of those age 65 or over.
Common Questions
What is Per Capita Income in Bevier?
Per Capita income in Bevier is $33,189.
What is the Median Family Income in Bevier?
Median Family Income in Bevier is $71,806.
What is the Median Household income in Bevier?
Median Household Income in Bevier is $50,417.
What is Income or Wage Gap in Bevier?
Income or Wage Gap in Bevier is 37.8%.
Women in Bevier earn 62.2 cents for every dollar earned by a man.
What is Inequality or Gini Index in Bevier?
Inequality or Gini Index in Bevier is 0.46.
What is the Total Population of Bevier?
Total Population of Bevier is 633.
What is the Total Male Population of Bevier?
Total Male Population of Bevier is 309.
What is the Total Female Population of Bevier?
Total Female Population of Bevier is 324.
What is the Ratio of Males per 100 Females in Bevier?
There are 95.37 Males per 100 Females in Bevier.
What is the Ratio of Females per 100 Males in Bevier?
There are 104.85 Females per 100 Males in Bevier.
What is the Median Population Age in Bevier?
Median Population Age in Bevier is 51.7 Years.
What is the Average Family Size in Bevier
Average Family Size in Bevier is 3.3 People.
What is the Average Household Size in Bevier
Average Household Size in Bevier is 2.3 People.
How Large is the Labor Force in Bevier?
There are 301 People in the Labor Forcein in Bevier.
What is the Percentage of People in the Labor Force in Bevier?
54.4% of People are in the Labor Force in Bevier.
What is the Unemployment Rate in Bevier?
Unemployment Rate in Bevier is 6.0%.