Ashland, MO Map & Demographics
Ashland Map
Ashland Overview
$41,216
PER CAPITA INCOME
$97,065
AVG FAMILY INCOME
$87,377
AVG HOUSEHOLD INCOME
31.7%
WAGE / INCOME GAP [ % ]
68.3¢/ $1
WAGE / INCOME GAP [ $ ]
0.32
INEQUALITY / GINI INDEX
4,730
TOTAL POPULATION
1,999
MALE POPULATION
2,731
FEMALE POPULATION
73.20
MALES / 100 FEMALES
136.62
FEMALES / 100 MALES
41.0
MEDIAN AGE
2.8
AVG FAMILY SIZE
2.2
AVG HOUSEHOLD SIZE
2,849
LABOR FORCE [ PEOPLE ]
73.0%
PERCENT IN LABOR FORCE
0.7%
UNEMPLOYMENT RATE
Ashland Zip Codes
Ashland Area Codes
Income in Ashland
Income Overview in Ashland
Per Capita Income in Ashland is $41,216, while median incomes of families and households are $97,065 and $87,377 respectively.
| Characteristic | Number | Measure |
| Per Capita Income | 4,730 | $41,216 |
| Median Family Income | 1,329 | $97,065 |
| Mean Family Income | 1,329 | $112,837 |
| Median Household Income | 2,101 | $87,377 |
| Mean Household Income | 2,101 | $92,055 |
| Income Deficit | 1,329 | $0 |
| Wage / Income Gap (%) | 4,730 | 31.67% |
| Wage / Income Gap ($) | 4,730 | 68.33¢ per $1 |
| Gini / Inequality Index | 4,730 | 0.32 |
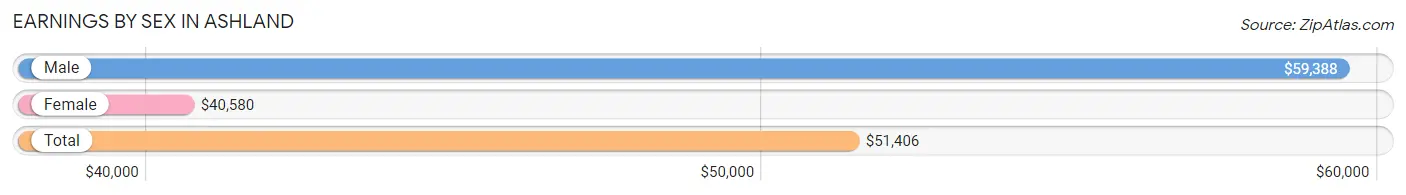
Earnings by Sex in Ashland
Average Earnings in Ashland are $51,406, $59,388 for men and $40,580 for women, a difference of 31.7%.
| Sex | Number | Average Earnings |
| Male | 1,418 (48.3%) | $59,388 |
| Female | 1,518 (51.7%) | $40,580 |
| Total | 2,936 (100.0%) | $51,406 |
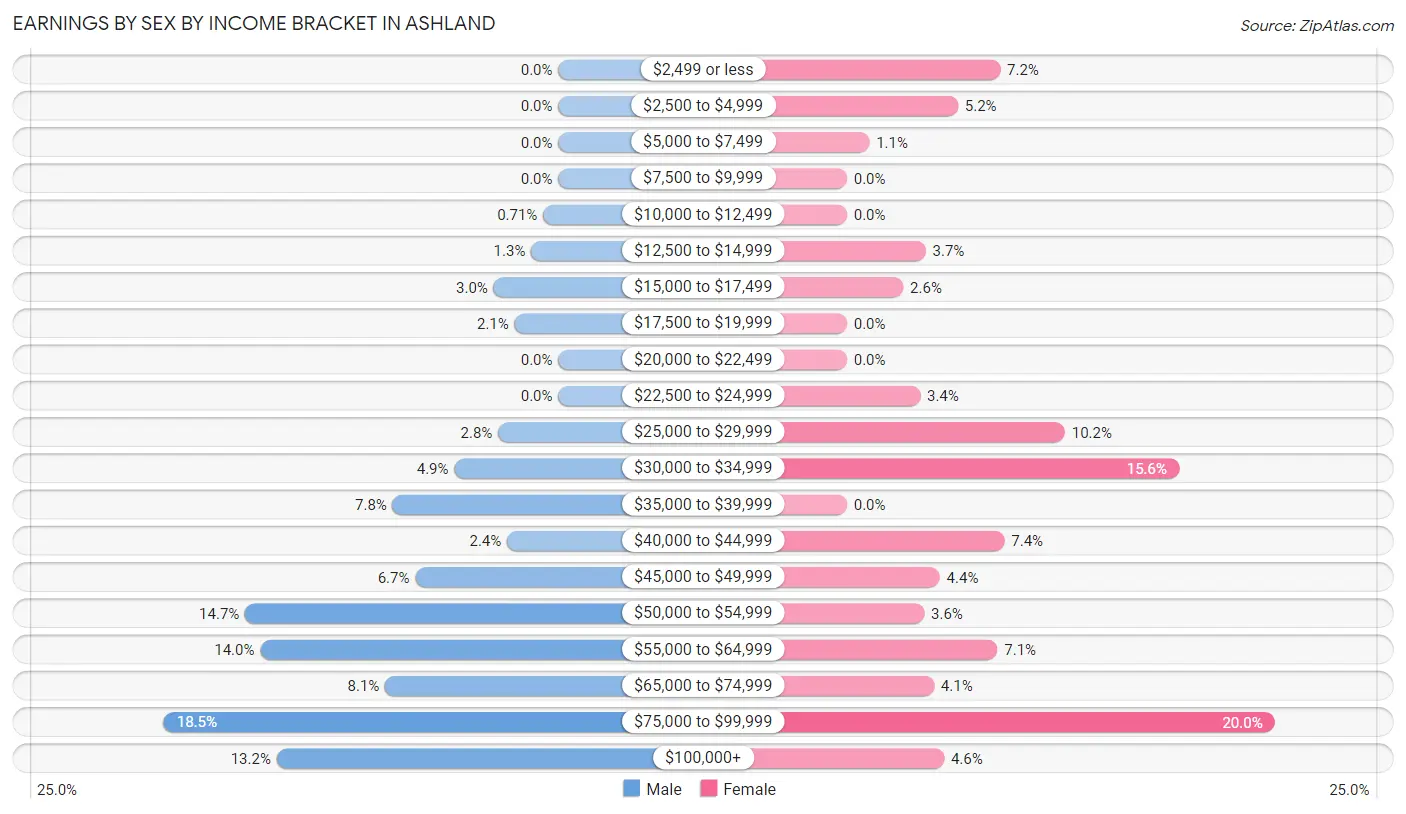
Earnings by Sex by Income Bracket in Ashland
The most common earnings brackets in Ashland are $75,000 to $99,999 for men (262 | 18.5%) and $75,000 to $99,999 for women (304 | 20.0%).
| Income | Male | Female |
| $2,499 or less | 0 (0.0%) | 109 (7.2%) |
| $2,500 to $4,999 | 0 (0.0%) | 79 (5.2%) |
| $5,000 to $7,499 | 0 (0.0%) | 16 (1.1%) |
| $7,500 to $9,999 | 0 (0.0%) | 0 (0.0%) |
| $10,000 to $12,499 | 10 (0.7%) | 0 (0.0%) |
| $12,500 to $14,999 | 18 (1.3%) | 56 (3.7%) |
| $15,000 to $17,499 | 43 (3.0%) | 40 (2.6%) |
| $17,500 to $19,999 | 29 (2.1%) | 0 (0.0%) |
| $20,000 to $22,499 | 0 (0.0%) | 0 (0.0%) |
| $22,500 to $24,999 | 0 (0.0%) | 52 (3.4%) |
| $25,000 to $29,999 | 40 (2.8%) | 155 (10.2%) |
| $30,000 to $34,999 | 69 (4.9%) | 236 (15.5%) |
| $35,000 to $39,999 | 110 (7.8%) | 0 (0.0%) |
| $40,000 to $44,999 | 34 (2.4%) | 112 (7.4%) |
| $45,000 to $49,999 | 95 (6.7%) | 66 (4.3%) |
| $50,000 to $54,999 | 208 (14.7%) | 55 (3.6%) |
| $55,000 to $64,999 | 198 (14.0%) | 107 (7.0%) |
| $65,000 to $74,999 | 115 (8.1%) | 62 (4.1%) |
| $75,000 to $99,999 | 262 (18.5%) | 304 (20.0%) |
| $100,000+ | 187 (13.2%) | 69 (4.5%) |
| Total | 1,418 (100.0%) | 1,518 (100.0%) |
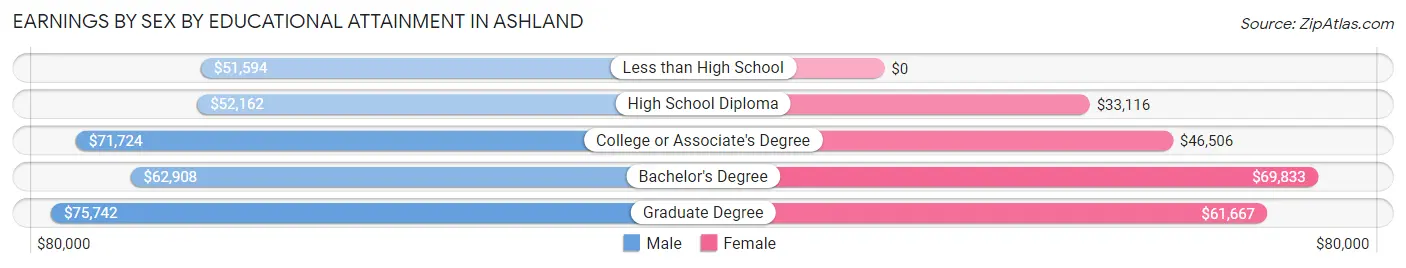
Earnings by Sex by Educational Attainment in Ashland
Average earnings in Ashland are $62,734 for men and $47,147 for women, a difference of 24.8%. Men with an educational attainment of graduate degree enjoy the highest average annual earnings of $75,742, while those with less than high school education earn the least with $51,594. Women with an educational attainment of bachelor's degree earn the most with the average annual earnings of $69,833, while those with high school diploma education have the smallest earnings of $33,116.
| Educational Attainment | Male Income | Female Income |
| Less than High School | $51,594 | $0 |
| High School Diploma | $52,162 | $33,116 |
| College or Associate's Degree | $71,724 | $46,506 |
| Bachelor's Degree | $62,908 | $69,833 |
| Graduate Degree | $75,742 | $61,667 |
| Total | $62,734 | $47,147 |
Family Income in Ashland
Family Income Brackets in Ashland
According to the Ashland family income data, there are 506 families falling into the $75,000 to $99,999 income range, which is the most common income bracket and makes up 38.1% of all families.
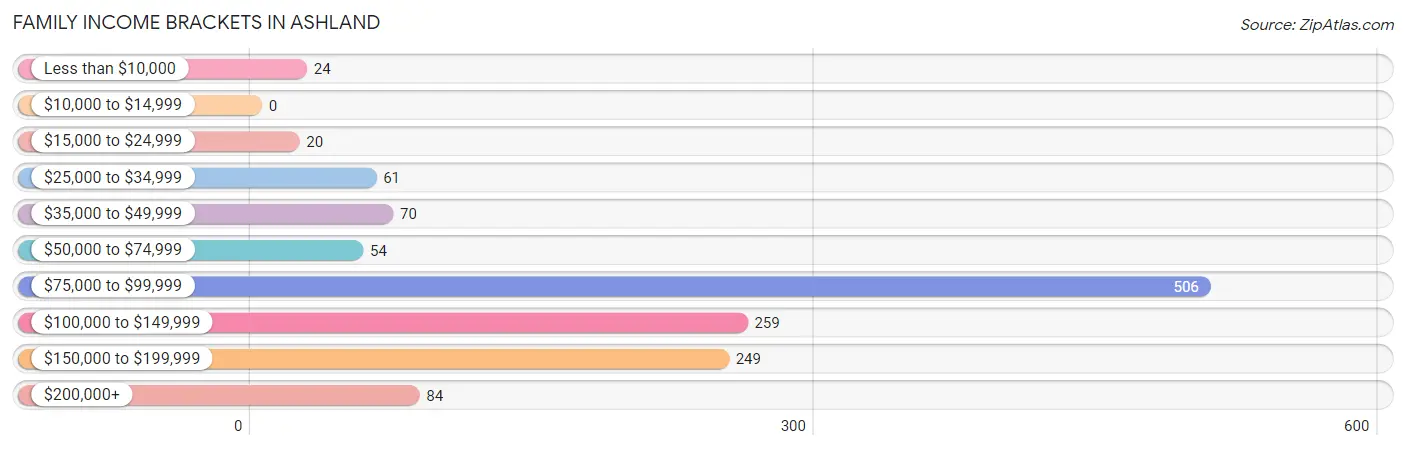
| Income Bracket | # Families | % Families |
| Less than $10,000 | 24 | 1.8% |
| $10,000 to $14,999 | 0 | 0.0% |
| $15,000 to $24,999 | 20 | 1.5% |
| $25,000 to $34,999 | 61 | 4.6% |
| $35,000 to $49,999 | 70 | 5.3% |
| $50,000 to $74,999 | 54 | 4.1% |
| $75,000 to $99,999 | 506 | 38.1% |
| $100,000 to $149,999 | 259 | 19.5% |
| $150,000 to $199,999 | 249 | 18.7% |
| $200,000+ | 84 | 6.3% |
Family Income by Famaliy Size in Ashland
4-person families (227 | 17.1%) account for the highest median family income in Ashland with $114,458 per family, while 2-person families (662 | 49.8%) have the highest median income of $44,000 per family member.
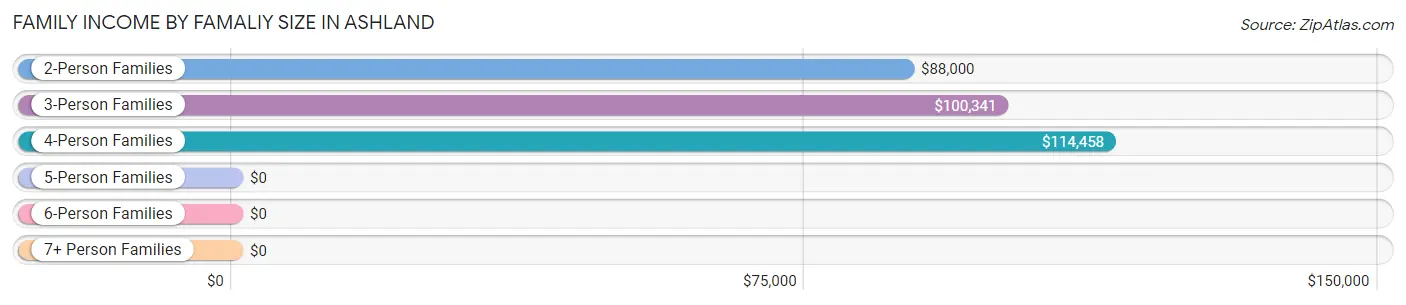
| Income Bracket | # Families | Median Income |
| 2-Person Families | 662 (49.8%) | $88,000 |
| 3-Person Families | 367 (27.6%) | $100,341 |
| 4-Person Families | 227 (17.1%) | $114,458 |
| 5-Person Families | 51 (3.8%) | $0 |
| 6-Person Families | 22 (1.7%) | $0 |
| 7+ Person Families | 0 (0.0%) | $0 |
| Total | 1,329 (100.0%) | $97,065 |
Family Income by Number of Earners in Ashland
The median family income in Ashland is $97,065, with families comprising 3+ earners (175) having the highest median family income of $137,813, while families with no earners (142) have the lowest median family income of $68,229, accounting for 13.2% and 10.7% of families, respectively.
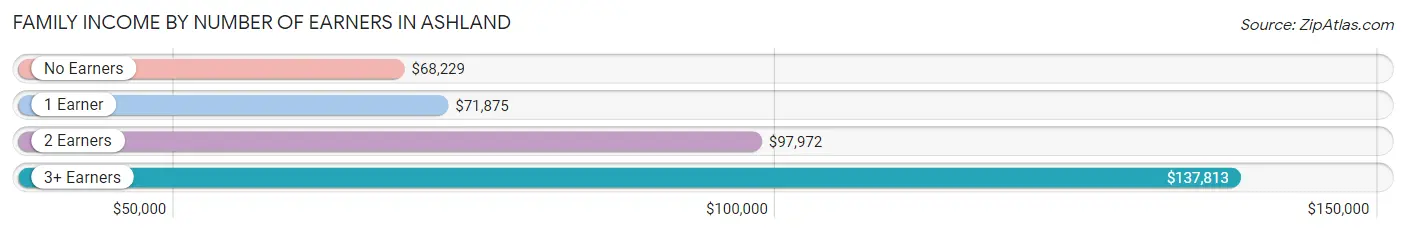
| Number of Earners | # Families | Median Income |
| No Earners | 142 (10.7%) | $68,229 |
| 1 Earner | 180 (13.5%) | $71,875 |
| 2 Earners | 832 (62.6%) | $97,972 |
| 3+ Earners | 175 (13.2%) | $137,813 |
| Total | 1,329 (100.0%) | $97,065 |
Household Income in Ashland
Household Income Brackets in Ashland
With 782 households falling in the category, the $75,000 to $99,999 income range is the most frequent in Ashland, accounting for 37.2% of all households.
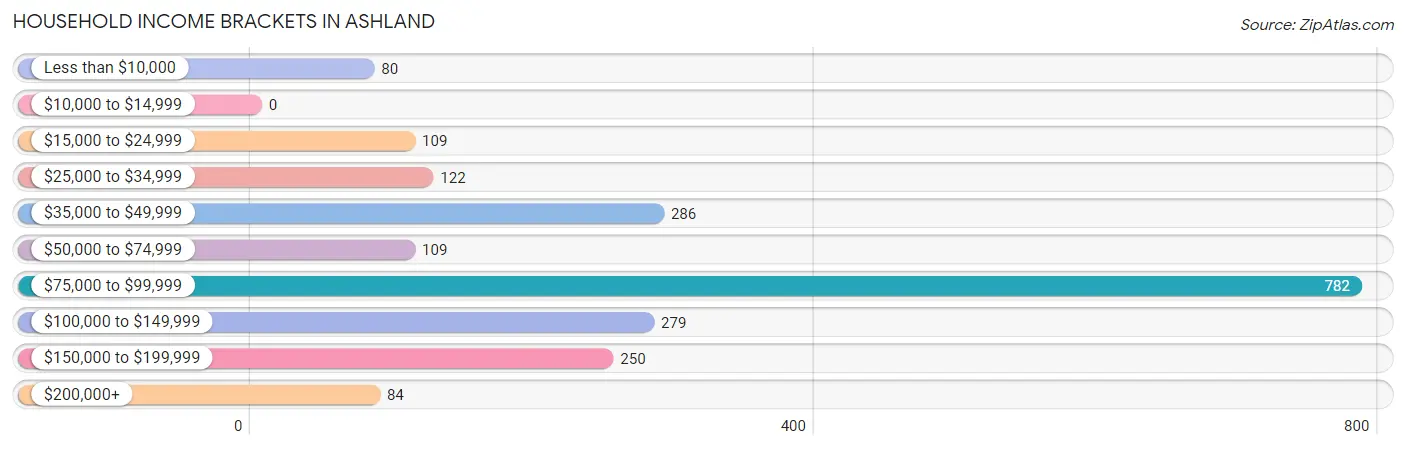
| Income Bracket | # Households | % Households |
| Less than $10,000 | 80 | 3.8% |
| $10,000 to $14,999 | 0 | 0.0% |
| $15,000 to $24,999 | 109 | 5.2% |
| $25,000 to $34,999 | 122 | 5.8% |
| $35,000 to $49,999 | 286 | 13.6% |
| $50,000 to $74,999 | 109 | 5.2% |
| $75,000 to $99,999 | 782 | 37.2% |
| $100,000 to $149,999 | 279 | 13.3% |
| $150,000 to $199,999 | 250 | 11.9% |
| $200,000+ | 84 | 4.0% |
Household Income by Householder Age in Ashland
The median household income in Ashland is $87,377, with the highest median household income of $91,814 found in the 25 to 44 years age bracket for the primary householder. A total of 812 households (38.7%) fall into this category. Meanwhile, the 15 to 24 years age bracket for the primary householder has the lowest median household income of $0, with 15 households (0.7%) in this group.
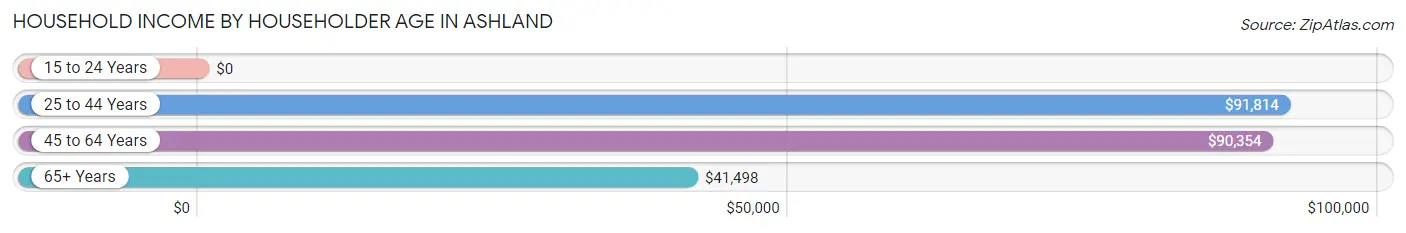
| Income Bracket | # Households | Median Income |
| 15 to 24 Years | 15 (0.7%) | $0 |
| 25 to 44 Years | 812 (38.7%) | $91,814 |
| 45 to 64 Years | 809 (38.5%) | $90,354 |
| 65+ Years | 465 (22.1%) | $41,498 |
| Total | 2,101 (100.0%) | $87,377 |
Poverty in Ashland
Income Below Poverty by Sex and Age in Ashland
With 1.3% poverty level for males and 5.1% for females among the residents of Ashland, 15 year old males and 12 to 14 year old females are the most vulnerable to poverty, with 17 males (56.7%) and 20 females (27.0%) in their respective age groups living below the poverty level.
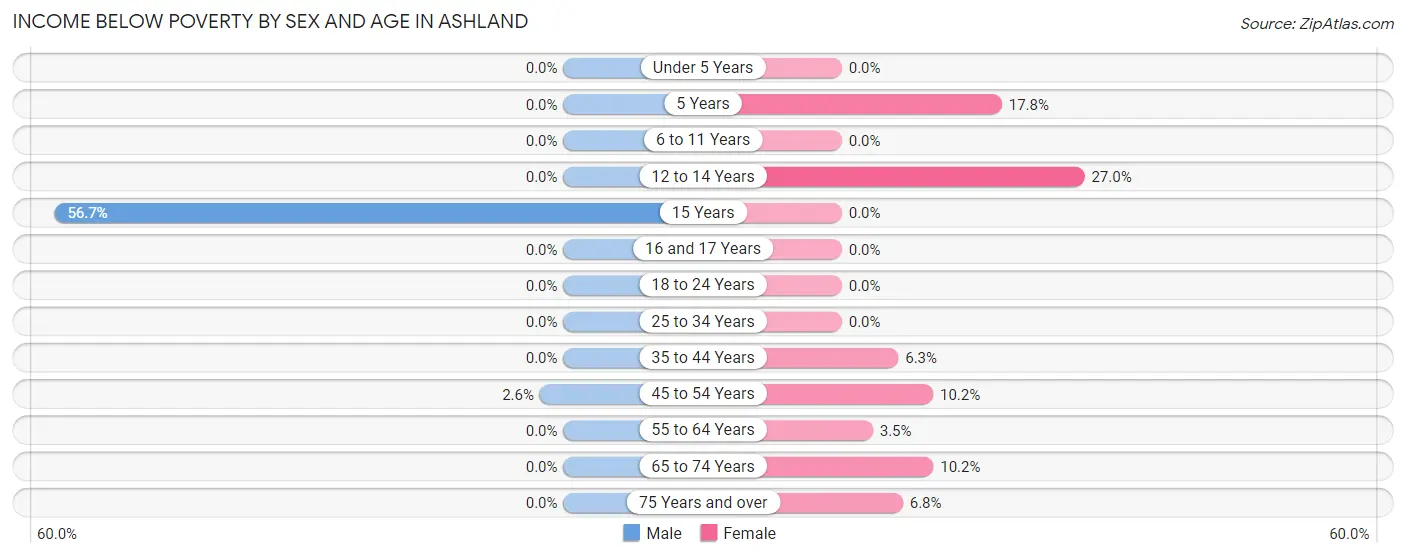
| Age Bracket | Male | Female |
| Under 5 Years | 0 (0.0%) | 0 (0.0%) |
| 5 Years | 0 (0.0%) | 18 (17.8%) |
| 6 to 11 Years | 0 (0.0%) | 0 (0.0%) |
| 12 to 14 Years | 0 (0.0%) | 20 (27.0%) |
| 15 Years | 17 (56.7%) | 0 (0.0%) |
| 16 and 17 Years | 0 (0.0%) | 0 (0.0%) |
| 18 to 24 Years | 0 (0.0%) | 0 (0.0%) |
| 25 to 34 Years | 0 (0.0%) | 0 (0.0%) |
| 35 to 44 Years | 0 (0.0%) | 20 (6.3%) |
| 45 to 54 Years | 9 (2.6%) | 31 (10.2%) |
| 55 to 64 Years | 0 (0.0%) | 14 (3.5%) |
| 65 to 74 Years | 0 (0.0%) | 16 (10.2%) |
| 75 Years and over | 0 (0.0%) | 19 (6.8%) |
| Total | 26 (1.3%) | 138 (5.1%) |
Income Above Poverty by Sex and Age in Ashland
According to the poverty statistics in Ashland, males aged under 5 years and females aged under 5 years are the age groups that are most secure financially, with 100.0% of males and 100.0% of females in these age groups living above the poverty line.
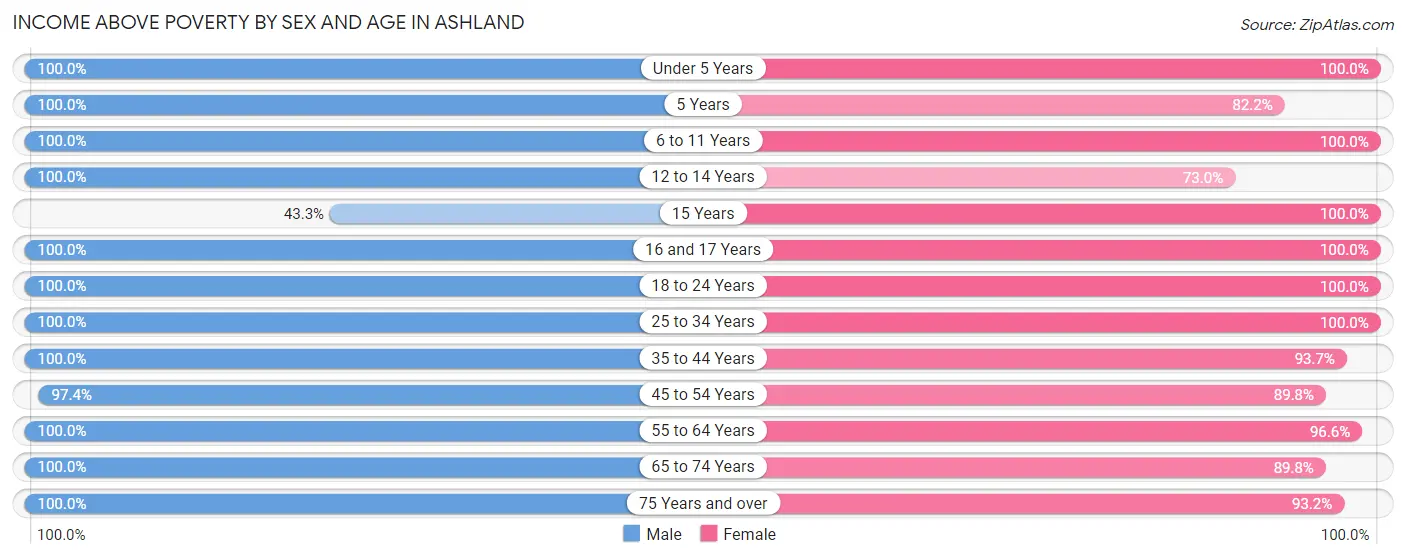
| Age Bracket | Male | Female |
| Under 5 Years | 111 (100.0%) | 149 (100.0%) |
| 5 Years | 32 (100.0%) | 83 (82.2%) |
| 6 to 11 Years | 100 (100.0%) | 174 (100.0%) |
| 12 to 14 Years | 38 (100.0%) | 54 (73.0%) |
| 15 Years | 13 (43.3%) | 13 (100.0%) |
| 16 and 17 Years | 18 (100.0%) | 127 (100.0%) |
| 18 to 24 Years | 96 (100.0%) | 176 (100.0%) |
| 25 to 34 Years | 338 (100.0%) | 398 (100.0%) |
| 35 to 44 Years | 393 (100.0%) | 298 (93.7%) |
| 45 to 54 Years | 334 (97.4%) | 274 (89.8%) |
| 55 to 64 Years | 313 (100.0%) | 392 (96.6%) |
| 65 to 74 Years | 119 (100.0%) | 141 (89.8%) |
| 75 Years and over | 51 (100.0%) | 261 (93.2%) |
| Total | 1,956 (98.7%) | 2,540 (94.9%) |
Income Below Poverty Among Married-Couple Families in Ashland
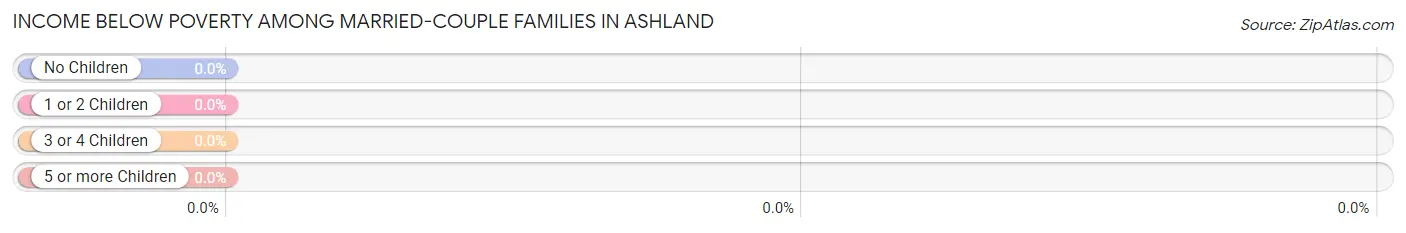
| Children | Above Poverty | Below Poverty |
| No Children | 633 (100.0%) | 0 (0.0%) |
| 1 or 2 Children | 519 (100.0%) | 0 (0.0%) |
| 3 or 4 Children | 50 (100.0%) | 0 (0.0%) |
| 5 or more Children | 0 (0.0%) | 0 (0.0%) |
| Total | 1,202 (100.0%) | 0 (0.0%) |
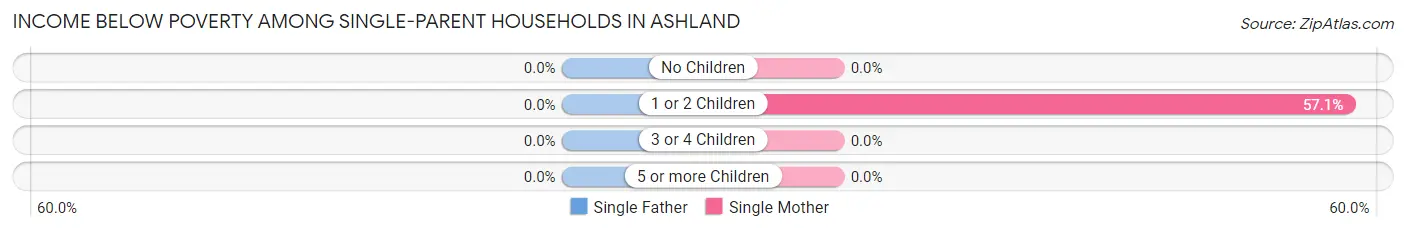
Income Below Poverty Among Single-Parent Households in Ashland
| Children | Single Father | Single Mother |
| No Children | 0 (0.0%) | 0 (0.0%) |
| 1 or 2 Children | 0 (0.0%) | 44 (57.1%) |
| 3 or 4 Children | 0 (0.0%) | 0 (0.0%) |
| 5 or more Children | 0 (0.0%) | 0 (0.0%) |
| Total | 0 (0.0%) | 44 (34.6%) |
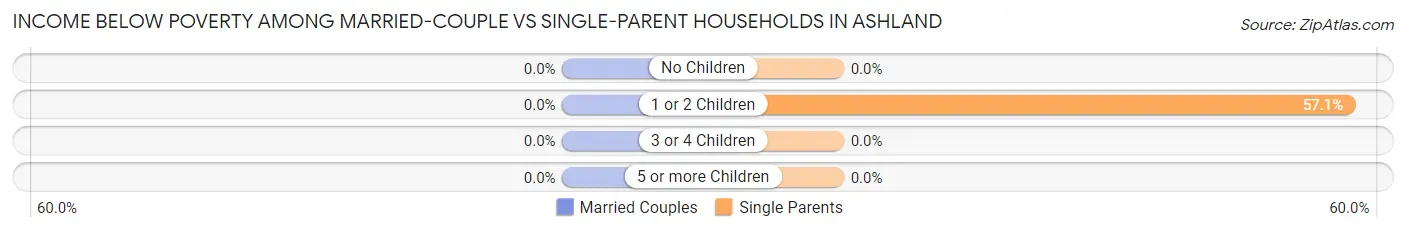
Income Below Poverty Among Married-Couple vs Single-Parent Households in Ashland
| Children | Married-Couple Families | Single-Parent Households |
| No Children | 0 (0.0%) | 0 (0.0%) |
| 1 or 2 Children | 0 (0.0%) | 44 (57.1%) |
| 3 or 4 Children | 0 (0.0%) | 0 (0.0%) |
| 5 or more Children | 0 (0.0%) | 0 (0.0%) |
| Total | 0 (0.0%) | 44 (34.6%) |
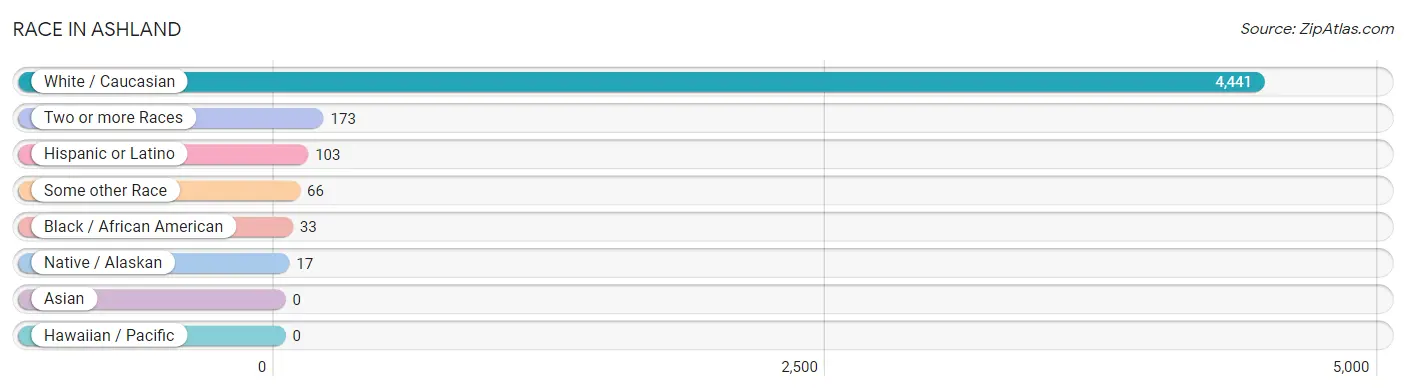
Race in Ashland
The most populous races in Ashland are White / Caucasian (4,441 | 93.9%), Two or more Races (173 | 3.7%), and Hispanic or Latino (103 | 2.2%).
| Race | # Population | % Population |
| Asian | 0 | 0.0% |
| Black / African American | 33 | 0.7% |
| Hawaiian / Pacific | 0 | 0.0% |
| Hispanic or Latino | 103 | 2.2% |
| Native / Alaskan | 17 | 0.4% |
| White / Caucasian | 4,441 | 93.9% |
| Two or more Races | 173 | 3.7% |
| Some other Race | 66 | 1.4% |
| Total | 4,730 | 100.0% |
Ancestry in Ashland
The most populous ancestries reported in Ashland are German (1,490 | 31.5%), Irish (713 | 15.1%), English (701 | 14.8%), American (285 | 6.0%), and Italian (139 | 2.9%), together accounting for 70.4% of all Ashland residents.
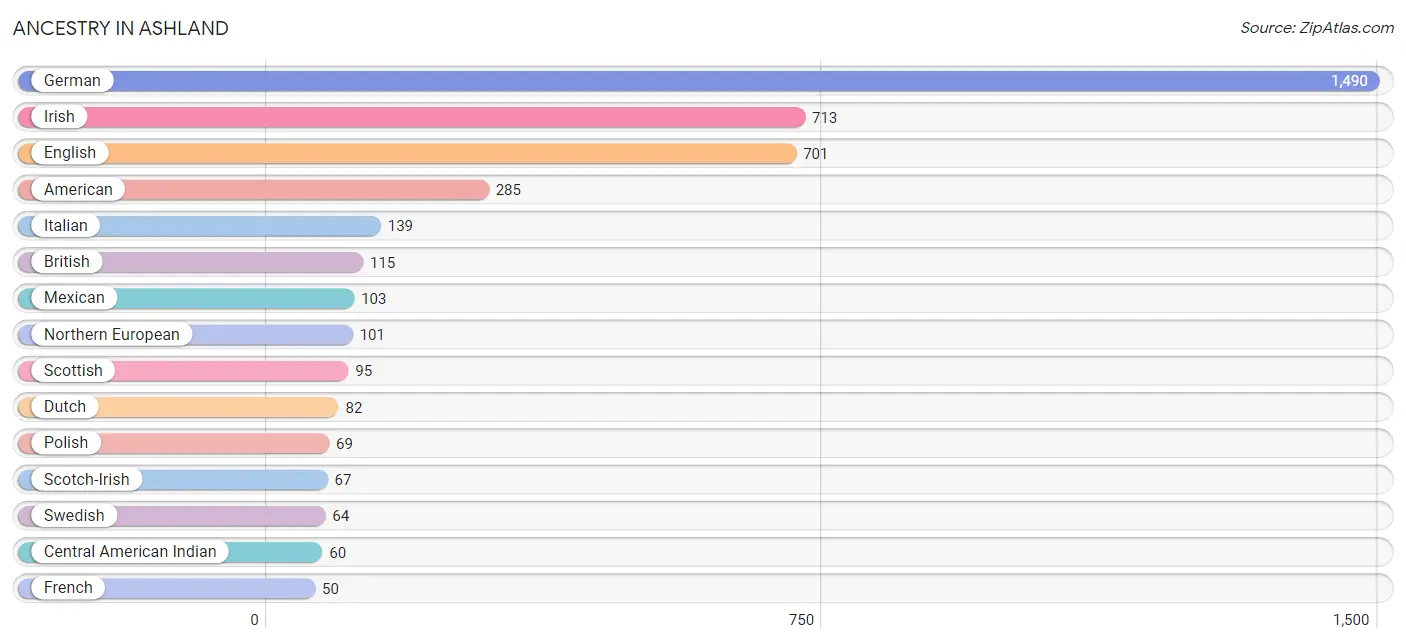
| Ancestry | # Population | % Population |
| Aleut | 5 | 0.1% |
| American | 285 | 6.0% |
| Blackfeet | 4 | 0.1% |
| British | 115 | 2.4% |
| Central American Indian | 60 | 1.3% |
| Dutch | 82 | 1.7% |
| English | 701 | 14.8% |
| European | 22 | 0.5% |
| French | 50 | 1.1% |
| German | 1,490 | 31.5% |
| Irish | 713 | 15.1% |
| Italian | 139 | 2.9% |
| Lithuanian | 18 | 0.4% |
| Mexican | 103 | 2.2% |
| Northern European | 101 | 2.1% |
| Polish | 69 | 1.5% |
| Romanian | 31 | 0.7% |
| Scandinavian | 4 | 0.1% |
| Scotch-Irish | 67 | 1.4% |
| Scottish | 95 | 2.0% |
| Slavic | 17 | 0.4% |
| Swedish | 64 | 1.3% | View All 22 Rows |
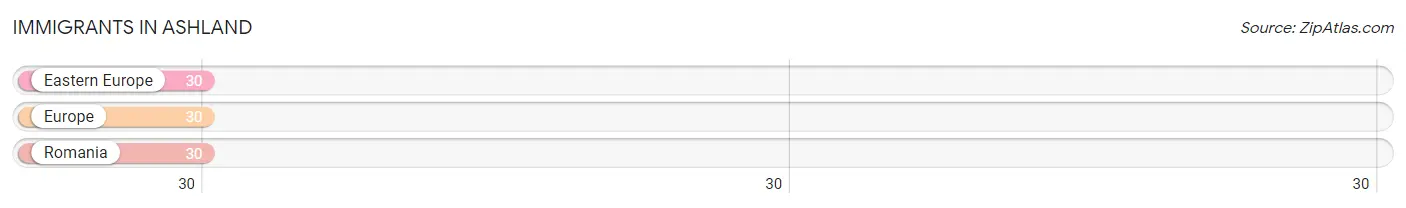
Immigrants in Ashland
The most numerous immigrant groups reported in Ashland came from Eastern Europe (30 | 0.6%), Europe (30 | 0.6%), and Romania (30 | 0.6%), together accounting for 1.9% of all Ashland residents.
| Immigration Origin | # Population | % Population |
| Eastern Europe | 30 | 0.6% |
| Europe | 30 | 0.6% |
| Romania | 30 | 0.6% | View All 3 Rows |
Sex and Age in Ashland
Sex and Age in Ashland
The most populous age groups in Ashland are 45 to 49 Years (276 | 13.8%) for men and 55 to 59 Years (296 | 10.8%) for women.
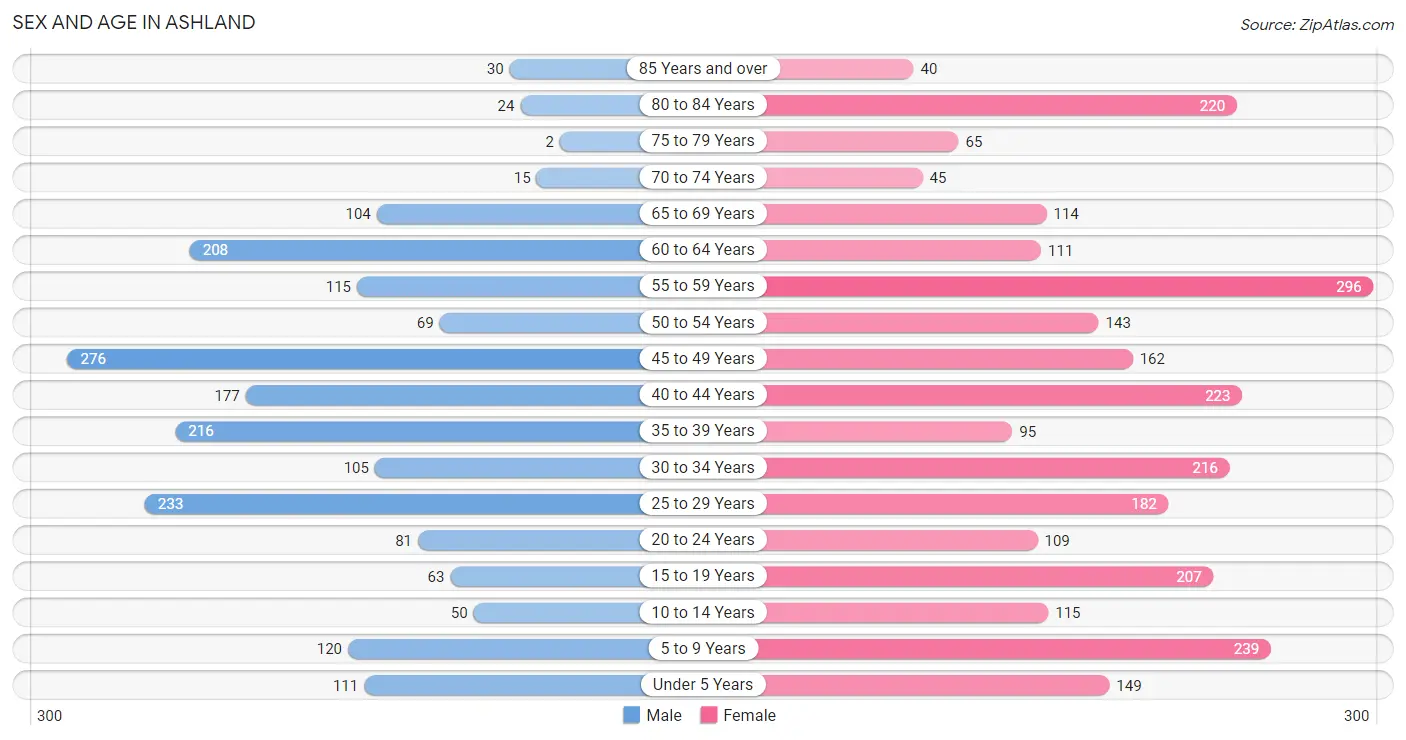
| Age Bracket | Male | Female |
| Under 5 Years | 111 (5.6%) | 149 (5.5%) |
| 5 to 9 Years | 120 (6.0%) | 239 (8.7%) |
| 10 to 14 Years | 50 (2.5%) | 115 (4.2%) |
| 15 to 19 Years | 63 (3.2%) | 207 (7.6%) |
| 20 to 24 Years | 81 (4.1%) | 109 (4.0%) |
| 25 to 29 Years | 233 (11.7%) | 182 (6.7%) |
| 30 to 34 Years | 105 (5.2%) | 216 (7.9%) |
| 35 to 39 Years | 216 (10.8%) | 95 (3.5%) |
| 40 to 44 Years | 177 (8.8%) | 223 (8.2%) |
| 45 to 49 Years | 276 (13.8%) | 162 (5.9%) |
| 50 to 54 Years | 69 (3.5%) | 143 (5.2%) |
| 55 to 59 Years | 115 (5.8%) | 296 (10.8%) |
| 60 to 64 Years | 208 (10.4%) | 111 (4.1%) |
| 65 to 69 Years | 104 (5.2%) | 114 (4.2%) |
| 70 to 74 Years | 15 (0.7%) | 45 (1.7%) |
| 75 to 79 Years | 2 (0.1%) | 65 (2.4%) |
| 80 to 84 Years | 24 (1.2%) | 220 (8.1%) |
| 85 Years and over | 30 (1.5%) | 40 (1.5%) |
| Total | 1,999 (100.0%) | 2,731 (100.0%) |
Families and Households in Ashland
Median Family Size in Ashland
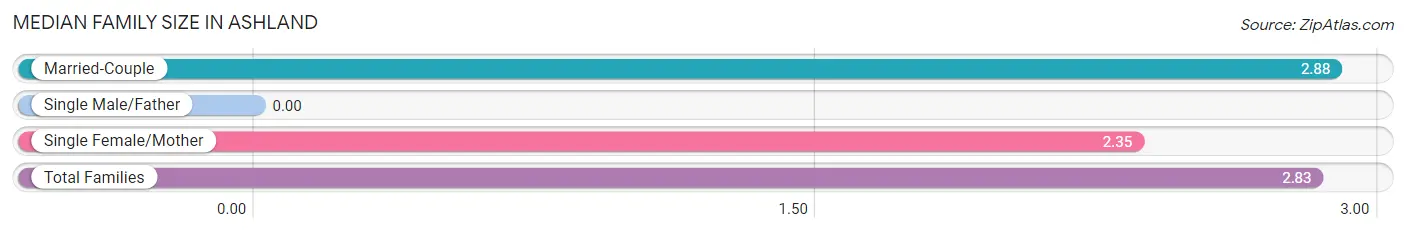
| Family Type | # Families | Family Size |
| Married-Couple | 1,202 (90.4%) | 2.88 |
| Single Male/Father | 0 (0.0%) | - |
| Single Female/Mother | 127 (9.6%) | 2.35 |
| Total Families | 1,329 (100.0%) | 2.83 |
Median Household Size in Ashland
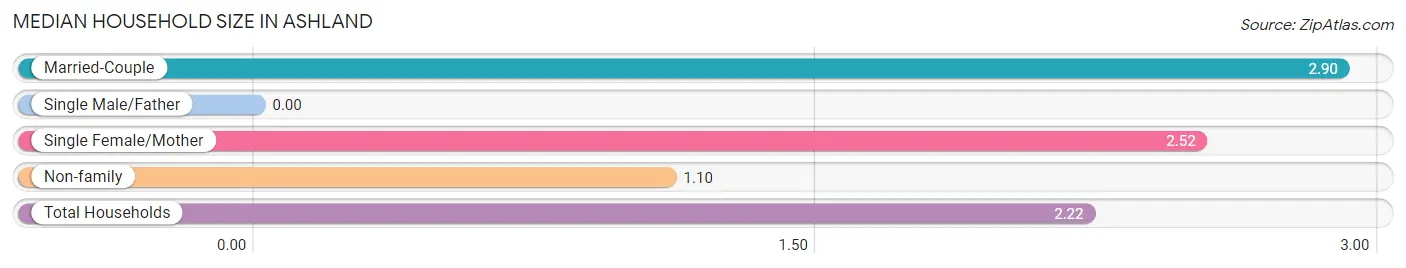
| Household Type | # Households | Household Size |
| Married-Couple | 1,202 (57.2%) | 2.90 |
| Single Male/Father | 0 (0.0%) | - |
| Single Female/Mother | 127 (6.0%) | 2.52 |
| Non-family | 772 (36.7%) | 1.10 |
| Total Households | 2,101 (100.0%) | 2.22 |
Household Size by Marriage Status in Ashland
Out of a total of 2,101 households in Ashland, 1,329 (63.3%) are family households, while 772 (36.7%) are nonfamily households. The most numerous type of family households are 2-person households, comprising 646, and the most common type of nonfamily households are 1-person households, comprising 731.
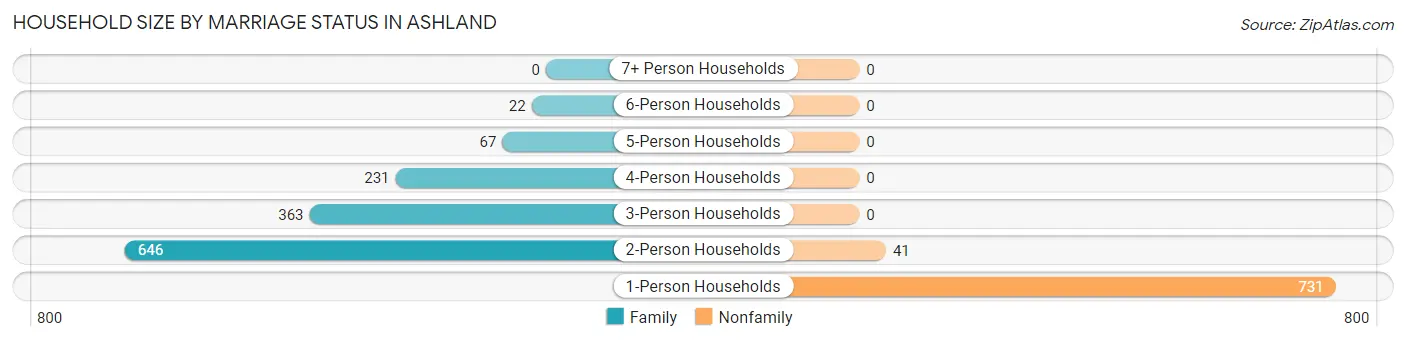
| Household Size | Family Households | Nonfamily Households |
| 1-Person Households | - | 731 (34.8%) |
| 2-Person Households | 646 (30.7%) | 41 (1.9%) |
| 3-Person Households | 363 (17.3%) | 0 (0.0%) |
| 4-Person Households | 231 (11.0%) | 0 (0.0%) |
| 5-Person Households | 67 (3.2%) | 0 (0.0%) |
| 6-Person Households | 22 (1.1%) | 0 (0.0%) |
| 7+ Person Households | 0 (0.0%) | 0 (0.0%) |
| Total | 1,329 (63.3%) | 772 (36.7%) |
Female Fertility in Ashland
Fertility by Age in Ashland
Average fertility rate in Ashland is 18.0 births per 1,000 women. Women in the age bracket of 20 to 34 years have the highest fertility rate with 45.0 births per 1,000 women. Women in the age bracket of 20 to 34 years acount for 100.0% of all women with births.
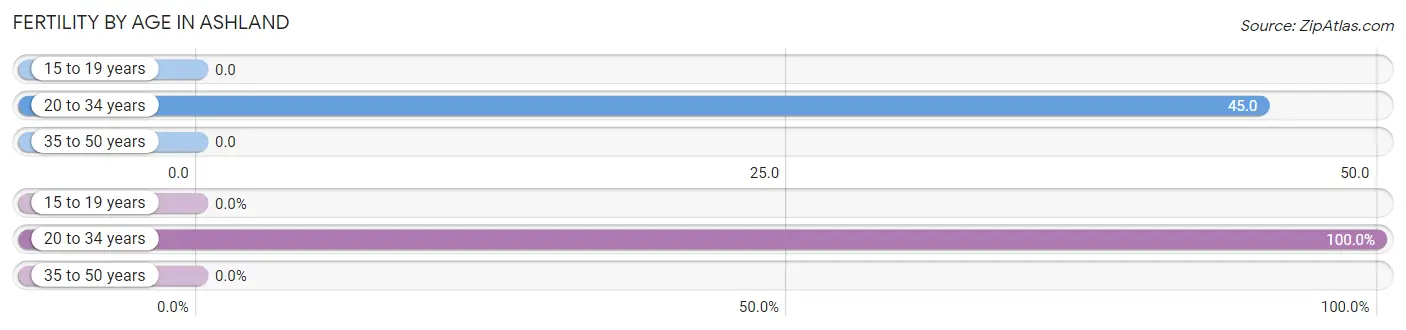
| Age Bracket | Women with Births | Births / 1,000 Women |
| 15 to 19 years | 0 (0.0%) | 0.0 |
| 20 to 34 years | 23 (100.0%) | 45.0 |
| 35 to 50 years | 0 (0.0%) | 0.0 |
| Total | 23 (100.0%) | 18.0 |
Fertility by Age by Marriage Status in Ashland
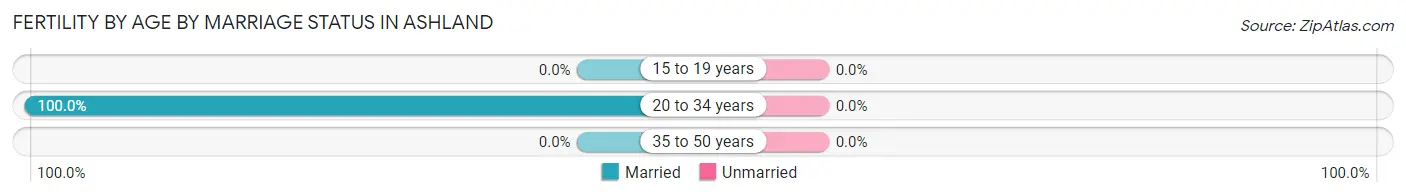
| Age Bracket | Married | Unmarried |
| 15 to 19 years | 0 (0.0%) | 0 (0.0%) |
| 20 to 34 years | 23 (100.0%) | 0 (0.0%) |
| 35 to 50 years | 0 (0.0%) | 0 (0.0%) |
| Total | 23 (100.0%) | 0 (0.0%) |
Fertility by Education in Ashland
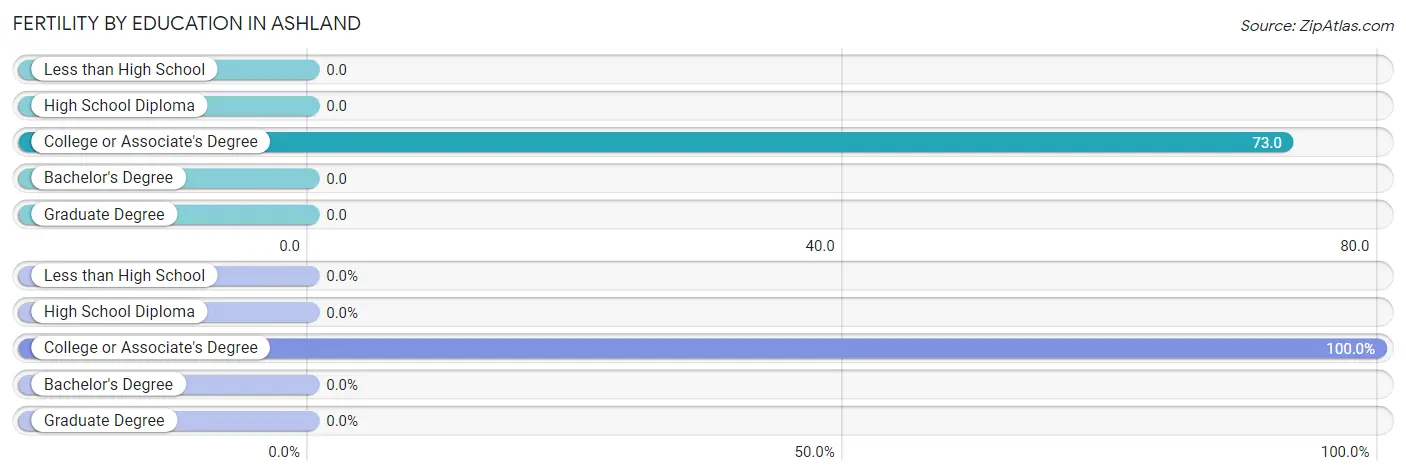
| Educational Attainment | Women with Births | Births / 1,000 Women |
| Less than High School | 0 (0.0%) | 0.0 |
| High School Diploma | 0 (0.0%) | 0.0 |
| College or Associate's Degree | 23 (100.0%) | 73.0 |
| Bachelor's Degree | 0 (0.0%) | 0.0 |
| Graduate Degree | 0 (0.0%) | 0.0 |
| Total | 23 (100.0%) | 18.0 |
Fertility by Education by Marriage Status in Ashland
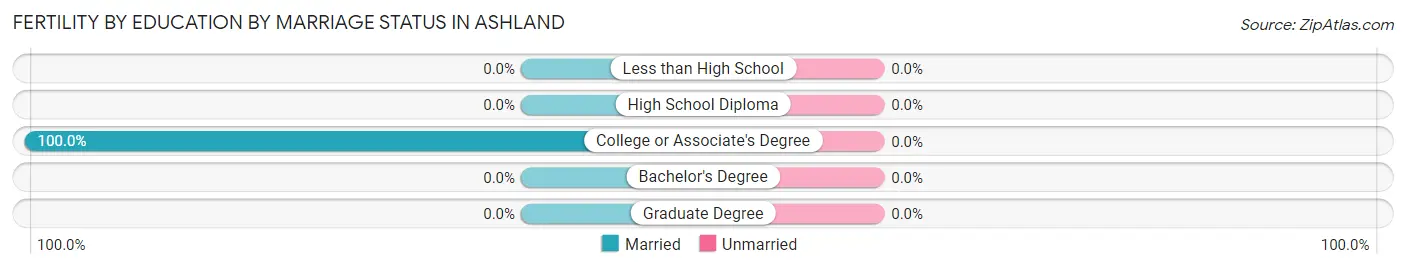
| Educational Attainment | Married | Unmarried |
| Less than High School | 0 (0.0%) | 0 (0.0%) |
| High School Diploma | 0 (0.0%) | 0 (0.0%) |
| College or Associate's Degree | 23 (100.0%) | 0 (0.0%) |
| Bachelor's Degree | 0 (0.0%) | 0 (0.0%) |
| Graduate Degree | 0 (0.0%) | 0 (0.0%) |
| Total | 23 (100.0%) | 0 (0.0%) |
Employment Characteristics in Ashland
Employment by Class of Employer in Ashland
Among the 2,805 employed individuals in Ashland, private company employees (1,689 | 60.2%), not-for-profit organizations (441 | 15.7%), and state government employees (263 | 9.4%) make up the most common classes of employment.
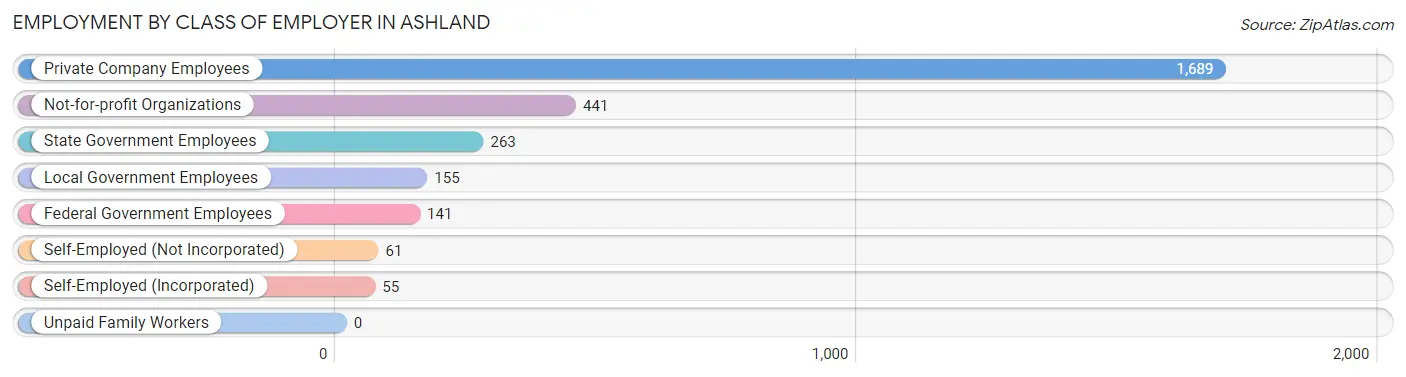
| Employer Class | # Employees | % Employees |
| Private Company Employees | 1,689 | 60.2% |
| Self-Employed (Incorporated) | 55 | 2.0% |
| Self-Employed (Not Incorporated) | 61 | 2.2% |
| Not-for-profit Organizations | 441 | 15.7% |
| Local Government Employees | 155 | 5.5% |
| State Government Employees | 263 | 9.4% |
| Federal Government Employees | 141 | 5.0% |
| Unpaid Family Workers | 0 | 0.0% |
| Total | 2,805 | 100.0% |
Employment Status by Age in Ashland
According to the labor force statistics for Ashland, out of the total population over 16 years of age (3,903), 73.0% or 2,849 individuals are in the labor force, with 0.7% or 20 of them unemployed. The age group with the highest labor force participation rate is 20 to 24 years, with 95.8% or 182 individuals in the labor force. Within the labor force, the 25 to 29 years age range has the highest percentage of unemployed individuals, with 2.3% or 9 of them being unemployed.
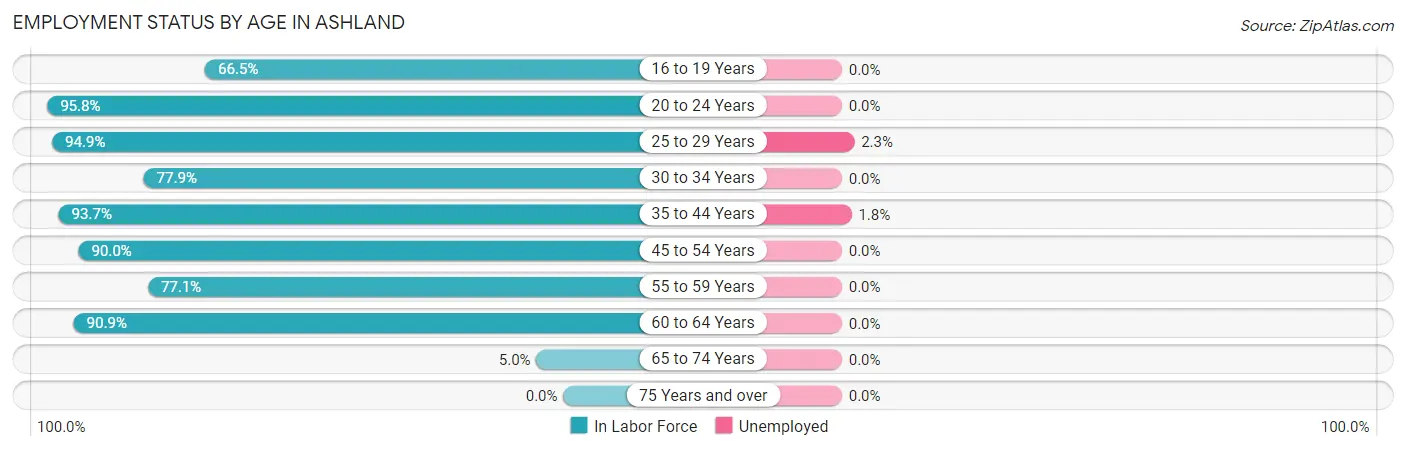
| Age Bracket | In Labor Force | Unemployed |
| 16 to 19 Years | 151 (66.5%) | 0 (0.0%) |
| 20 to 24 Years | 182 (95.8%) | 0 (0.0%) |
| 25 to 29 Years | 394 (94.9%) | 9 (2.3%) |
| 30 to 34 Years | 250 (77.9%) | 0 (0.0%) |
| 35 to 44 Years | 666 (93.7%) | 12 (1.8%) |
| 45 to 54 Years | 585 (90.0%) | 0 (0.0%) |
| 55 to 59 Years | 317 (77.1%) | 0 (0.0%) |
| 60 to 64 Years | 290 (90.9%) | 0 (0.0%) |
| 65 to 74 Years | 14 (5.0%) | 0 (0.0%) |
| 75 Years and over | 0 (0.0%) | 0 (0.0%) |
| Total | 2,849 (73.0%) | 20 (0.7%) |
Employment Status by Educational Attainment in Ashland
According to labor force statistics for Ashland, 88.5% of individuals (2,502) out of the total population between 25 and 64 years of age (2,827) are in the labor force, with 0.8% or 20 of them being unemployed. The group with the highest labor force participation rate are those with the educational attainment of bachelor's degree or higher, with 96.3% or 961 individuals in the labor force. Within the labor force, individuals with college / associate degree education have the highest percentage of unemployment, with 1.3% or 9 of them being unemployed.
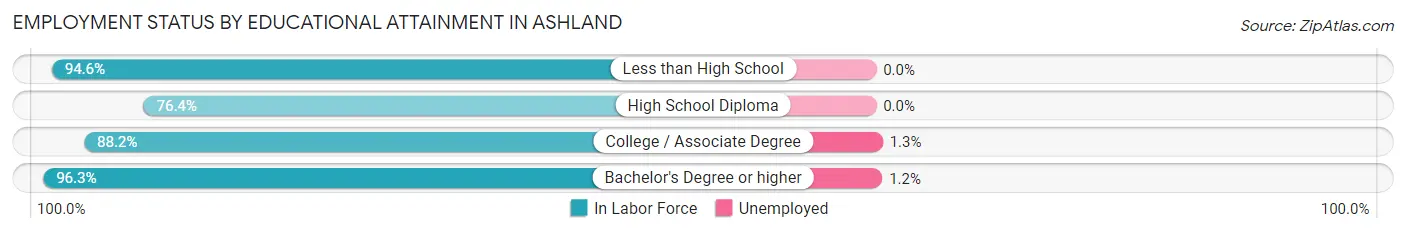
| Educational Attainment | In Labor Force | Unemployed |
| Less than High School | 246 (94.6%) | 0 (0.0%) |
| High School Diploma | 575 (76.4%) | 0 (0.0%) |
| College / Associate Degree | 720 (88.2%) | 11 (1.3%) |
| Bachelor's Degree or higher | 961 (96.3%) | 12 (1.2%) |
| Total | 2,502 (88.5%) | 23 (0.8%) |
Employment Occupations by Sex in Ashland
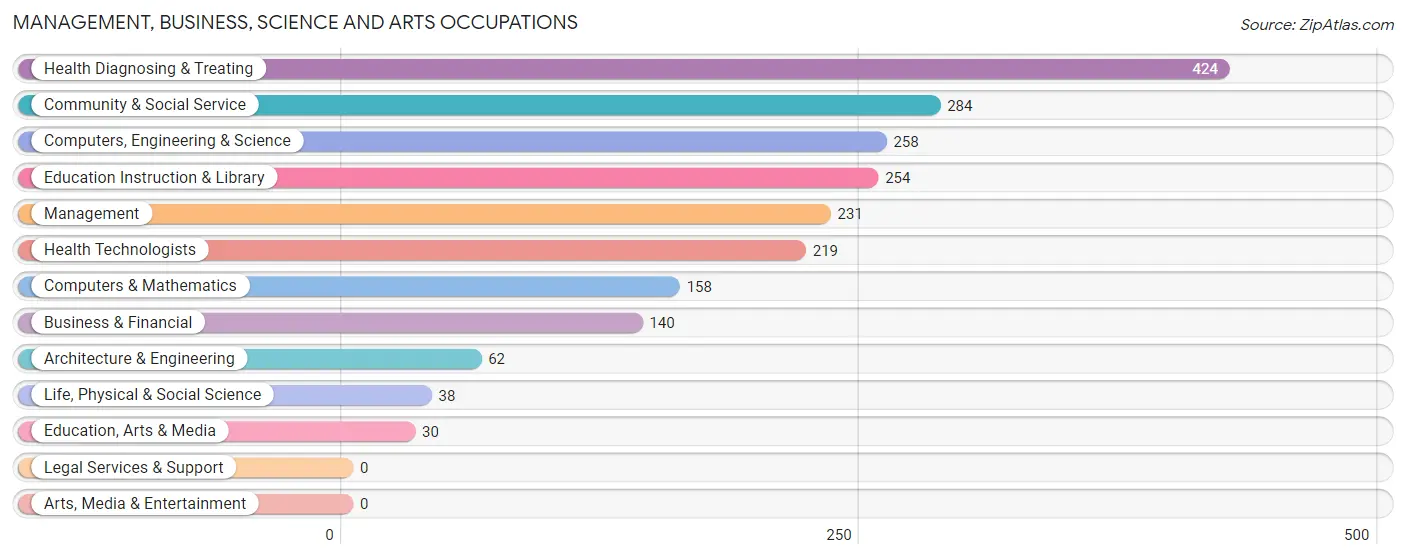
Management, Business, Science and Arts Occupations
The most common Management, Business, Science and Arts occupations in Ashland are Health Diagnosing & Treating (424 | 15.0%), Community & Social Service (284 | 10.0%), Computers, Engineering & Science (258 | 9.1%), Education Instruction & Library (254 | 9.0%), and Management (231 | 8.2%).
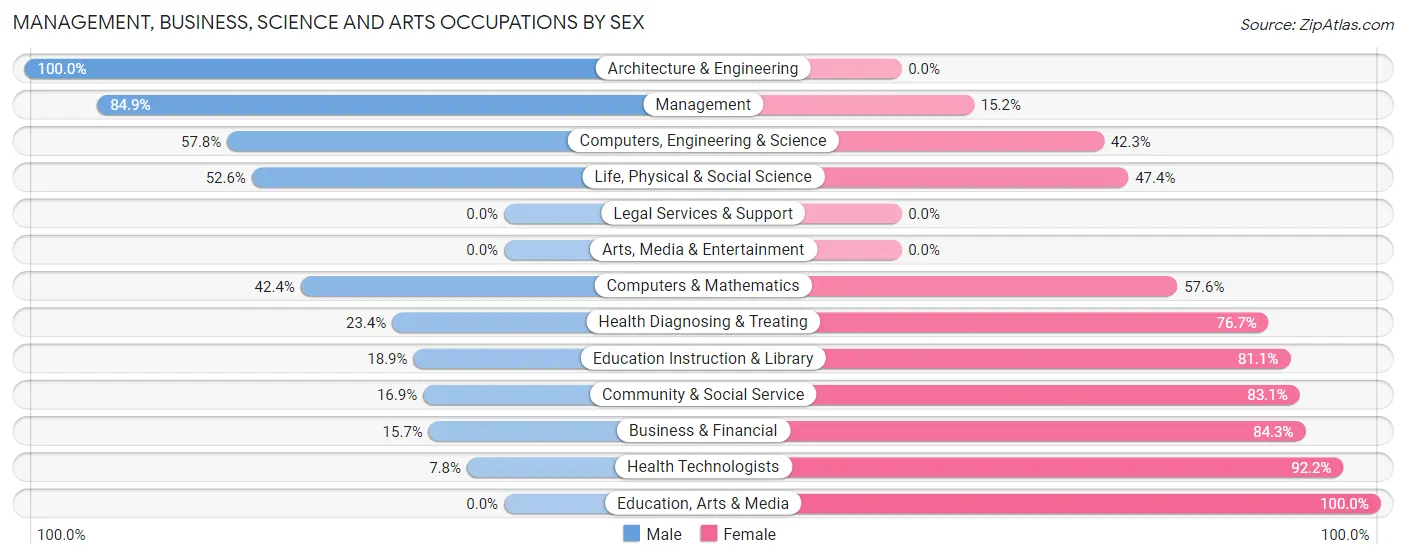
Management, Business, Science and Arts Occupations by Sex
Within the Management, Business, Science and Arts occupations in Ashland, the most male-oriented occupations are Architecture & Engineering (100.0%), Management (84.9%), and Computers, Engineering & Science (57.8%), while the most female-oriented occupations are Education, Arts & Media (100.0%), Health Technologists (92.2%), and Business & Financial (84.3%).
| Occupation | Male | Female |
| Management | 196 (84.9%) | 35 (15.1%) |
| Business & Financial | 22 (15.7%) | 118 (84.3%) |
| Computers, Engineering & Science | 149 (57.8%) | 109 (42.2%) |
| Computers & Mathematics | 67 (42.4%) | 91 (57.6%) |
| Architecture & Engineering | 62 (100.0%) | 0 (0.0%) |
| Life, Physical & Social Science | 20 (52.6%) | 18 (47.4%) |
| Community & Social Service | 48 (16.9%) | 236 (83.1%) |
| Education, Arts & Media | 0 (0.0%) | 30 (100.0%) |
| Legal Services & Support | 0 (0.0%) | 0 (0.0%) |
| Education Instruction & Library | 48 (18.9%) | 206 (81.1%) |
| Arts, Media & Entertainment | 0 (0.0%) | 0 (0.0%) |
| Health Diagnosing & Treating | 99 (23.4%) | 325 (76.6%) |
| Health Technologists | 17 (7.8%) | 202 (92.2%) |
| Total (Category) | 514 (38.4%) | 823 (61.6%) |
| Total (Overall) | 1,388 (49.1%) | 1,440 (50.9%) |
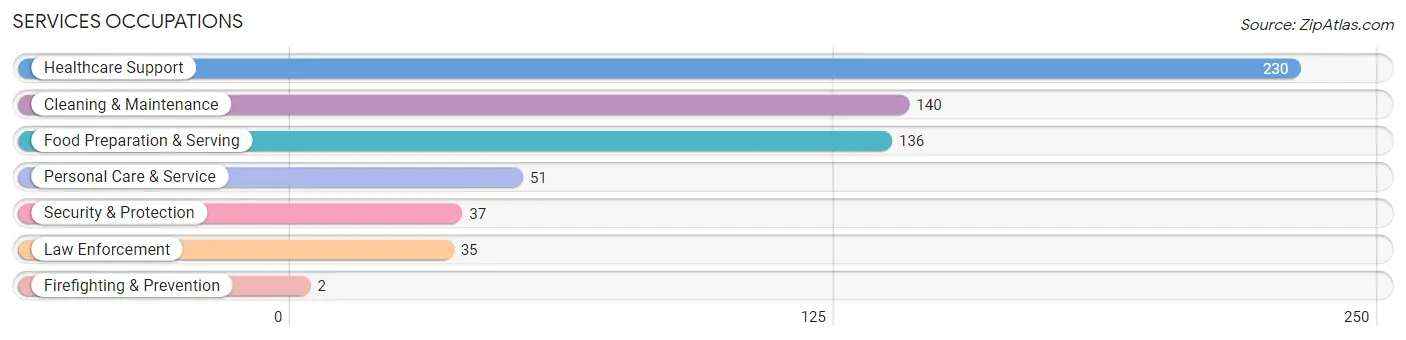
Services Occupations
The most common Services occupations in Ashland are Healthcare Support (230 | 8.1%), Cleaning & Maintenance (140 | 5.0%), Food Preparation & Serving (136 | 4.8%), Personal Care & Service (51 | 1.8%), and Security & Protection (37 | 1.3%).
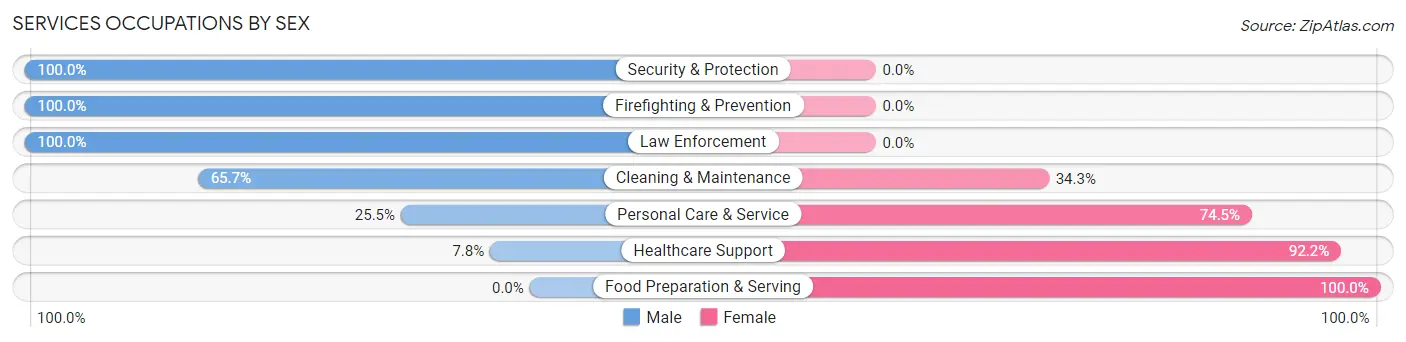
Services Occupations by Sex
Within the Services occupations in Ashland, the most male-oriented occupations are Security & Protection (100.0%), Firefighting & Prevention (100.0%), and Law Enforcement (100.0%), while the most female-oriented occupations are Food Preparation & Serving (100.0%), Healthcare Support (92.2%), and Personal Care & Service (74.5%).
| Occupation | Male | Female |
| Healthcare Support | 18 (7.8%) | 212 (92.2%) |
| Security & Protection | 37 (100.0%) | 0 (0.0%) |
| Firefighting & Prevention | 2 (100.0%) | 0 (0.0%) |
| Law Enforcement | 35 (100.0%) | 0 (0.0%) |
| Food Preparation & Serving | 0 (0.0%) | 136 (100.0%) |
| Cleaning & Maintenance | 92 (65.7%) | 48 (34.3%) |
| Personal Care & Service | 13 (25.5%) | 38 (74.5%) |
| Total (Category) | 160 (26.9%) | 434 (73.1%) |
| Total (Overall) | 1,388 (49.1%) | 1,440 (50.9%) |
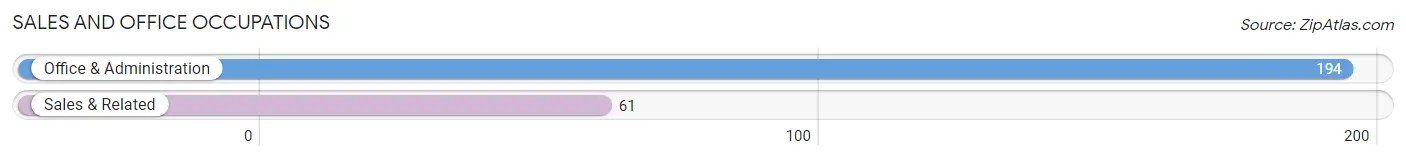
Sales and Office Occupations
The most common Sales and Office occupations in Ashland are Office & Administration (194 | 6.9%), and Sales & Related (61 | 2.2%).
Sales and Office Occupations by Sex
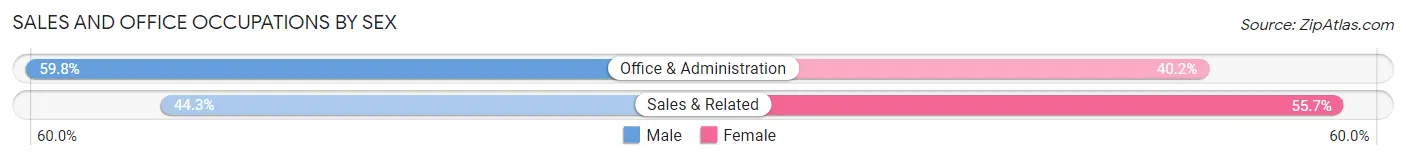
| Occupation | Male | Female |
| Sales & Related | 27 (44.3%) | 34 (55.7%) |
| Office & Administration | 116 (59.8%) | 78 (40.2%) |
| Total (Category) | 143 (56.1%) | 112 (43.9%) |
| Total (Overall) | 1,388 (49.1%) | 1,440 (50.9%) |
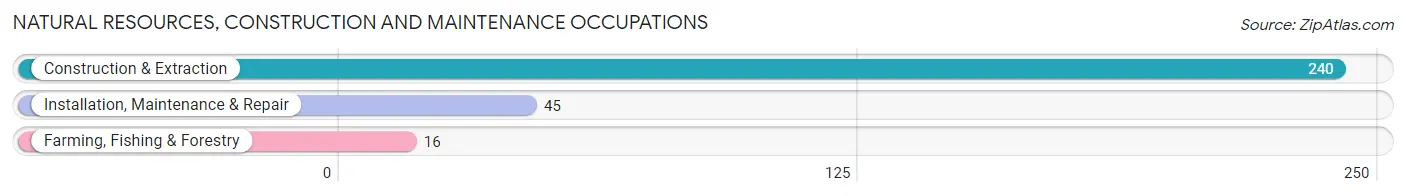
Natural Resources, Construction and Maintenance Occupations
The most common Natural Resources, Construction and Maintenance occupations in Ashland are Construction & Extraction (240 | 8.5%), Installation, Maintenance & Repair (45 | 1.6%), and Farming, Fishing & Forestry (16 | 0.6%).
Natural Resources, Construction and Maintenance Occupations by Sex
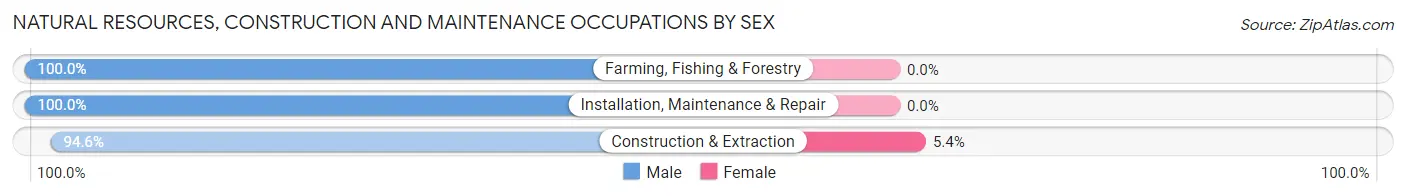
| Occupation | Male | Female |
| Farming, Fishing & Forestry | 16 (100.0%) | 0 (0.0%) |
| Construction & Extraction | 227 (94.6%) | 13 (5.4%) |
| Installation, Maintenance & Repair | 45 (100.0%) | 0 (0.0%) |
| Total (Category) | 288 (95.7%) | 13 (4.3%) |
| Total (Overall) | 1,388 (49.1%) | 1,440 (50.9%) |
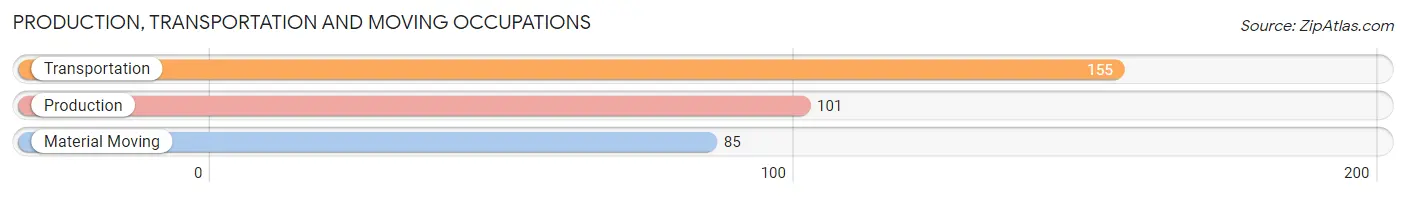
Production, Transportation and Moving Occupations
The most common Production, Transportation and Moving occupations in Ashland are Transportation (155 | 5.5%), Production (101 | 3.6%), and Material Moving (85 | 3.0%).
Production, Transportation and Moving Occupations by Sex
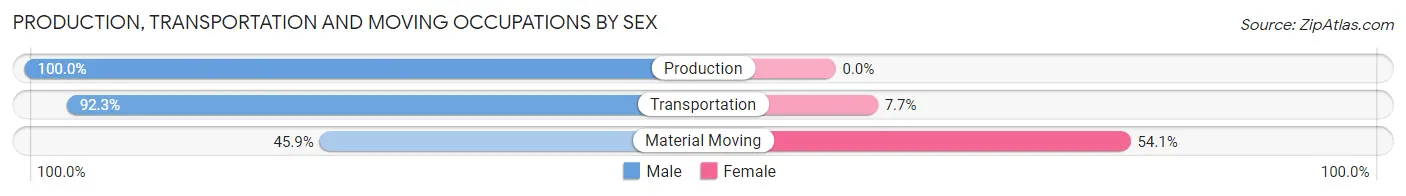
| Occupation | Male | Female |
| Production | 101 (100.0%) | 0 (0.0%) |
| Transportation | 143 (92.3%) | 12 (7.7%) |
| Material Moving | 39 (45.9%) | 46 (54.1%) |
| Total (Category) | 283 (83.0%) | 58 (17.0%) |
| Total (Overall) | 1,388 (49.1%) | 1,440 (50.9%) |
Employment Industries by Sex in Ashland
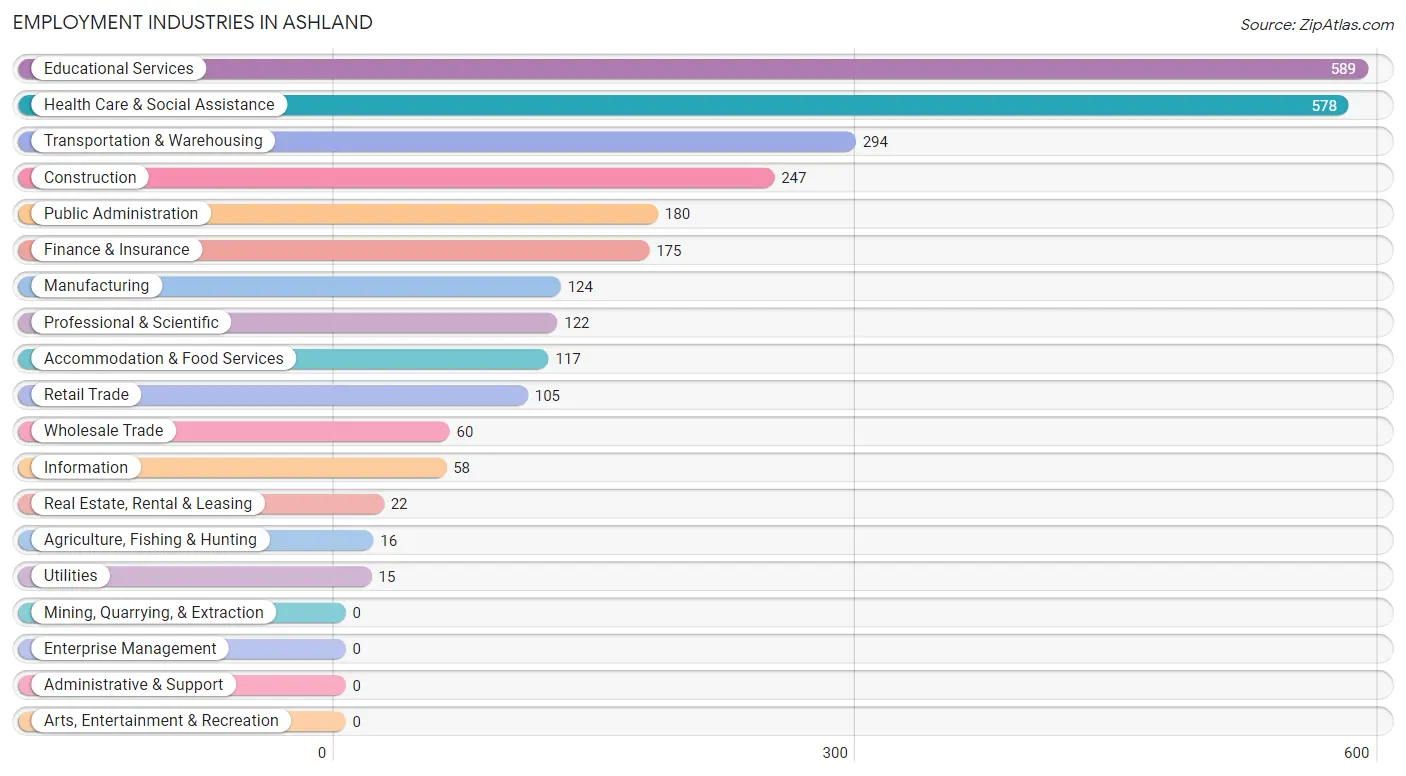
Employment Industries in Ashland
The major employment industries in Ashland include Educational Services (589 | 20.8%), Health Care & Social Assistance (578 | 20.4%), Transportation & Warehousing (294 | 10.4%), Construction (247 | 8.7%), and Public Administration (180 | 6.4%).
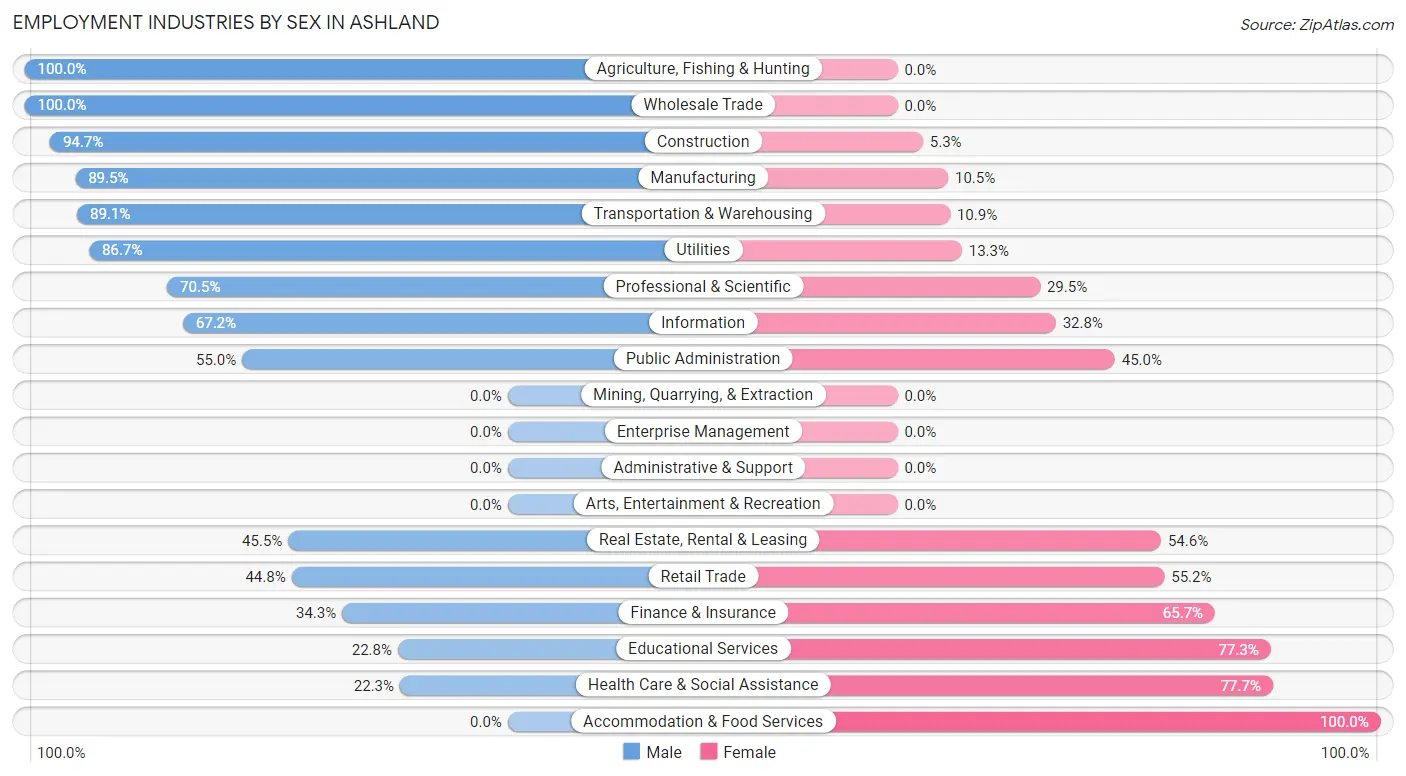
Employment Industries by Sex in Ashland
The Ashland industries that see more men than women are Agriculture, Fishing & Hunting (100.0%), Wholesale Trade (100.0%), and Construction (94.7%), whereas the industries that tend to have a higher number of women are Accommodation & Food Services (100.0%), Health Care & Social Assistance (77.7%), and Educational Services (77.2%).
| Industry | Male | Female |
| Agriculture, Fishing & Hunting | 16 (100.0%) | 0 (0.0%) |
| Mining, Quarrying, & Extraction | 0 (0.0%) | 0 (0.0%) |
| Construction | 234 (94.7%) | 13 (5.3%) |
| Manufacturing | 111 (89.5%) | 13 (10.5%) |
| Wholesale Trade | 60 (100.0%) | 0 (0.0%) |
| Retail Trade | 47 (44.8%) | 58 (55.2%) |
| Transportation & Warehousing | 262 (89.1%) | 32 (10.9%) |
| Utilities | 13 (86.7%) | 2 (13.3%) |
| Information | 39 (67.2%) | 19 (32.8%) |
| Finance & Insurance | 60 (34.3%) | 115 (65.7%) |
| Real Estate, Rental & Leasing | 10 (45.5%) | 12 (54.5%) |
| Professional & Scientific | 86 (70.5%) | 36 (29.5%) |
| Enterprise Management | 0 (0.0%) | 0 (0.0%) |
| Administrative & Support | 0 (0.0%) | 0 (0.0%) |
| Educational Services | 134 (22.8%) | 455 (77.2%) |
| Health Care & Social Assistance | 129 (22.3%) | 449 (77.7%) |
| Arts, Entertainment & Recreation | 0 (0.0%) | 0 (0.0%) |
| Accommodation & Food Services | 0 (0.0%) | 117 (100.0%) |
| Public Administration | 99 (55.0%) | 81 (45.0%) |
| Total | 1,388 (49.1%) | 1,440 (50.9%) |
Education in Ashland
School Enrollment in Ashland
The most common levels of schooling among the 918 students in Ashland are elementary school (188 | 20.5%), high school (188 | 20.5%), and middle school (165 | 18.0%).
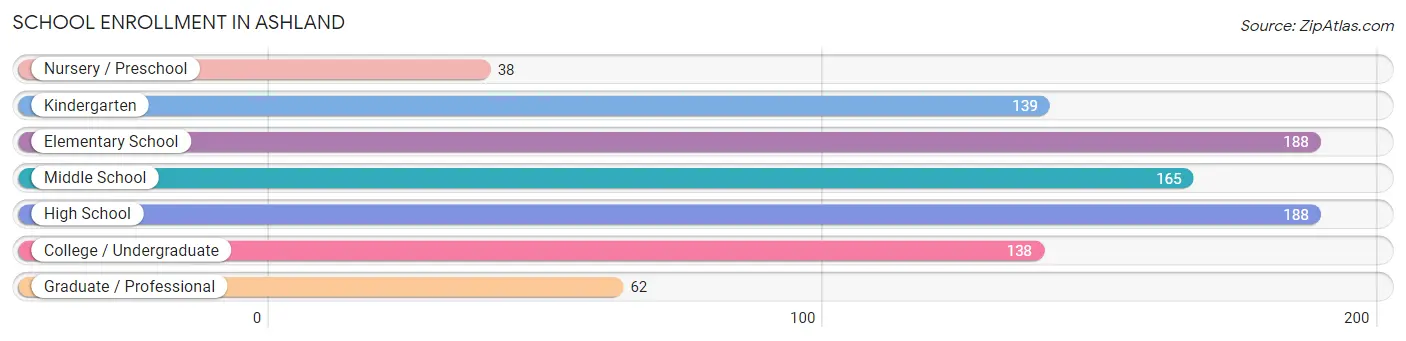
| School Level | # Students | % Students |
| Nursery / Preschool | 38 | 4.1% |
| Kindergarten | 139 | 15.1% |
| Elementary School | 188 | 20.5% |
| Middle School | 165 | 18.0% |
| High School | 188 | 20.5% |
| College / Undergraduate | 138 | 15.0% |
| Graduate / Professional | 62 | 6.8% |
| Total | 918 | 100.0% |
School Enrollment by Age by Funding Source in Ashland
Out of a total of 918 students who are enrolled in schools in Ashland, 56 (6.1%) attend a private institution, while the remaining 862 (93.9%) are enrolled in public schools. The age group of 35 years and over has the highest likelihood of being enrolled in private schools, with 12 (100.0% in the age bracket) enrolled. Conversely, the age group of 3 to 4 year olds has the lowest likelihood of being enrolled in a private school, with 17 (100.0% in the age bracket) attending a public institution.
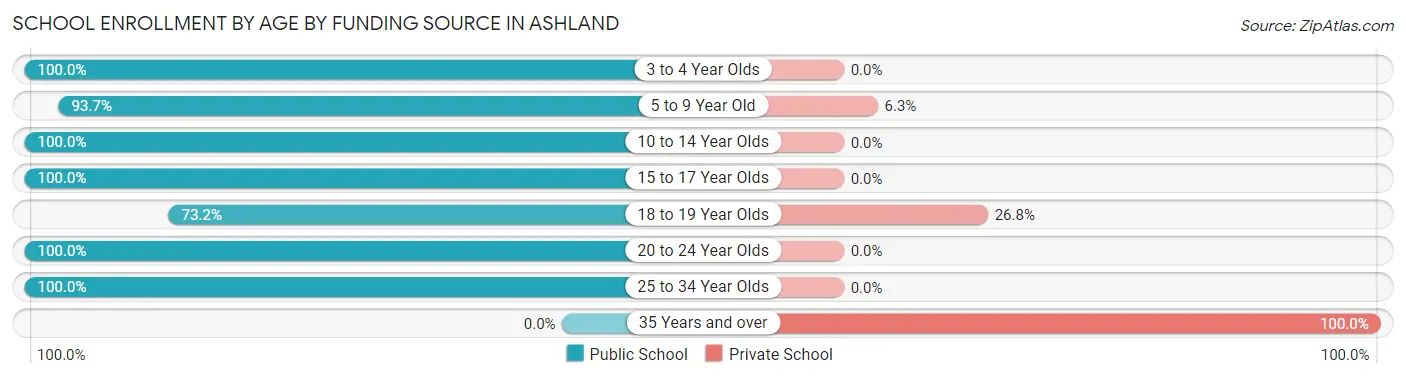
| Age Bracket | Public School | Private School |
| 3 to 4 Year Olds | 17 (100.0%) | 0 (0.0%) |
| 5 to 9 Year Old | 326 (93.7%) | 22 (6.3%) |
| 10 to 14 Year Olds | 165 (100.0%) | 0 (0.0%) |
| 15 to 17 Year Olds | 188 (100.0%) | 0 (0.0%) |
| 18 to 19 Year Olds | 60 (73.2%) | 22 (26.8%) |
| 20 to 24 Year Olds | 56 (100.0%) | 0 (0.0%) |
| 25 to 34 Year Olds | 50 (100.0%) | 0 (0.0%) |
| 35 Years and over | 0 (0.0%) | 12 (100.0%) |
| Total | 862 (93.9%) | 56 (6.1%) |
Educational Attainment by Field of Study in Ashland
Science & technology (292 | 23.4%), business (233 | 18.7%), bio, nature & agricultural (149 | 11.9%), education (135 | 10.8%), and psychology (131 | 10.5%) are the most common fields of study among 1,247 individuals in Ashland who have obtained a bachelor's degree or higher.
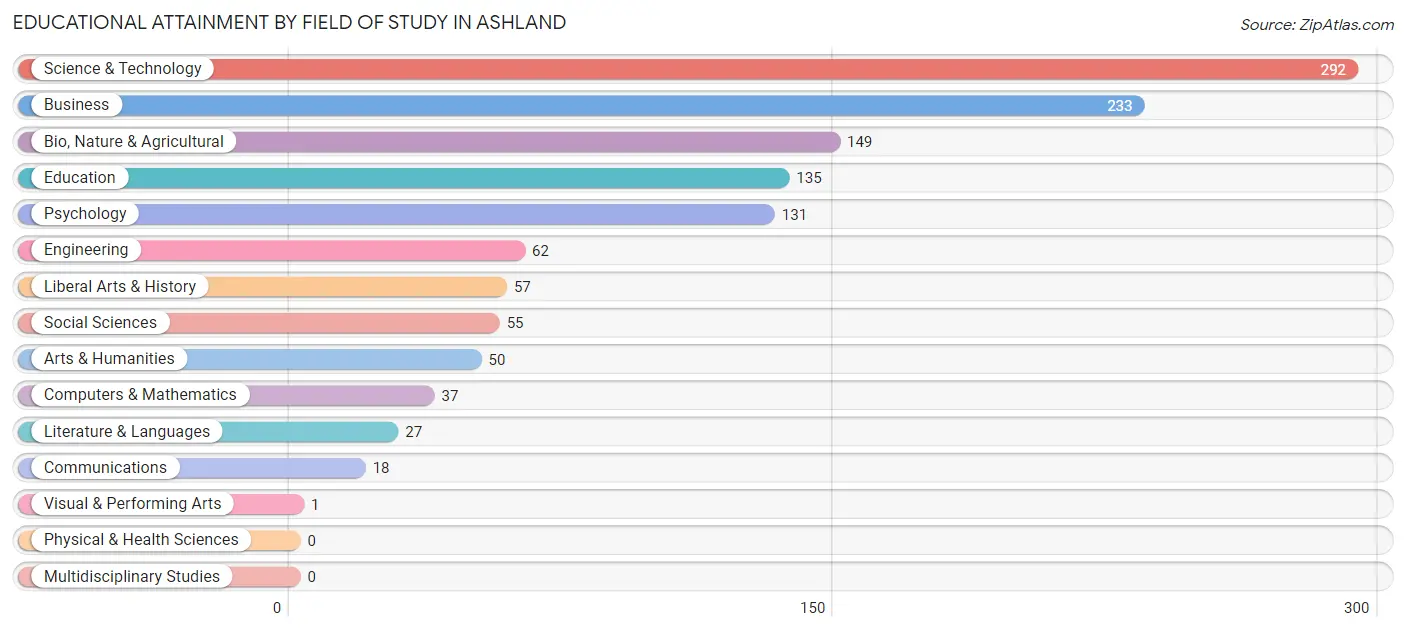
| Field of Study | # Graduates | % Graduates |
| Computers & Mathematics | 37 | 3.0% |
| Bio, Nature & Agricultural | 149 | 11.9% |
| Physical & Health Sciences | 0 | 0.0% |
| Psychology | 131 | 10.5% |
| Social Sciences | 55 | 4.4% |
| Engineering | 62 | 5.0% |
| Multidisciplinary Studies | 0 | 0.0% |
| Science & Technology | 292 | 23.4% |
| Business | 233 | 18.7% |
| Education | 135 | 10.8% |
| Literature & Languages | 27 | 2.2% |
| Liberal Arts & History | 57 | 4.6% |
| Visual & Performing Arts | 1 | 0.1% |
| Communications | 18 | 1.4% |
| Arts & Humanities | 50 | 4.0% |
| Total | 1,247 | 100.0% |
Transportation & Commute in Ashland
Vehicle Availability by Sex in Ashland
The most prevalent vehicle ownership categories in Ashland are males with 2 vehicles (758, accounting for 54.6%) and females with 2 vehicles (810, making up 53.5%).
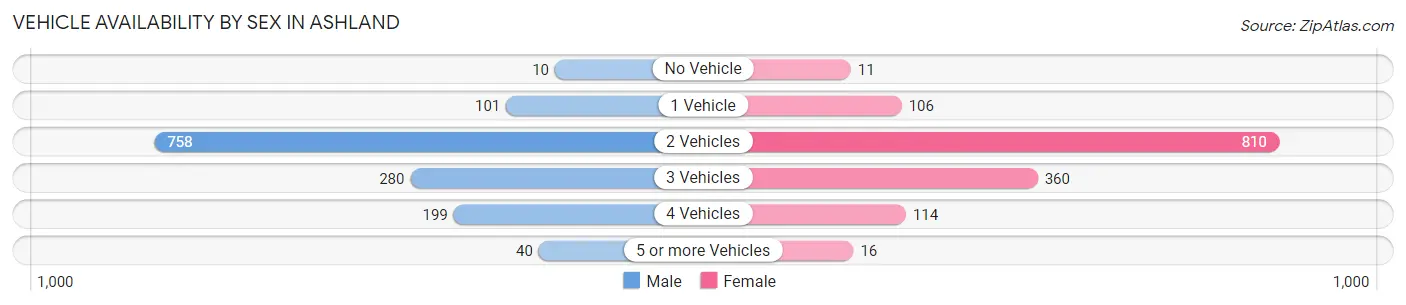
| Vehicles Available | Male | Female |
| No Vehicle | 10 (0.7%) | 11 (0.8%) |
| 1 Vehicle | 101 (7.3%) | 106 (7.5%) |
| 2 Vehicles | 758 (54.6%) | 810 (57.2%) |
| 3 Vehicles | 280 (20.2%) | 360 (25.4%) |
| 4 Vehicles | 199 (14.3%) | 114 (8.1%) |
| 5 or more Vehicles | 40 (2.9%) | 16 (1.1%) |
| Total | 1,388 (100.0%) | 1,417 (100.0%) |
Commute Time in Ashland
The most frequently occuring commute durations in Ashland are 15 to 19 minutes (816 commuters, 31.4%), 20 to 24 minutes (733 commuters, 28.2%), and 25 to 29 minutes (439 commuters, 16.9%).
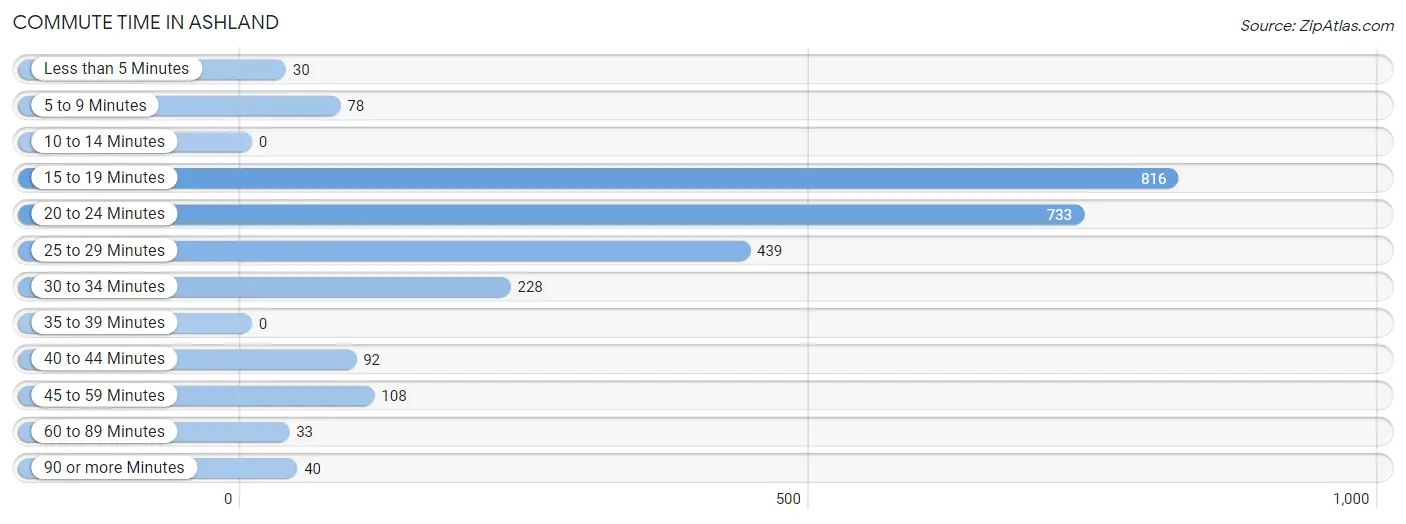
| Commute Time | # Commuters | % Commuters |
| Less than 5 Minutes | 30 | 1.2% |
| 5 to 9 Minutes | 78 | 3.0% |
| 10 to 14 Minutes | 0 | 0.0% |
| 15 to 19 Minutes | 816 | 31.4% |
| 20 to 24 Minutes | 733 | 28.2% |
| 25 to 29 Minutes | 439 | 16.9% |
| 30 to 34 Minutes | 228 | 8.8% |
| 35 to 39 Minutes | 0 | 0.0% |
| 40 to 44 Minutes | 92 | 3.5% |
| 45 to 59 Minutes | 108 | 4.2% |
| 60 to 89 Minutes | 33 | 1.3% |
| 90 or more Minutes | 40 | 1.5% |
Commute Time by Sex in Ashland
The most common commute times in Ashland are 15 to 19 minutes (445 commuters, 33.0%) for males and 15 to 19 minutes (371 commuters, 29.7%) for females.
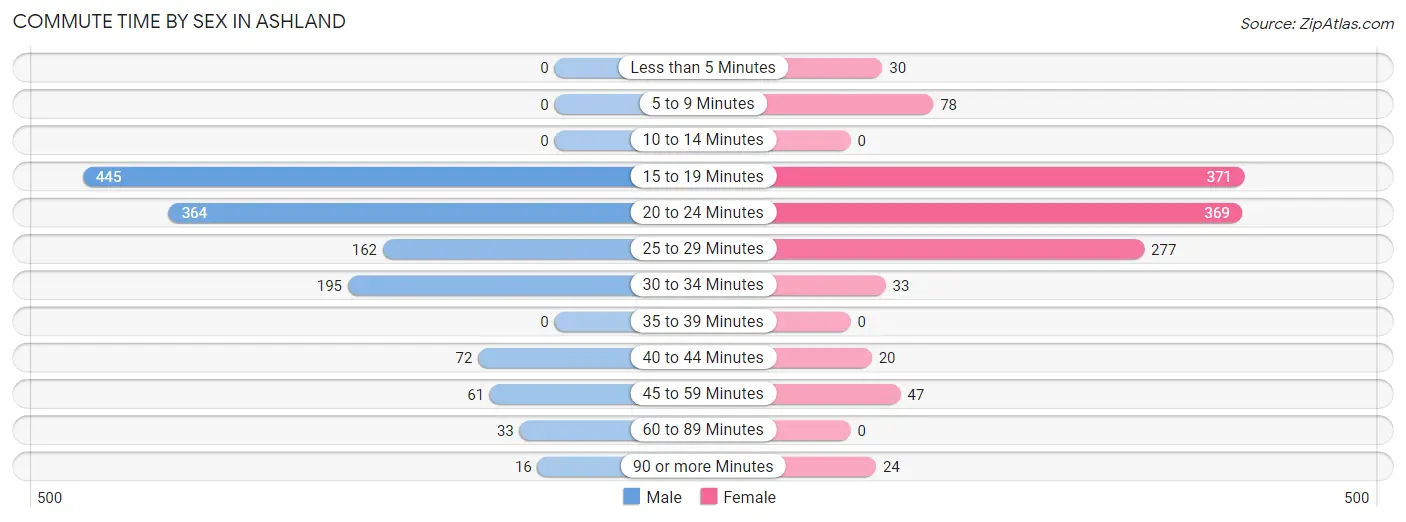
| Commute Time | Male | Female |
| Less than 5 Minutes | 0 (0.0%) | 30 (2.4%) |
| 5 to 9 Minutes | 0 (0.0%) | 78 (6.2%) |
| 10 to 14 Minutes | 0 (0.0%) | 0 (0.0%) |
| 15 to 19 Minutes | 445 (33.0%) | 371 (29.7%) |
| 20 to 24 Minutes | 364 (27.0%) | 369 (29.5%) |
| 25 to 29 Minutes | 162 (12.0%) | 277 (22.2%) |
| 30 to 34 Minutes | 195 (14.5%) | 33 (2.6%) |
| 35 to 39 Minutes | 0 (0.0%) | 0 (0.0%) |
| 40 to 44 Minutes | 72 (5.3%) | 20 (1.6%) |
| 45 to 59 Minutes | 61 (4.5%) | 47 (3.8%) |
| 60 to 89 Minutes | 33 (2.5%) | 0 (0.0%) |
| 90 or more Minutes | 16 (1.2%) | 24 (1.9%) |
Time of Departure to Work by Sex in Ashland
The most frequent times of departure to work in Ashland are 6:00 AM to 6:29 AM (259, 19.2%) for males and 7:30 AM to 7:59 AM (406, 32.5%) for females.
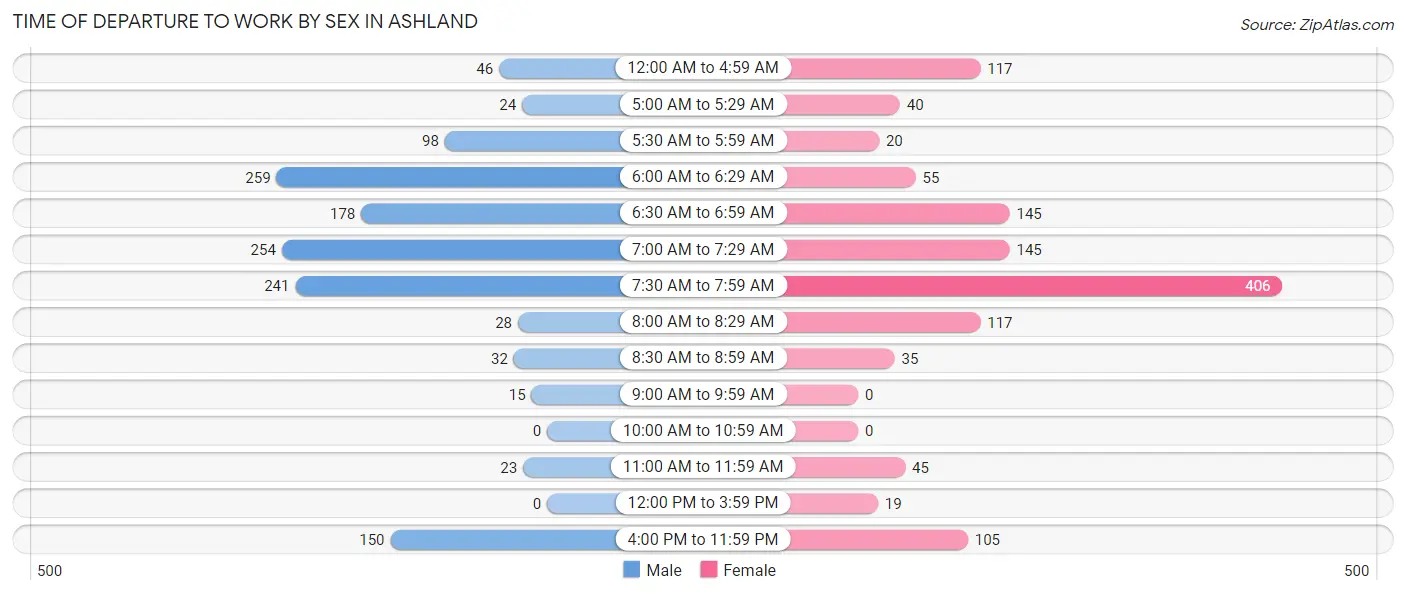
| Time of Departure | Male | Female |
| 12:00 AM to 4:59 AM | 46 (3.4%) | 117 (9.4%) |
| 5:00 AM to 5:29 AM | 24 (1.8%) | 40 (3.2%) |
| 5:30 AM to 5:59 AM | 98 (7.3%) | 20 (1.6%) |
| 6:00 AM to 6:29 AM | 259 (19.2%) | 55 (4.4%) |
| 6:30 AM to 6:59 AM | 178 (13.2%) | 145 (11.6%) |
| 7:00 AM to 7:29 AM | 254 (18.8%) | 145 (11.6%) |
| 7:30 AM to 7:59 AM | 241 (17.9%) | 406 (32.5%) |
| 8:00 AM to 8:29 AM | 28 (2.1%) | 117 (9.4%) |
| 8:30 AM to 8:59 AM | 32 (2.4%) | 35 (2.8%) |
| 9:00 AM to 9:59 AM | 15 (1.1%) | 0 (0.0%) |
| 10:00 AM to 10:59 AM | 0 (0.0%) | 0 (0.0%) |
| 11:00 AM to 11:59 AM | 23 (1.7%) | 45 (3.6%) |
| 12:00 PM to 3:59 PM | 0 (0.0%) | 19 (1.5%) |
| 4:00 PM to 11:59 PM | 150 (11.1%) | 105 (8.4%) |
| Total | 1,348 (100.0%) | 1,249 (100.0%) |
Housing Occupancy in Ashland
Occupancy by Ownership in Ashland
Of the total 2,101 dwellings in Ashland, owner-occupied units account for 1,335 (63.5%), while renter-occupied units make up 766 (36.5%).
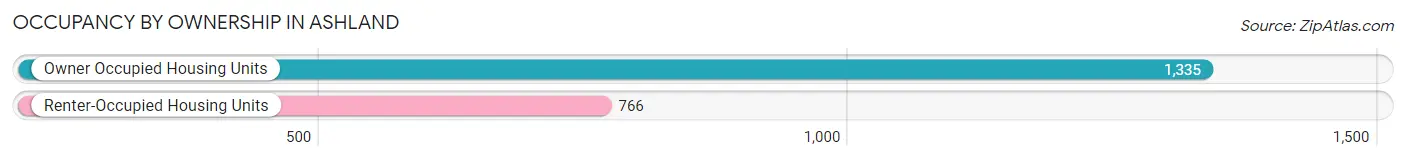
| Occupancy | # Housing Units | % Housing Units |
| Owner Occupied Housing Units | 1,335 | 63.5% |
| Renter-Occupied Housing Units | 766 | 36.5% |
| Total Occupied Housing Units | 2,101 | 100.0% |
Occupancy by Household Size in Ashland
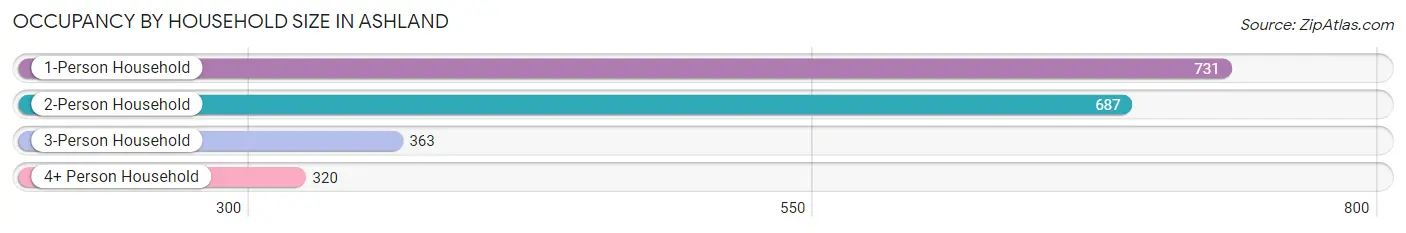
| Household Size | # Housing Units | % Housing Units |
| 1-Person Household | 731 | 34.8% |
| 2-Person Household | 687 | 32.7% |
| 3-Person Household | 363 | 17.3% |
| 4+ Person Household | 320 | 15.2% |
| Total Housing Units | 2,101 | 100.0% |
Occupancy by Ownership by Household Size in Ashland
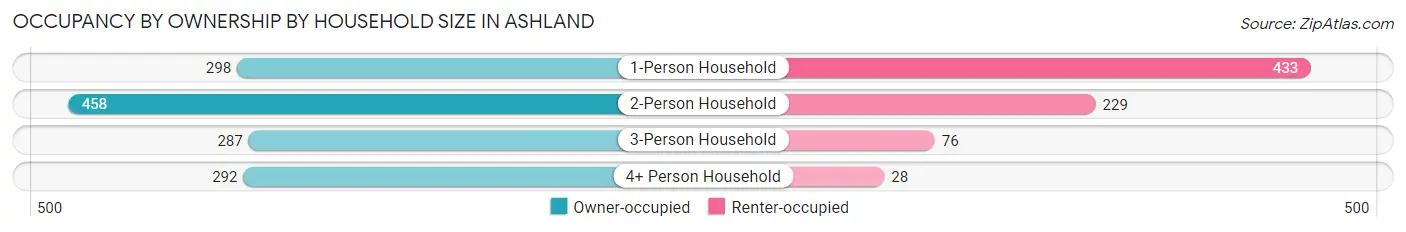
| Household Size | Owner-occupied | Renter-occupied |
| 1-Person Household | 298 (40.8%) | 433 (59.2%) |
| 2-Person Household | 458 (66.7%) | 229 (33.3%) |
| 3-Person Household | 287 (79.1%) | 76 (20.9%) |
| 4+ Person Household | 292 (91.2%) | 28 (8.7%) |
| Total Housing Units | 1,335 (63.5%) | 766 (36.5%) |
Occupancy by Educational Attainment in Ashland
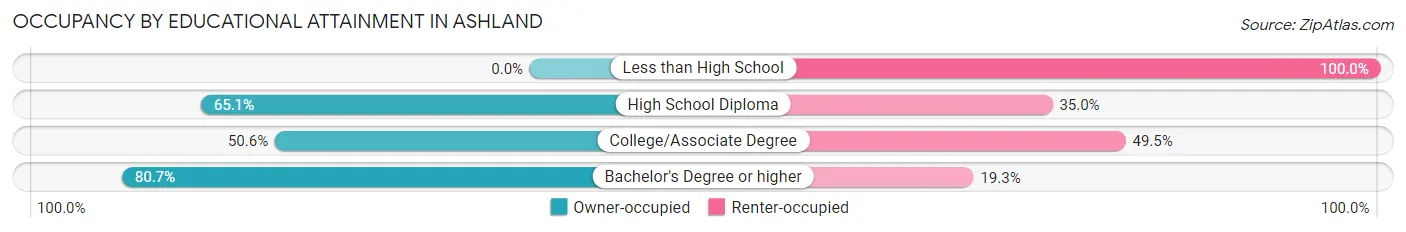
| Household Size | Owner-occupied | Renter-occupied |
| Less than High School | 0 (0.0%) | 99 (100.0%) |
| High School Diploma | 376 (65.0%) | 202 (34.9%) |
| College/Associate Degree | 319 (50.5%) | 312 (49.4%) |
| Bachelor's Degree or higher | 640 (80.7%) | 153 (19.3%) |
Occupancy by Age of Householder in Ashland
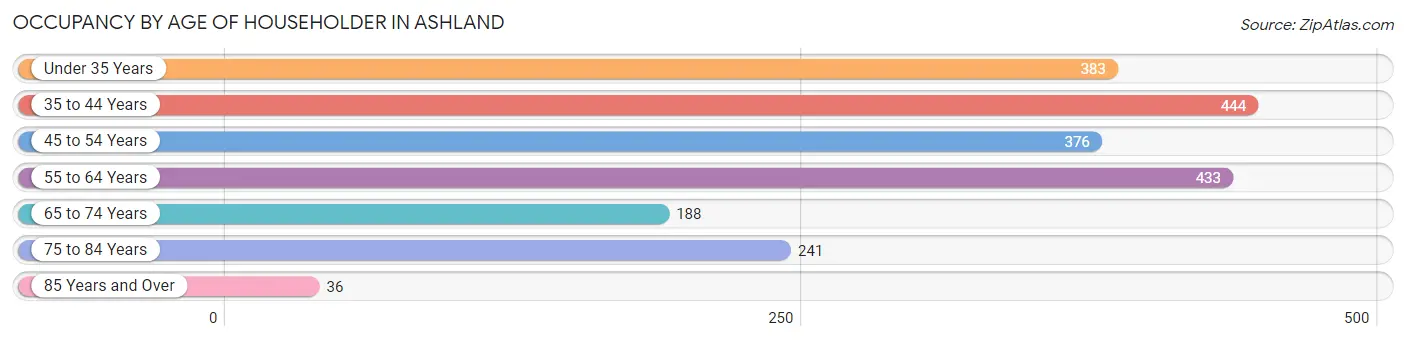
| Age Bracket | # Households | % Households |
| Under 35 Years | 383 | 18.2% |
| 35 to 44 Years | 444 | 21.1% |
| 45 to 54 Years | 376 | 17.9% |
| 55 to 64 Years | 433 | 20.6% |
| 65 to 74 Years | 188 | 8.9% |
| 75 to 84 Years | 241 | 11.5% |
| 85 Years and Over | 36 | 1.7% |
| Total | 2,101 | 100.0% |
Housing Finances in Ashland
Median Income by Occupancy in Ashland
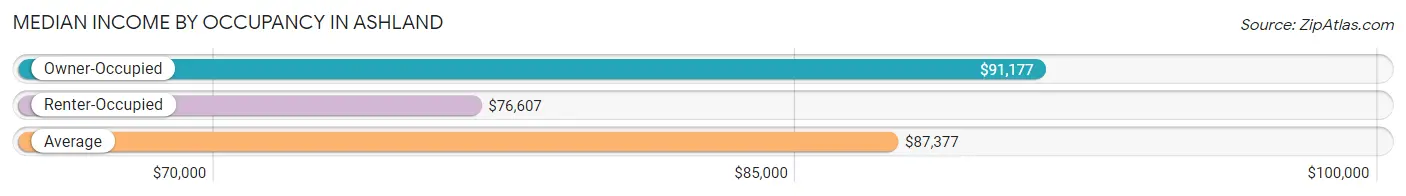
| Occupancy Type | # Households | Median Income |
| Owner-Occupied | 1,335 (63.5%) | $91,177 |
| Renter-Occupied | 766 (36.5%) | $76,607 |
| Average | 2,101 (100.0%) | $87,377 |
Occupancy by Householder Income Bracket in Ashland
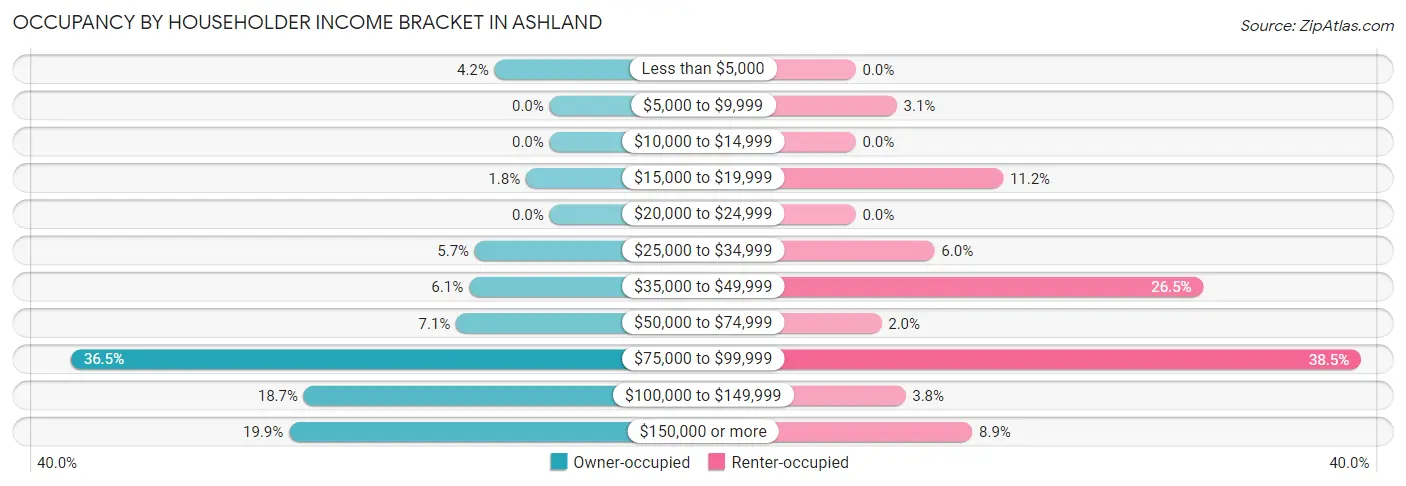
| Income Bracket | Owner-occupied | Renter-occupied |
| Less than $5,000 | 56 (4.2%) | 0 (0.0%) |
| $5,000 to $9,999 | 0 (0.0%) | 24 (3.1%) |
| $10,000 to $14,999 | 0 (0.0%) | 0 (0.0%) |
| $15,000 to $19,999 | 24 (1.8%) | 86 (11.2%) |
| $20,000 to $24,999 | 0 (0.0%) | 0 (0.0%) |
| $25,000 to $34,999 | 76 (5.7%) | 46 (6.0%) |
| $35,000 to $49,999 | 82 (6.1%) | 203 (26.5%) |
| $50,000 to $74,999 | 95 (7.1%) | 15 (2.0%) |
| $75,000 to $99,999 | 487 (36.5%) | 295 (38.5%) |
| $100,000 to $149,999 | 250 (18.7%) | 29 (3.8%) |
| $150,000 or more | 265 (19.9%) | 68 (8.9%) |
| Total | 1,335 (100.0%) | 766 (100.0%) |
Monthly Housing Cost Tiers in Ashland
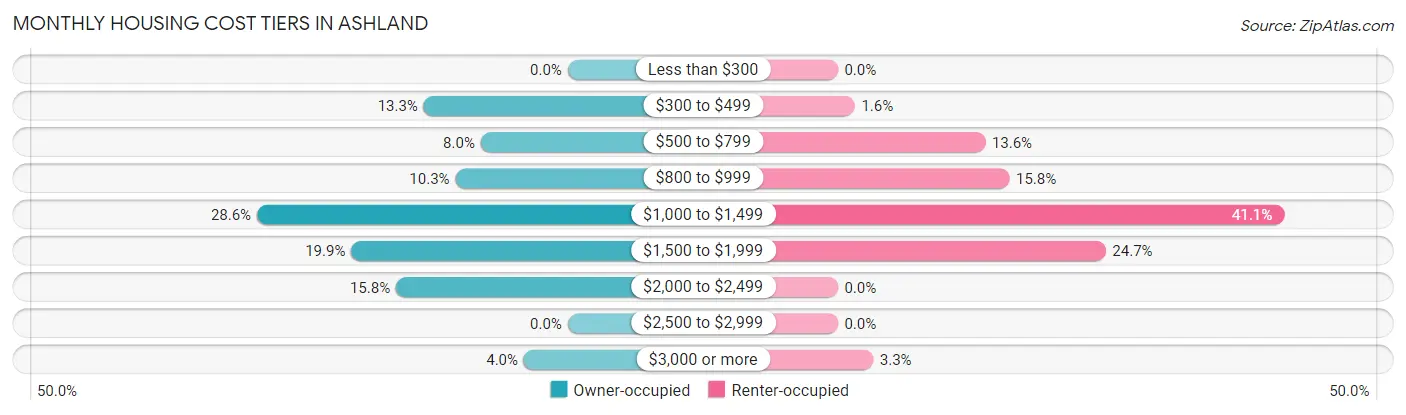
| Monthly Cost | Owner-occupied | Renter-occupied |
| Less than $300 | 0 (0.0%) | 0 (0.0%) |
| $300 to $499 | 177 (13.3%) | 12 (1.6%) |
| $500 to $799 | 107 (8.0%) | 104 (13.6%) |
| $800 to $999 | 138 (10.3%) | 121 (15.8%) |
| $1,000 to $1,499 | 382 (28.6%) | 315 (41.1%) |
| $1,500 to $1,999 | 266 (19.9%) | 189 (24.7%) |
| $2,000 to $2,499 | 211 (15.8%) | 0 (0.0%) |
| $2,500 to $2,999 | 0 (0.0%) | 0 (0.0%) |
| $3,000 or more | 54 (4.0%) | 25 (3.3%) |
| Total | 1,335 (100.0%) | 766 (100.0%) |
Physical Housing Characteristics in Ashland
Housing Structures in Ashland
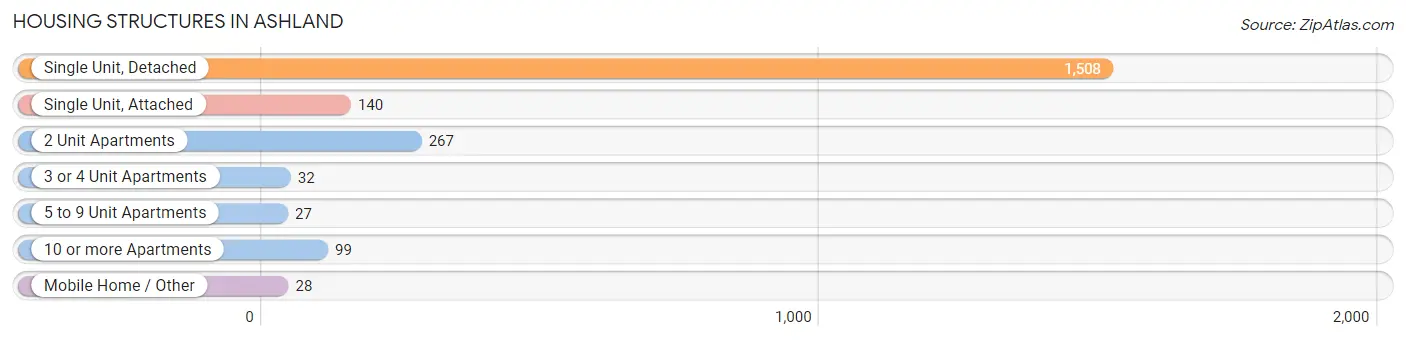
| Structure Type | # Housing Units | % Housing Units |
| Single Unit, Detached | 1,508 | 71.8% |
| Single Unit, Attached | 140 | 6.7% |
| 2 Unit Apartments | 267 | 12.7% |
| 3 or 4 Unit Apartments | 32 | 1.5% |
| 5 to 9 Unit Apartments | 27 | 1.3% |
| 10 or more Apartments | 99 | 4.7% |
| Mobile Home / Other | 28 | 1.3% |
| Total | 2,101 | 100.0% |
Housing Structures by Occupancy in Ashland
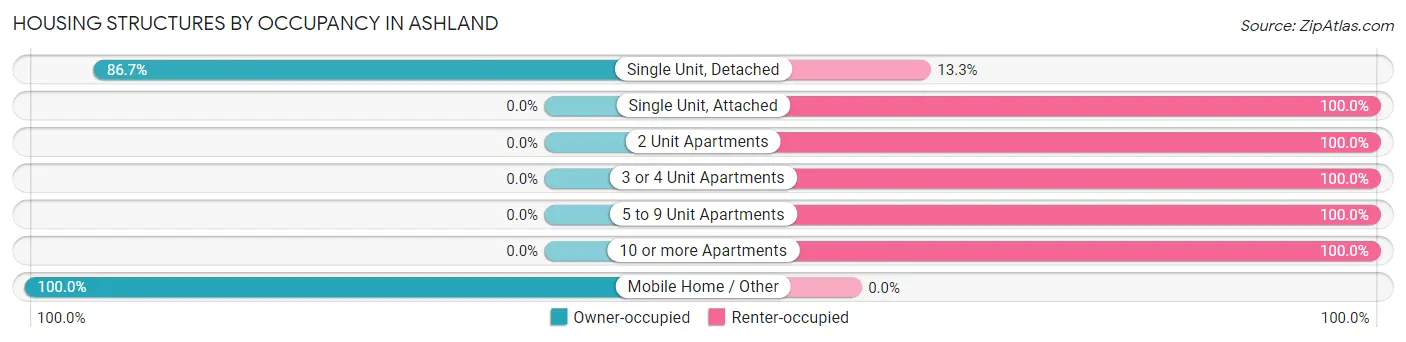
| Structure Type | Owner-occupied | Renter-occupied |
| Single Unit, Detached | 1,307 (86.7%) | 201 (13.3%) |
| Single Unit, Attached | 0 (0.0%) | 140 (100.0%) |
| 2 Unit Apartments | 0 (0.0%) | 267 (100.0%) |
| 3 or 4 Unit Apartments | 0 (0.0%) | 32 (100.0%) |
| 5 to 9 Unit Apartments | 0 (0.0%) | 27 (100.0%) |
| 10 or more Apartments | 0 (0.0%) | 99 (100.0%) |
| Mobile Home / Other | 28 (100.0%) | 0 (0.0%) |
| Total | 1,335 (63.5%) | 766 (36.5%) |
Housing Structures by Number of Rooms in Ashland
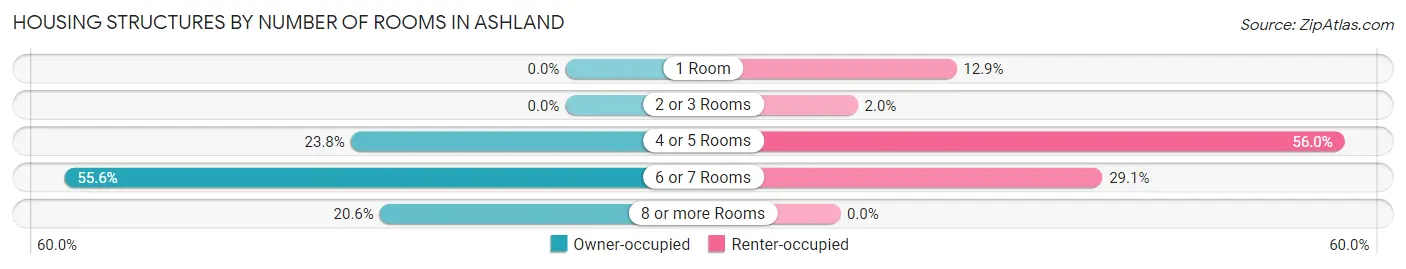
| Number of Rooms | Owner-occupied | Renter-occupied |
| 1 Room | 0 (0.0%) | 99 (12.9%) |
| 2 or 3 Rooms | 0 (0.0%) | 15 (2.0%) |
| 4 or 5 Rooms | 318 (23.8%) | 429 (56.0%) |
| 6 or 7 Rooms | 742 (55.6%) | 223 (29.1%) |
| 8 or more Rooms | 275 (20.6%) | 0 (0.0%) |
| Total | 1,335 (100.0%) | 766 (100.0%) |
Housing Structure by Heating Type in Ashland
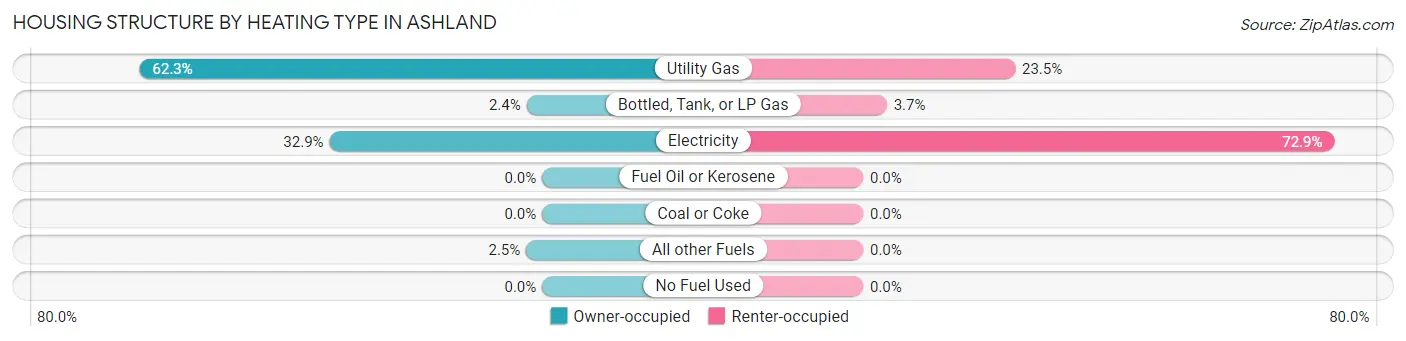
| Heating Type | Owner-occupied | Renter-occupied |
| Utility Gas | 831 (62.3%) | 180 (23.5%) |
| Bottled, Tank, or LP Gas | 32 (2.4%) | 28 (3.7%) |
| Electricity | 439 (32.9%) | 558 (72.9%) |
| Fuel Oil or Kerosene | 0 (0.0%) | 0 (0.0%) |
| Coal or Coke | 0 (0.0%) | 0 (0.0%) |
| All other Fuels | 33 (2.5%) | 0 (0.0%) |
| No Fuel Used | 0 (0.0%) | 0 (0.0%) |
| Total | 1,335 (100.0%) | 766 (100.0%) |
Household Vehicle Usage in Ashland
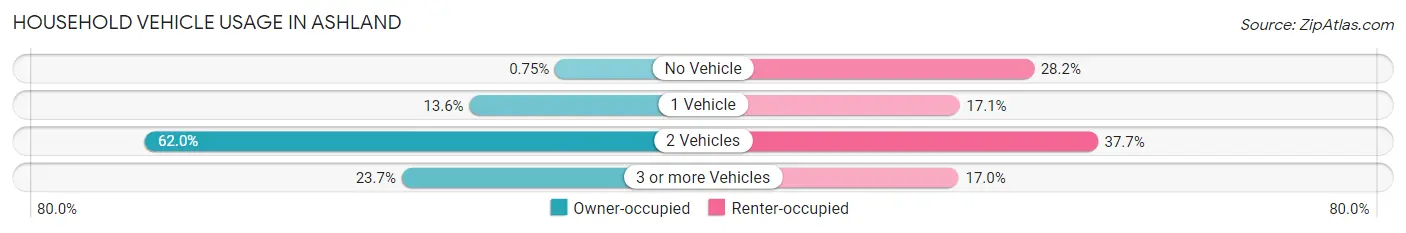
| Vehicles per Household | Owner-occupied | Renter-occupied |
| No Vehicle | 10 (0.7%) | 216 (28.2%) |
| 1 Vehicle | 181 (13.6%) | 131 (17.1%) |
| 2 Vehicles | 828 (62.0%) | 289 (37.7%) |
| 3 or more Vehicles | 316 (23.7%) | 130 (17.0%) |
| Total | 1,335 (100.0%) | 766 (100.0%) |
Real Estate & Mortgages in Ashland
Real Estate and Mortgage Overview in Ashland
| Characteristic | Without Mortgage | With Mortgage |
| Housing Units | 284 | 1,051 |
| Median Property Value | $198,200 | $240,000 |
| Median Household Income | $68,854 | $191 |
| Monthly Housing Costs | $471 | $54 |
| Real Estate Taxes | $1,895 | $0 |
Property Value by Mortgage Status in Ashland
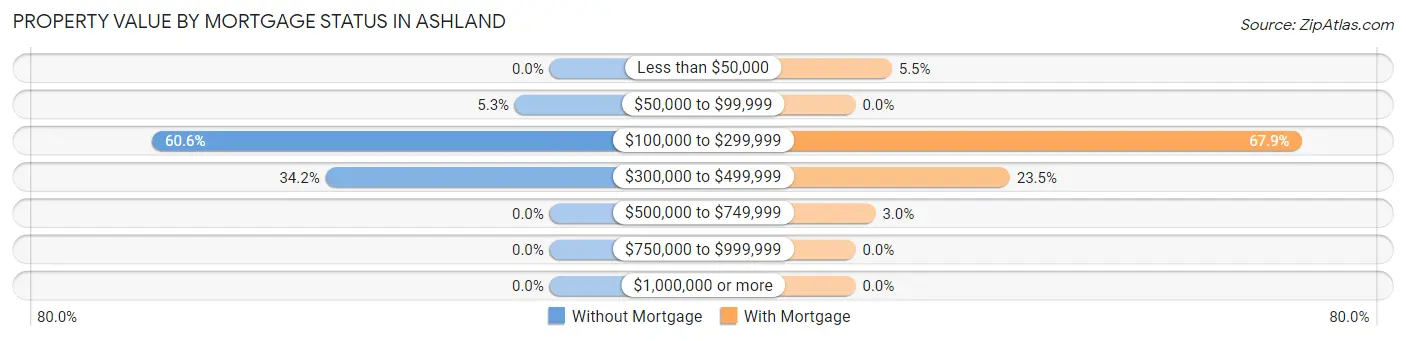
| Property Value | Without Mortgage | With Mortgage |
| Less than $50,000 | 0 (0.0%) | 58 (5.5%) |
| $50,000 to $99,999 | 15 (5.3%) | 0 (0.0%) |
| $100,000 to $299,999 | 172 (60.6%) | 714 (67.9%) |
| $300,000 to $499,999 | 97 (34.2%) | 247 (23.5%) |
| $500,000 to $749,999 | 0 (0.0%) | 32 (3.0%) |
| $750,000 to $999,999 | 0 (0.0%) | 0 (0.0%) |
| $1,000,000 or more | 0 (0.0%) | 0 (0.0%) |
| Total | 284 (100.0%) | 1,051 (100.0%) |
Household Income by Mortgage Status in Ashland
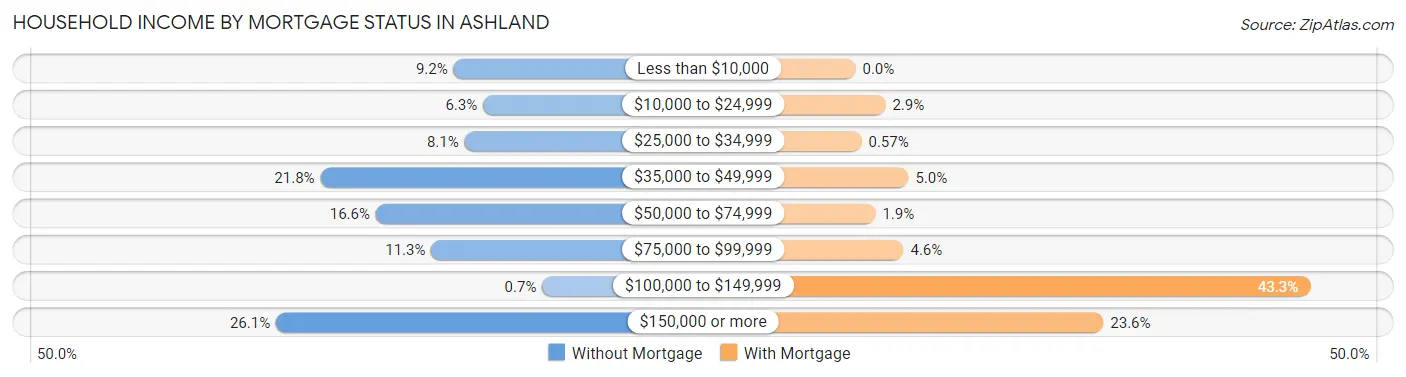
| Household Income | Without Mortgage | With Mortgage |
| Less than $10,000 | 26 (9.1%) | 0 (0.0%) |
| $10,000 to $24,999 | 18 (6.3%) | 30 (2.9%) |
| $25,000 to $34,999 | 23 (8.1%) | 6 (0.6%) |
| $35,000 to $49,999 | 62 (21.8%) | 53 (5.0%) |
| $50,000 to $74,999 | 47 (16.6%) | 20 (1.9%) |
| $75,000 to $99,999 | 32 (11.3%) | 48 (4.6%) |
| $100,000 to $149,999 | 2 (0.7%) | 455 (43.3%) |
| $150,000 or more | 74 (26.1%) | 248 (23.6%) |
| Total | 284 (100.0%) | 1,051 (100.0%) |
Property Value to Household Income Ratio in Ashland
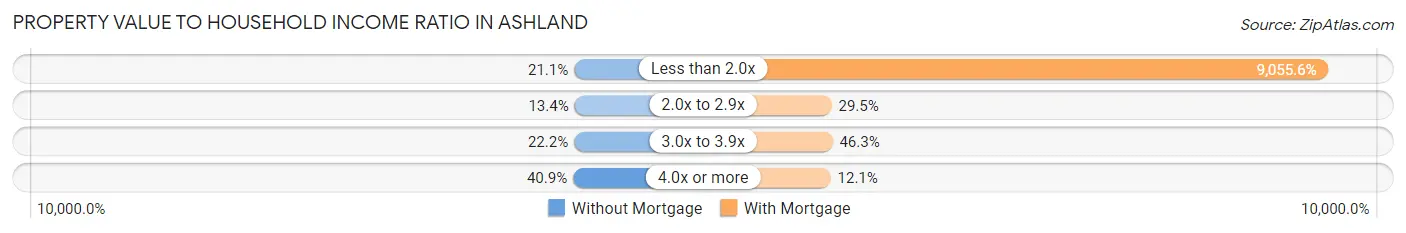
| Value-to-Income Ratio | Without Mortgage | With Mortgage |
| Less than 2.0x | 60 (21.1%) | 95,174 (9,055.6%) |
| 2.0x to 2.9x | 38 (13.4%) | 310 (29.5%) |
| 3.0x to 3.9x | 63 (22.2%) | 487 (46.3%) |
| 4.0x or more | 116 (40.8%) | 127 (12.1%) |
| Total | 284 (100.0%) | 1,051 (100.0%) |
Real Estate Taxes by Mortgage Status in Ashland
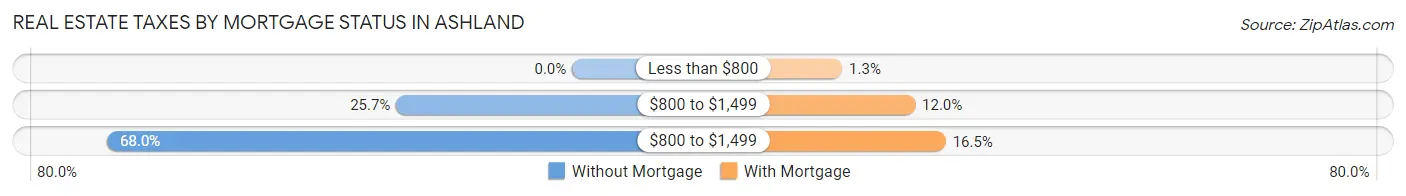
| Property Taxes | Without Mortgage | With Mortgage |
| Less than $800 | 0 (0.0%) | 14 (1.3%) |
| $800 to $1,499 | 73 (25.7%) | 126 (12.0%) |
| $800 to $1,499 | 193 (68.0%) | 173 (16.5%) |
| Total | 284 (100.0%) | 1,051 (100.0%) |
Health & Disability in Ashland
Health Insurance Coverage by Age in Ashland
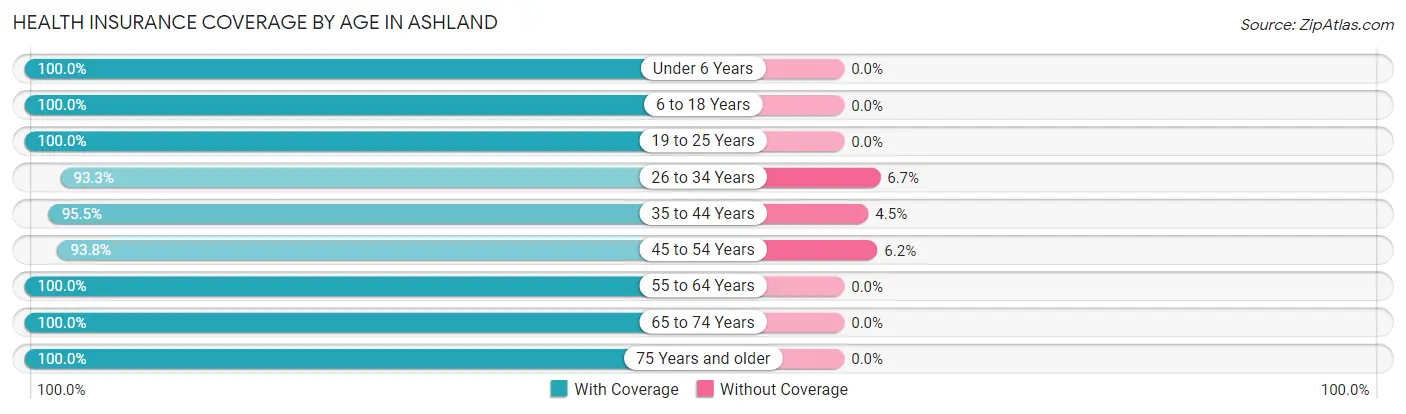
| Age Bracket | With Coverage | Without Coverage |
| Under 6 Years | 393 (100.0%) | 0 (0.0%) |
| 6 to 18 Years | 579 (100.0%) | 0 (0.0%) |
| 19 to 25 Years | 322 (100.0%) | 0 (0.0%) |
| 26 to 34 Years | 640 (93.3%) | 46 (6.7%) |
| 35 to 44 Years | 679 (95.5%) | 32 (4.5%) |
| 45 to 54 Years | 608 (93.8%) | 40 (6.2%) |
| 55 to 64 Years | 719 (100.0%) | 0 (0.0%) |
| 65 to 74 Years | 276 (100.0%) | 0 (0.0%) |
| 75 Years and older | 331 (100.0%) | 0 (0.0%) |
| Total | 4,547 (97.5%) | 118 (2.5%) |
Health Insurance Coverage by Citizenship Status in Ashland
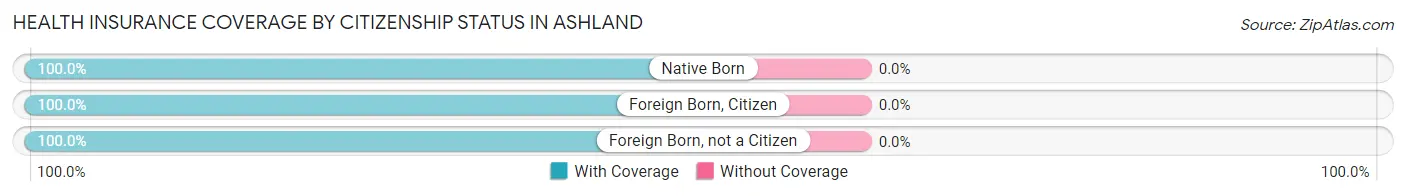
| Citizenship Status | With Coverage | Without Coverage |
| Native Born | 393 (100.0%) | 0 (0.0%) |
| Foreign Born, Citizen | 579 (100.0%) | 0 (0.0%) |
| Foreign Born, not a Citizen | 322 (100.0%) | 0 (0.0%) |
Health Insurance Coverage by Household Income in Ashland
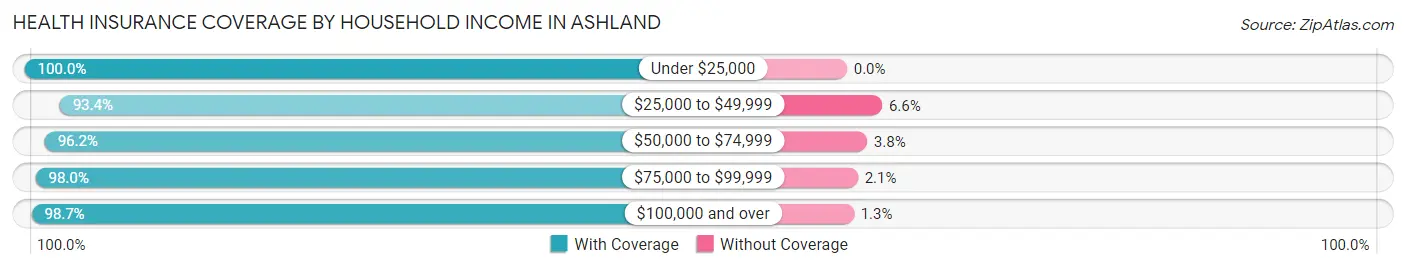
| Household Income | With Coverage | Without Coverage |
| Under $25,000 | 208 (100.0%) | 0 (0.0%) |
| $25,000 to $49,999 | 595 (93.4%) | 42 (6.6%) |
| $50,000 to $74,999 | 230 (96.2%) | 9 (3.8%) |
| $75,000 to $99,999 | 1,532 (98.0%) | 32 (2.1%) |
| $100,000 and over | 1,982 (98.7%) | 26 (1.3%) |
Public vs Private Health Insurance Coverage by Age in Ashland
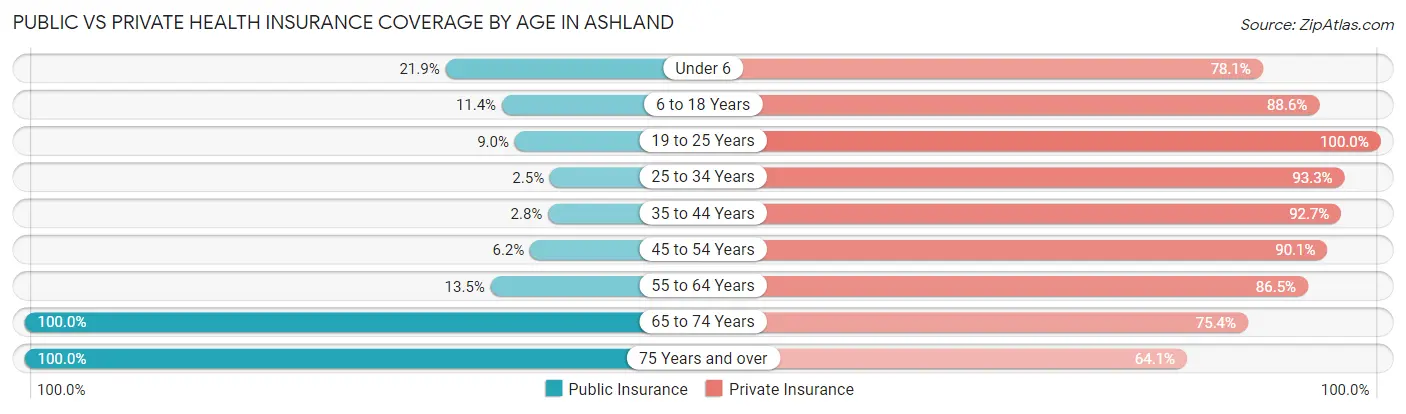
| Age Bracket | Public Insurance | Private Insurance |
| Under 6 | 86 (21.9%) | 307 (78.1%) |
| 6 to 18 Years | 66 (11.4%) | 513 (88.6%) |
| 19 to 25 Years | 29 (9.0%) | 322 (100.0%) |
| 25 to 34 Years | 17 (2.5%) | 640 (93.3%) |
| 35 to 44 Years | 20 (2.8%) | 659 (92.7%) |
| 45 to 54 Years | 40 (6.2%) | 584 (90.1%) |
| 55 to 64 Years | 97 (13.5%) | 622 (86.5%) |
| 65 to 74 Years | 276 (100.0%) | 208 (75.4%) |
| 75 Years and over | 331 (100.0%) | 212 (64.0%) |
| Total | 962 (20.6%) | 4,067 (87.2%) |
Disability Status by Sex by Age in Ashland
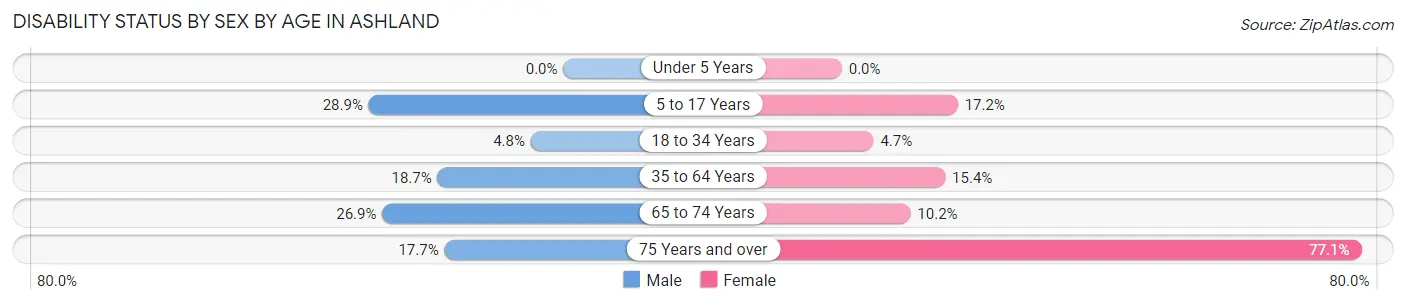
| Age Bracket | Male | Female |
| Under 5 Years | 0 (0.0%) | 0 (0.0%) |
| 5 to 17 Years | 63 (28.9%) | 85 (17.2%) |
| 18 to 34 Years | 21 (4.8%) | 27 (4.7%) |
| 35 to 64 Years | 196 (18.7%) | 158 (15.3%) |
| 65 to 74 Years | 32 (26.9%) | 16 (10.2%) |
| 75 Years and over | 9 (17.6%) | 216 (77.1%) |
Disability Class by Sex by Age in Ashland
Disability Class: Hearing Difficulty
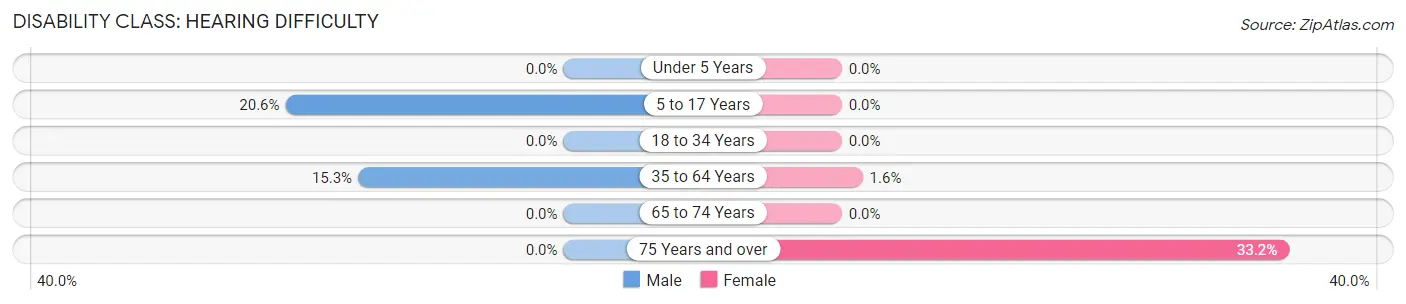
| Age Bracket | Male | Female |
| Under 5 Years | 0 (0.0%) | 0 (0.0%) |
| 5 to 17 Years | 45 (20.6%) | 0 (0.0%) |
| 18 to 34 Years | 0 (0.0%) | 0 (0.0%) |
| 35 to 64 Years | 160 (15.2%) | 16 (1.5%) |
| 65 to 74 Years | 0 (0.0%) | 0 (0.0%) |
| 75 Years and over | 0 (0.0%) | 93 (33.2%) |
Disability Class: Vision Difficulty
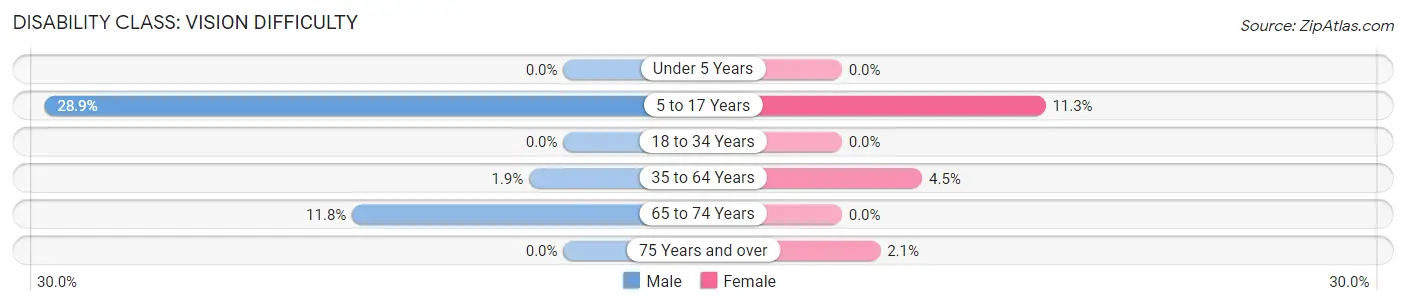
| Age Bracket | Male | Female |
| Under 5 Years | 0 (0.0%) | 0 (0.0%) |
| 5 to 17 Years | 63 (28.9%) | 56 (11.3%) |
| 18 to 34 Years | 0 (0.0%) | 0 (0.0%) |
| 35 to 64 Years | 20 (1.9%) | 46 (4.5%) |
| 65 to 74 Years | 14 (11.8%) | 0 (0.0%) |
| 75 Years and over | 0 (0.0%) | 6 (2.1%) |
Disability Class: Cognitive Difficulty
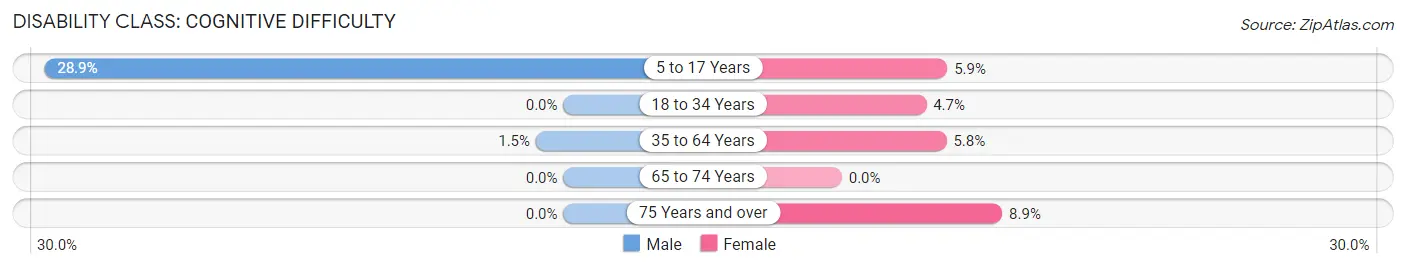
| Age Bracket | Male | Female |
| 5 to 17 Years | 63 (28.9%) | 29 (5.9%) |
| 18 to 34 Years | 0 (0.0%) | 27 (4.7%) |
| 35 to 64 Years | 16 (1.5%) | 60 (5.8%) |
| 65 to 74 Years | 0 (0.0%) | 0 (0.0%) |
| 75 Years and over | 0 (0.0%) | 25 (8.9%) |
Disability Class: Ambulatory Difficulty
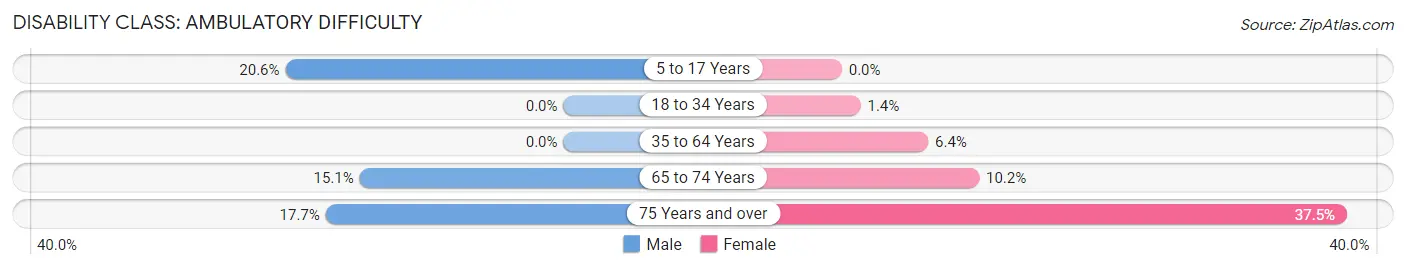
| Age Bracket | Male | Female |
| 5 to 17 Years | 45 (20.6%) | 0 (0.0%) |
| 18 to 34 Years | 0 (0.0%) | 8 (1.4%) |
| 35 to 64 Years | 0 (0.0%) | 66 (6.4%) |
| 65 to 74 Years | 18 (15.1%) | 16 (10.2%) |
| 75 Years and over | 9 (17.6%) | 105 (37.5%) |
Disability Class: Self-Care Difficulty
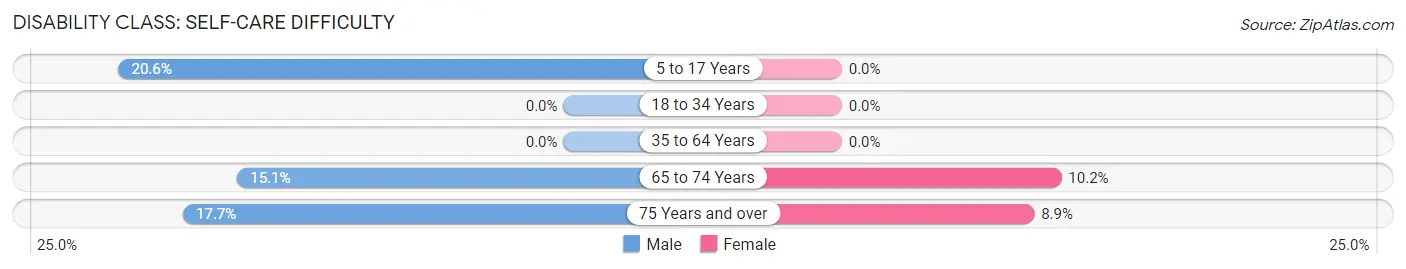
| Age Bracket | Male | Female |
| 5 to 17 Years | 45 (20.6%) | 0 (0.0%) |
| 18 to 34 Years | 0 (0.0%) | 0 (0.0%) |
| 35 to 64 Years | 0 (0.0%) | 0 (0.0%) |
| 65 to 74 Years | 18 (15.1%) | 16 (10.2%) |
| 75 Years and over | 9 (17.6%) | 25 (8.9%) |
Technology Access in Ashland
Computing Device Access in Ashland
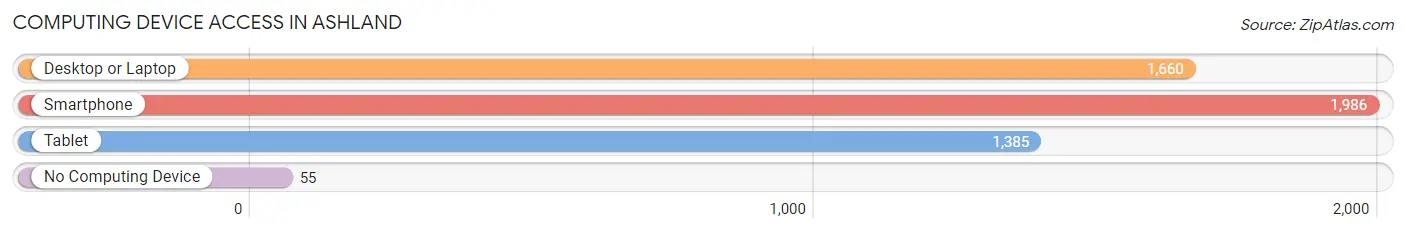
| Device Type | # Households | % Households |
| Desktop or Laptop | 1,660 | 79.0% |
| Smartphone | 1,986 | 94.5% |
| Tablet | 1,385 | 65.9% |
| No Computing Device | 55 | 2.6% |
| Total | 2,101 | 100.0% |
Internet Access in Ashland
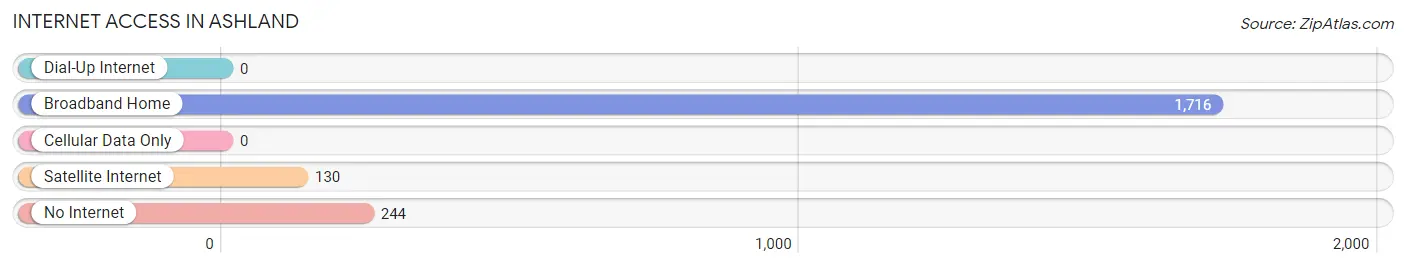
| Internet Type | # Households | % Households |
| Dial-Up Internet | 0 | 0.0% |
| Broadband Home | 1,716 | 81.7% |
| Cellular Data Only | 0 | 0.0% |
| Satellite Internet | 130 | 6.2% |
| No Internet | 244 | 11.6% |
| Total | 2,101 | 100.0% |
Ashland Summary
Ashland, Missouri is a small town located in the southeastern corner of the state, about 25 miles south of St. Louis. It is part of the St. Louis metropolitan area and is situated in the heart of the Ozark Mountains. The town has a population of approximately 4,000 people and is the county seat of Boone County.
History
The area that is now Ashland was first settled in 1819 by a group of settlers from Kentucky. The town was originally known as “Mudtown” due to the muddy conditions of the area. In 1837, the town was renamed Ashland after the estate of Henry Clay, a prominent Kentucky politician.
The town was officially incorporated in 1867 and quickly became a center of commerce and industry. The town was home to several factories, including a flour mill, a sawmill, and a brickyard. The town also had a railroad station, which connected it to St. Louis and other nearby towns.
In the late 19th century, Ashland was a popular tourist destination due to its proximity to the Ozark Mountains. The town was home to several resorts and hotels, as well as a popular amusement park.
Geography
Ashland is located in the southeastern corner of Missouri, about 25 miles south of St. Louis. The town is situated in the heart of the Ozark Mountains and is surrounded by rolling hills and forests. The town is located on the banks of the Missouri River and is part of the St. Louis metropolitan area.
The climate in Ashland is humid subtropical, with hot, humid summers and mild winters. The average annual temperature is around 57 degrees Fahrenheit. The town receives an average of 44 inches of precipitation per year.
Economy
The economy of Ashland is largely based on agriculture and tourism. The town is home to several farms, which produce a variety of crops, including corn, soybeans, and wheat. The town is also home to several wineries and breweries, which attract tourists from all over the region.
The town is also home to several small businesses, including restaurants, shops, and other services. The town is also home to several manufacturing companies, which produce a variety of products, including furniture, clothing, and electronics.
Demographics
As of the 2010 census, the population of Ashland was 4,000. The town is predominantly white, with about 90% of the population identifying as such. The town also has a small Hispanic population, with about 5% of the population identifying as such. The median household income in Ashland is around $45,000. The town has a low unemployment rate, with only about 4% of the population unemployed.
Common Questions
What is Per Capita Income in Ashland?
Per Capita income in Ashland is $41,216.
What is the Median Family Income in Ashland?
Median Family Income in Ashland is $97,065.
What is the Median Household income in Ashland?
Median Household Income in Ashland is $87,377.
What is Income or Wage Gap in Ashland?
Income or Wage Gap in Ashland is 31.7%.
Women in Ashland earn 68.3 cents for every dollar earned by a man.
What is Inequality or Gini Index in Ashland?
Inequality or Gini Index in Ashland is 0.32.
What is the Total Population of Ashland?
Total Population of Ashland is 4,730.
What is the Total Male Population of Ashland?
Total Male Population of Ashland is 1,999.
What is the Total Female Population of Ashland?
Total Female Population of Ashland is 2,731.
What is the Ratio of Males per 100 Females in Ashland?
There are 73.20 Males per 100 Females in Ashland.
What is the Ratio of Females per 100 Males in Ashland?
There are 136.62 Females per 100 Males in Ashland.
What is the Median Population Age in Ashland?
Median Population Age in Ashland is 41.0 Years.
What is the Average Family Size in Ashland
Average Family Size in Ashland is 2.8 People.
What is the Average Household Size in Ashland
Average Household Size in Ashland is 2.2 People.
How Large is the Labor Force in Ashland?
There are 2,849 People in the Labor Forcein in Ashland.
What is the Percentage of People in the Labor Force in Ashland?
73.0% of People are in the Labor Force in Ashland.
What is the Unemployment Rate in Ashland?
Unemployment Rate in Ashland is 0.7%.