Altamont, MO Map & Demographics
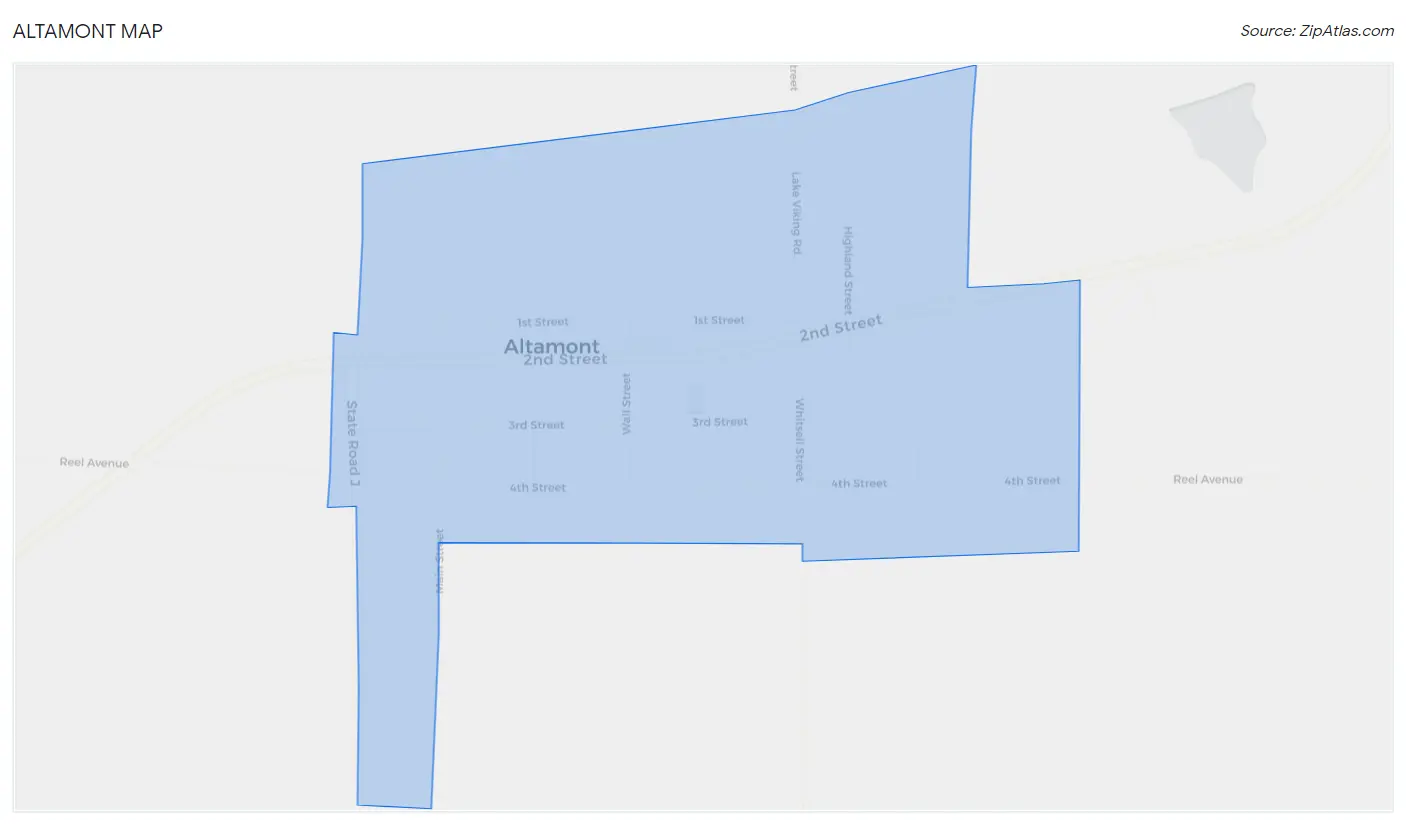
Altamont Map
Altamont Overview
$18,221
PER CAPITA INCOME
$43,750
AVG FAMILY INCOME
$40,000
AVG HOUSEHOLD INCOME
25.4%
WAGE / INCOME GAP [ % ]
74.6¢/ $1
WAGE / INCOME GAP [ $ ]
0.36
INEQUALITY / GINI INDEX
156
TOTAL POPULATION
88
MALE POPULATION
68
FEMALE POPULATION
129.41
MALES / 100 FEMALES
77.27
FEMALES / 100 MALES
44.3
MEDIAN AGE
4.1
AVG FAMILY SIZE
2.8
AVG HOUSEHOLD SIZE
54
LABOR FORCE [ PEOPLE ]
45.4%
PERCENT IN LABOR FORCE
Altamont Zip Codes
Altamont Area Codes
Income in Altamont
Income Overview in Altamont
Per Capita Income in Altamont is $18,221, while median incomes of families and households are $43,750 and $40,000 respectively.
| Characteristic | Number | Measure |
| Per Capita Income | 156 | $18,221 |
| Median Family Income | 28 | $43,750 |
| Mean Family Income | 28 | $55,296 |
| Median Household Income | 56 | $40,000 |
| Mean Household Income | 56 | $45,039 |
| Income Deficit | 28 | $0 |
| Wage / Income Gap (%) | 156 | 25.43% |
| Wage / Income Gap ($) | 156 | 74.57¢ per $1 |
| Gini / Inequality Index | 156 | 0.36 |
Earnings by Sex in Altamont
Average Earnings in Altamont are $31,250, $36,458 for men and $27,188 for women, a difference of 25.4%.
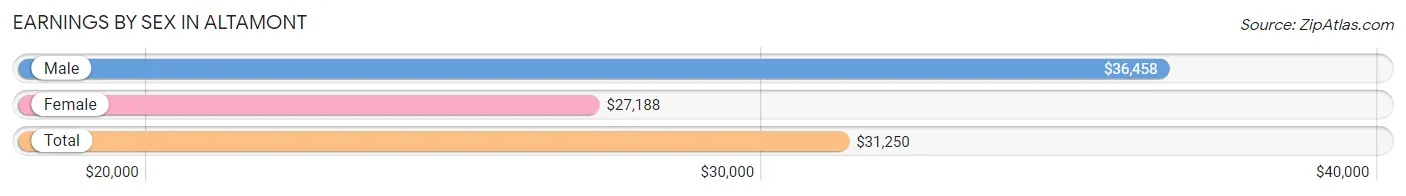
| Sex | Number | Average Earnings |
| Male | 35 (60.3%) | $36,458 |
| Female | 23 (39.7%) | $27,188 |
| Total | 58 (100.0%) | $31,250 |
Earnings by Sex by Income Bracket in Altamont
The most common earnings brackets in Altamont are $40,000 to $44,999 for men (10 | 28.6%) and $25,000 to $29,999 for women (6 | 26.1%).
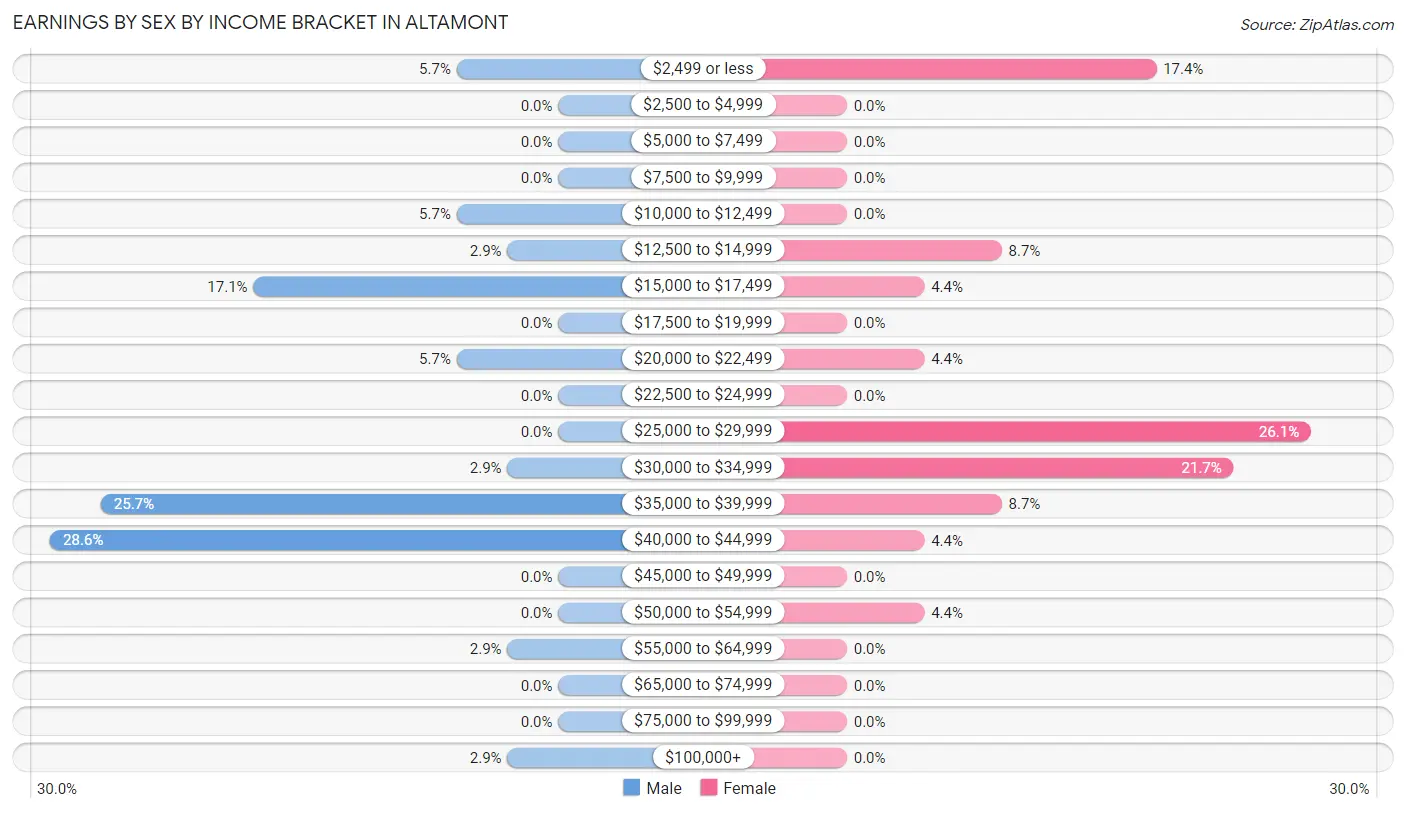
| Income | Male | Female |
| $2,499 or less | 2 (5.7%) | 4 (17.4%) |
| $2,500 to $4,999 | 0 (0.0%) | 0 (0.0%) |
| $5,000 to $7,499 | 0 (0.0%) | 0 (0.0%) |
| $7,500 to $9,999 | 0 (0.0%) | 0 (0.0%) |
| $10,000 to $12,499 | 2 (5.7%) | 0 (0.0%) |
| $12,500 to $14,999 | 1 (2.9%) | 2 (8.7%) |
| $15,000 to $17,499 | 6 (17.1%) | 1 (4.3%) |
| $17,500 to $19,999 | 0 (0.0%) | 0 (0.0%) |
| $20,000 to $22,499 | 2 (5.7%) | 1 (4.3%) |
| $22,500 to $24,999 | 0 (0.0%) | 0 (0.0%) |
| $25,000 to $29,999 | 0 (0.0%) | 6 (26.1%) |
| $30,000 to $34,999 | 1 (2.9%) | 5 (21.7%) |
| $35,000 to $39,999 | 9 (25.7%) | 2 (8.7%) |
| $40,000 to $44,999 | 10 (28.6%) | 1 (4.3%) |
| $45,000 to $49,999 | 0 (0.0%) | 0 (0.0%) |
| $50,000 to $54,999 | 0 (0.0%) | 1 (4.3%) |
| $55,000 to $64,999 | 1 (2.9%) | 0 (0.0%) |
| $65,000 to $74,999 | 0 (0.0%) | 0 (0.0%) |
| $75,000 to $99,999 | 0 (0.0%) | 0 (0.0%) |
| $100,000+ | 1 (2.9%) | 0 (0.0%) |
| Total | 35 (100.0%) | 23 (100.0%) |
Earnings by Sex by Educational Attainment in Altamont
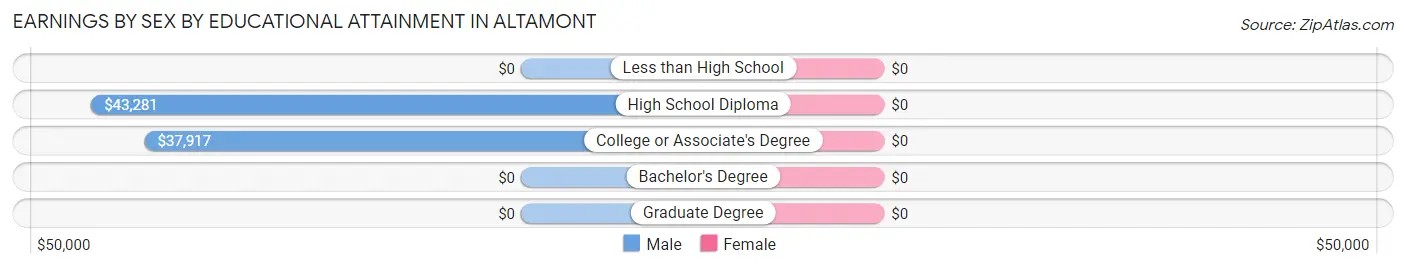
| Educational Attainment | Male Income | Female Income |
| Less than High School | - | - |
| High School Diploma | $43,281 | $0 |
| College or Associate's Degree | $37,917 | $0 |
| Bachelor's Degree | - | - |
| Graduate Degree | - | - |
| Total | $37,500 | $25,938 |
Family Income in Altamont
Family Income Brackets in Altamont
According to the Altamont family income data, there are 5 families falling into the $25,000 to $34,999 income range, which is the most common income bracket and makes up 17.9% of all families.
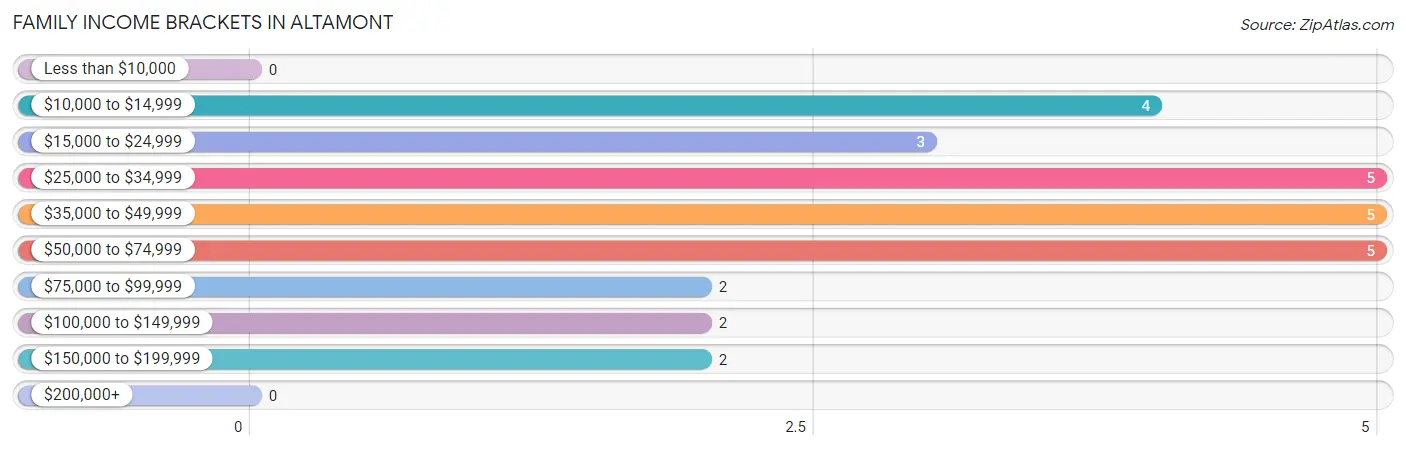
| Income Bracket | # Families | % Families |
| Less than $10,000 | 0 | 0.0% |
| $10,000 to $14,999 | 4 | 14.3% |
| $15,000 to $24,999 | 3 | 10.7% |
| $25,000 to $34,999 | 5 | 17.9% |
| $35,000 to $49,999 | 5 | 17.9% |
| $50,000 to $74,999 | 5 | 17.9% |
| $75,000 to $99,999 | 2 | 7.1% |
| $100,000 to $149,999 | 2 | 7.1% |
| $150,000 to $199,999 | 2 | 7.1% |
| $200,000+ | 0 | 0.0% |
Family Income by Famaliy Size in Altamont
2-person families (14 | 50.0%) account for the highest median family income in Altamont with $61,250 per family, while 2-person families (14 | 50.0%) have the highest median income of $30,625 per family member.
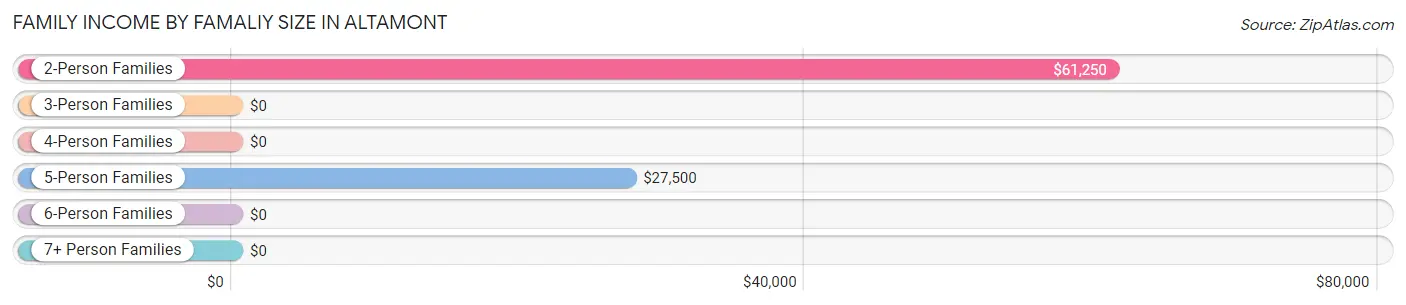
| Income Bracket | # Families | Median Income |
| 2-Person Families | 14 (50.0%) | $61,250 |
| 3-Person Families | 4 (14.3%) | $0 |
| 4-Person Families | 1 (3.6%) | $0 |
| 5-Person Families | 6 (21.4%) | $27,500 |
| 6-Person Families | 0 (0.0%) | $0 |
| 7+ Person Families | 3 (10.7%) | $0 |
| Total | 28 (100.0%) | $43,750 |
Family Income by Number of Earners in Altamont
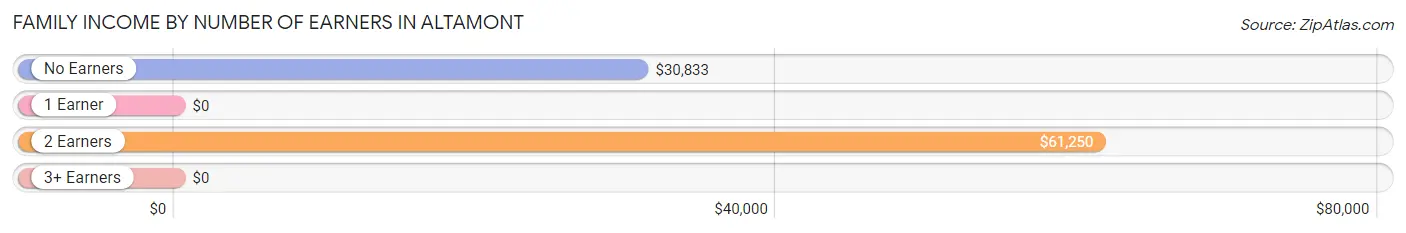
| Number of Earners | # Families | Median Income |
| No Earners | 8 (28.6%) | $30,833 |
| 1 Earner | 7 (25.0%) | $0 |
| 2 Earners | 10 (35.7%) | $61,250 |
| 3+ Earners | 3 (10.7%) | $0 |
| Total | 28 (100.0%) | $43,750 |
Household Income in Altamont
Household Income Brackets in Altamont
With 15 households falling in the category, the $35,000 to $49,999 income range is the most frequent in Altamont, accounting for 26.8% of all households.
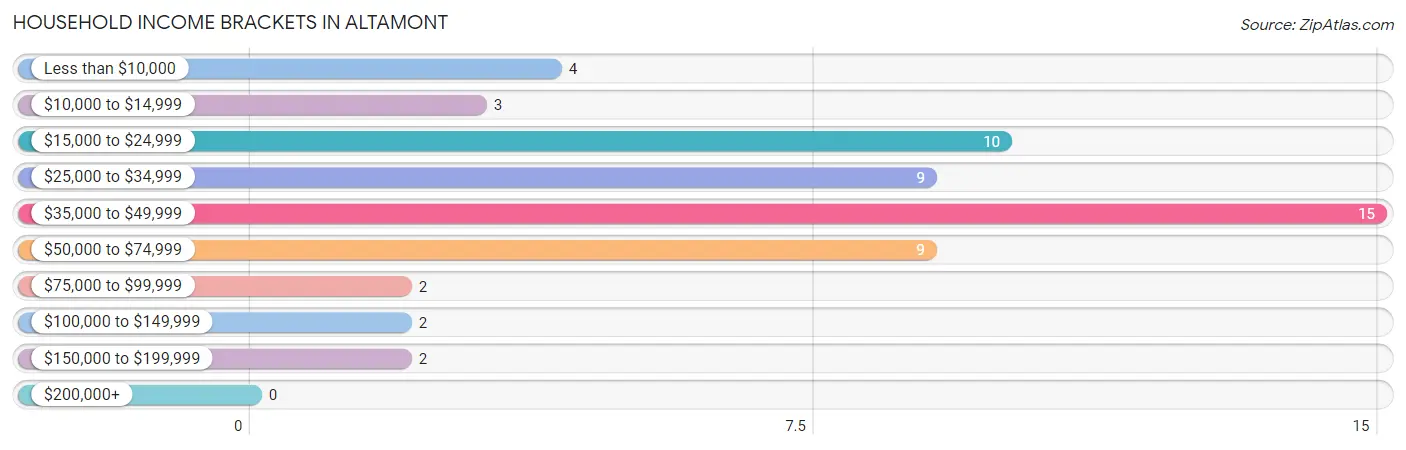
| Income Bracket | # Households | % Households |
| Less than $10,000 | 4 | 7.1% |
| $10,000 to $14,999 | 3 | 5.4% |
| $15,000 to $24,999 | 10 | 17.9% |
| $25,000 to $34,999 | 9 | 16.1% |
| $35,000 to $49,999 | 15 | 26.8% |
| $50,000 to $74,999 | 9 | 16.1% |
| $75,000 to $99,999 | 2 | 3.6% |
| $100,000 to $149,999 | 2 | 3.6% |
| $150,000 to $199,999 | 2 | 3.6% |
| $200,000+ | 0 | 0.0% |
Household Income by Householder Age in Altamont
The median household income in Altamont is $40,000, with the highest median household income of $48,333 found in the 25 to 44 years age bracket for the primary householder. A total of 14 households (25.0%) fall into this category. Meanwhile, the 15 to 24 years age bracket for the primary householder has the lowest median household income of $0, with 1 households (1.8%) in this group.
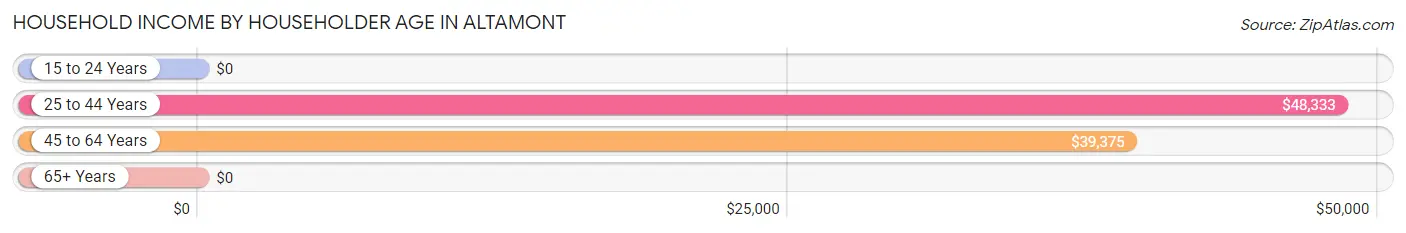
| Income Bracket | # Households | Median Income |
| 15 to 24 Years | 1 (1.8%) | $0 |
| 25 to 44 Years | 14 (25.0%) | $48,333 |
| 45 to 64 Years | 23 (41.1%) | $39,375 |
| 65+ Years | 18 (32.1%) | $0 |
| Total | 56 (100.0%) | $40,000 |
Poverty in Altamont
Income Below Poverty by Sex and Age in Altamont
With 26.1% poverty level for males and 44.1% for females among the residents of Altamont, 5 year old males and 15 year old females are the most vulnerable to poverty, with 3 males (100.0%) and 2 females (100.0%) in their respective age groups living below the poverty level.
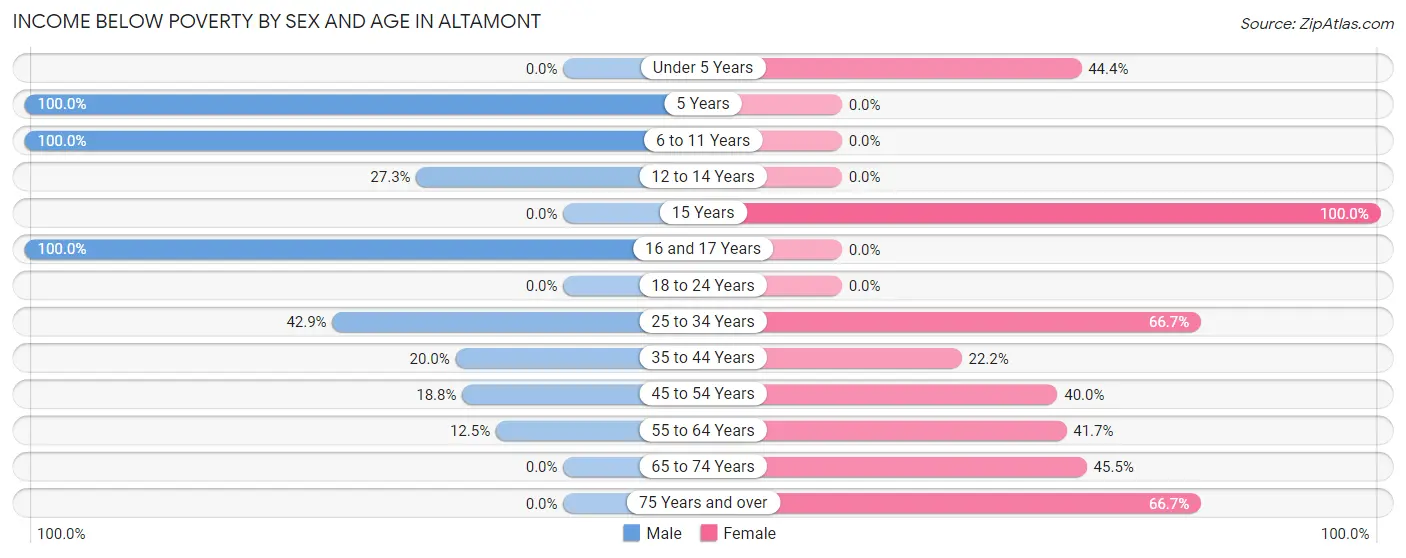
| Age Bracket | Male | Female |
| Under 5 Years | 0 (0.0%) | 4 (44.4%) |
| 5 Years | 3 (100.0%) | 0 (0.0%) |
| 6 to 11 Years | 6 (100.0%) | 0 (0.0%) |
| 12 to 14 Years | 3 (27.3%) | 0 (0.0%) |
| 15 Years | 0 (0.0%) | 2 (100.0%) |
| 16 and 17 Years | 2 (100.0%) | 0 (0.0%) |
| 18 to 24 Years | 0 (0.0%) | 0 (0.0%) |
| 25 to 34 Years | 3 (42.9%) | 6 (66.7%) |
| 35 to 44 Years | 1 (20.0%) | 2 (22.2%) |
| 45 to 54 Years | 3 (18.8%) | 2 (40.0%) |
| 55 to 64 Years | 2 (12.5%) | 5 (41.7%) |
| 65 to 74 Years | 0 (0.0%) | 5 (45.5%) |
| 75 Years and over | 0 (0.0%) | 4 (66.7%) |
| Total | 23 (26.1%) | 30 (44.1%) |
Income Above Poverty by Sex and Age in Altamont
According to the poverty statistics in Altamont, males aged under 5 years and females aged 16 and 17 years are the age groups that are most secure financially, with 100.0% of males and 100.0% of females in these age groups living above the poverty line.
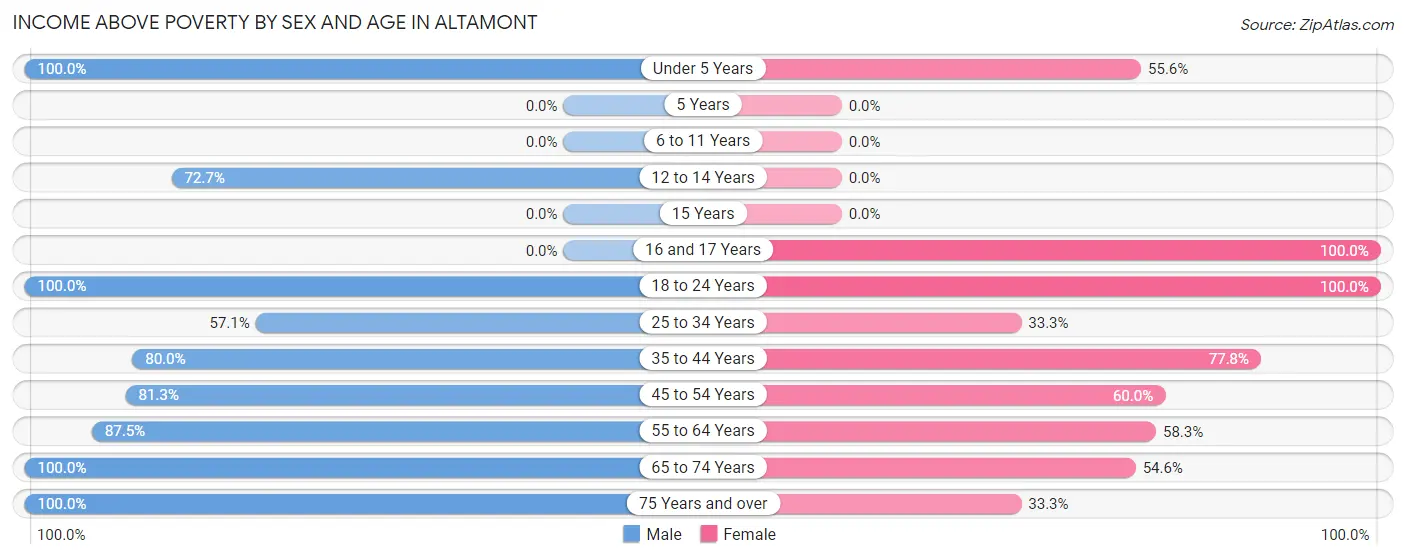
| Age Bracket | Male | Female |
| Under 5 Years | 6 (100.0%) | 5 (55.6%) |
| 5 Years | 0 (0.0%) | 0 (0.0%) |
| 6 to 11 Years | 0 (0.0%) | 0 (0.0%) |
| 12 to 14 Years | 8 (72.7%) | 0 (0.0%) |
| 15 Years | 0 (0.0%) | 0 (0.0%) |
| 16 and 17 Years | 0 (0.0%) | 1 (100.0%) |
| 18 to 24 Years | 7 (100.0%) | 4 (100.0%) |
| 25 to 34 Years | 4 (57.1%) | 3 (33.3%) |
| 35 to 44 Years | 4 (80.0%) | 7 (77.8%) |
| 45 to 54 Years | 13 (81.2%) | 3 (60.0%) |
| 55 to 64 Years | 14 (87.5%) | 7 (58.3%) |
| 65 to 74 Years | 7 (100.0%) | 6 (54.5%) |
| 75 Years and over | 2 (100.0%) | 2 (33.3%) |
| Total | 65 (73.9%) | 38 (55.9%) |
Income Below Poverty Among Married-Couple Families in Altamont
The poverty statistics for married-couple families in Altamont show that 25.0% or 6 of the total 24 families live below the poverty line. Families with 3 or 4 children have the highest poverty rate of 100.0%, comprising of 6 families. On the other hand, families with no children have the lowest poverty rate of 0.0%, which includes 0 families.
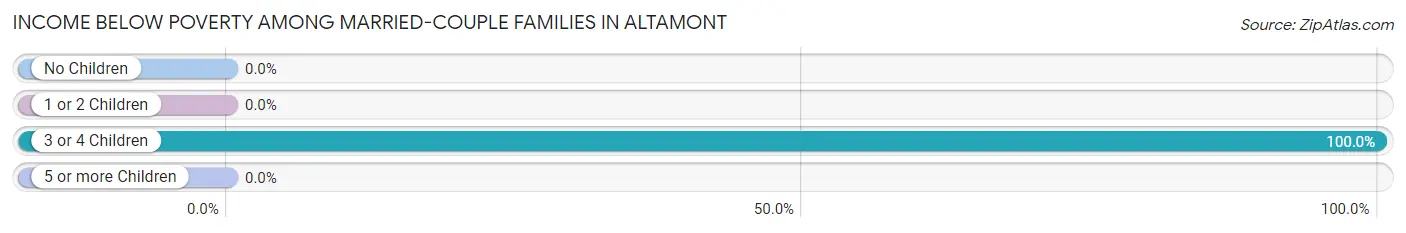
| Children | Above Poverty | Below Poverty |
| No Children | 14 (100.0%) | 0 (0.0%) |
| 1 or 2 Children | 1 (100.0%) | 0 (0.0%) |
| 3 or 4 Children | 0 (0.0%) | 6 (100.0%) |
| 5 or more Children | 3 (100.0%) | 0 (0.0%) |
| Total | 18 (75.0%) | 6 (25.0%) |
Income Below Poverty Among Single-Parent Households in Altamont
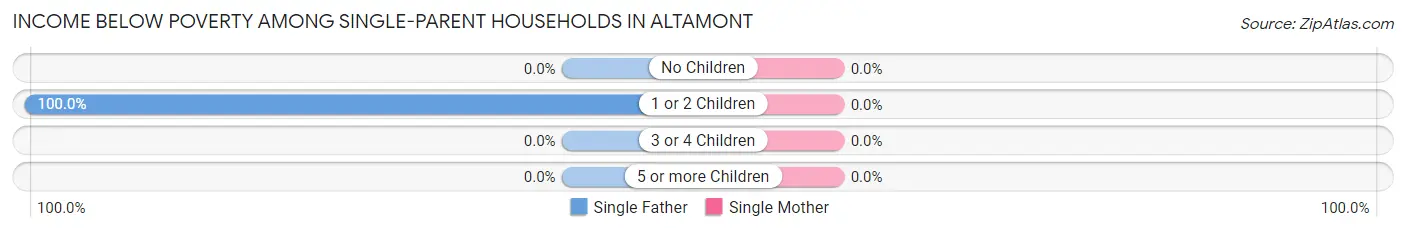
| Children | Single Father | Single Mother |
| No Children | 0 (0.0%) | 0 (0.0%) |
| 1 or 2 Children | 2 (100.0%) | 0 (0.0%) |
| 3 or 4 Children | 0 (0.0%) | 0 (0.0%) |
| 5 or more Children | 0 (0.0%) | 0 (0.0%) |
| Total | 2 (100.0%) | 0 (0.0%) |
Income Below Poverty Among Married-Couple vs Single-Parent Households in Altamont
The poverty data for Altamont shows that 6 of the married-couple family households (25.0%) and 2 of the single-parent households (50.0%) are living below the poverty level. Within the married-couple family households, those with 3 or 4 children have the highest poverty rate, with 6 households (100.0%) falling below the poverty line. Among the single-parent households, those with 1 or 2 children have the highest poverty rate, with 2 household (100.0%) living below poverty.
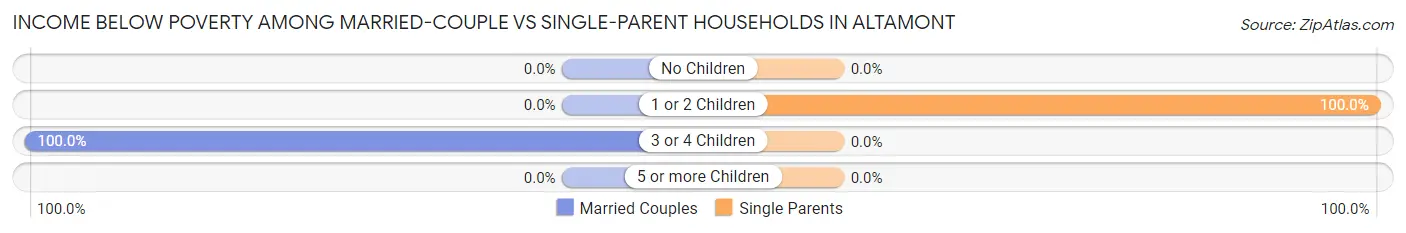
| Children | Married-Couple Families | Single-Parent Households |
| No Children | 0 (0.0%) | 0 (0.0%) |
| 1 or 2 Children | 0 (0.0%) | 2 (100.0%) |
| 3 or 4 Children | 6 (100.0%) | 0 (0.0%) |
| 5 or more Children | 0 (0.0%) | 0 (0.0%) |
| Total | 6 (25.0%) | 2 (50.0%) |
Race in Altamont
The most populous races in Altamont are White / Caucasian (152 | 97.4%), and Two or more Races (4 | 2.6%).
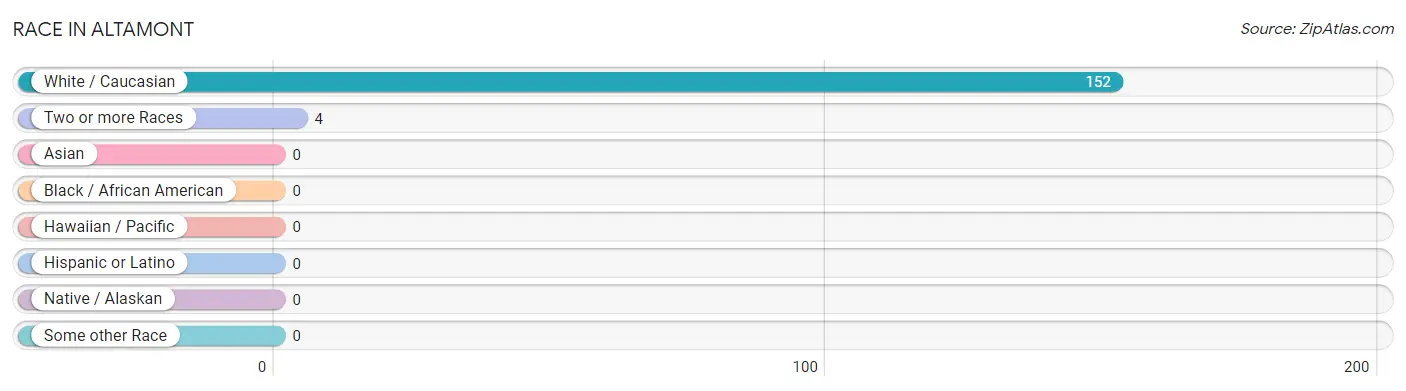
| Race | # Population | % Population |
| Asian | 0 | 0.0% |
| Black / African American | 0 | 0.0% |
| Hawaiian / Pacific | 0 | 0.0% |
| Hispanic or Latino | 0 | 0.0% |
| Native / Alaskan | 0 | 0.0% |
| White / Caucasian | 152 | 97.4% |
| Two or more Races | 4 | 2.6% |
| Some other Race | 0 | 0.0% |
| Total | 156 | 100.0% |
Ancestry in Altamont
The most populous ancestries reported in Altamont are American (73 | 46.8%), German (21 | 13.5%), Irish (14 | 9.0%), English (8 | 5.1%), and French (2 | 1.3%), together accounting for 75.6% of all Altamont residents.
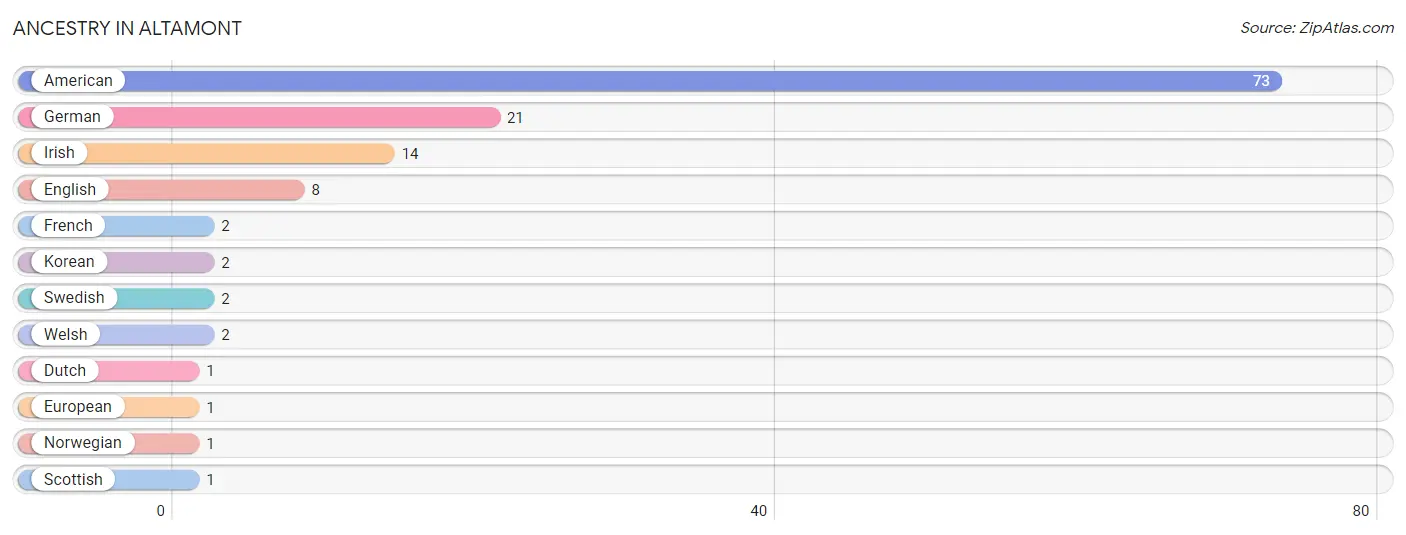
| Ancestry | # Population | % Population |
| American | 73 | 46.8% |
| Dutch | 1 | 0.6% |
| English | 8 | 5.1% |
| European | 1 | 0.6% |
| French | 2 | 1.3% |
| German | 21 | 13.5% |
| Irish | 14 | 9.0% |
| Korean | 2 | 1.3% |
| Norwegian | 1 | 0.6% |
| Scottish | 1 | 0.6% |
| Swedish | 2 | 1.3% |
| Welsh | 2 | 1.3% | View All 12 Rows |
Immigrants in Altamont
The most numerous immigrant groups reported in Altamont came from Asia (2 | 1.3%), Philippines (2 | 1.3%), and South Eastern Asia (2 | 1.3%), together accounting for 3.8% of all Altamont residents.
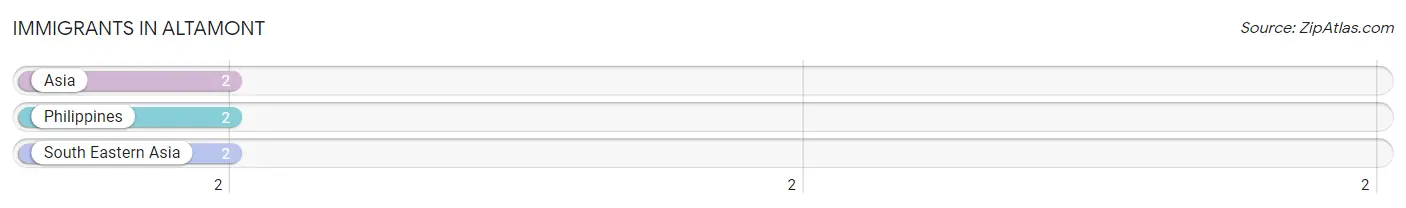
| Immigration Origin | # Population | % Population |
| Asia | 2 | 1.3% |
| Philippines | 2 | 1.3% |
| South Eastern Asia | 2 | 1.3% | View All 3 Rows |
Sex and Age in Altamont
Sex and Age in Altamont
The most populous age groups in Altamont are 45 to 49 Years (13 | 14.8%) for men and 60 to 64 Years (11 | 16.2%) for women.
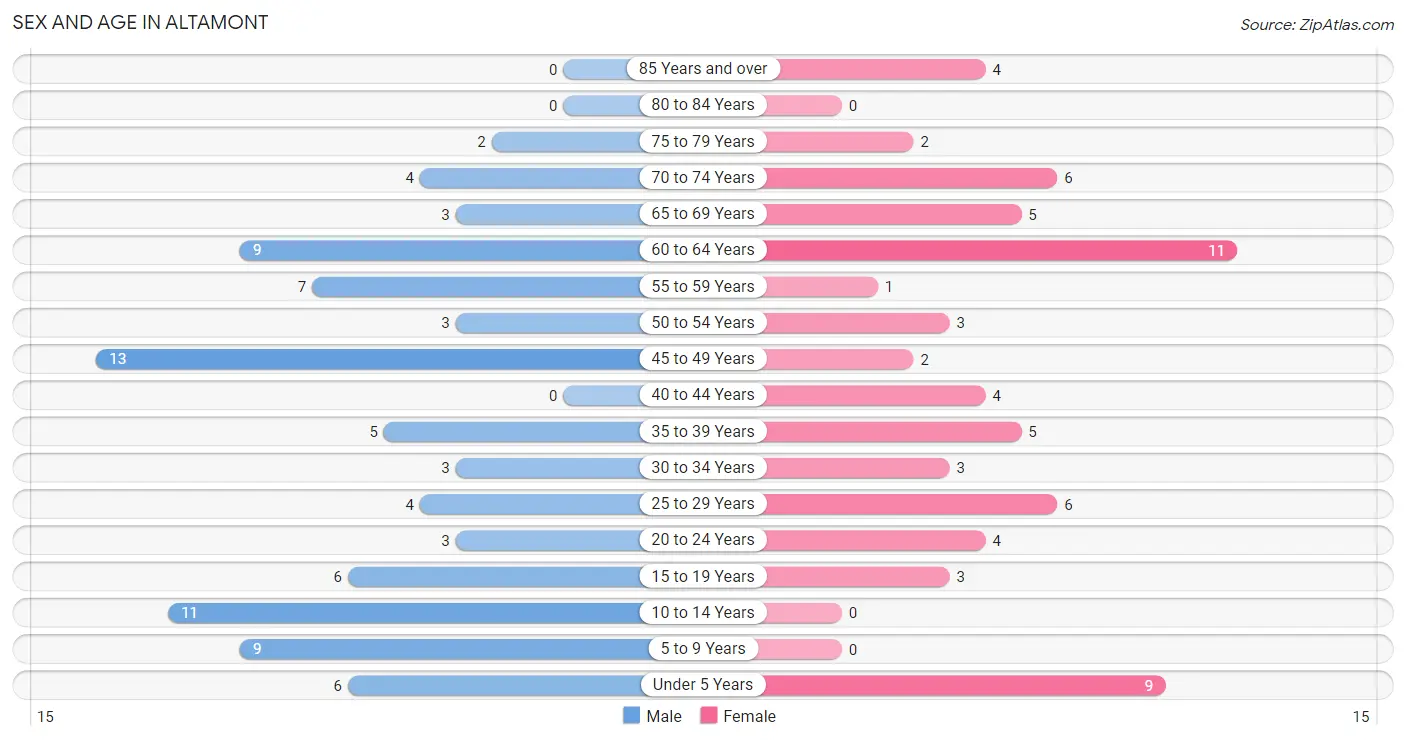
| Age Bracket | Male | Female |
| Under 5 Years | 6 (6.8%) | 9 (13.2%) |
| 5 to 9 Years | 9 (10.2%) | 0 (0.0%) |
| 10 to 14 Years | 11 (12.5%) | 0 (0.0%) |
| 15 to 19 Years | 6 (6.8%) | 3 (4.4%) |
| 20 to 24 Years | 3 (3.4%) | 4 (5.9%) |
| 25 to 29 Years | 4 (4.5%) | 6 (8.8%) |
| 30 to 34 Years | 3 (3.4%) | 3 (4.4%) |
| 35 to 39 Years | 5 (5.7%) | 5 (7.3%) |
| 40 to 44 Years | 0 (0.0%) | 4 (5.9%) |
| 45 to 49 Years | 13 (14.8%) | 2 (2.9%) |
| 50 to 54 Years | 3 (3.4%) | 3 (4.4%) |
| 55 to 59 Years | 7 (8.0%) | 1 (1.5%) |
| 60 to 64 Years | 9 (10.2%) | 11 (16.2%) |
| 65 to 69 Years | 3 (3.4%) | 5 (7.3%) |
| 70 to 74 Years | 4 (4.5%) | 6 (8.8%) |
| 75 to 79 Years | 2 (2.3%) | 2 (2.9%) |
| 80 to 84 Years | 0 (0.0%) | 0 (0.0%) |
| 85 Years and over | 0 (0.0%) | 4 (5.9%) |
| Total | 88 (100.0%) | 68 (100.0%) |
Families and Households in Altamont
Median Family Size in Altamont
The median family size in Altamont is 4.11 persons per family, with married-couple families (24 | 85.7%) accounting for the largest median family size of 4.33 persons per family. On the other hand, single male/father families (2 | 7.1%) represent the smallest median family size with 1.50 persons per family.
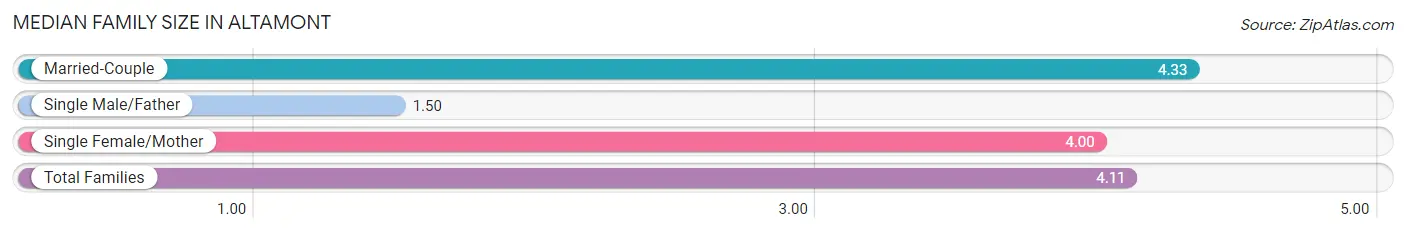
| Family Type | # Families | Family Size |
| Married-Couple | 24 (85.7%) | 4.33 |
| Single Male/Father | 2 (7.1%) | 1.50 |
| Single Female/Mother | 2 (7.1%) | 4.00 |
| Total Families | 28 (100.0%) | 4.11 |
Median Household Size in Altamont
The median household size in Altamont is 2.79 persons per household, with married-couple households (24 | 42.9%) accounting for the largest median household size of 4.33 persons per household. non-family households (28 | 50.0%) represent the smallest median household size with 1.43 persons per household.
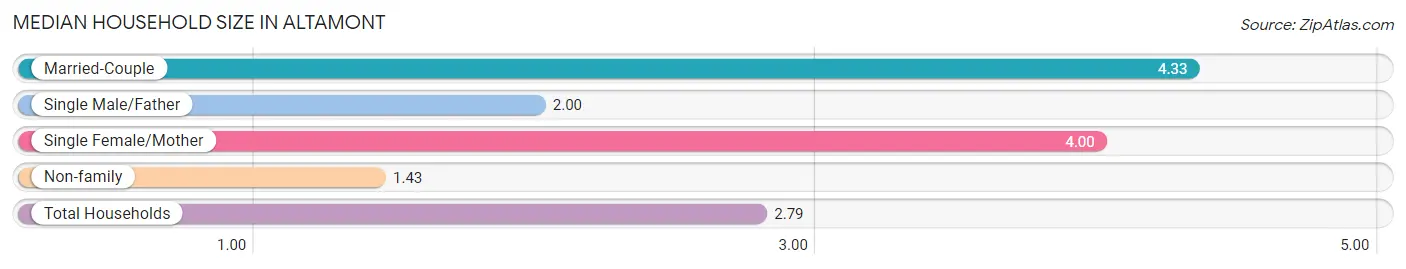
| Household Type | # Households | Household Size |
| Married-Couple | 24 (42.9%) | 4.33 |
| Single Male/Father | 2 (3.6%) | 2.00 |
| Single Female/Mother | 2 (3.6%) | 4.00 |
| Non-family | 28 (50.0%) | 1.43 |
| Total Households | 56 (100.0%) | 2.79 |
Household Size by Marriage Status in Altamont
Out of a total of 56 households in Altamont, 28 (50.0%) are family households, while 28 (50.0%) are nonfamily households. The most numerous type of family households are 2-person households, comprising 12, and the most common type of nonfamily households are 1-person households, comprising 18.
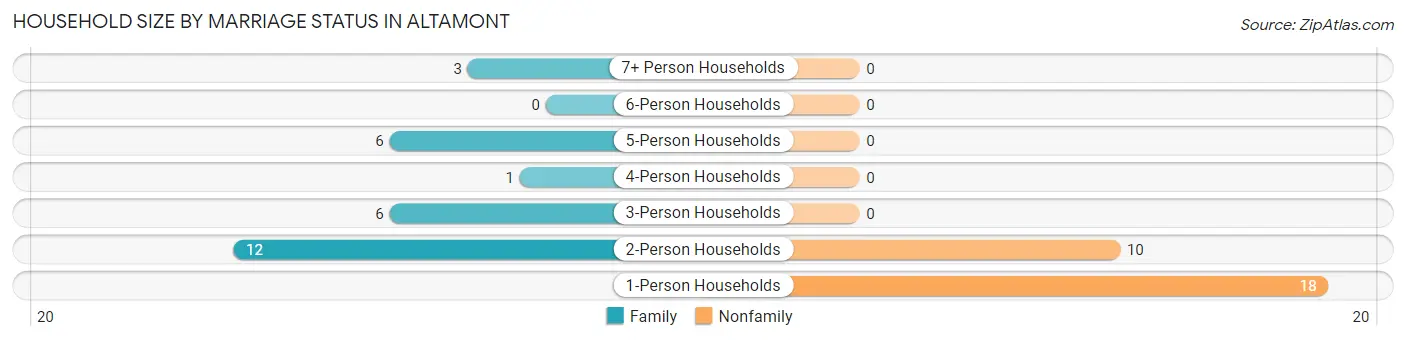
| Household Size | Family Households | Nonfamily Households |
| 1-Person Households | - | 18 (32.1%) |
| 2-Person Households | 12 (21.4%) | 10 (17.9%) |
| 3-Person Households | 6 (10.7%) | 0 (0.0%) |
| 4-Person Households | 1 (1.8%) | 0 (0.0%) |
| 5-Person Households | 6 (10.7%) | 0 (0.0%) |
| 6-Person Households | 0 (0.0%) | 0 (0.0%) |
| 7+ Person Households | 3 (5.4%) | 0 (0.0%) |
| Total | 28 (50.0%) | 28 (50.0%) |
Female Fertility in Altamont
Fertility by Age in Altamont
| Age Bracket | Women with Births | Births / 1,000 Women |
| 15 to 19 years | 0 (0.0%) | 0.0 |
| 20 to 34 years | 0 (0.0%) | 0.0 |
| 35 to 50 years | 0 (0.0%) | 0.0 |
| Total | 0 (0.0%) | 0.0 |
Fertility by Age by Marriage Status in Altamont
| Age Bracket | Married | Unmarried |
| 15 to 19 years | 0 (0.0%) | 0 (0.0%) |
| 20 to 34 years | 0 (0.0%) | 0 (0.0%) |
| 35 to 50 years | 0 (0.0%) | 0 (0.0%) |
| Total | 0 (0.0%) | 0 (0.0%) |
Fertility by Education in Altamont
| Educational Attainment | Women with Births | Births / 1,000 Women |
| Less than High School | 0 (0.0%) | 0.0 |
| High School Diploma | 0 (0.0%) | 0.0 |
| College or Associate's Degree | 0 (0.0%) | 0.0 |
| Bachelor's Degree | 0 (0.0%) | 0.0 |
| Graduate Degree | 0 (0.0%) | 0.0 |
| Total | 0 (0.0%) | 0.0 |
Fertility by Education by Marriage Status in Altamont
| Educational Attainment | Married | Unmarried |
| Less than High School | 0 (0.0%) | 0 (0.0%) |
| High School Diploma | 0 (0.0%) | 0 (0.0%) |
| College or Associate's Degree | 0 (0.0%) | 0 (0.0%) |
| Bachelor's Degree | 0 (0.0%) | 0 (0.0%) |
| Graduate Degree | 0 (0.0%) | 0 (0.0%) |
| Total | 0 (0.0%) | 0 (0.0%) |
Employment Characteristics in Altamont
Employment by Class of Employer in Altamont
Among the 54 employed individuals in Altamont, private company employees (41 | 75.9%), self-employed (not incorporated) (7 | 13.0%), and state government employees (5 | 9.3%) make up the most common classes of employment.
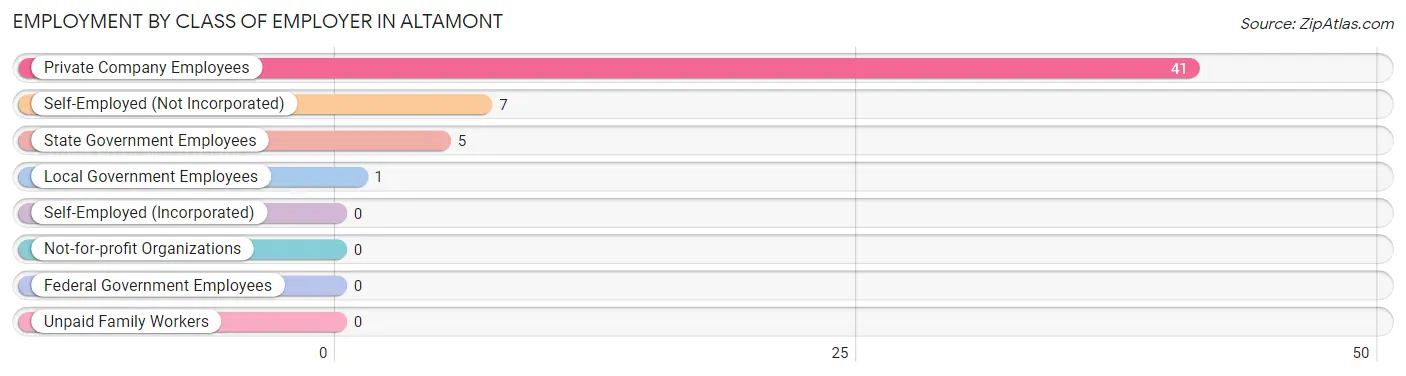
| Employer Class | # Employees | % Employees |
| Private Company Employees | 41 | 75.9% |
| Self-Employed (Incorporated) | 0 | 0.0% |
| Self-Employed (Not Incorporated) | 7 | 13.0% |
| Not-for-profit Organizations | 0 | 0.0% |
| Local Government Employees | 1 | 1.8% |
| State Government Employees | 5 | 9.3% |
| Federal Government Employees | 0 | 0.0% |
| Unpaid Family Workers | 0 | 0.0% |
| Total | 54 | 100.0% |
Employment Status by Age in Altamont
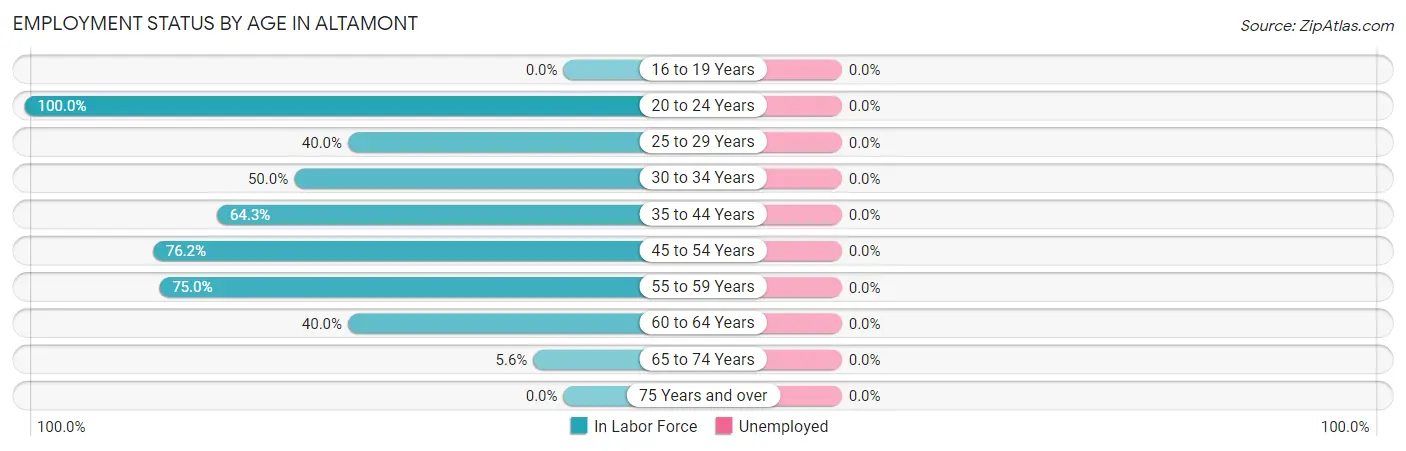
| Age Bracket | In Labor Force | Unemployed |
| 16 to 19 Years | 0 (0.0%) | 0 (0.0%) |
| 20 to 24 Years | 7 (100.0%) | 0 (0.0%) |
| 25 to 29 Years | 4 (40.0%) | 0 (0.0%) |
| 30 to 34 Years | 3 (50.0%) | 0 (0.0%) |
| 35 to 44 Years | 9 (64.3%) | 0 (0.0%) |
| 45 to 54 Years | 16 (76.2%) | 0 (0.0%) |
| 55 to 59 Years | 6 (75.0%) | 0 (0.0%) |
| 60 to 64 Years | 8 (40.0%) | 0 (0.0%) |
| 65 to 74 Years | 1 (5.6%) | 0 (0.0%) |
| 75 Years and over | 0 (0.0%) | 0 (0.0%) |
| Total | 54 (45.4%) | 0 (0.0%) |
Employment Status by Educational Attainment in Altamont
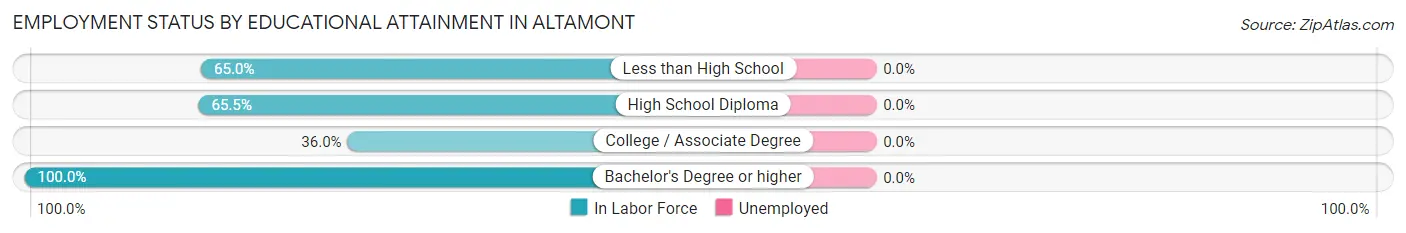
| Educational Attainment | In Labor Force | Unemployed |
| Less than High School | 13 (65.0%) | 0 (0.0%) |
| High School Diploma | 19 (65.5%) | 0 (0.0%) |
| College / Associate Degree | 9 (36.0%) | 0 (0.0%) |
| Bachelor's Degree or higher | 5 (100.0%) | 0 (0.0%) |
| Total | 46 (58.2%) | 0 (0.0%) |
Employment Occupations by Sex in Altamont
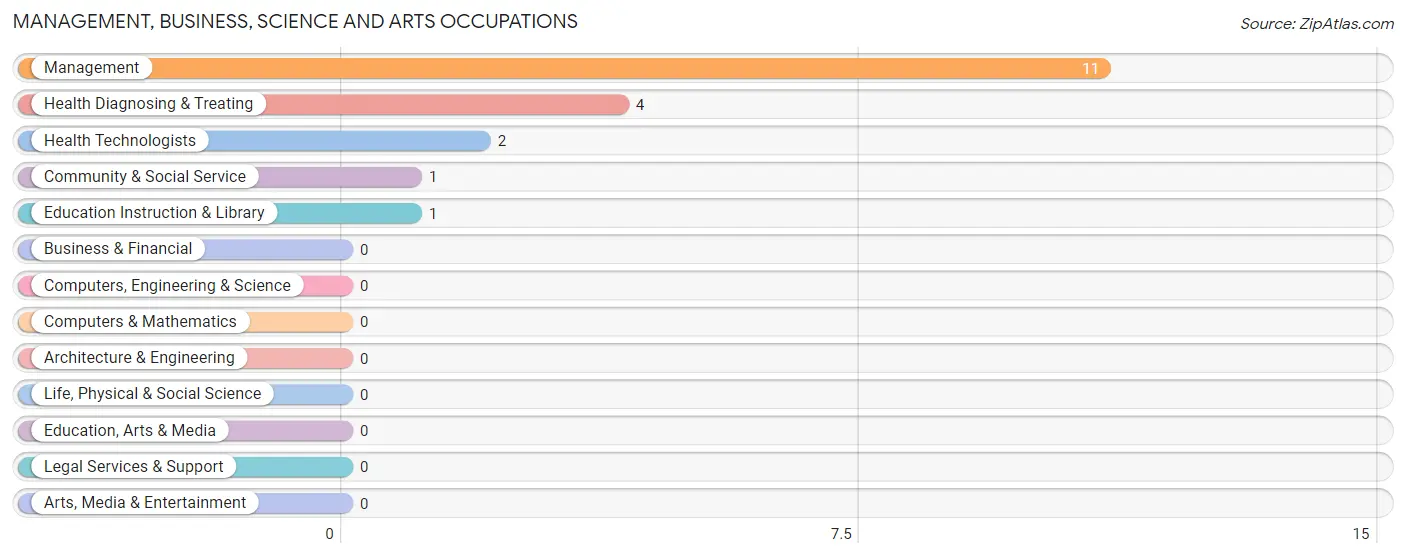
Management, Business, Science and Arts Occupations
The most common Management, Business, Science and Arts occupations in Altamont are Management (11 | 20.4%), Health Diagnosing & Treating (4 | 7.4%), Health Technologists (2 | 3.7%), Community & Social Service (1 | 1.8%), and Education Instruction & Library (1 | 1.8%).
Management, Business, Science and Arts Occupations by Sex
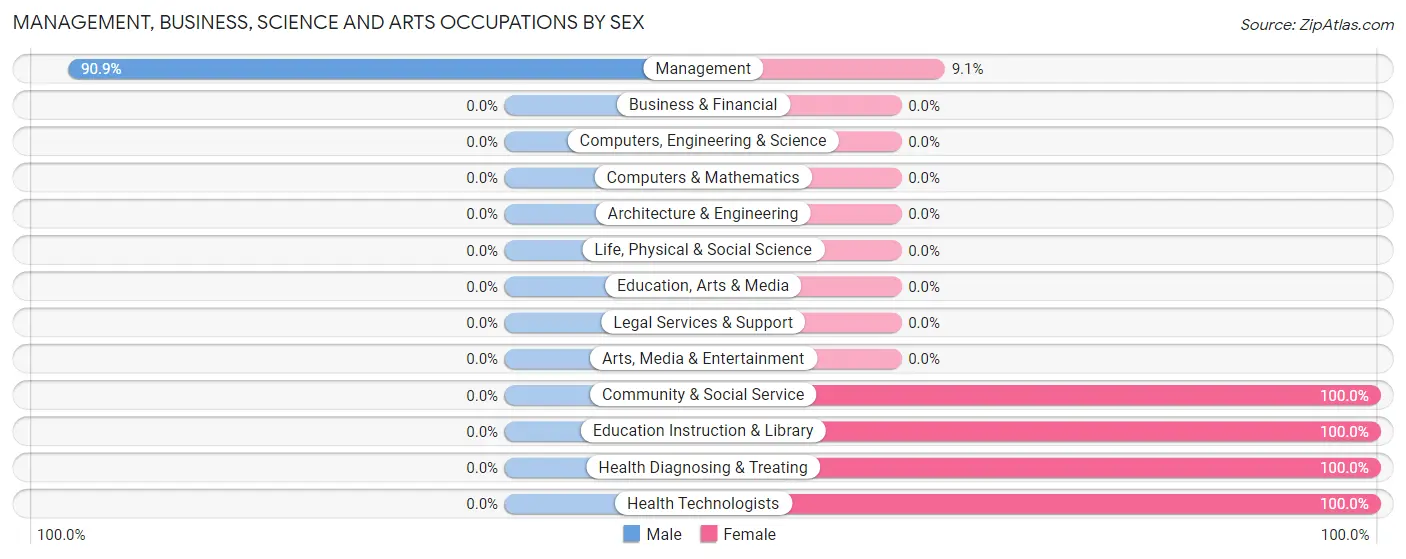
| Occupation | Male | Female |
| Management | 10 (90.9%) | 1 (9.1%) |
| Business & Financial | 0 (0.0%) | 0 (0.0%) |
| Computers, Engineering & Science | 0 (0.0%) | 0 (0.0%) |
| Computers & Mathematics | 0 (0.0%) | 0 (0.0%) |
| Architecture & Engineering | 0 (0.0%) | 0 (0.0%) |
| Life, Physical & Social Science | 0 (0.0%) | 0 (0.0%) |
| Community & Social Service | 0 (0.0%) | 1 (100.0%) |
| Education, Arts & Media | 0 (0.0%) | 0 (0.0%) |
| Legal Services & Support | 0 (0.0%) | 0 (0.0%) |
| Education Instruction & Library | 0 (0.0%) | 1 (100.0%) |
| Arts, Media & Entertainment | 0 (0.0%) | 0 (0.0%) |
| Health Diagnosing & Treating | 0 (0.0%) | 4 (100.0%) |
| Health Technologists | 0 (0.0%) | 2 (100.0%) |
| Total (Category) | 10 (62.5%) | 6 (37.5%) |
| Total (Overall) | 33 (61.1%) | 21 (38.9%) |
Services Occupations
The most common Services occupations in Altamont are Healthcare Support (7 | 13.0%), and Cleaning & Maintenance (5 | 9.3%).
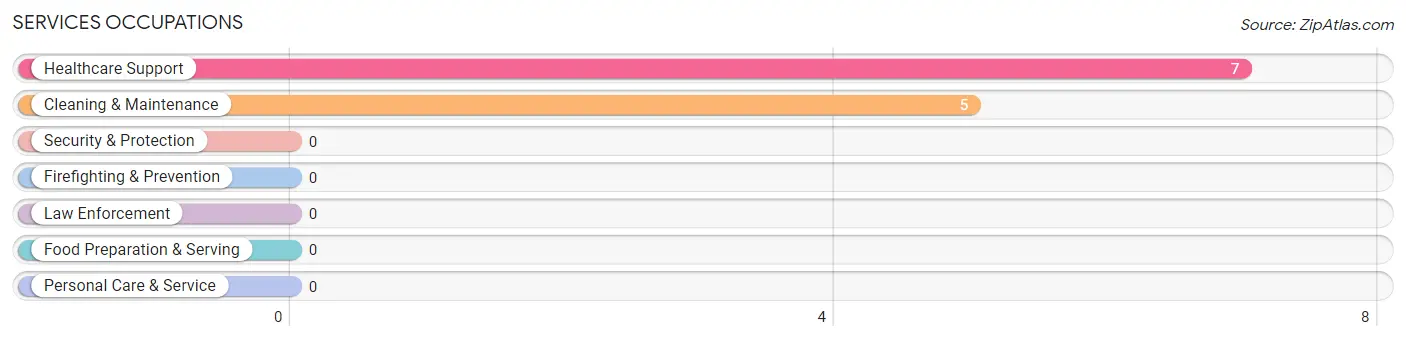
Services Occupations by Sex
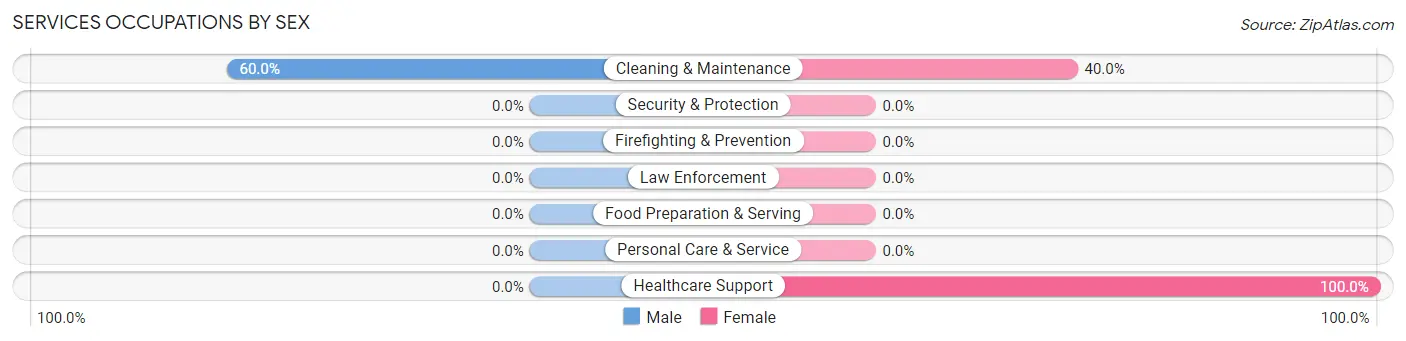
| Occupation | Male | Female |
| Healthcare Support | 0 (0.0%) | 7 (100.0%) |
| Security & Protection | 0 (0.0%) | 0 (0.0%) |
| Firefighting & Prevention | 0 (0.0%) | 0 (0.0%) |
| Law Enforcement | 0 (0.0%) | 0 (0.0%) |
| Food Preparation & Serving | 0 (0.0%) | 0 (0.0%) |
| Cleaning & Maintenance | 3 (60.0%) | 2 (40.0%) |
| Personal Care & Service | 0 (0.0%) | 0 (0.0%) |
| Total (Category) | 3 (25.0%) | 9 (75.0%) |
| Total (Overall) | 33 (61.1%) | 21 (38.9%) |
Sales and Office Occupations
The most common Sales and Office occupations in Altamont are , and Sales & Related (3 | 5.6%).
Sales and Office Occupations by Sex
| Occupation | Male | Female |
| Sales & Related | 0 (0.0%) | 3 (100.0%) |
| Office & Administration | 0 (0.0%) | 0 (0.0%) |
| Total (Category) | 0 (0.0%) | 3 (100.0%) |
| Total (Overall) | 33 (61.1%) | 21 (38.9%) |
Natural Resources, Construction and Maintenance Occupations
The most common Natural Resources, Construction and Maintenance occupations in Altamont are Farming, Fishing & Forestry (5 | 9.3%), Construction & Extraction (3 | 5.6%), and Installation, Maintenance & Repair (1 | 1.8%).
Natural Resources, Construction and Maintenance Occupations by Sex
| Occupation | Male | Female |
| Farming, Fishing & Forestry | 5 (100.0%) | 0 (0.0%) |
| Construction & Extraction | 3 (100.0%) | 0 (0.0%) |
| Installation, Maintenance & Repair | 1 (100.0%) | 0 (0.0%) |
| Total (Category) | 9 (100.0%) | 0 (0.0%) |
| Total (Overall) | 33 (61.1%) | 21 (38.9%) |
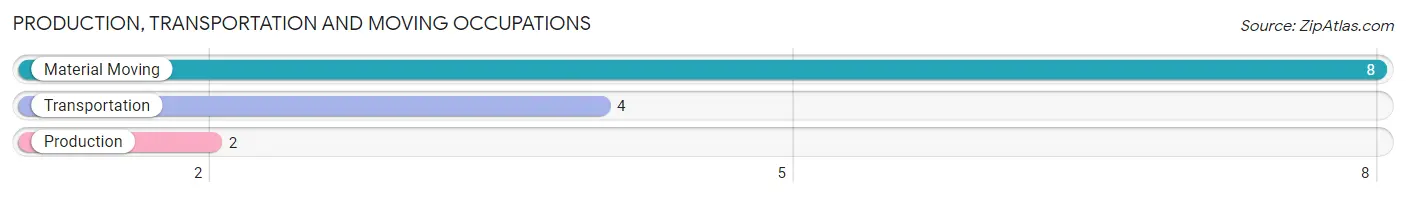
Production, Transportation and Moving Occupations
The most common Production, Transportation and Moving occupations in Altamont are Material Moving (8 | 14.8%), Transportation (4 | 7.4%), and Production (2 | 3.7%).
Production, Transportation and Moving Occupations by Sex
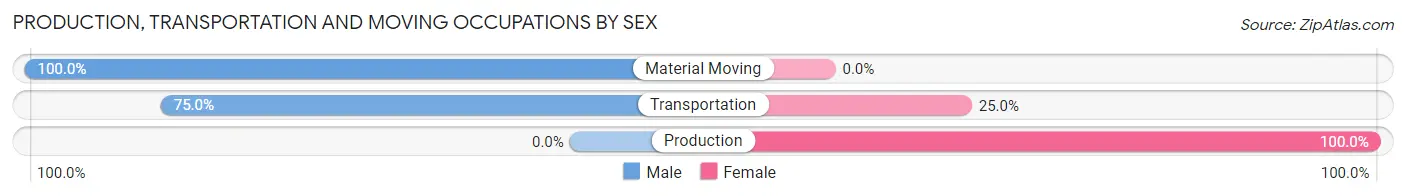
| Occupation | Male | Female |
| Production | 0 (0.0%) | 2 (100.0%) |
| Transportation | 3 (75.0%) | 1 (25.0%) |
| Material Moving | 8 (100.0%) | 0 (0.0%) |
| Total (Category) | 11 (78.6%) | 3 (21.4%) |
| Total (Overall) | 33 (61.1%) | 21 (38.9%) |
Employment Industries by Sex in Altamont
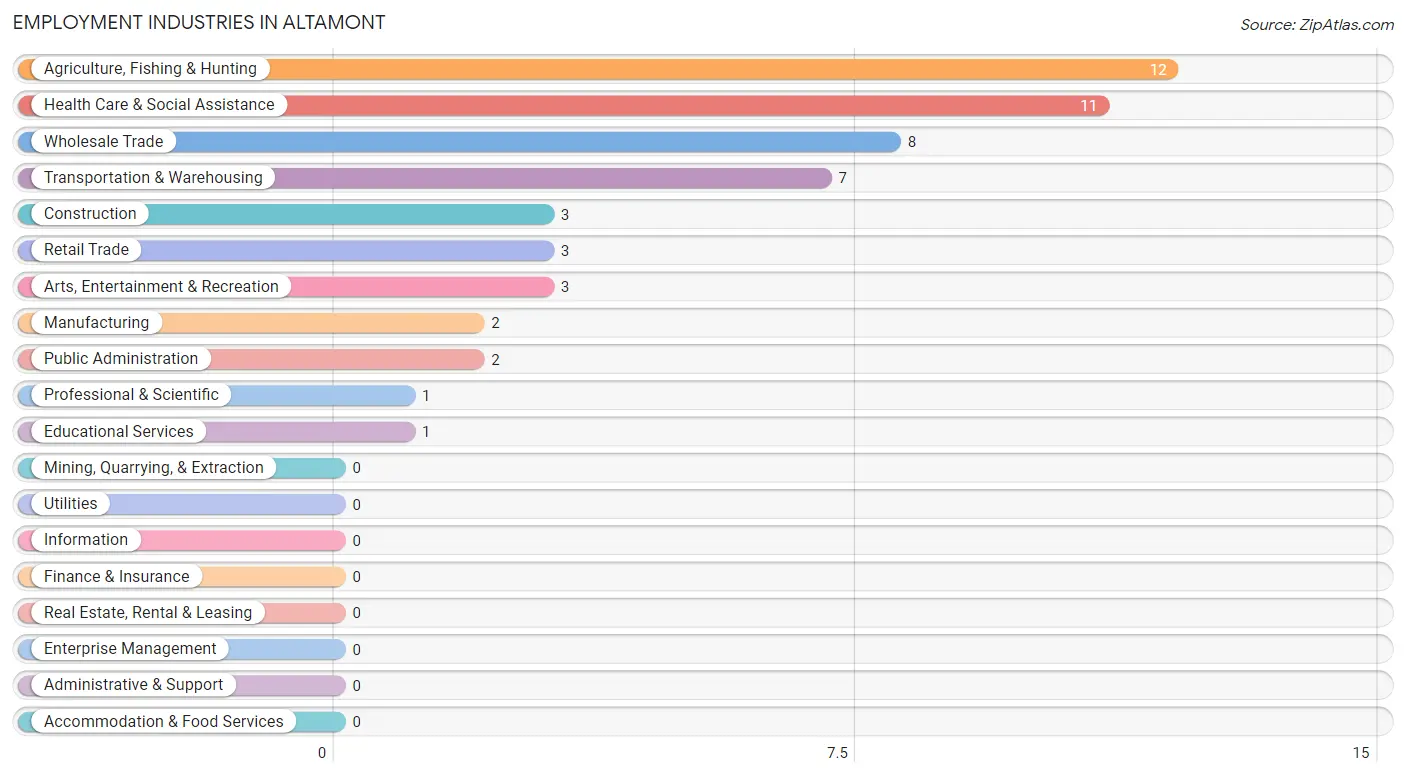
Employment Industries in Altamont
The major employment industries in Altamont include Agriculture, Fishing & Hunting (12 | 22.2%), Health Care & Social Assistance (11 | 20.4%), Wholesale Trade (8 | 14.8%), Transportation & Warehousing (7 | 13.0%), and Construction (3 | 5.6%).
Employment Industries by Sex in Altamont
The Altamont industries that see more men than women are Construction (100.0%), Wholesale Trade (100.0%), and Professional & Scientific (100.0%), whereas the industries that tend to have a higher number of women are Manufacturing (100.0%), Retail Trade (100.0%), and Educational Services (100.0%).
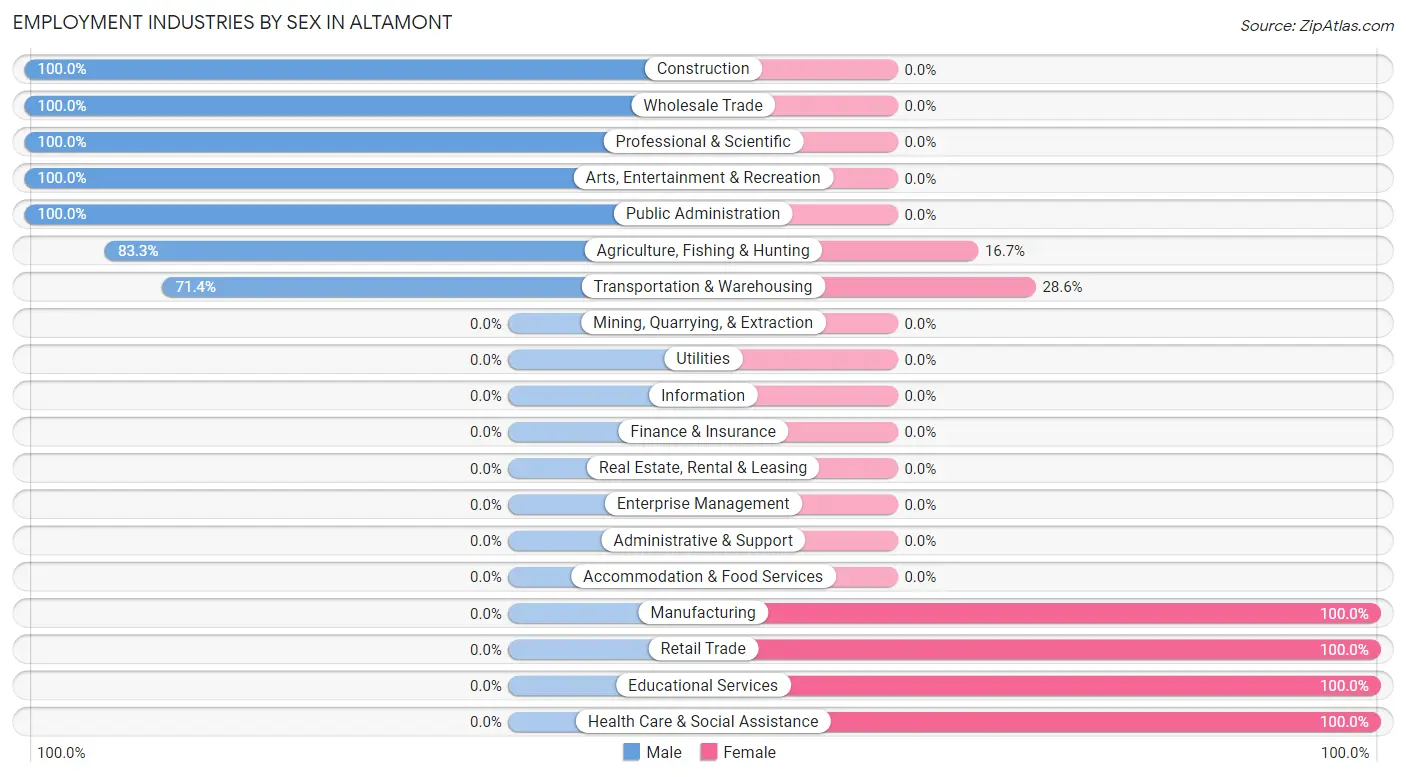
| Industry | Male | Female |
| Agriculture, Fishing & Hunting | 10 (83.3%) | 2 (16.7%) |
| Mining, Quarrying, & Extraction | 0 (0.0%) | 0 (0.0%) |
| Construction | 3 (100.0%) | 0 (0.0%) |
| Manufacturing | 0 (0.0%) | 2 (100.0%) |
| Wholesale Trade | 8 (100.0%) | 0 (0.0%) |
| Retail Trade | 0 (0.0%) | 3 (100.0%) |
| Transportation & Warehousing | 5 (71.4%) | 2 (28.6%) |
| Utilities | 0 (0.0%) | 0 (0.0%) |
| Information | 0 (0.0%) | 0 (0.0%) |
| Finance & Insurance | 0 (0.0%) | 0 (0.0%) |
| Real Estate, Rental & Leasing | 0 (0.0%) | 0 (0.0%) |
| Professional & Scientific | 1 (100.0%) | 0 (0.0%) |
| Enterprise Management | 0 (0.0%) | 0 (0.0%) |
| Administrative & Support | 0 (0.0%) | 0 (0.0%) |
| Educational Services | 0 (0.0%) | 1 (100.0%) |
| Health Care & Social Assistance | 0 (0.0%) | 11 (100.0%) |
| Arts, Entertainment & Recreation | 3 (100.0%) | 0 (0.0%) |
| Accommodation & Food Services | 0 (0.0%) | 0 (0.0%) |
| Public Administration | 2 (100.0%) | 0 (0.0%) |
| Total | 33 (61.1%) | 21 (38.9%) |
Education in Altamont
School Enrollment in Altamont
The most common levels of schooling among the 29 students in Altamont are high school (13 | 44.8%), middle school (7 | 24.1%), and elementary school (4 | 13.8%).
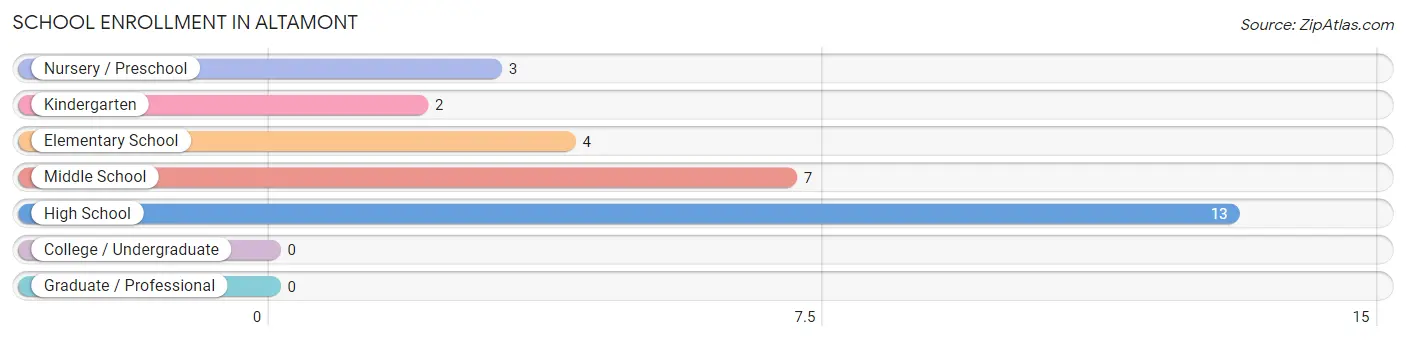
| School Level | # Students | % Students |
| Nursery / Preschool | 3 | 10.3% |
| Kindergarten | 2 | 6.9% |
| Elementary School | 4 | 13.8% |
| Middle School | 7 | 24.1% |
| High School | 13 | 44.8% |
| College / Undergraduate | 0 | 0.0% |
| Graduate / Professional | 0 | 0.0% |
| Total | 29 | 100.0% |
School Enrollment by Age by Funding Source in Altamont
Out of a total of 29 students who are enrolled in schools in Altamont, 4 (13.8%) attend a private institution, while the remaining 25 (86.2%) are enrolled in public schools. The age group of 18 to 19 year olds has the highest likelihood of being enrolled in private schools, with 4 (100.0% in the age bracket) enrolled. Conversely, the age group of 5 to 9 year old has the lowest likelihood of being enrolled in a private school, with 9 (100.0% in the age bracket) attending a public institution.
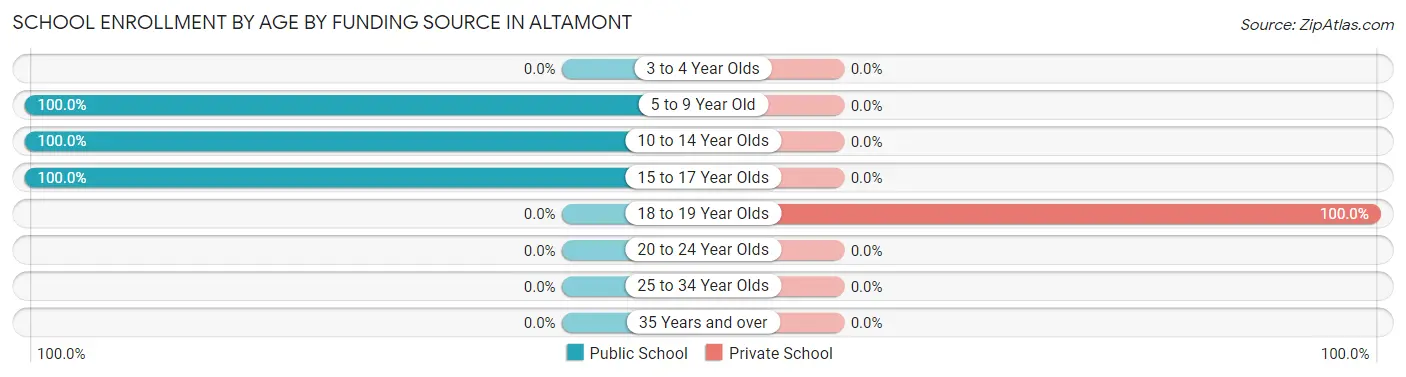
| Age Bracket | Public School | Private School |
| 3 to 4 Year Olds | 0 (0.0%) | 0 (0.0%) |
| 5 to 9 Year Old | 9 (100.0%) | 0 (0.0%) |
| 10 to 14 Year Olds | 11 (100.0%) | 0 (0.0%) |
| 15 to 17 Year Olds | 5 (100.0%) | 0 (0.0%) |
| 18 to 19 Year Olds | 0 (0.0%) | 4 (100.0%) |
| 20 to 24 Year Olds | 0 (0.0%) | 0 (0.0%) |
| 25 to 34 Year Olds | 0 (0.0%) | 0 (0.0%) |
| 35 Years and over | 0 (0.0%) | 0 (0.0%) |
| Total | 25 (86.2%) | 4 (13.8%) |
Educational Attainment by Field of Study in Altamont
Psychology (2 | 25.0%), education (2 | 25.0%), computers & mathematics (1 | 12.5%), engineering (1 | 12.5%), and multidisciplinary studies (1 | 12.5%) are the most common fields of study among 8 individuals in Altamont who have obtained a bachelor's degree or higher.
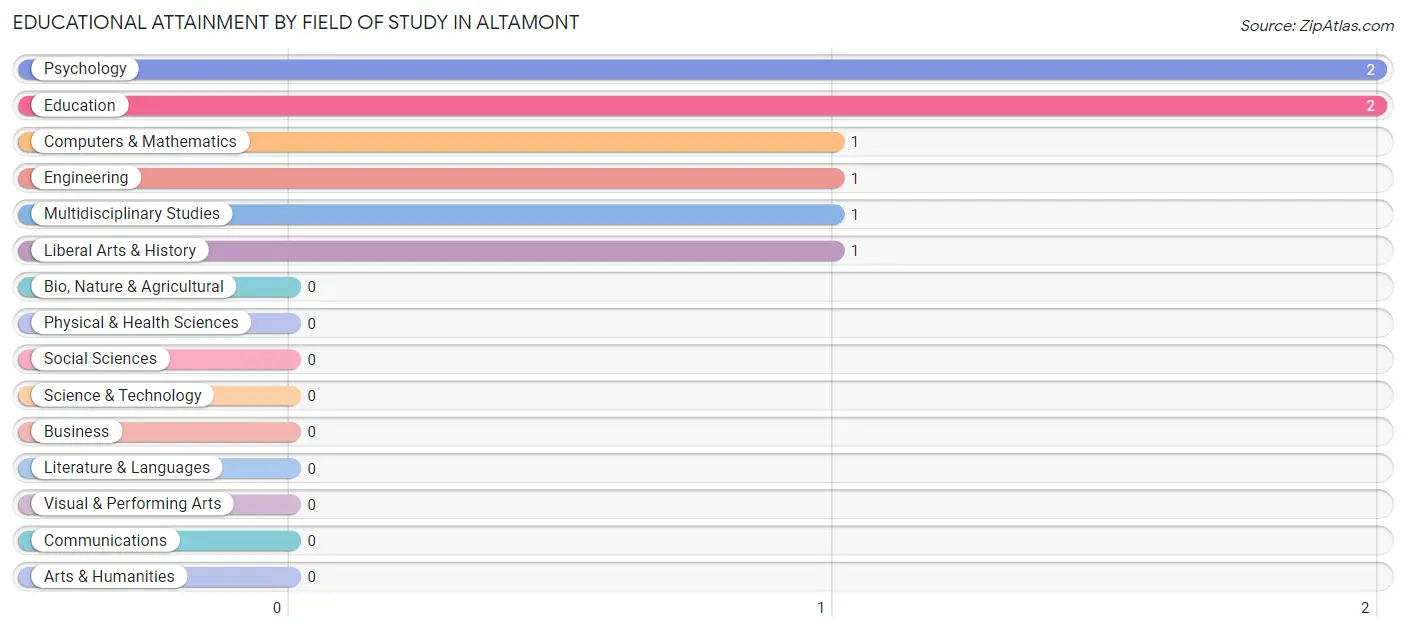
| Field of Study | # Graduates | % Graduates |
| Computers & Mathematics | 1 | 12.5% |
| Bio, Nature & Agricultural | 0 | 0.0% |
| Physical & Health Sciences | 0 | 0.0% |
| Psychology | 2 | 25.0% |
| Social Sciences | 0 | 0.0% |
| Engineering | 1 | 12.5% |
| Multidisciplinary Studies | 1 | 12.5% |
| Science & Technology | 0 | 0.0% |
| Business | 0 | 0.0% |
| Education | 2 | 25.0% |
| Literature & Languages | 0 | 0.0% |
| Liberal Arts & History | 1 | 12.5% |
| Visual & Performing Arts | 0 | 0.0% |
| Communications | 0 | 0.0% |
| Arts & Humanities | 0 | 0.0% |
| Total | 8 | 100.0% |
Transportation & Commute in Altamont
Vehicle Availability by Sex in Altamont
The most prevalent vehicle ownership categories in Altamont are males with 2 vehicles (11, accounting for 33.3%) and females with 2 vehicles (8, making up 52.4%).
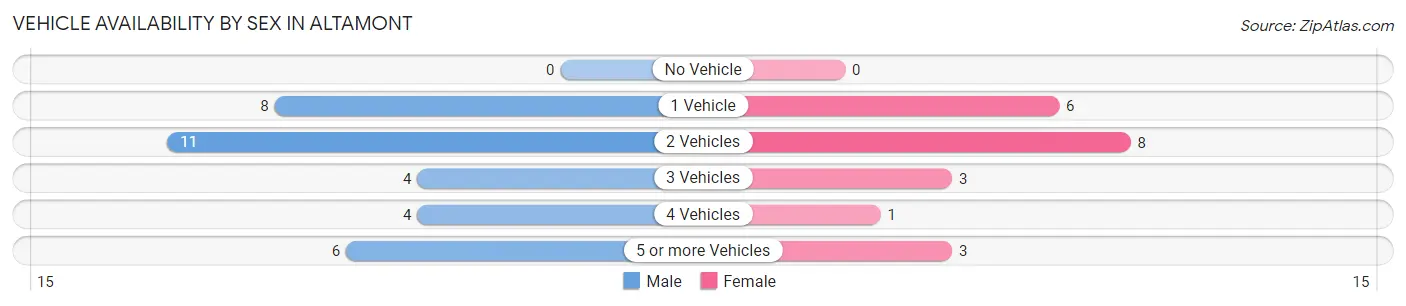
| Vehicles Available | Male | Female |
| No Vehicle | 0 (0.0%) | 0 (0.0%) |
| 1 Vehicle | 8 (24.2%) | 6 (28.6%) |
| 2 Vehicles | 11 (33.3%) | 8 (38.1%) |
| 3 Vehicles | 4 (12.1%) | 3 (14.3%) |
| 4 Vehicles | 4 (12.1%) | 1 (4.8%) |
| 5 or more Vehicles | 6 (18.2%) | 3 (14.3%) |
| Total | 33 (100.0%) | 21 (100.0%) |
Commute Time in Altamont
The most frequently occuring commute durations in Altamont are 10 to 14 minutes (14 commuters, 28.0%), 20 to 24 minutes (14 commuters, 28.0%), and 15 to 19 minutes (8 commuters, 16.0%).
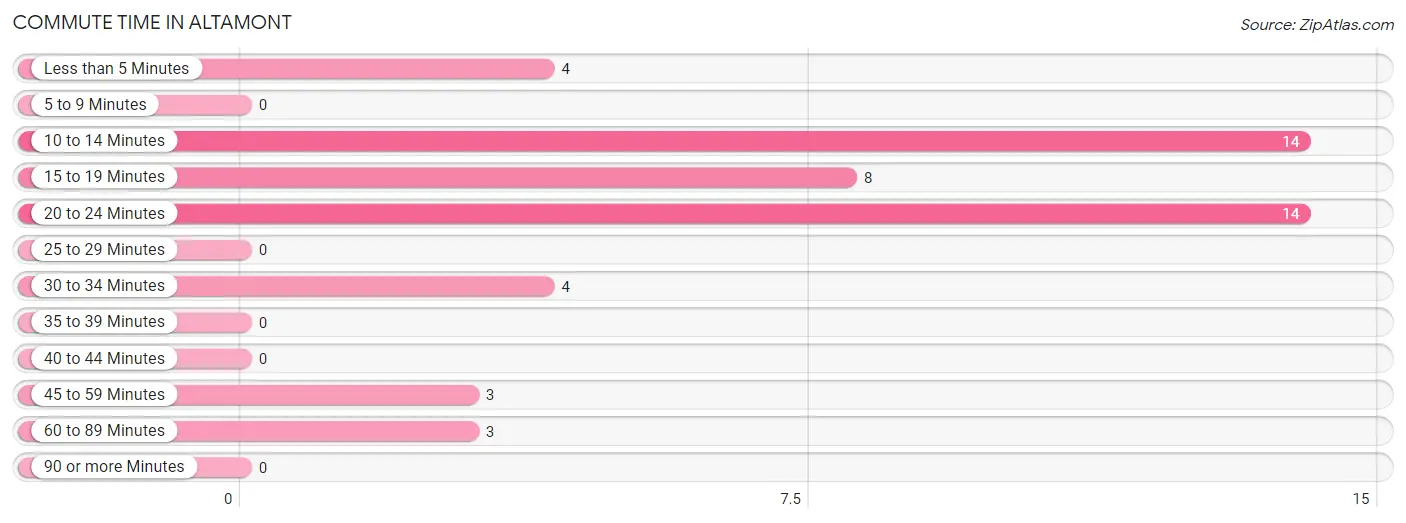
| Commute Time | # Commuters | % Commuters |
| Less than 5 Minutes | 4 | 8.0% |
| 5 to 9 Minutes | 0 | 0.0% |
| 10 to 14 Minutes | 14 | 28.0% |
| 15 to 19 Minutes | 8 | 16.0% |
| 20 to 24 Minutes | 14 | 28.0% |
| 25 to 29 Minutes | 0 | 0.0% |
| 30 to 34 Minutes | 4 | 8.0% |
| 35 to 39 Minutes | 0 | 0.0% |
| 40 to 44 Minutes | 0 | 0.0% |
| 45 to 59 Minutes | 3 | 6.0% |
| 60 to 89 Minutes | 3 | 6.0% |
| 90 or more Minutes | 0 | 0.0% |
Commute Time by Sex in Altamont
The most common commute times in Altamont are 10 to 14 minutes (10 commuters, 34.5%) for males and 20 to 24 minutes (7 commuters, 33.3%) for females.
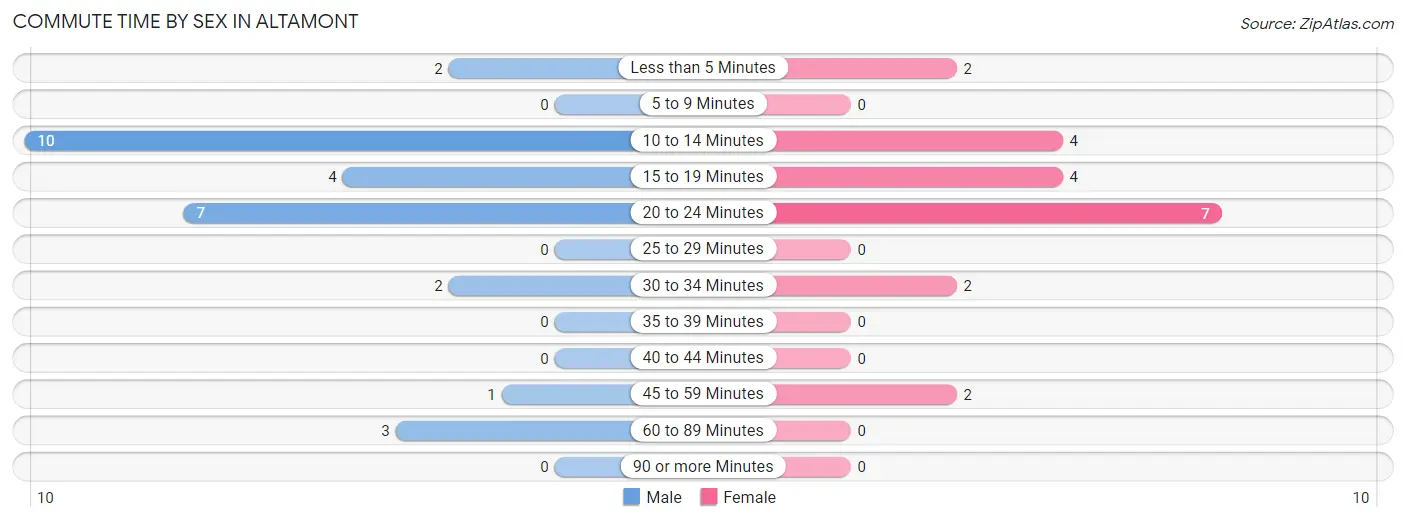
| Commute Time | Male | Female |
| Less than 5 Minutes | 2 (6.9%) | 2 (9.5%) |
| 5 to 9 Minutes | 0 (0.0%) | 0 (0.0%) |
| 10 to 14 Minutes | 10 (34.5%) | 4 (19.1%) |
| 15 to 19 Minutes | 4 (13.8%) | 4 (19.1%) |
| 20 to 24 Minutes | 7 (24.1%) | 7 (33.3%) |
| 25 to 29 Minutes | 0 (0.0%) | 0 (0.0%) |
| 30 to 34 Minutes | 2 (6.9%) | 2 (9.5%) |
| 35 to 39 Minutes | 0 (0.0%) | 0 (0.0%) |
| 40 to 44 Minutes | 0 (0.0%) | 0 (0.0%) |
| 45 to 59 Minutes | 1 (3.5%) | 2 (9.5%) |
| 60 to 89 Minutes | 3 (10.3%) | 0 (0.0%) |
| 90 or more Minutes | 0 (0.0%) | 0 (0.0%) |
Time of Departure to Work by Sex in Altamont
The most frequent times of departure to work in Altamont are 7:30 AM to 7:59 AM (10, 34.5%) for males and 12:00 AM to 4:59 AM (5, 23.8%) for females.
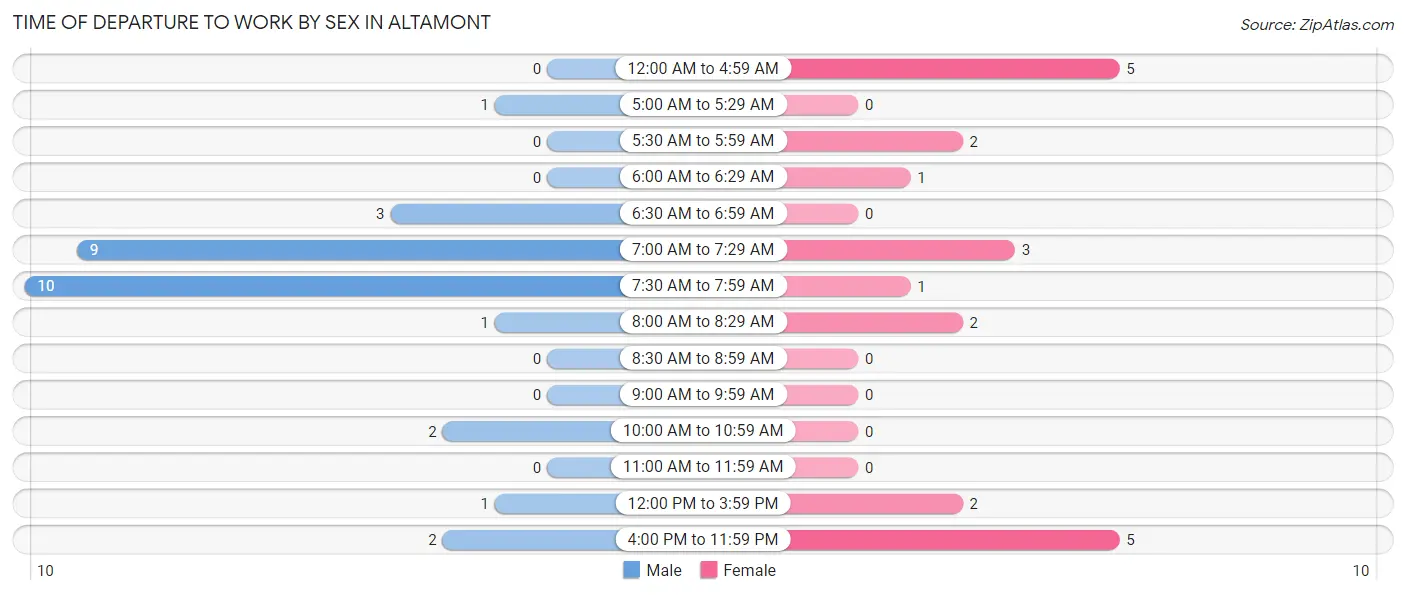
| Time of Departure | Male | Female |
| 12:00 AM to 4:59 AM | 0 (0.0%) | 5 (23.8%) |
| 5:00 AM to 5:29 AM | 1 (3.5%) | 0 (0.0%) |
| 5:30 AM to 5:59 AM | 0 (0.0%) | 2 (9.5%) |
| 6:00 AM to 6:29 AM | 0 (0.0%) | 1 (4.8%) |
| 6:30 AM to 6:59 AM | 3 (10.3%) | 0 (0.0%) |
| 7:00 AM to 7:29 AM | 9 (31.0%) | 3 (14.3%) |
| 7:30 AM to 7:59 AM | 10 (34.5%) | 1 (4.8%) |
| 8:00 AM to 8:29 AM | 1 (3.5%) | 2 (9.5%) |
| 8:30 AM to 8:59 AM | 0 (0.0%) | 0 (0.0%) |
| 9:00 AM to 9:59 AM | 0 (0.0%) | 0 (0.0%) |
| 10:00 AM to 10:59 AM | 2 (6.9%) | 0 (0.0%) |
| 11:00 AM to 11:59 AM | 0 (0.0%) | 0 (0.0%) |
| 12:00 PM to 3:59 PM | 1 (3.5%) | 2 (9.5%) |
| 4:00 PM to 11:59 PM | 2 (6.9%) | 5 (23.8%) |
| Total | 29 (100.0%) | 21 (100.0%) |
Housing Occupancy in Altamont
Occupancy by Ownership in Altamont
Of the total 56 dwellings in Altamont, owner-occupied units account for 48 (85.7%), while renter-occupied units make up 8 (14.3%).
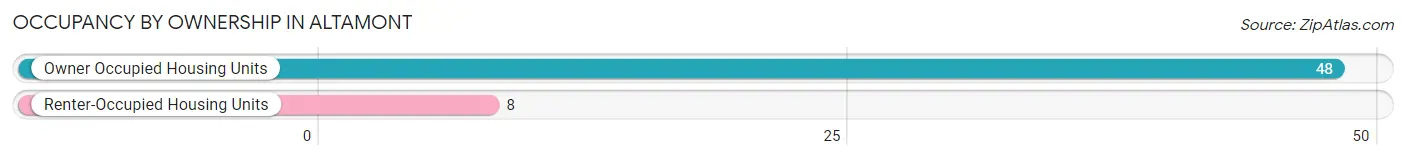
| Occupancy | # Housing Units | % Housing Units |
| Owner Occupied Housing Units | 48 | 85.7% |
| Renter-Occupied Housing Units | 8 | 14.3% |
| Total Occupied Housing Units | 56 | 100.0% |
Occupancy by Household Size in Altamont
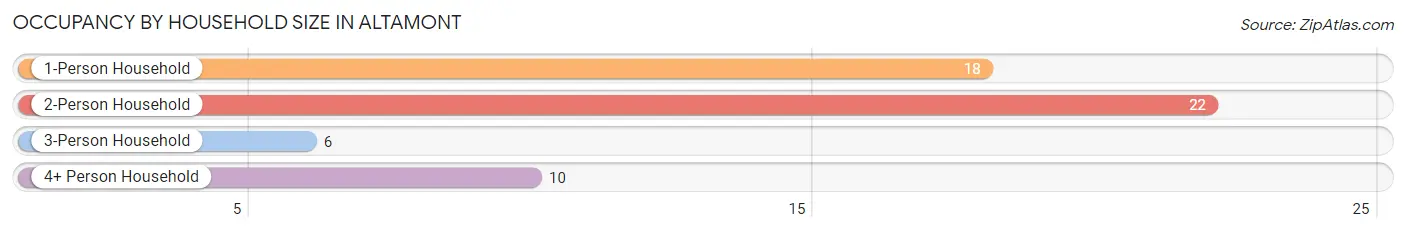
| Household Size | # Housing Units | % Housing Units |
| 1-Person Household | 18 | 32.1% |
| 2-Person Household | 22 | 39.3% |
| 3-Person Household | 6 | 10.7% |
| 4+ Person Household | 10 | 17.9% |
| Total Housing Units | 56 | 100.0% |
Occupancy by Ownership by Household Size in Altamont
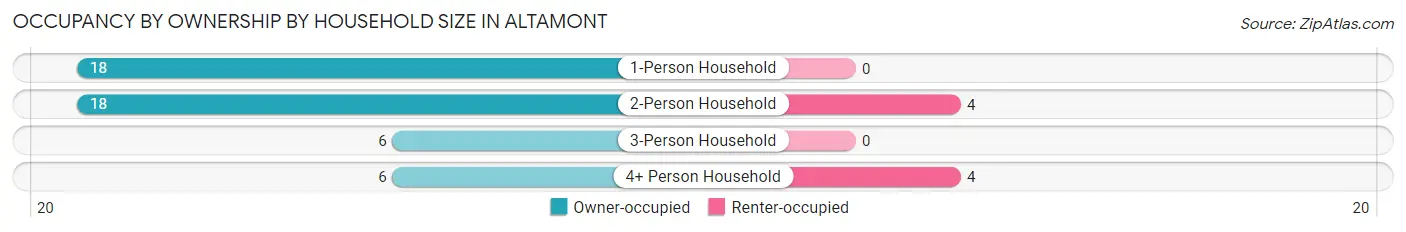
| Household Size | Owner-occupied | Renter-occupied |
| 1-Person Household | 18 (100.0%) | 0 (0.0%) |
| 2-Person Household | 18 (81.8%) | 4 (18.2%) |
| 3-Person Household | 6 (100.0%) | 0 (0.0%) |
| 4+ Person Household | 6 (60.0%) | 4 (40.0%) |
| Total Housing Units | 48 (85.7%) | 8 (14.3%) |
Occupancy by Educational Attainment in Altamont
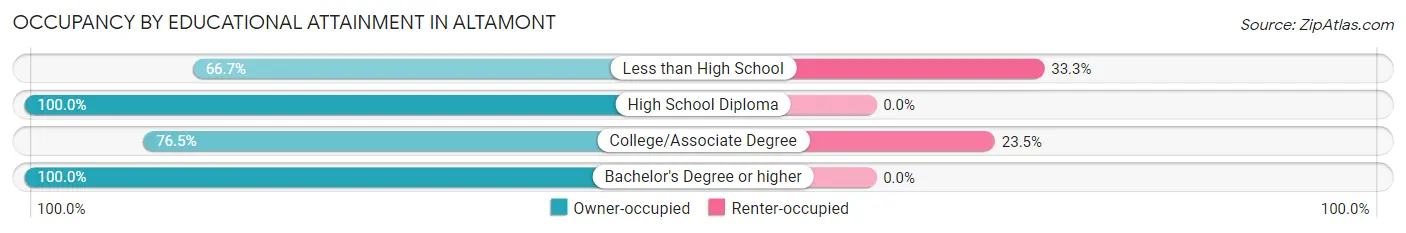
| Household Size | Owner-occupied | Renter-occupied |
| Less than High School | 8 (66.7%) | 4 (33.3%) |
| High School Diploma | 25 (100.0%) | 0 (0.0%) |
| College/Associate Degree | 13 (76.5%) | 4 (23.5%) |
| Bachelor's Degree or higher | 2 (100.0%) | 0 (0.0%) |
Occupancy by Age of Householder in Altamont
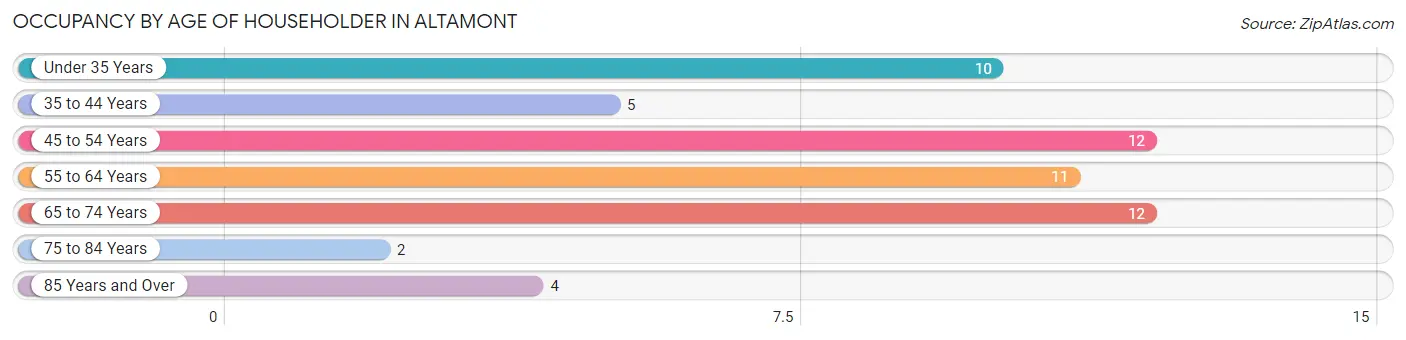
| Age Bracket | # Households | % Households |
| Under 35 Years | 10 | 17.9% |
| 35 to 44 Years | 5 | 8.9% |
| 45 to 54 Years | 12 | 21.4% |
| 55 to 64 Years | 11 | 19.6% |
| 65 to 74 Years | 12 | 21.4% |
| 75 to 84 Years | 2 | 3.6% |
| 85 Years and Over | 4 | 7.1% |
| Total | 56 | 100.0% |
Housing Finances in Altamont
Median Income by Occupancy in Altamont
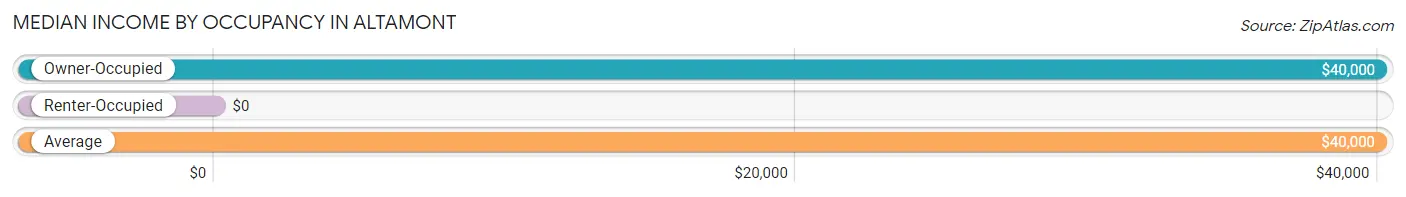
| Occupancy Type | # Households | Median Income |
| Owner-Occupied | 48 (85.7%) | $40,000 |
| Renter-Occupied | 8 (14.3%) | $0 |
| Average | 56 (100.0%) | $40,000 |
Occupancy by Householder Income Bracket in Altamont
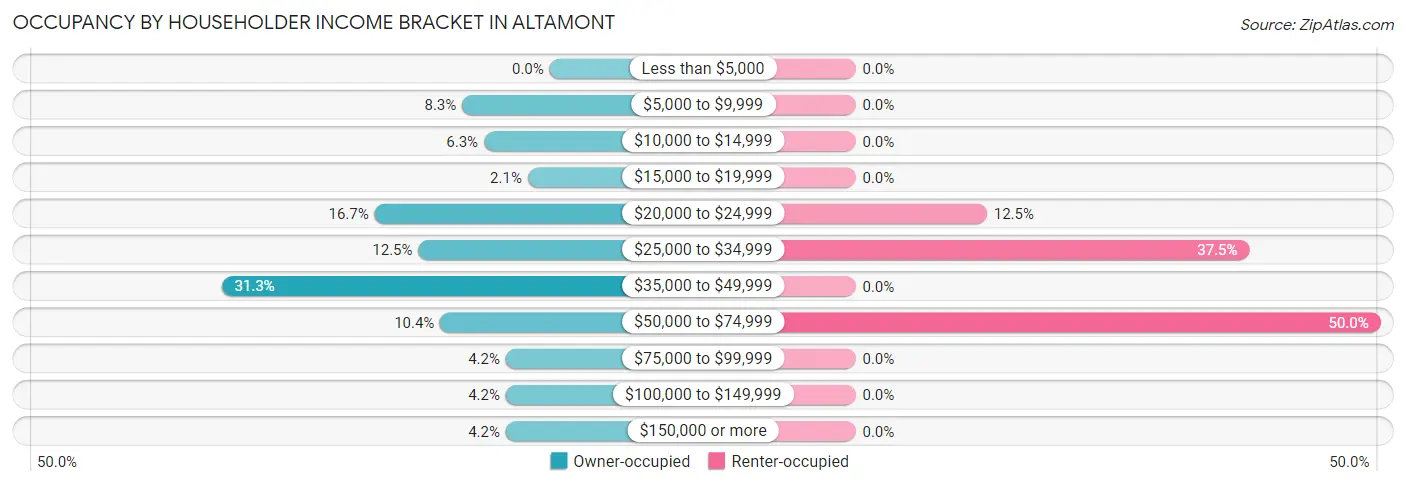
| Income Bracket | Owner-occupied | Renter-occupied |
| Less than $5,000 | 0 (0.0%) | 0 (0.0%) |
| $5,000 to $9,999 | 4 (8.3%) | 0 (0.0%) |
| $10,000 to $14,999 | 3 (6.2%) | 0 (0.0%) |
| $15,000 to $19,999 | 1 (2.1%) | 0 (0.0%) |
| $20,000 to $24,999 | 8 (16.7%) | 1 (12.5%) |
| $25,000 to $34,999 | 6 (12.5%) | 3 (37.5%) |
| $35,000 to $49,999 | 15 (31.2%) | 0 (0.0%) |
| $50,000 to $74,999 | 5 (10.4%) | 4 (50.0%) |
| $75,000 to $99,999 | 2 (4.2%) | 0 (0.0%) |
| $100,000 to $149,999 | 2 (4.2%) | 0 (0.0%) |
| $150,000 or more | 2 (4.2%) | 0 (0.0%) |
| Total | 48 (100.0%) | 8 (100.0%) |
Monthly Housing Cost Tiers in Altamont
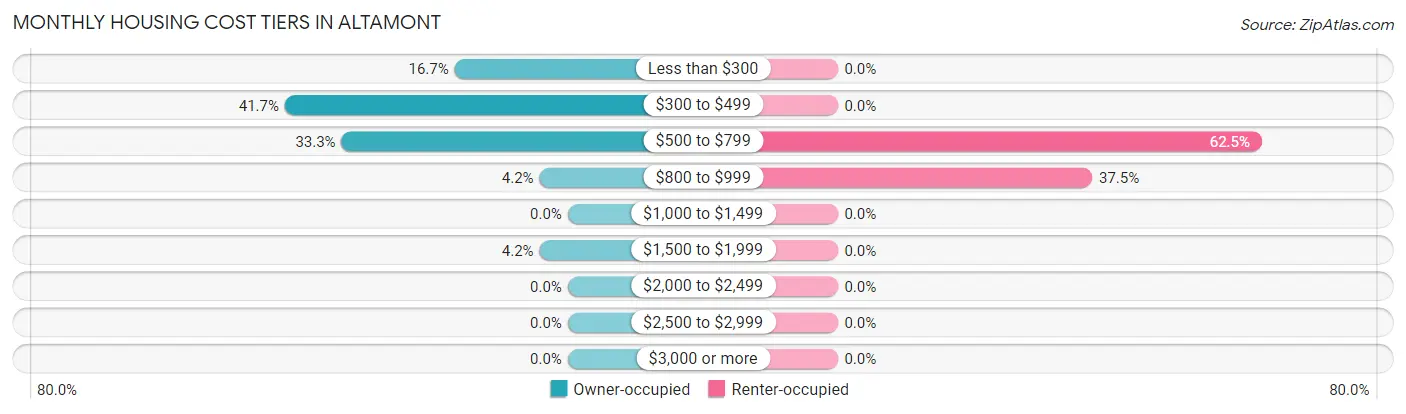
| Monthly Cost | Owner-occupied | Renter-occupied |
| Less than $300 | 8 (16.7%) | 0 (0.0%) |
| $300 to $499 | 20 (41.7%) | 0 (0.0%) |
| $500 to $799 | 16 (33.3%) | 5 (62.5%) |
| $800 to $999 | 2 (4.2%) | 3 (37.5%) |
| $1,000 to $1,499 | 0 (0.0%) | 0 (0.0%) |
| $1,500 to $1,999 | 2 (4.2%) | 0 (0.0%) |
| $2,000 to $2,499 | 0 (0.0%) | 0 (0.0%) |
| $2,500 to $2,999 | 0 (0.0%) | 0 (0.0%) |
| $3,000 or more | 0 (0.0%) | 0 (0.0%) |
| Total | 48 (100.0%) | 8 (100.0%) |
Physical Housing Characteristics in Altamont
Housing Structures in Altamont
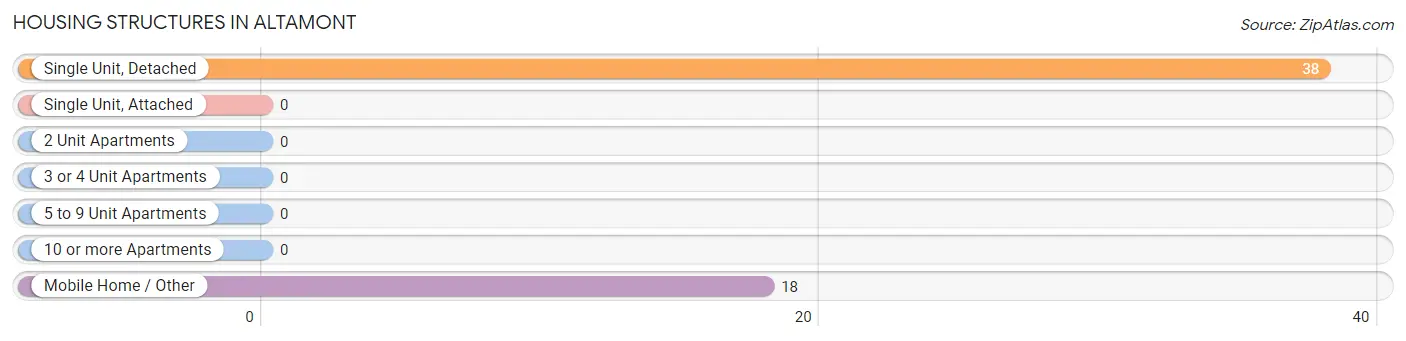
| Structure Type | # Housing Units | % Housing Units |
| Single Unit, Detached | 38 | 67.9% |
| Single Unit, Attached | 0 | 0.0% |
| 2 Unit Apartments | 0 | 0.0% |
| 3 or 4 Unit Apartments | 0 | 0.0% |
| 5 to 9 Unit Apartments | 0 | 0.0% |
| 10 or more Apartments | 0 | 0.0% |
| Mobile Home / Other | 18 | 32.1% |
| Total | 56 | 100.0% |
Housing Structures by Occupancy in Altamont
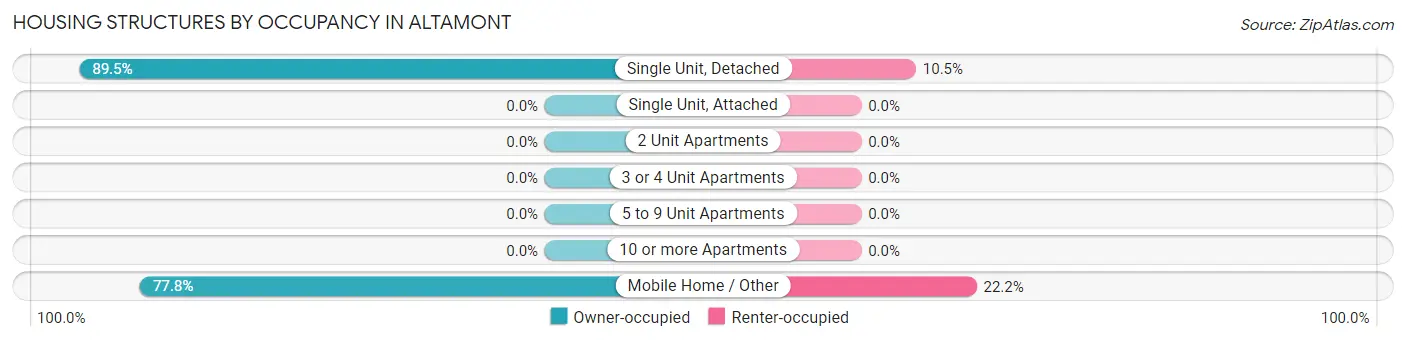
| Structure Type | Owner-occupied | Renter-occupied |
| Single Unit, Detached | 34 (89.5%) | 4 (10.5%) |
| Single Unit, Attached | 0 (0.0%) | 0 (0.0%) |
| 2 Unit Apartments | 0 (0.0%) | 0 (0.0%) |
| 3 or 4 Unit Apartments | 0 (0.0%) | 0 (0.0%) |
| 5 to 9 Unit Apartments | 0 (0.0%) | 0 (0.0%) |
| 10 or more Apartments | 0 (0.0%) | 0 (0.0%) |
| Mobile Home / Other | 14 (77.8%) | 4 (22.2%) |
| Total | 48 (85.7%) | 8 (14.3%) |
Housing Structures by Number of Rooms in Altamont
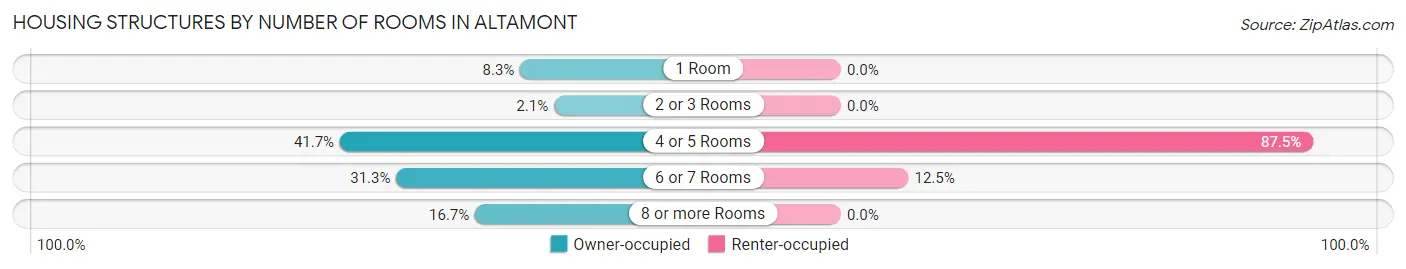
| Number of Rooms | Owner-occupied | Renter-occupied |
| 1 Room | 4 (8.3%) | 0 (0.0%) |
| 2 or 3 Rooms | 1 (2.1%) | 0 (0.0%) |
| 4 or 5 Rooms | 20 (41.7%) | 7 (87.5%) |
| 6 or 7 Rooms | 15 (31.2%) | 1 (12.5%) |
| 8 or more Rooms | 8 (16.7%) | 0 (0.0%) |
| Total | 48 (100.0%) | 8 (100.0%) |
Housing Structure by Heating Type in Altamont
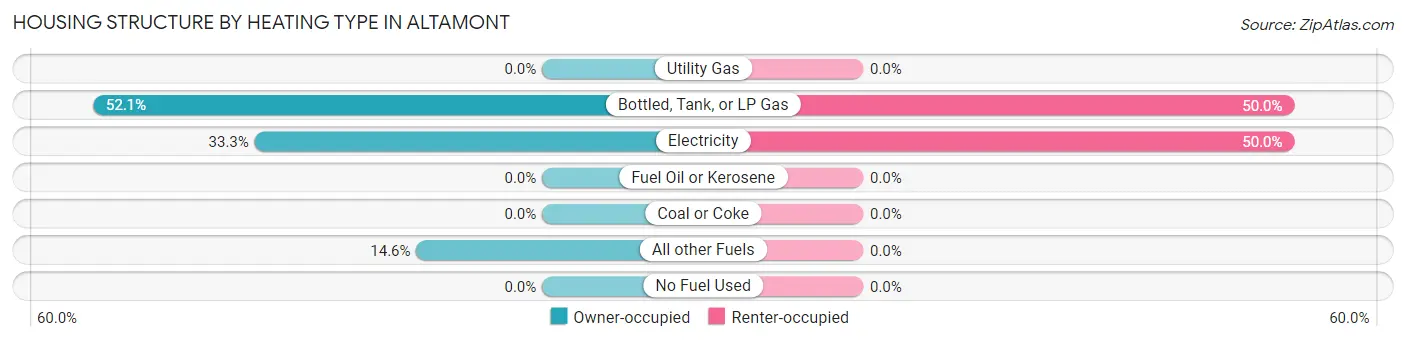
| Heating Type | Owner-occupied | Renter-occupied |
| Utility Gas | 0 (0.0%) | 0 (0.0%) |
| Bottled, Tank, or LP Gas | 25 (52.1%) | 4 (50.0%) |
| Electricity | 16 (33.3%) | 4 (50.0%) |
| Fuel Oil or Kerosene | 0 (0.0%) | 0 (0.0%) |
| Coal or Coke | 0 (0.0%) | 0 (0.0%) |
| All other Fuels | 7 (14.6%) | 0 (0.0%) |
| No Fuel Used | 0 (0.0%) | 0 (0.0%) |
| Total | 48 (100.0%) | 8 (100.0%) |
Household Vehicle Usage in Altamont
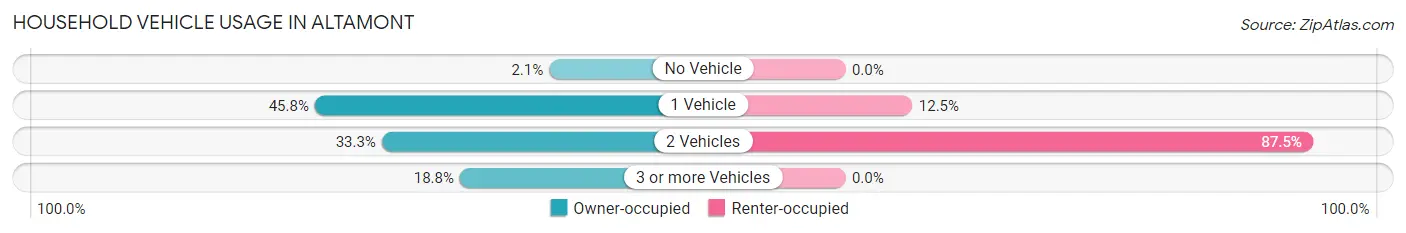
| Vehicles per Household | Owner-occupied | Renter-occupied |
| No Vehicle | 1 (2.1%) | 0 (0.0%) |
| 1 Vehicle | 22 (45.8%) | 1 (12.5%) |
| 2 Vehicles | 16 (33.3%) | 7 (87.5%) |
| 3 or more Vehicles | 9 (18.8%) | 0 (0.0%) |
| Total | 48 (100.0%) | 8 (100.0%) |
Real Estate & Mortgages in Altamont
Real Estate and Mortgage Overview in Altamont
| Characteristic | Without Mortgage | With Mortgage |
| Housing Units | 38 | 10 |
| Median Property Value | - | - |
| Median Household Income | $37,500 | $0 |
| Monthly Housing Costs | $373 | $0 |
| Real Estate Taxes | - | - |
Property Value by Mortgage Status in Altamont
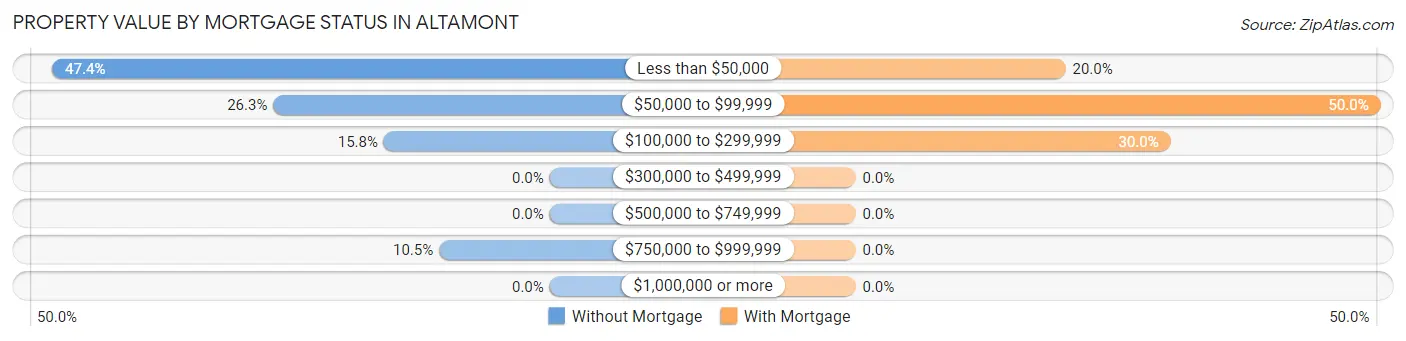
| Property Value | Without Mortgage | With Mortgage |
| Less than $50,000 | 18 (47.4%) | 2 (20.0%) |
| $50,000 to $99,999 | 10 (26.3%) | 5 (50.0%) |
| $100,000 to $299,999 | 6 (15.8%) | 3 (30.0%) |
| $300,000 to $499,999 | 0 (0.0%) | 0 (0.0%) |
| $500,000 to $749,999 | 0 (0.0%) | 0 (0.0%) |
| $750,000 to $999,999 | 4 (10.5%) | 0 (0.0%) |
| $1,000,000 or more | 0 (0.0%) | 0 (0.0%) |
| Total | 38 (100.0%) | 10 (100.0%) |
Household Income by Mortgage Status in Altamont
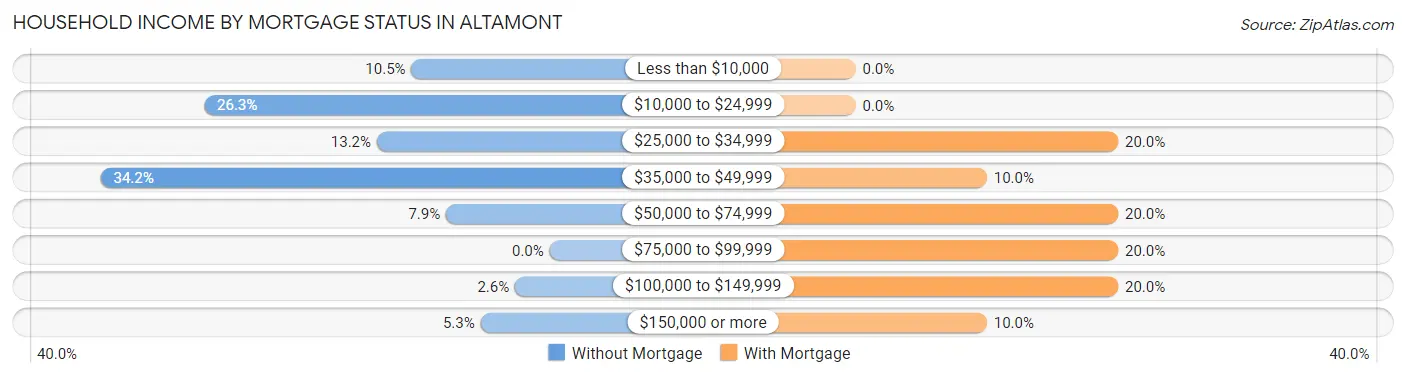
| Household Income | Without Mortgage | With Mortgage |
| Less than $10,000 | 4 (10.5%) | 0 (0.0%) |
| $10,000 to $24,999 | 10 (26.3%) | 0 (0.0%) |
| $25,000 to $34,999 | 5 (13.2%) | 2 (20.0%) |
| $35,000 to $49,999 | 13 (34.2%) | 1 (10.0%) |
| $50,000 to $74,999 | 3 (7.9%) | 2 (20.0%) |
| $75,000 to $99,999 | 0 (0.0%) | 2 (20.0%) |
| $100,000 to $149,999 | 1 (2.6%) | 2 (20.0%) |
| $150,000 or more | 2 (5.3%) | 1 (10.0%) |
| Total | 38 (100.0%) | 10 (100.0%) |
Property Value to Household Income Ratio in Altamont
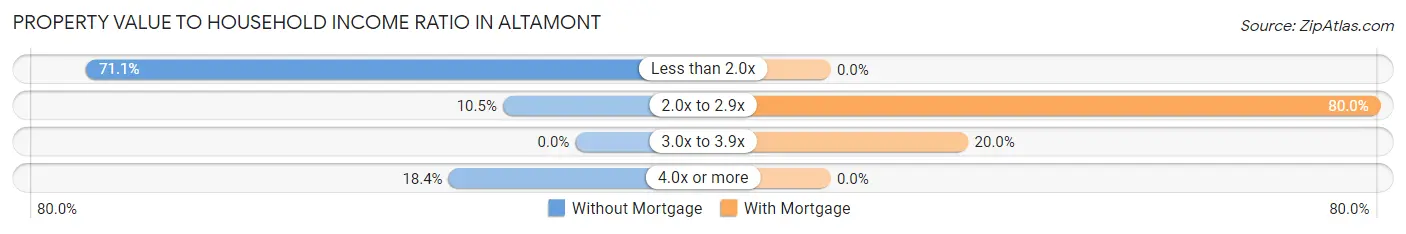
| Value-to-Income Ratio | Without Mortgage | With Mortgage |
| Less than 2.0x | 27 (71.1%) | 0 (0.0%) |
| 2.0x to 2.9x | 4 (10.5%) | 8 (80.0%) |
| 3.0x to 3.9x | 0 (0.0%) | 2 (20.0%) |
| 4.0x or more | 7 (18.4%) | 0 (0.0%) |
| Total | 38 (100.0%) | 10 (100.0%) |
Real Estate Taxes by Mortgage Status in Altamont
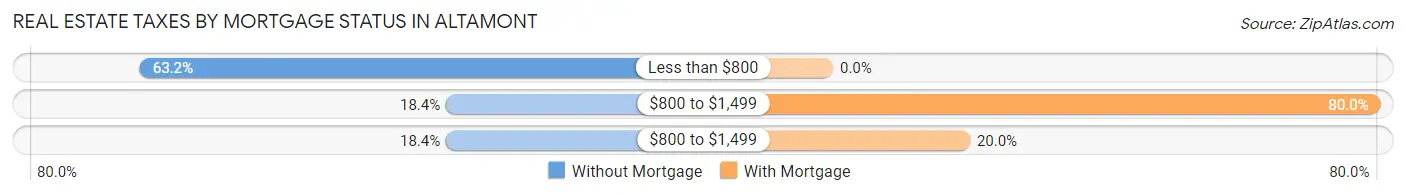
| Property Taxes | Without Mortgage | With Mortgage |
| Less than $800 | 24 (63.2%) | 0 (0.0%) |
| $800 to $1,499 | 7 (18.4%) | 8 (80.0%) |
| $800 to $1,499 | 7 (18.4%) | 2 (20.0%) |
| Total | 38 (100.0%) | 10 (100.0%) |
Health & Disability in Altamont
Health Insurance Coverage by Age in Altamont
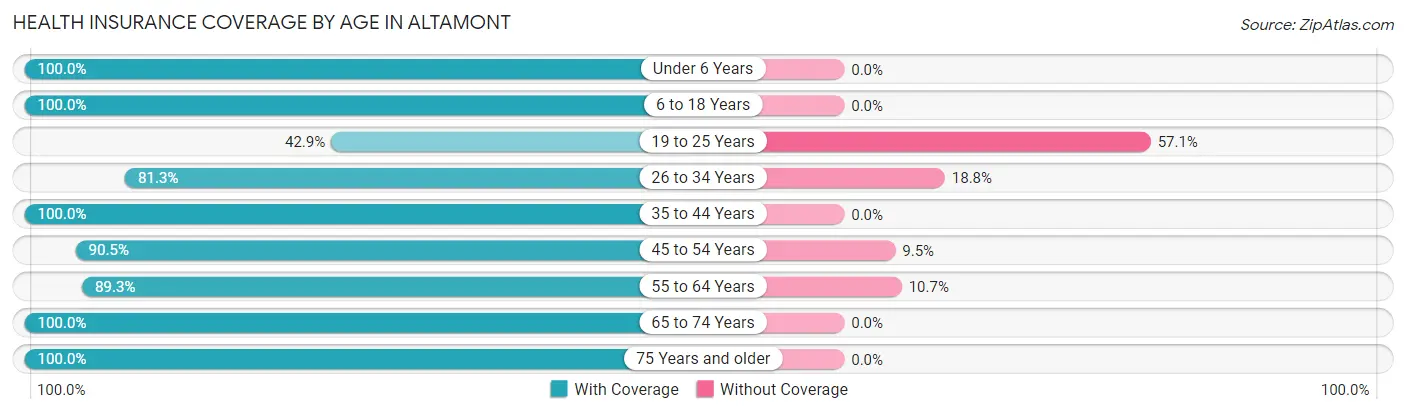
| Age Bracket | With Coverage | Without Coverage |
| Under 6 Years | 18 (100.0%) | 0 (0.0%) |
| 6 to 18 Years | 26 (100.0%) | 0 (0.0%) |
| 19 to 25 Years | 3 (42.9%) | 4 (57.1%) |
| 26 to 34 Years | 13 (81.2%) | 3 (18.8%) |
| 35 to 44 Years | 14 (100.0%) | 0 (0.0%) |
| 45 to 54 Years | 19 (90.5%) | 2 (9.5%) |
| 55 to 64 Years | 25 (89.3%) | 3 (10.7%) |
| 65 to 74 Years | 18 (100.0%) | 0 (0.0%) |
| 75 Years and older | 8 (100.0%) | 0 (0.0%) |
| Total | 144 (92.3%) | 12 (7.7%) |
Health Insurance Coverage by Citizenship Status in Altamont
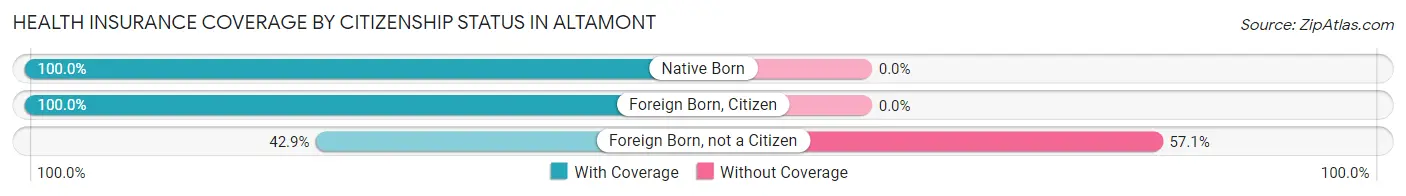
| Citizenship Status | With Coverage | Without Coverage |
| Native Born | 18 (100.0%) | 0 (0.0%) |
| Foreign Born, Citizen | 26 (100.0%) | 0 (0.0%) |
| Foreign Born, not a Citizen | 3 (42.9%) | 4 (57.1%) |
Health Insurance Coverage by Household Income in Altamont
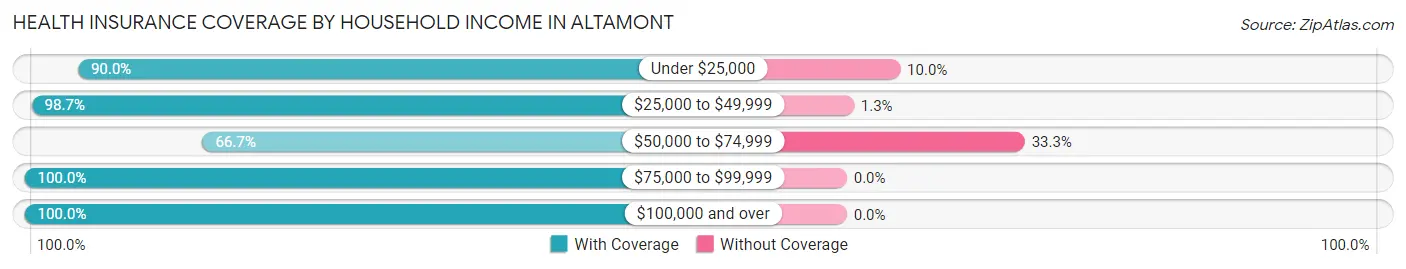
| Household Income | With Coverage | Without Coverage |
| Under $25,000 | 36 (90.0%) | 4 (10.0%) |
| $25,000 to $49,999 | 75 (98.7%) | 1 (1.3%) |
| $50,000 to $74,999 | 14 (66.7%) | 7 (33.3%) |
| $75,000 to $99,999 | 5 (100.0%) | 0 (0.0%) |
| $100,000 and over | 14 (100.0%) | 0 (0.0%) |
Public vs Private Health Insurance Coverage by Age in Altamont
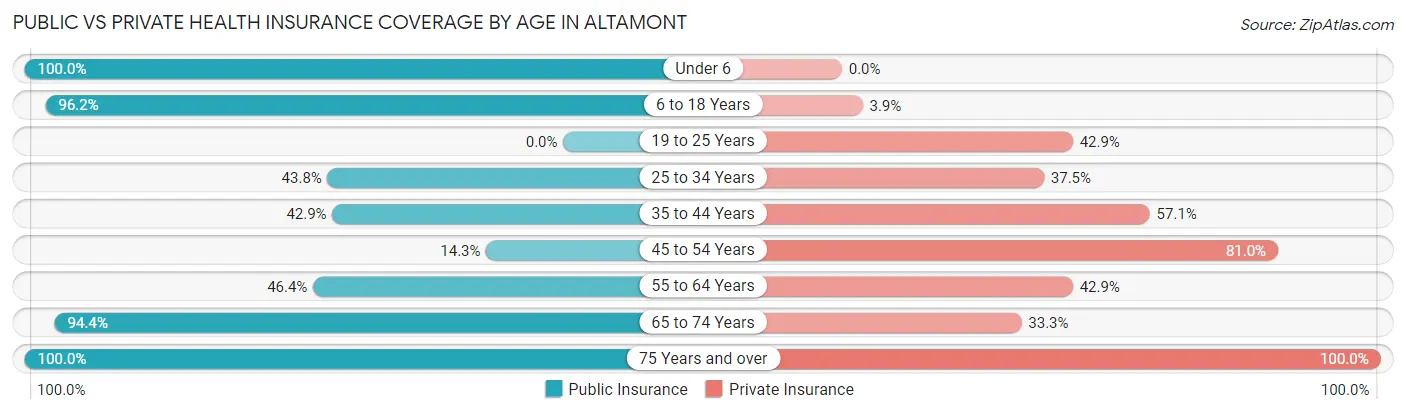
| Age Bracket | Public Insurance | Private Insurance |
| Under 6 | 18 (100.0%) | 0 (0.0%) |
| 6 to 18 Years | 25 (96.2%) | 1 (3.8%) |
| 19 to 25 Years | 0 (0.0%) | 3 (42.9%) |
| 25 to 34 Years | 7 (43.8%) | 6 (37.5%) |
| 35 to 44 Years | 6 (42.9%) | 8 (57.1%) |
| 45 to 54 Years | 3 (14.3%) | 17 (80.9%) |
| 55 to 64 Years | 13 (46.4%) | 12 (42.9%) |
| 65 to 74 Years | 17 (94.4%) | 6 (33.3%) |
| 75 Years and over | 8 (100.0%) | 8 (100.0%) |
| Total | 97 (62.2%) | 61 (39.1%) |
Disability Status by Sex by Age in Altamont
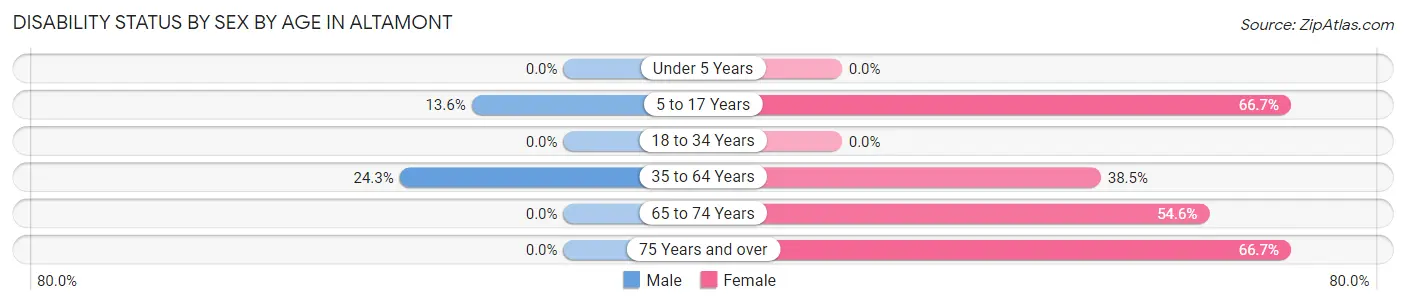
| Age Bracket | Male | Female |
| Under 5 Years | 0 (0.0%) | 0 (0.0%) |
| 5 to 17 Years | 3 (13.6%) | 2 (66.7%) |
| 18 to 34 Years | 0 (0.0%) | 0 (0.0%) |
| 35 to 64 Years | 9 (24.3%) | 10 (38.5%) |
| 65 to 74 Years | 0 (0.0%) | 6 (54.5%) |
| 75 Years and over | 0 (0.0%) | 4 (66.7%) |
Disability Class by Sex by Age in Altamont
Disability Class: Hearing Difficulty
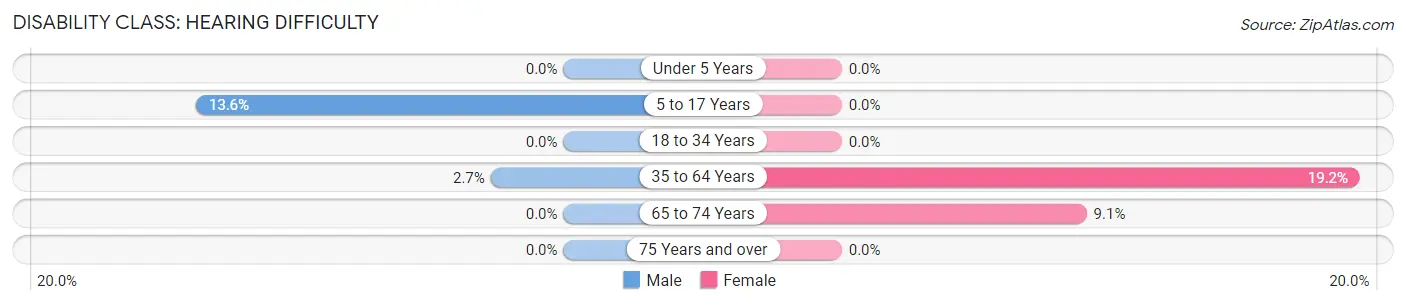
| Age Bracket | Male | Female |
| Under 5 Years | 0 (0.0%) | 0 (0.0%) |
| 5 to 17 Years | 3 (13.6%) | 0 (0.0%) |
| 18 to 34 Years | 0 (0.0%) | 0 (0.0%) |
| 35 to 64 Years | 1 (2.7%) | 5 (19.2%) |
| 65 to 74 Years | 0 (0.0%) | 1 (9.1%) |
| 75 Years and over | 0 (0.0%) | 0 (0.0%) |
Disability Class: Vision Difficulty
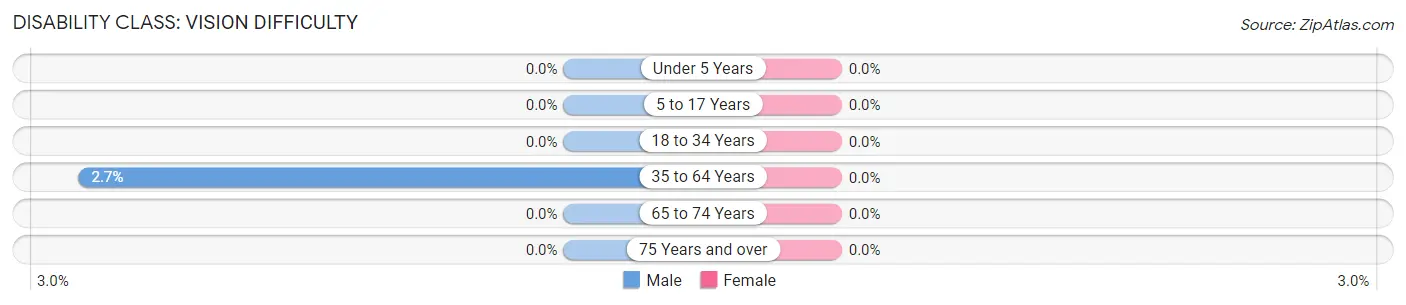
| Age Bracket | Male | Female |
| Under 5 Years | 0 (0.0%) | 0 (0.0%) |
| 5 to 17 Years | 0 (0.0%) | 0 (0.0%) |
| 18 to 34 Years | 0 (0.0%) | 0 (0.0%) |
| 35 to 64 Years | 1 (2.7%) | 0 (0.0%) |
| 65 to 74 Years | 0 (0.0%) | 0 (0.0%) |
| 75 Years and over | 0 (0.0%) | 0 (0.0%) |
Disability Class: Cognitive Difficulty
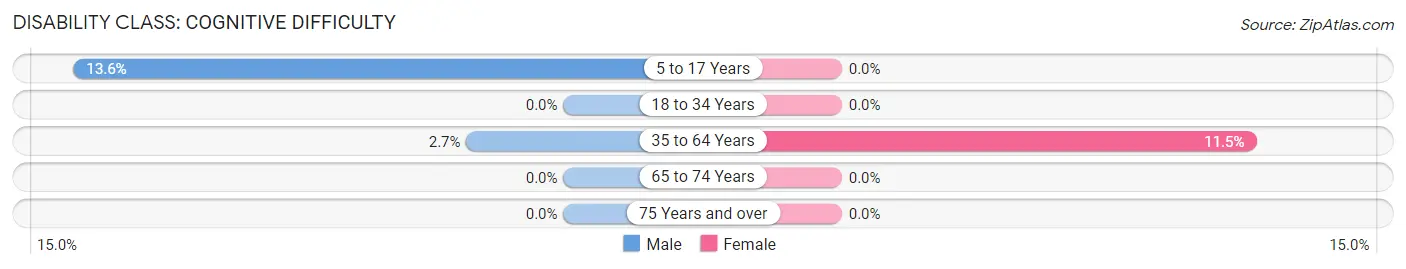
| Age Bracket | Male | Female |
| 5 to 17 Years | 3 (13.6%) | 0 (0.0%) |
| 18 to 34 Years | 0 (0.0%) | 0 (0.0%) |
| 35 to 64 Years | 1 (2.7%) | 3 (11.5%) |
| 65 to 74 Years | 0 (0.0%) | 0 (0.0%) |
| 75 Years and over | 0 (0.0%) | 0 (0.0%) |
Disability Class: Ambulatory Difficulty
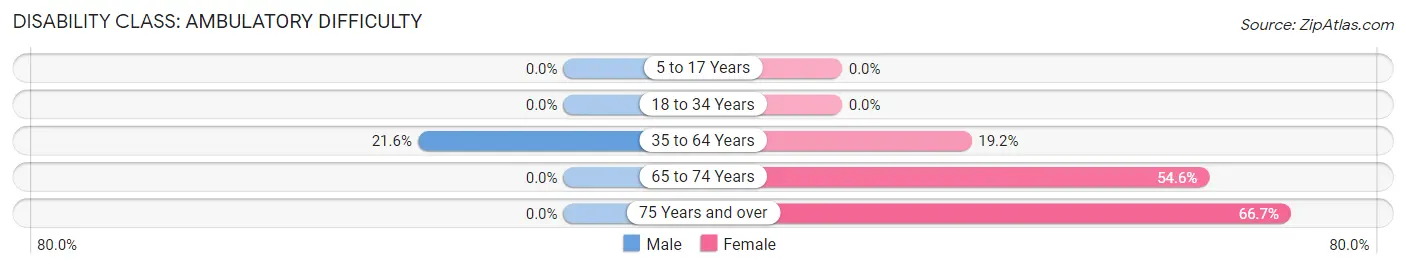
| Age Bracket | Male | Female |
| 5 to 17 Years | 0 (0.0%) | 0 (0.0%) |
| 18 to 34 Years | 0 (0.0%) | 0 (0.0%) |
| 35 to 64 Years | 8 (21.6%) | 5 (19.2%) |
| 65 to 74 Years | 0 (0.0%) | 6 (54.5%) |
| 75 Years and over | 0 (0.0%) | 4 (66.7%) |
Disability Class: Self-Care Difficulty
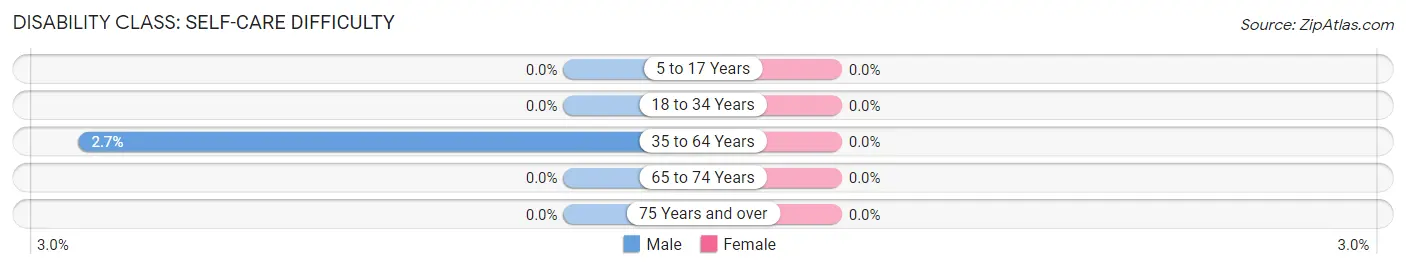
| Age Bracket | Male | Female |
| 5 to 17 Years | 0 (0.0%) | 0 (0.0%) |
| 18 to 34 Years | 0 (0.0%) | 0 (0.0%) |
| 35 to 64 Years | 1 (2.7%) | 0 (0.0%) |
| 65 to 74 Years | 0 (0.0%) | 0 (0.0%) |
| 75 Years and over | 0 (0.0%) | 0 (0.0%) |
Technology Access in Altamont
Computing Device Access in Altamont
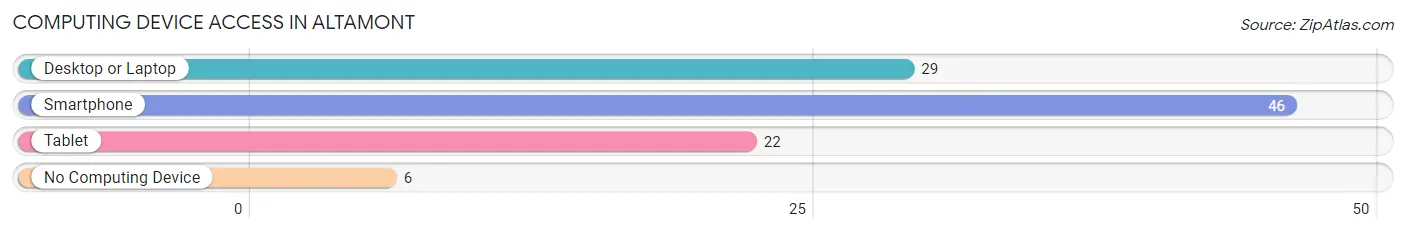
| Device Type | # Households | % Households |
| Desktop or Laptop | 29 | 51.8% |
| Smartphone | 46 | 82.1% |
| Tablet | 22 | 39.3% |
| No Computing Device | 6 | 10.7% |
| Total | 56 | 100.0% |
Internet Access in Altamont
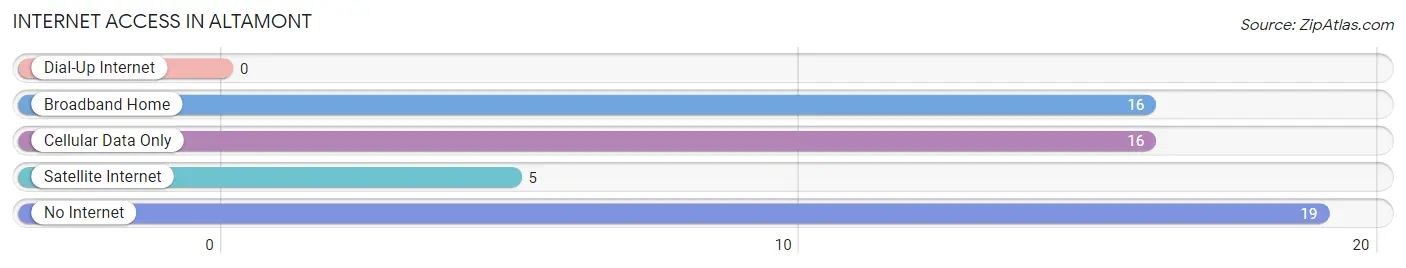
| Internet Type | # Households | % Households |
| Dial-Up Internet | 0 | 0.0% |
| Broadband Home | 16 | 28.6% |
| Cellular Data Only | 16 | 28.6% |
| Satellite Internet | 5 | 8.9% |
| No Internet | 19 | 33.9% |
| Total | 56 | 100.0% |
Altamont Summary
Altamont, Missouri is a small town located in the southeastern corner of the state, near the Mississippi River. It is part of the St. Louis metropolitan area and is located in St. Louis County. The population of Altamont was 1,845 in the 2010 census.
Geography
Altamont is located at 38°25'25" North, 90°25'45" West (38.423, -90.429). It is situated on the banks of the Mississippi River, just south of the city of St. Louis. The town is located in the southeastern corner of St. Louis County, and is bordered by the towns of Arnold, Fenton, and Valley Park. The total area of Altamont is 1.2 square miles, all of which is land.
History
Altamont was founded in 1867 by a group of German immigrants who had settled in the area. The town was named after the nearby Altamont Plantation, which was owned by a prominent local family. The town grew slowly over the years, and by the early 20th century, it had become a popular tourist destination.
In the 1950s, the town began to experience a decline in population as many of its residents moved away to larger cities. However, in recent years, the town has seen a resurgence in population as people have moved back to the area.
Economy
The economy of Altamont is largely based on tourism and small businesses. The town is home to several small businesses, including restaurants, shops, and a few small manufacturing companies. The town also has a few small farms, which produce a variety of crops.
The town is also home to a few large employers, including a local hospital and a large manufacturing plant. The town also has a few small industrial parks, which are home to a variety of businesses.
Demographics
As of the 2010 census, the population of Altamont was 1,845. The racial makeup of the town was 95.3% White, 1.2% African American, 0.3% Native American, 0.7% Asian, 0.1% Pacific Islander, 0.7% from other races, and 1.9% from two or more races. Hispanic or Latino of any race were 2.2% of the population.
The median income for a household in Altamont was $45,000, and the median income for a family was $50,000. The per capita income for the town was $20,000. About 8.3% of families and 10.2% of the population were below the poverty line, including 14.3% of those under age 18 and 6.2% of those age 65 or over.
Altamont is a small town with a rich history and a bright future. The town has a diverse population and a strong economy, and is a great place to live and work.
Common Questions
What is Per Capita Income in Altamont?
Per Capita income in Altamont is $18,221.
What is the Median Family Income in Altamont?
Median Family Income in Altamont is $43,750.
What is the Median Household income in Altamont?
Median Household Income in Altamont is $40,000.
What is Income or Wage Gap in Altamont?
Income or Wage Gap in Altamont is 25.4%.
Women in Altamont earn 74.6 cents for every dollar earned by a man.
What is Inequality or Gini Index in Altamont?
Inequality or Gini Index in Altamont is 0.36.
What is the Total Population of Altamont?
Total Population of Altamont is 156.
What is the Total Male Population of Altamont?
Total Male Population of Altamont is 88.
What is the Total Female Population of Altamont?
Total Female Population of Altamont is 68.
What is the Ratio of Males per 100 Females in Altamont?
There are 129.41 Males per 100 Females in Altamont.
What is the Ratio of Females per 100 Males in Altamont?
There are 77.27 Females per 100 Males in Altamont.
What is the Median Population Age in Altamont?
Median Population Age in Altamont is 44.3 Years.
What is the Average Family Size in Altamont
Average Family Size in Altamont is 4.1 People.
What is the Average Household Size in Altamont
Average Household Size in Altamont is 2.8 People.
How Large is the Labor Force in Altamont?
There are 54 People in the Labor Forcein in Altamont.
What is the Percentage of People in the Labor Force in Altamont?
45.4% of People are in the Labor Force in Altamont.