Zip Codes with the Highest Percentage of Families with Income Above $200,000 in Hopkins, MN
RELATED REPORTS & OPTIONS
Family Income | $200k+
Hopkins
Compare Zip Codes
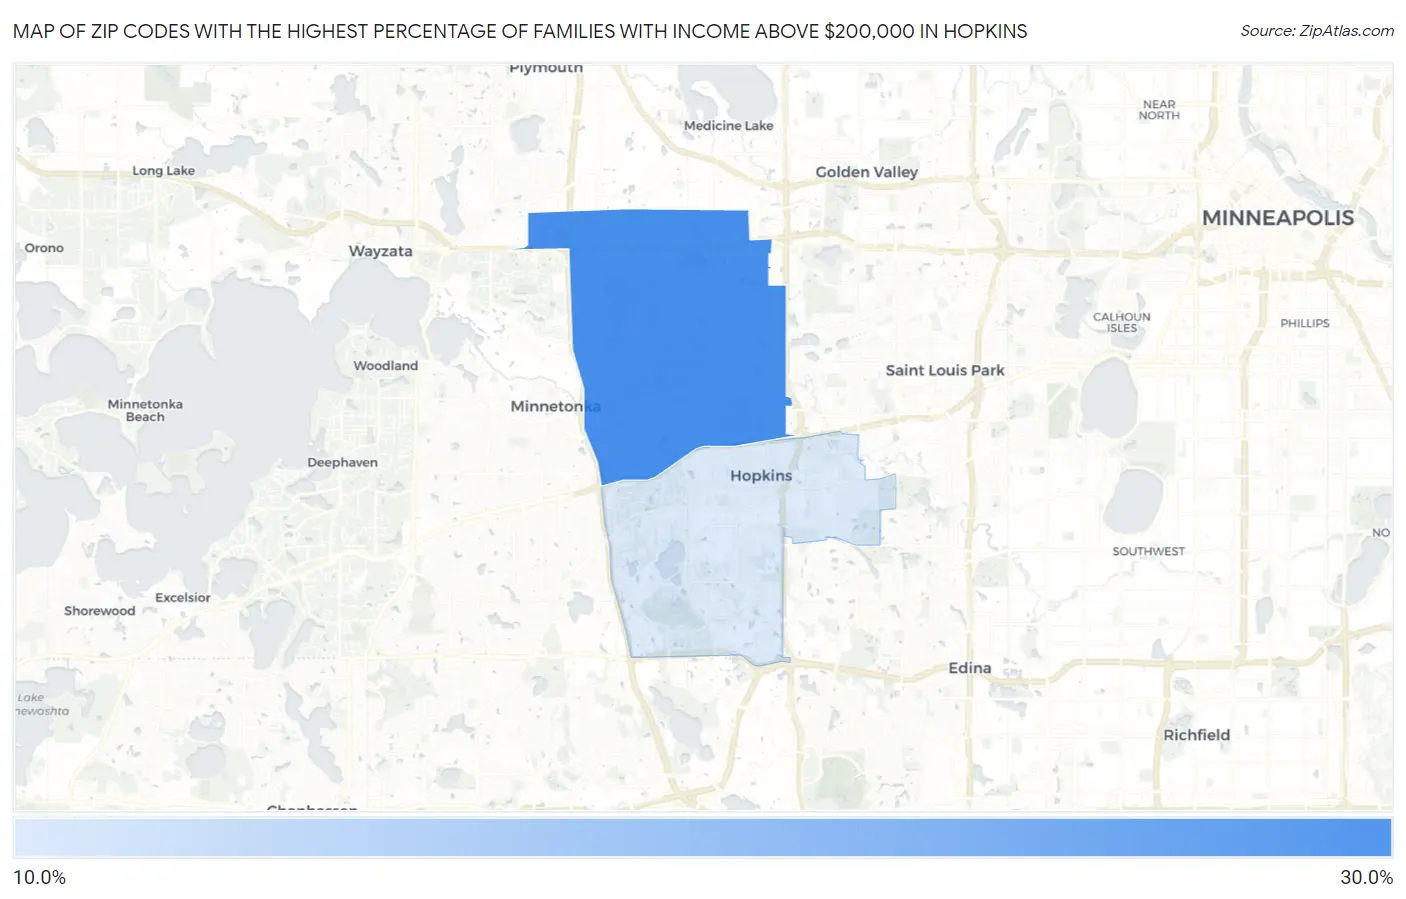
Map of Zip Codes with the Highest Percentage of Families with Income Above $200,000 in Hopkins
17.1%
26.0%
Zip Codes with the Highest Percentage of Families with Income Above $200,000 in Hopkins, MN
| Zip Code | Families with Income > $200k | vs State | vs National | |
| 1. | 55305 | 26.0% | 16.5%(+9.50)#54 | 14.8%(+11.2)#3,243 |
| 2. | 55343 | 17.1% | 16.5%(+0.600)#127 | 14.8%(+2.30)#5,935 |
1
Common Questions
What are the Top Zip Codes with the Highest Percentage of Families with Income Above $200,000 in Hopkins, MN?
Top Zip Codes with the Highest Percentage of Families with Income Above $200,000 in Hopkins, MN are:
What zip code has the Highest Percentage of Families with Income Above $200,000 in Hopkins, MN?
55305 has the Highest Percentage of Families with Income Above $200,000 in Hopkins, MN with 26.0%.
What is the Percentage of Families with Income Above $200,000 in Hopkins, MN?
Percentage of Families with Income Above $200,000 in Hopkins is 14.9%.
What is the Percentage of Families with Income Above $200,000 in Minnesota?
Percentage of Families with Income Above $200,000 in Minnesota is 16.5%.
What is the Percentage of Families with Income Above $200,000 in the United States?
Percentage of Families with Income Above $200,000 in the United States is 14.8%.