Zip Codes with the Highest Percentage of Population Employed in Arts, Entertainment & Recreation in Michigan
RELATED REPORTS & OPTIONS
Arts, Entertainment & Recreation
Michigan
Compare Zip Codes
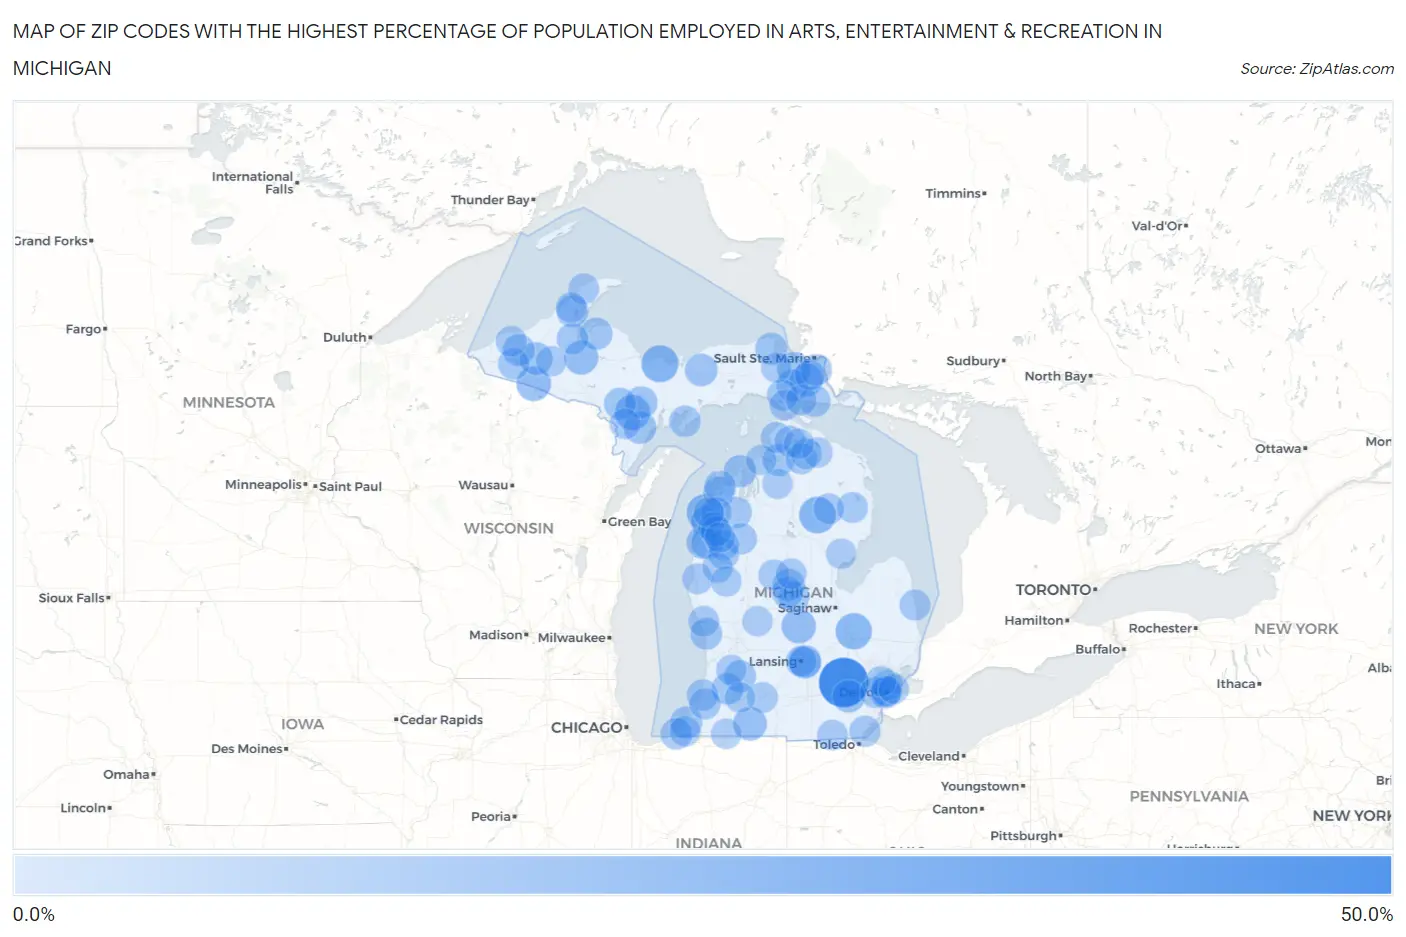
Map of Zip Codes with the Highest Percentage of Population Employed in Arts, Entertainment & Recreation in Michigan
0.0%
50.0%
Zip Codes with the Highest Percentage of Population Employed in Arts, Entertainment & Recreation in Michigan
| Zip Code | % Employed | vs State | vs National | |
| 1. | 48139 | 48.0% | 1.8%(+46.2)#1 | 2.1%(+45.9)#37 |
| 2. | 49822 | 18.7% | 1.8%(+16.9)#2 | 2.1%(+16.6)#215 |
| 3. | 48636 | 18.2% | 1.8%(+16.4)#3 | 2.1%(+16.1)#227 |
| 4. | 49628 | 18.1% | 1.8%(+16.3)#4 | 2.1%(+16.0)#230 |
| 5. | 48437 | 17.0% | 1.8%(+15.2)#5 | 2.1%(+14.9)#257 |
| 6. | 49873 | 14.9% | 1.8%(+13.1)#6 | 2.1%(+12.8)#341 |
| 7. | 49969 | 13.4% | 1.8%(+11.6)#7 | 2.1%(+11.3)#421 |
| 8. | 48874 | 12.9% | 1.8%(+11.1)#8 | 2.1%(+10.8)#459 |
| 9. | 49919 | 12.5% | 1.8%(+10.7)#9 | 2.1%(+10.4)#481 |
| 10. | 49075 | 11.4% | 1.8%(+9.58)#10 | 2.1%(+9.28)#565 |
| 11. | 49715 | 10.6% | 1.8%(+8.79)#11 | 2.1%(+8.49)#642 |
| 12. | 49613 | 10.2% | 1.8%(+8.42)#12 | 2.1%(+8.12)#678 |
| 13. | 49788 | 10.2% | 1.8%(+8.42)#13 | 2.1%(+8.12)#680 |
| 14. | 49912 | 9.5% | 1.8%(+7.74)#14 | 2.1%(+7.44)#776 |
| 15. | 48109 | 9.3% | 1.8%(+7.48)#15 | 2.1%(+7.19)#812 |
| 16. | 49896 | 9.2% | 1.8%(+7.42)#16 | 2.1%(+7.13)#819 |
| 17. | 49884 | 8.8% | 1.8%(+6.99)#17 | 2.1%(+6.69)#895 |
| 18. | 49670 | 8.7% | 1.8%(+6.94)#18 | 2.1%(+6.65)#903 |
| 19. | 49660 | 8.7% | 1.8%(+6.91)#19 | 2.1%(+6.62)#908 |
| 20. | 48825 | 8.4% | 1.8%(+6.56)#20 | 2.1%(+6.27)#974 |
| 21. | 49962 | 8.3% | 1.8%(+6.55)#21 | 2.1%(+6.25)#979 |
| 22. | 49818 | 8.2% | 1.8%(+6.46)#22 | 2.1%(+6.16)#995 |
| 23. | 49626 | 8.0% | 1.8%(+6.26)#23 | 2.1%(+5.96)#1,050 |
| 24. | 49106 | 8.0% | 1.8%(+6.21)#24 | 2.1%(+5.91)#1,061 |
| 25. | 49768 | 7.9% | 1.8%(+6.15)#25 | 2.1%(+5.85)#1,076 |
| 26. | 49796 | 7.9% | 1.8%(+6.15)#26 | 2.1%(+5.85)#1,077 |
| 27. | 48878 | 7.9% | 1.8%(+6.09)#27 | 2.1%(+5.79)#1,093 |
| 28. | 49834 | 7.7% | 1.8%(+5.94)#28 | 2.1%(+5.65)#1,124 |
| 29. | 49780 | 7.7% | 1.8%(+5.92)#29 | 2.1%(+5.62)#1,130 |
| 30. | 49921 | 7.7% | 1.8%(+5.87)#30 | 2.1%(+5.57)#1,143 |
| 31. | 49910 | 7.6% | 1.8%(+5.79)#31 | 2.1%(+5.49)#1,162 |
| 32. | 49070 | 7.3% | 1.8%(+5.49)#32 | 2.1%(+5.19)#1,242 |
| 33. | 48824 | 7.2% | 1.8%(+5.44)#33 | 2.1%(+5.15)#1,255 |
| 34. | 49409 | 7.1% | 1.8%(+5.36)#34 | 2.1%(+5.06)#1,292 |
| 35. | 49055 | 7.0% | 1.8%(+5.23)#35 | 2.1%(+4.93)#1,323 |
| 36. | 49908 | 6.7% | 1.8%(+4.87)#36 | 2.1%(+4.58)#1,439 |
| 37. | 49117 | 6.5% | 1.8%(+4.74)#37 | 2.1%(+4.45)#1,481 |
| 38. | 49835 | 6.5% | 1.8%(+4.73)#38 | 2.1%(+4.43)#1,487 |
| 39. | 49636 | 6.4% | 1.8%(+4.65)#39 | 2.1%(+4.35)#1,524 |
| 40. | 49947 | 6.3% | 1.8%(+4.54)#40 | 2.1%(+4.25)#1,568 |
| 41. | 49637 | 6.3% | 1.8%(+4.53)#41 | 2.1%(+4.24)#1,572 |
| 42. | 49043 | 6.2% | 1.8%(+4.46)#42 | 2.1%(+4.17)#1,604 |
| 43. | 48883 | 6.2% | 1.8%(+4.40)#43 | 2.1%(+4.10)#1,627 |
| 44. | 49618 | 6.1% | 1.8%(+4.28)#44 | 2.1%(+3.99)#1,666 |
| 45. | 49719 | 6.0% | 1.8%(+4.25)#45 | 2.1%(+3.96)#1,677 |
| 46. | 49630 | 6.0% | 1.8%(+4.23)#46 | 2.1%(+3.94)#1,697 |
| 47. | 49783 | 6.0% | 1.8%(+4.17)#47 | 2.1%(+3.87)#1,724 |
| 48. | 48858 | 5.9% | 1.8%(+4.12)#48 | 2.1%(+3.83)#1,741 |
| 49. | 49098 | 5.7% | 1.8%(+3.90)#49 | 2.1%(+3.60)#1,865 |
| 50. | 49760 | 5.6% | 1.8%(+3.80)#50 | 2.1%(+3.50)#1,915 |
| 51. | 48157 | 5.5% | 1.8%(+3.76)#51 | 2.1%(+3.46)#1,942 |
| 52. | 49740 | 5.5% | 1.8%(+3.68)#52 | 2.1%(+3.39)#1,986 |
| 53. | 49716 | 5.4% | 1.8%(+3.65)#53 | 2.1%(+3.35)#2,001 |
| 54. | 49617 | 5.4% | 1.8%(+3.64)#54 | 2.1%(+3.34)#2,009 |
| 55. | 49614 | 5.4% | 1.8%(+3.58)#55 | 2.1%(+3.28)#2,045 |
| 56. | 49644 | 5.3% | 1.8%(+3.55)#56 | 2.1%(+3.25)#2,063 |
| 57. | 49799 | 5.3% | 1.8%(+3.51)#57 | 2.1%(+3.21)#2,082 |
| 58. | 48469 | 5.3% | 1.8%(+3.50)#58 | 2.1%(+3.20)#2,088 |
| 59. | 49689 | 5.2% | 1.8%(+3.46)#59 | 2.1%(+3.16)#2,121 |
| 60. | 48705 | 5.2% | 1.8%(+3.38)#60 | 2.1%(+3.08)#2,180 |
| 61. | 49645 | 5.1% | 1.8%(+3.33)#61 | 2.1%(+3.03)#2,199 |
| 62. | 48226 | 5.1% | 1.8%(+3.32)#62 | 2.1%(+3.02)#2,205 |
| 63. | 49971 | 5.1% | 1.8%(+3.30)#63 | 2.1%(+3.00)#2,225 |
| 64. | 49805 | 5.0% | 1.8%(+3.26)#64 | 2.1%(+2.96)#2,253 |
| 65. | 48632 | 5.0% | 1.8%(+3.25)#65 | 2.1%(+2.95)#2,261 |
| 66. | 49440 | 5.0% | 1.8%(+3.20)#66 | 2.1%(+2.91)#2,293 |
| 67. | 49781 | 4.9% | 1.8%(+3.15)#67 | 2.1%(+2.85)#2,335 |
| 68. | 48647 | 4.9% | 1.8%(+3.09)#68 | 2.1%(+2.80)#2,377 |
| 69. | 49015 | 4.8% | 1.8%(+3.01)#69 | 2.1%(+2.71)#2,443 |
| 70. | 49931 | 4.8% | 1.8%(+2.97)#70 | 2.1%(+2.68)#2,475 |
| 71. | 48617 | 4.7% | 1.8%(+2.96)#71 | 2.1%(+2.67)#2,484 |
| 72. | 49128 | 4.7% | 1.8%(+2.94)#72 | 2.1%(+2.65)#2,503 |
| 73. | 49705 | 4.7% | 1.8%(+2.94)#73 | 2.1%(+2.64)#2,509 |
| 74. | 48216 | 4.6% | 1.8%(+2.82)#74 | 2.1%(+2.52)#2,626 |
| 75. | 49745 | 4.6% | 1.8%(+2.82)#75 | 2.1%(+2.52)#2,627 |
| 76. | 48933 | 4.6% | 1.8%(+2.81)#76 | 2.1%(+2.52)#2,628 |
| 77. | 49449 | 4.6% | 1.8%(+2.80)#77 | 2.1%(+2.50)#2,637 |
| 78. | 49402 | 4.6% | 1.8%(+2.77)#78 | 2.1%(+2.48)#2,670 |
| 79. | 49248 | 4.5% | 1.8%(+2.68)#79 | 2.1%(+2.38)#2,783 |
| 80. | 49847 | 4.4% | 1.8%(+2.63)#80 | 2.1%(+2.33)#2,829 |
| 81. | 49309 | 4.3% | 1.8%(+2.55)#81 | 2.1%(+2.25)#2,923 |
| 82. | 48128 | 4.3% | 1.8%(+2.55)#82 | 2.1%(+2.25)#2,926 |
| 83. | 49635 | 4.3% | 1.8%(+2.52)#83 | 2.1%(+2.23)#2,949 |
| 84. | 49724 | 4.3% | 1.8%(+2.52)#84 | 2.1%(+2.23)#2,950 |
| 85. | 49967 | 4.2% | 1.8%(+2.42)#85 | 2.1%(+2.12)#3,081 |
| 86. | 49611 | 4.2% | 1.8%(+2.40)#86 | 2.1%(+2.10)#3,100 |
| 87. | 49728 | 4.1% | 1.8%(+2.34)#87 | 2.1%(+2.04)#3,178 |
| 88. | 48234 | 4.1% | 1.8%(+2.29)#88 | 2.1%(+1.99)#3,236 |
| 89. | 49765 | 4.0% | 1.8%(+2.25)#89 | 2.1%(+1.96)#3,278 |
| 90. | 48766 | 4.0% | 1.8%(+2.23)#90 | 2.1%(+1.93)#3,313 |
| 91. | 48201 | 4.0% | 1.8%(+2.19)#91 | 2.1%(+1.89)#3,374 |
| 92. | 49619 | 4.0% | 1.8%(+2.17)#92 | 2.1%(+1.87)#3,395 |
| 93. | 49791 | 3.9% | 1.8%(+2.16)#93 | 2.1%(+1.86)#3,405 |
| 94. | 48069 | 3.9% | 1.8%(+2.14)#94 | 2.1%(+1.84)#3,440 |
| 95. | 49328 | 3.9% | 1.8%(+2.14)#95 | 2.1%(+1.84)#3,446 |
| 96. | 49720 | 3.9% | 1.8%(+2.08)#96 | 2.1%(+1.79)#3,526 |
| 97. | 49130 | 3.9% | 1.8%(+2.07)#97 | 2.1%(+1.77)#3,549 |
| 98. | 49008 | 3.8% | 1.8%(+2.03)#98 | 2.1%(+1.73)#3,605 |
| 99. | 49326 | 3.8% | 1.8%(+2.00)#99 | 2.1%(+1.71)#3,651 |
| 100. | 48230 | 3.8% | 1.8%(+1.99)#100 | 2.1%(+1.70)#3,662 |
Common Questions
What are the Top 10 Zip Codes with the Highest Percentage of Population Employed in Arts, Entertainment & Recreation in Michigan?
Top 10 Zip Codes with the Highest Percentage of Population Employed in Arts, Entertainment & Recreation in Michigan are:
What zip code has the Highest Percentage of Population Employed in Arts, Entertainment & Recreation in Michigan?
48139 has the Highest Percentage of Population Employed in Arts, Entertainment & Recreation in Michigan with 48.0%.
What is the Percentage of Population Employed in Arts, Entertainment & Recreation in the State of Michigan?
Percentage of Population Employed in Arts, Entertainment & Recreation in Michigan is 1.8%.
What is the Percentage of Population Employed in Arts, Entertainment & Recreation in the United States?
Percentage of Population Employed in Arts, Entertainment & Recreation in the United States is 2.1%.