Zip Codes with the Highest Percentage of Population Employed in Farming, Fishing & Forestry in Warren, MI
RELATED REPORTS & OPTIONS
Farming, Fishing & Forestry
Warren
Compare Zip Codes
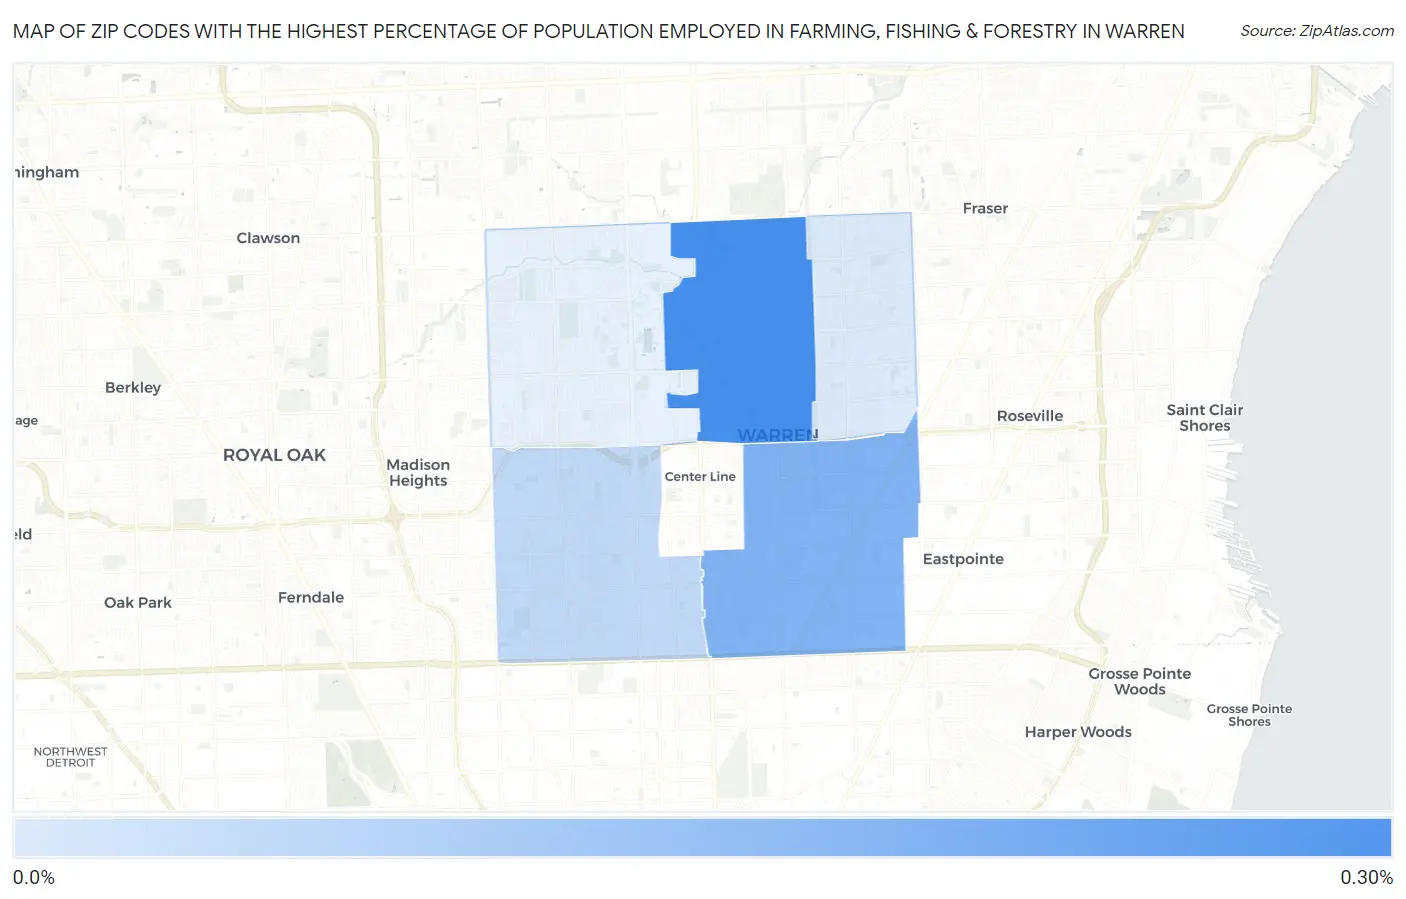
Map of Zip Codes with the Highest Percentage of Population Employed in Farming, Fishing & Forestry in Warren
0.0%
0.30%
Zip Codes with the Highest Percentage of Population Employed in Farming, Fishing & Forestry in Warren, MI
| Zip Code | % Employed | vs State | vs National | |
| 1. | 48093 | 0.25% | 0.47%(-0.214)#535 | 0.61%(-0.353)#15,380 |
| 2. | 48089 | 0.17% | 0.47%(-0.297)#582 | 0.61%(-0.436)#16,582 |
| 3. | 48091 | 0.073% | 0.47%(-0.394)#653 | 0.61%(-0.533)#18,252 |
| 4. | 48088 | 0.033% | 0.47%(-0.434)#680 | 0.61%(-0.573)#18,924 |
1
Common Questions
What are the Top 3 Zip Codes with the Highest Percentage of Population Employed in Farming, Fishing & Forestry in Warren, MI?
Top 3 Zip Codes with the Highest Percentage of Population Employed in Farming, Fishing & Forestry in Warren, MI are:
What zip code has the Highest Percentage of Population Employed in Farming, Fishing & Forestry in Warren, MI?
48093 has the Highest Percentage of Population Employed in Farming, Fishing & Forestry in Warren, MI with 0.25%.
What is the Percentage of Population Employed in Farming, Fishing & Forestry in Warren, MI?
Percentage of Population Employed in Farming, Fishing & Forestry in Warren is 0.10%.
What is the Percentage of Population Employed in Farming, Fishing & Forestry in Michigan?
Percentage of Population Employed in Farming, Fishing & Forestry in Michigan is 0.47%.
What is the Percentage of Population Employed in Farming, Fishing & Forestry in the United States?
Percentage of Population Employed in Farming, Fishing & Forestry in the United States is 0.61%.