Zip Codes with the Highest Percentage of Population Employed in Farming, Fishing & Forestry in Howell, MI
RELATED REPORTS & OPTIONS
Farming, Fishing & Forestry
Howell
Compare Zip Codes
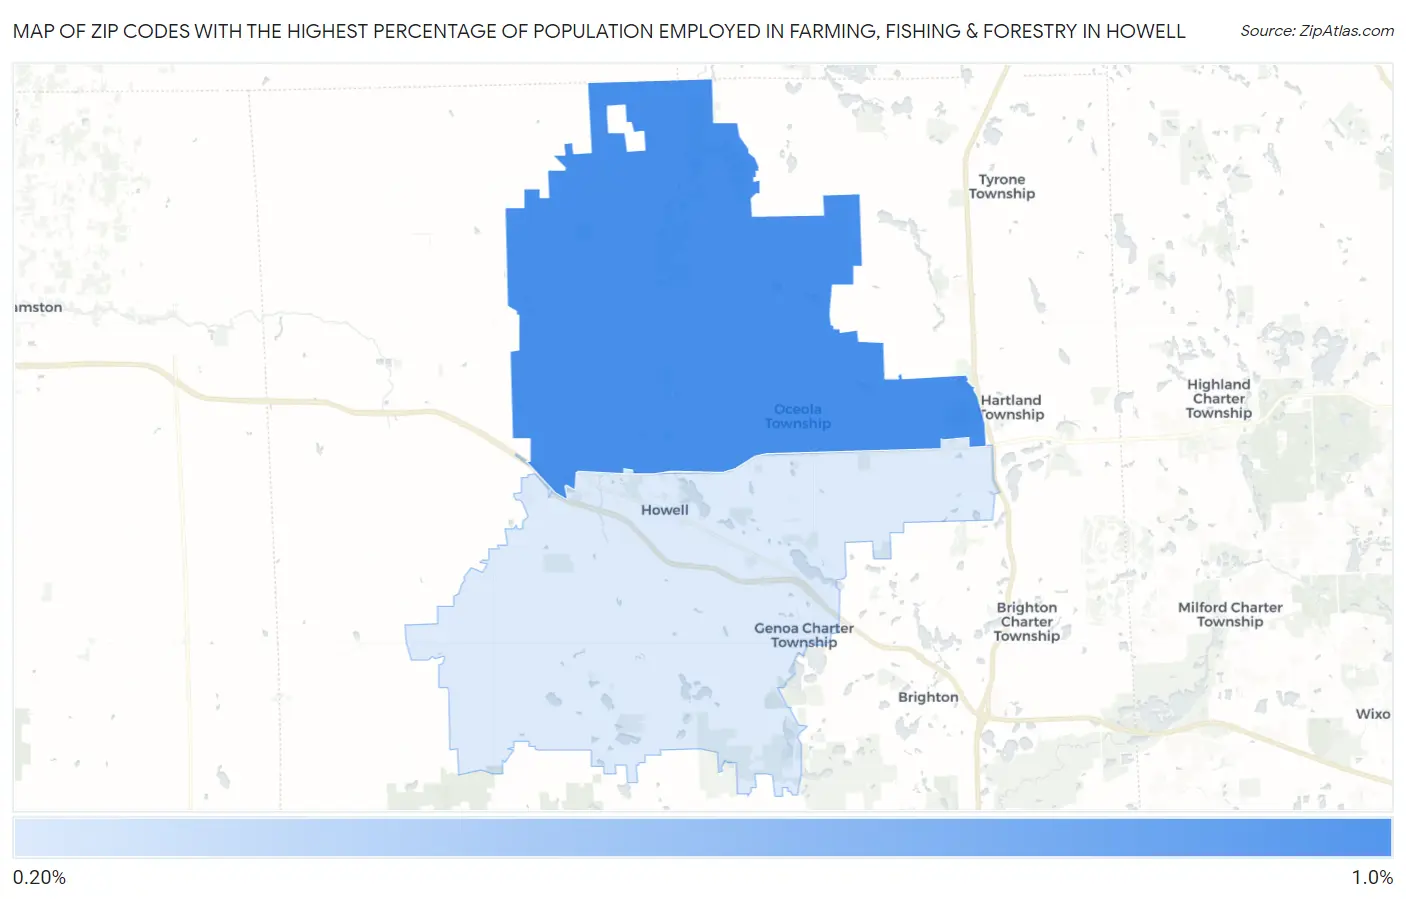
Map of Zip Codes with the Highest Percentage of Population Employed in Farming, Fishing & Forestry in Howell
0.20%
0.91%
Zip Codes with the Highest Percentage of Population Employed in Farming, Fishing & Forestry in Howell, MI
| Zip Code | % Employed | vs State | vs National | |
| 1. | 48855 | 0.91% | 0.47%(+0.444)#305 | 0.61%(+0.305)#10,176 |
| 2. | 48843 | 0.20% | 0.47%(-0.265)#566 | 0.61%(-0.404)#16,102 |
1
Common Questions
What are the Top Zip Codes with the Highest Percentage of Population Employed in Farming, Fishing & Forestry in Howell, MI?
Top Zip Codes with the Highest Percentage of Population Employed in Farming, Fishing & Forestry in Howell, MI are:
What zip code has the Highest Percentage of Population Employed in Farming, Fishing & Forestry in Howell, MI?
48855 has the Highest Percentage of Population Employed in Farming, Fishing & Forestry in Howell, MI with 0.91%.
What is the Percentage of Population Employed in Farming, Fishing & Forestry in Michigan?
Percentage of Population Employed in Farming, Fishing & Forestry in Michigan is 0.47%.
What is the Percentage of Population Employed in Farming, Fishing & Forestry in the United States?
Percentage of Population Employed in Farming, Fishing & Forestry in the United States is 0.61%.