Zip Codes with the Highest Percentage of Households Heated by Utility Gas in Lawrence, MA
RELATED REPORTS & OPTIONS
Utility Gas Heating
Lawrence
Compare Zip Codes
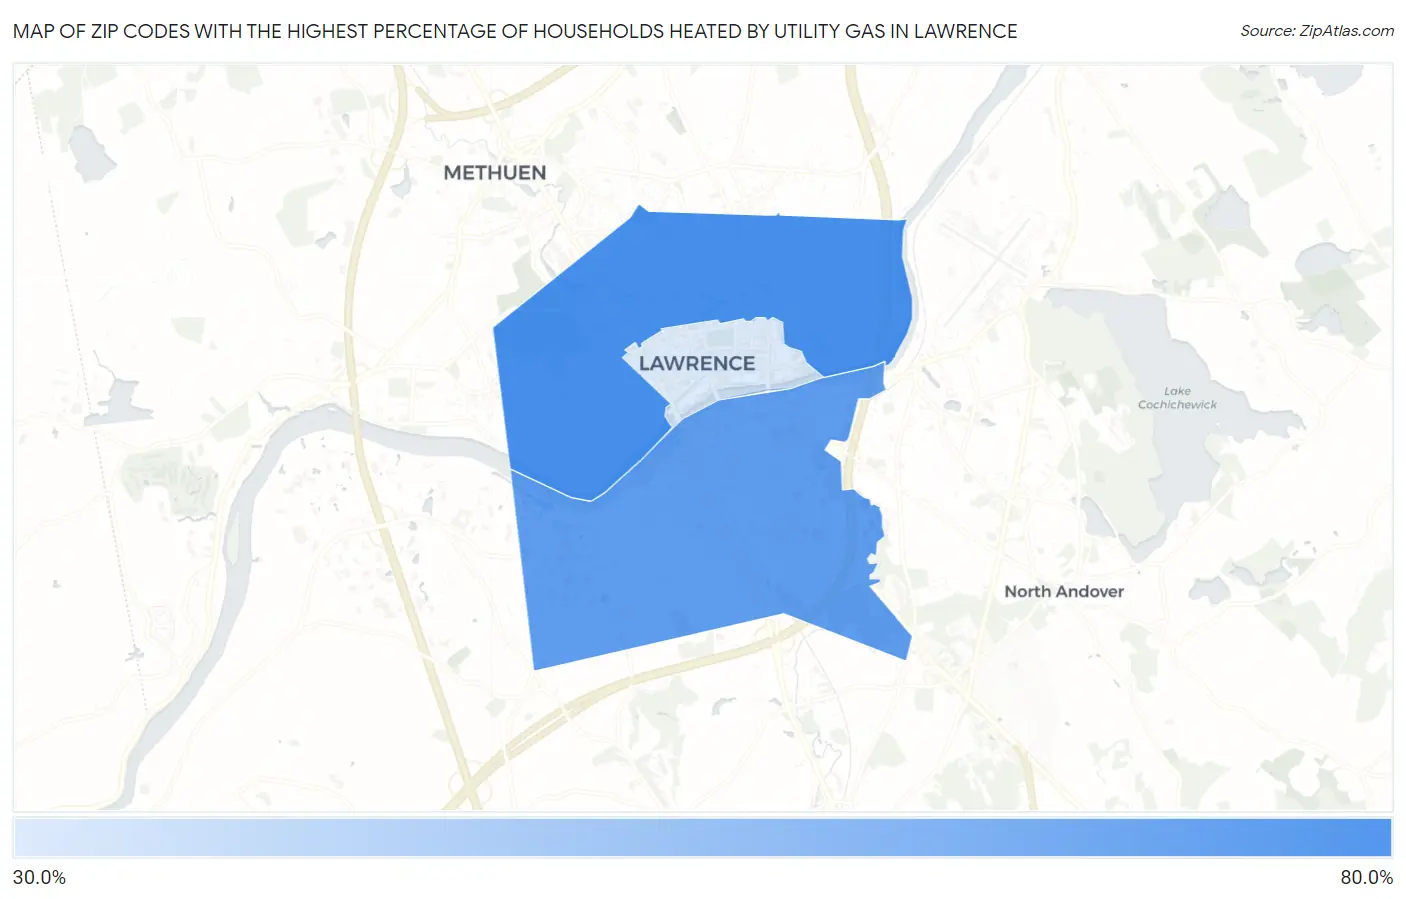
Map of Zip Codes with the Highest Percentage of Households Heated by Utility Gas in Lawrence
0.0%
80.0%
Zip Codes with the Highest Percentage of Households Heated by Utility Gas in Lawrence, MA
| Zip Code | Utility Gas Heating | vs State | vs National | |
| 1. | 01841 | 76.4% | 52.0%(+24.4)#26 | 47.1%(+29.3)#3,074 |
| 2. | 01843 | 69.7% | 52.0%(+17.7)#67 | 47.1%(+22.6)#4,684 |
| 3. | 01840 | 37.7% | 52.0%(-14.3)#315 | 47.1%(-9.40)#13,757 |
1
Common Questions
What are the Top Zip Codes with the Highest Percentage of Households Heated by Utility Gas in Lawrence, MA?
Top Zip Codes with the Highest Percentage of Households Heated by Utility Gas in Lawrence, MA are:
What zip code has the Highest Percentage of Households Heated by Utility Gas in Lawrence, MA?
01841 has the Highest Percentage of Households Heated by Utility Gas in Lawrence, MA with 76.4%.
What is the Percentage of Households Heated by Utility Gas in Lawrence, MA?
Percentage of Households Heated by Utility Gas in Lawrence is 70.1%.
What is the Percentage of Households Heated by Utility Gas in Massachusetts?
Percentage of Households Heated by Utility Gas in Massachusetts is 52.0%.
What is the Percentage of Households Heated by Utility Gas in the United States?
Percentage of Households Heated by Utility Gas in the United States is 47.1%.