Zip Codes with the Highest Percentage of Population Employed in Farming, Fishing & Forestry in Lawrence, MA
RELATED REPORTS & OPTIONS
Farming, Fishing & Forestry
Lawrence
Compare Zip Codes
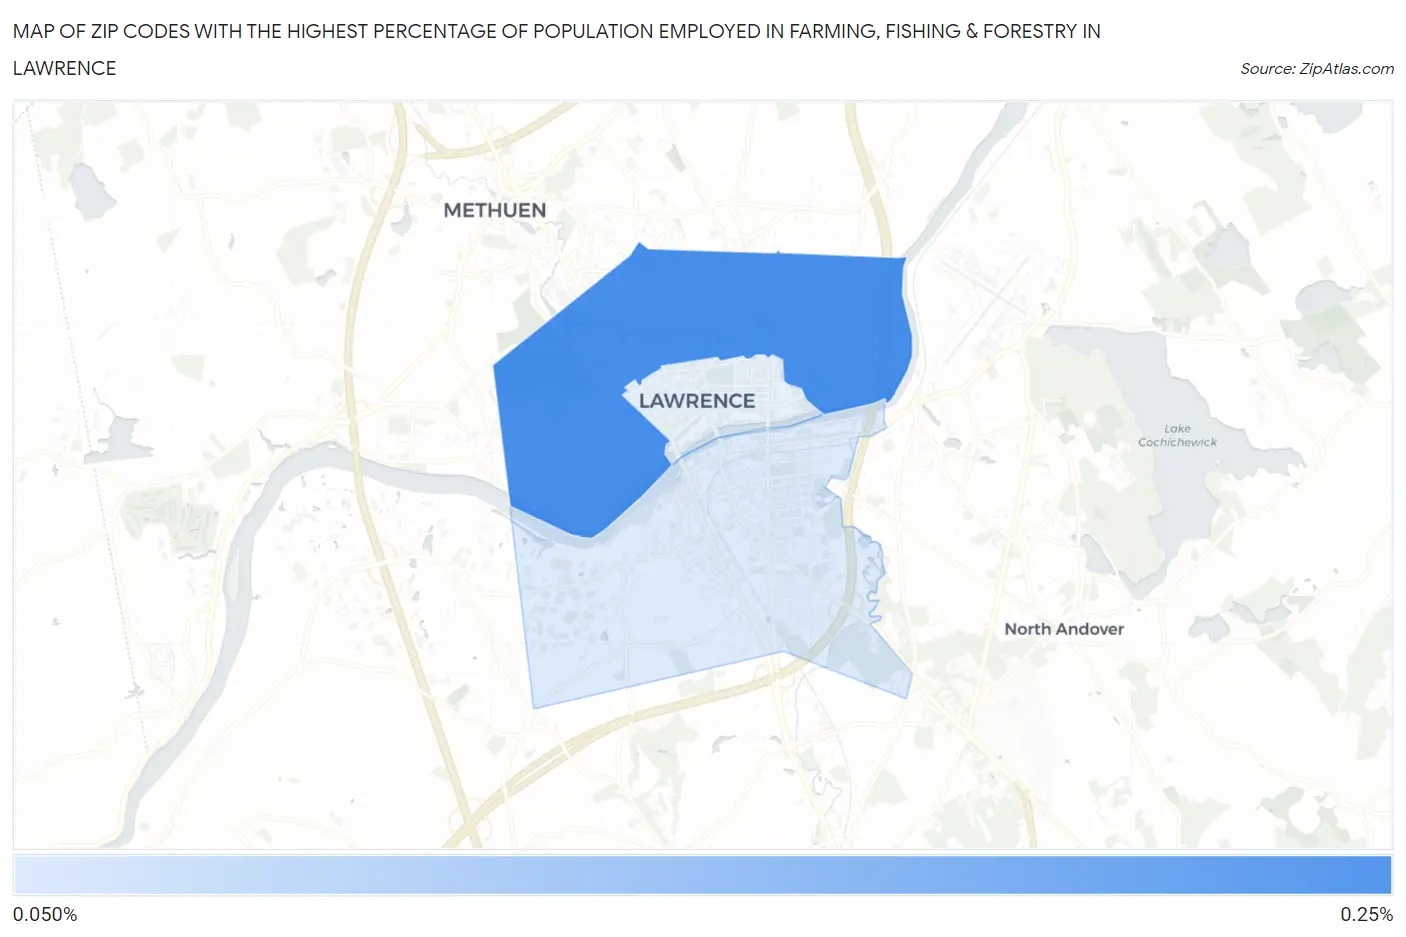
Map of Zip Codes with the Highest Percentage of Population Employed in Farming, Fishing & Forestry in Lawrence
0.0%
0.25%
Zip Codes with the Highest Percentage of Population Employed in Farming, Fishing & Forestry in Lawrence, MA
| Zip Code | % Employed | vs State | vs National | |
| 1. | 01841 | 0.23% | 0.22%(+0.016)#165 | 0.61%(-0.374)#15,666 |
| 2. | 01843 | 0.071% | 0.22%(-0.145)#229 | 0.61%(-0.535)#18,285 |
1
Common Questions
What are the Top Zip Codes with the Highest Percentage of Population Employed in Farming, Fishing & Forestry in Lawrence, MA?
Top Zip Codes with the Highest Percentage of Population Employed in Farming, Fishing & Forestry in Lawrence, MA are:
What zip code has the Highest Percentage of Population Employed in Farming, Fishing & Forestry in Lawrence, MA?
01841 has the Highest Percentage of Population Employed in Farming, Fishing & Forestry in Lawrence, MA with 0.23%.
What is the Percentage of Population Employed in Farming, Fishing & Forestry in Lawrence, MA?
Percentage of Population Employed in Farming, Fishing & Forestry in Lawrence is 0.16%.
What is the Percentage of Population Employed in Farming, Fishing & Forestry in Massachusetts?
Percentage of Population Employed in Farming, Fishing & Forestry in Massachusetts is 0.22%.
What is the Percentage of Population Employed in Farming, Fishing & Forestry in the United States?
Percentage of Population Employed in Farming, Fishing & Forestry in the United States is 0.61%.