Zip Codes with the Highest Percentage of Population Employed in Arts, Entertainment & Recreation in Fall River, MA
RELATED REPORTS & OPTIONS
Arts, Entertainment & Recreation
Fall River
Compare Zip Codes
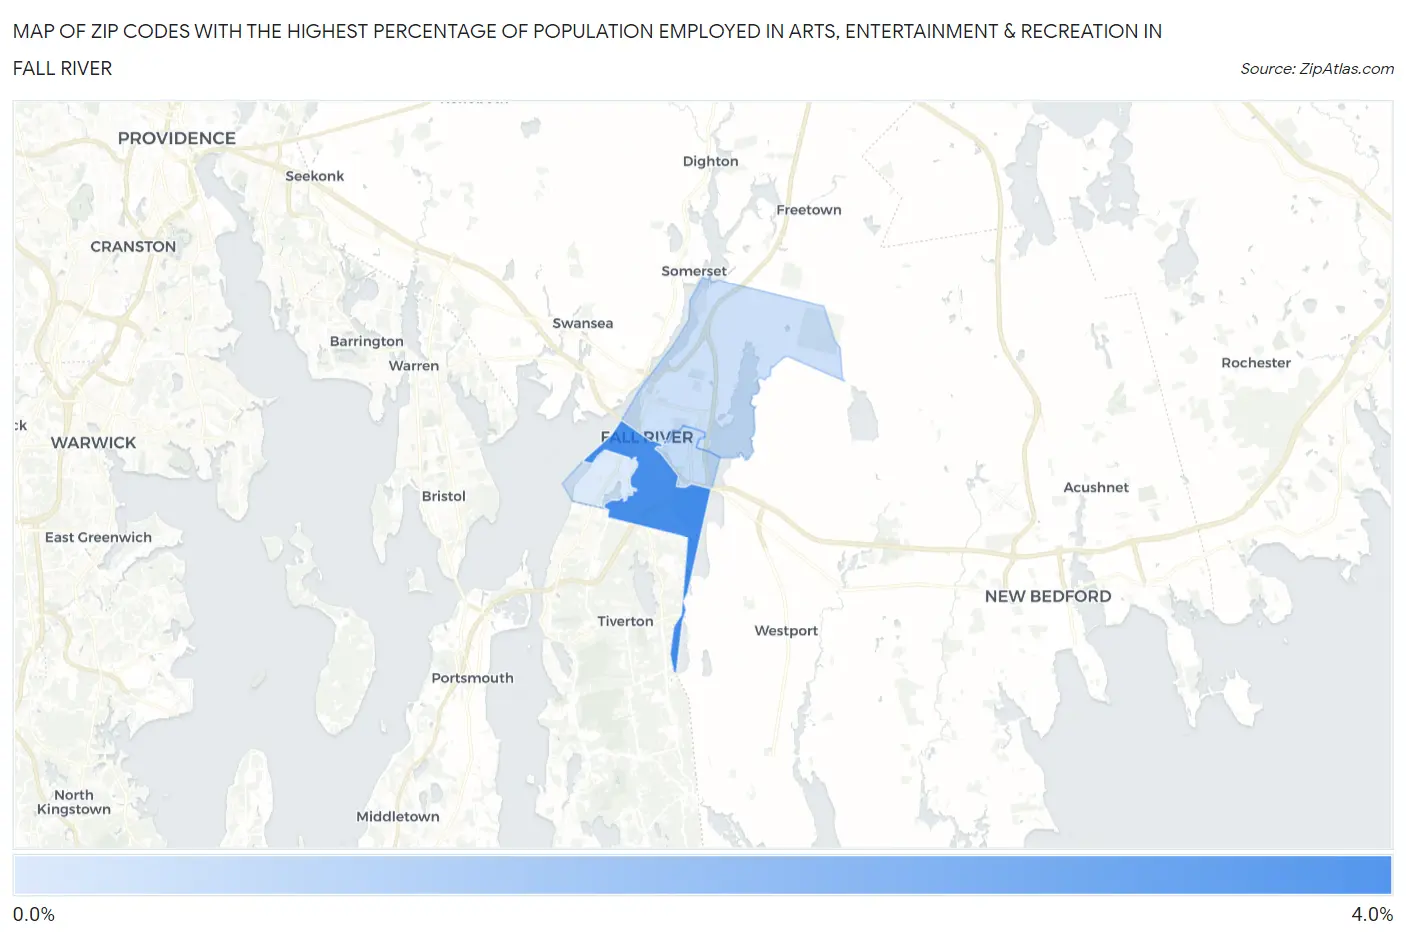
Map of Zip Codes with the Highest Percentage of Population Employed in Arts, Entertainment & Recreation in Fall River
0.0%
4.0%
Zip Codes with the Highest Percentage of Population Employed in Arts, Entertainment & Recreation in Fall River, MA
| Zip Code | % Employed | vs State | vs National | |
| 1. | 02721 | 3.3% | 2.0%(+1.34)#96 | 2.1%(+1.24)#4,524 |
| 2. | 02723 | 1.3% | 2.0%(-0.706)#353 | 2.1%(-0.810)#14,920 |
| 3. | 02720 | 1.2% | 2.0%(-0.793)#374 | 2.1%(-0.898)#15,594 |
| 4. | 02724 | 0.92% | 2.0%(-1.06)#415 | 2.1%(-1.17)#17,569 |
1
Common Questions
What are the Top 3 Zip Codes with the Highest Percentage of Population Employed in Arts, Entertainment & Recreation in Fall River, MA?
Top 3 Zip Codes with the Highest Percentage of Population Employed in Arts, Entertainment & Recreation in Fall River, MA are:
What zip code has the Highest Percentage of Population Employed in Arts, Entertainment & Recreation in Fall River, MA?
02721 has the Highest Percentage of Population Employed in Arts, Entertainment & Recreation in Fall River, MA with 3.3%.
What is the Percentage of Population Employed in Arts, Entertainment & Recreation in Fall River, MA?
Percentage of Population Employed in Arts, Entertainment & Recreation in Fall River is 1.7%.
What is the Percentage of Population Employed in Arts, Entertainment & Recreation in Massachusetts?
Percentage of Population Employed in Arts, Entertainment & Recreation in Massachusetts is 2.0%.
What is the Percentage of Population Employed in Arts, Entertainment & Recreation in the United States?
Percentage of Population Employed in Arts, Entertainment & Recreation in the United States is 2.1%.