Zimbabwean vs Immigrants from Armenia In Labor Force | Age 25-29
COMPARE
Zimbabwean
Immigrants from Armenia
In Labor Force | Age 25-29
In Labor Force | Age 25-29 Comparison
Zimbabweans
Immigrants from Armenia
84.5%
IN LABOR FORCE | AGE 25-29
28.7/ 100
METRIC RATING
191st/ 347
METRIC RANK
84.4%
IN LABOR FORCE | AGE 25-29
13.3/ 100
METRIC RATING
207th/ 347
METRIC RANK
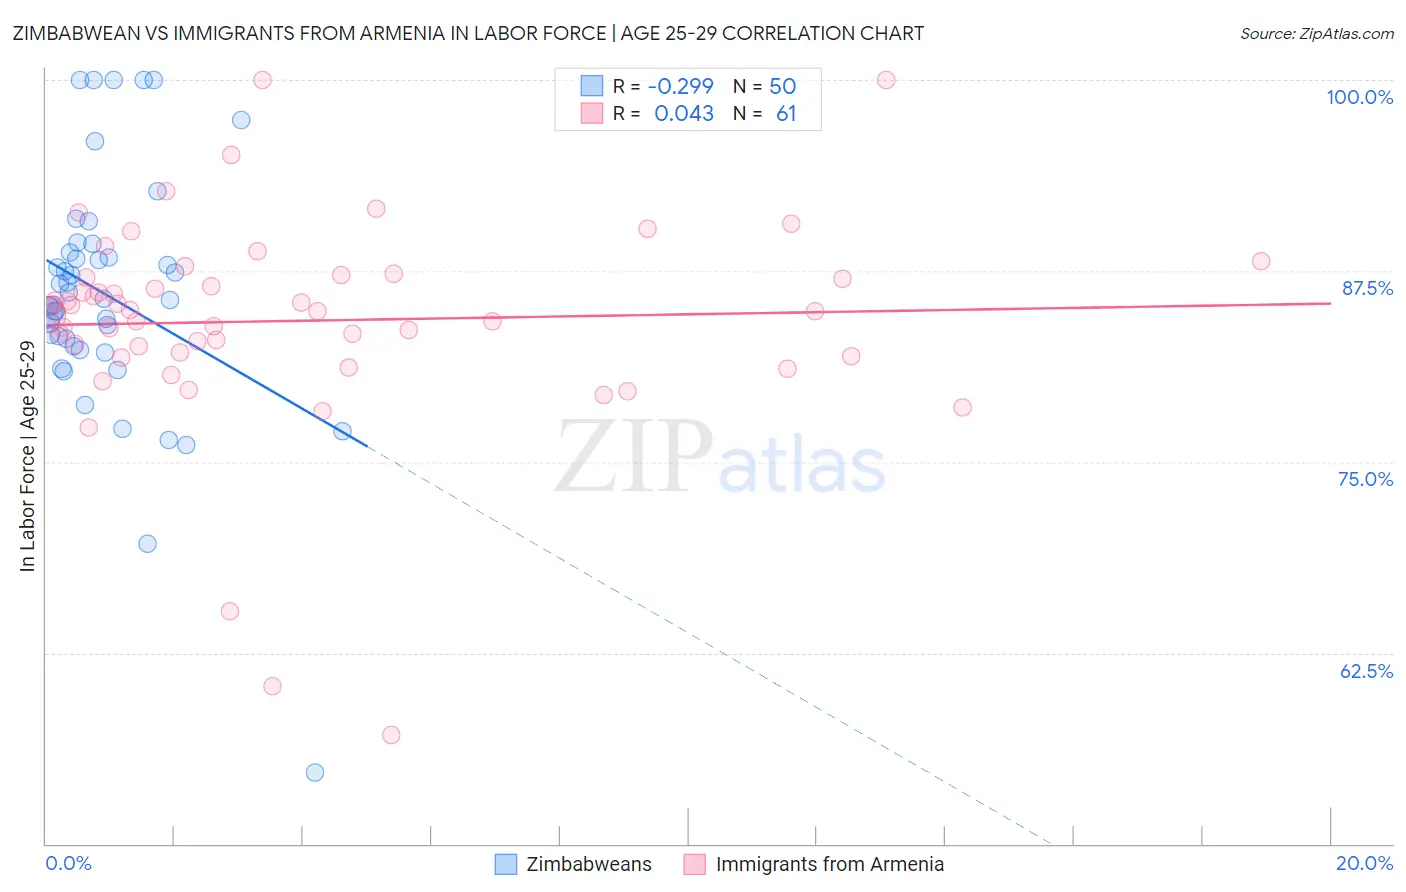
Zimbabwean vs Immigrants from Armenia In Labor Force | Age 25-29 Correlation Chart
The statistical analysis conducted on geographies consisting of 69,201,271 people shows a weak negative correlation between the proportion of Zimbabweans and labor force participation rate among population between the ages 25 and 29 in the United States with a correlation coefficient (R) of -0.299 and weighted average of 84.5%. Similarly, the statistical analysis conducted on geographies consisting of 97,715,578 people shows no correlation between the proportion of Immigrants from Armenia and labor force participation rate among population between the ages 25 and 29 in the United States with a correlation coefficient (R) of 0.043 and weighted average of 84.4%, a difference of 0.18%.
In Labor Force | Age 25-29 Correlation Summary
| Measurement | Zimbabwean | Immigrants from Armenia |
| Minimum | 54.7% | 57.1% |
| Maximum | 100.0% | 100.0% |
| Range | 45.3% | 42.9% |
| Mean | 85.9% | 84.2% |
| Median | 85.6% | 84.9% |
| Interquartile 25% (IQ1) | 82.6% | 82.1% |
| Interquartile 75% (IQ3) | 88.7% | 87.1% |
| Interquartile Range (IQR) | 6.1% | 5.1% |
| Standard Deviation (Sample) | 8.0% | 7.0% |
| Standard Deviation (Population) | 8.0% | 7.0% |
Demographics Similar to Zimbabweans and Immigrants from Armenia by In Labor Force | Age 25-29
In terms of in labor force | age 25-29, the demographic groups most similar to Zimbabweans are Welsh (84.5%, a difference of 0.020%), Moroccan (84.5%, a difference of 0.030%), English (84.5%, a difference of 0.030%), South American Indian (84.5%, a difference of 0.030%), and Portuguese (84.4%, a difference of 0.070%). Similarly, the demographic groups most similar to Immigrants from Armenia are Immigrants from Indonesia (84.4%, a difference of 0.0%), Immigrants from Jordan (84.4%, a difference of 0.010%), Ecuadorian (84.4%, a difference of 0.020%), Immigrants from Cambodia (84.4%, a difference of 0.020%), and Venezuelan (84.4%, a difference of 0.030%).
| Demographics | Rating | Rank | In Labor Force | Age 25-29 |
| Moroccans | 32.6 /100 | #189 | Fair 84.5% |
| Welsh | 31.1 /100 | #190 | Fair 84.5% |
| Zimbabweans | 28.7 /100 | #191 | Fair 84.5% |
| English | 25.8 /100 | #192 | Fair 84.5% |
| South American Indians | 25.0 /100 | #193 | Fair 84.5% |
| Portuguese | 21.2 /100 | #194 | Fair 84.4% |
| Immigrants | Israel | 20.8 /100 | #195 | Fair 84.4% |
| Immigrants | South Eastern Asia | 19.5 /100 | #196 | Poor 84.4% |
| Tlingit-Haida | 19.3 /100 | #197 | Poor 84.4% |
| Immigrants | Iraq | 19.0 /100 | #198 | Poor 84.4% |
| Immigrants | Germany | 18.3 /100 | #199 | Poor 84.4% |
| Immigrants | Kazakhstan | 17.5 /100 | #200 | Poor 84.4% |
| Laotians | 16.6 /100 | #201 | Poor 84.4% |
| Afghans | 15.9 /100 | #202 | Poor 84.4% |
| Immigrants | Afghanistan | 15.6 /100 | #203 | Poor 84.4% |
| Venezuelans | 15.1 /100 | #204 | Poor 84.4% |
| Ecuadorians | 14.8 /100 | #205 | Poor 84.4% |
| Immigrants | Cambodia | 14.3 /100 | #206 | Poor 84.4% |
| Immigrants | Armenia | 13.3 /100 | #207 | Poor 84.4% |
| Immigrants | Indonesia | 13.2 /100 | #208 | Poor 84.4% |
| Immigrants | Jordan | 12.8 /100 | #209 | Poor 84.4% |