Yugoslavian vs Immigrants from Brazil In Labor Force | Age 16-19
COMPARE
Yugoslavian
Immigrants from Brazil
In Labor Force | Age 16-19
In Labor Force | Age 16-19 Comparison
Yugoslavians
Immigrants from Brazil
41.8%
IN LABOR FORCE | AGE 16-19
100.0/ 100
METRIC RATING
35th/ 347
METRIC RANK
37.1%
IN LABOR FORCE | AGE 16-19
76.5/ 100
METRIC RATING
157th/ 347
METRIC RANK
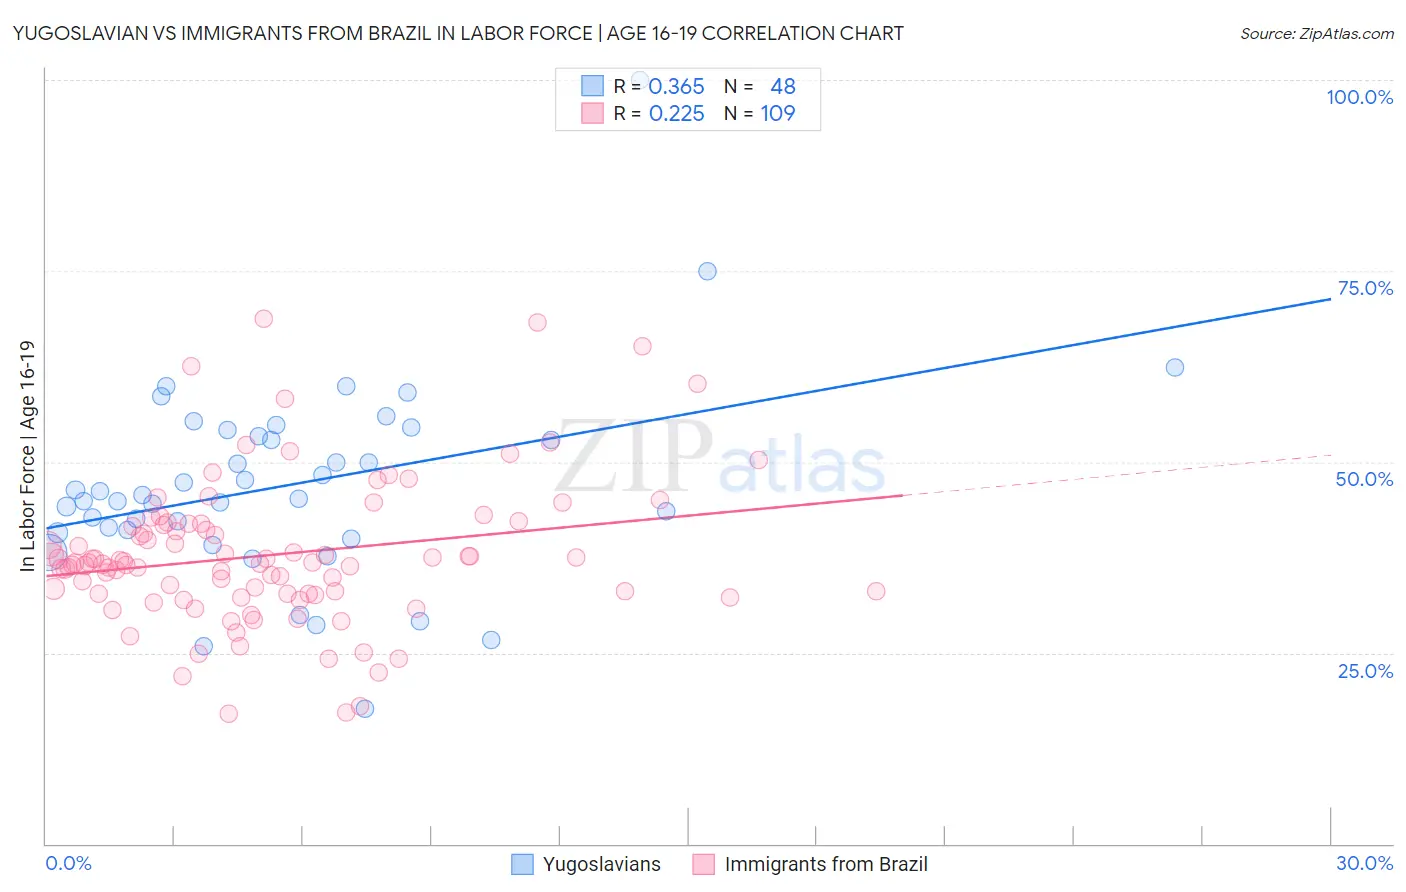
Yugoslavian vs Immigrants from Brazil In Labor Force | Age 16-19 Correlation Chart
The statistical analysis conducted on geographies consisting of 285,420,048 people shows a mild positive correlation between the proportion of Yugoslavians and labor force participation rate among population between the ages 16 and 19 in the United States with a correlation coefficient (R) of 0.365 and weighted average of 41.8%. Similarly, the statistical analysis conducted on geographies consisting of 342,618,647 people shows a weak positive correlation between the proportion of Immigrants from Brazil and labor force participation rate among population between the ages 16 and 19 in the United States with a correlation coefficient (R) of 0.225 and weighted average of 37.1%, a difference of 12.6%.
In Labor Force | Age 16-19 Correlation Summary
| Measurement | Yugoslavian | Immigrants from Brazil |
| Minimum | 17.7% | 17.1% |
| Maximum | 100.0% | 68.8% |
| Range | 82.3% | 51.7% |
| Mean | 46.9% | 37.8% |
| Median | 45.4% | 36.7% |
| Interquartile 25% (IQ1) | 40.9% | 32.7% |
| Interquartile 75% (IQ3) | 53.8% | 41.8% |
| Interquartile Range (IQR) | 12.9% | 9.1% |
| Standard Deviation (Sample) | 13.2% | 9.5% |
| Standard Deviation (Population) | 13.0% | 9.5% |
Similar Demographics by In Labor Force | Age 16-19
Demographics Similar to Yugoslavians by In Labor Force | Age 16-19
In terms of in labor force | age 16-19, the demographic groups most similar to Yugoslavians are Immigrants from Bosnia and Herzegovina (41.8%, a difference of 0.020%), Liberian (41.8%, a difference of 0.10%), Immigrants from the Azores (41.7%, a difference of 0.14%), Immigrants from Congo (41.7%, a difference of 0.22%), and Czechoslovakian (41.9%, a difference of 0.24%).
| Demographics | Rating | Rank | In Labor Force | Age 16-19 |
| Poles | 100.0 /100 | #28 | Exceptional 42.1% |
| French | 100.0 /100 | #29 | Exceptional 42.1% |
| Scottish | 100.0 /100 | #30 | Exceptional 42.0% |
| Irish | 100.0 /100 | #31 | Exceptional 42.0% |
| Czechoslovakians | 100.0 /100 | #32 | Exceptional 41.9% |
| Liberians | 100.0 /100 | #33 | Exceptional 41.8% |
| Immigrants | Bosnia and Herzegovina | 100.0 /100 | #34 | Exceptional 41.8% |
| Yugoslavians | 100.0 /100 | #35 | Exceptional 41.8% |
| Immigrants | Azores | 100.0 /100 | #36 | Exceptional 41.7% |
| Immigrants | Congo | 100.0 /100 | #37 | Exceptional 41.7% |
| Sioux | 100.0 /100 | #38 | Exceptional 41.5% |
| Scotch-Irish | 100.0 /100 | #39 | Exceptional 41.5% |
| Immigrants | Liberia | 100.0 /100 | #40 | Exceptional 41.5% |
| Celtics | 100.0 /100 | #41 | Exceptional 41.3% |
| Whites/Caucasians | 100.0 /100 | #42 | Exceptional 41.3% |
Demographics Similar to Immigrants from Brazil by In Labor Force | Age 16-19
In terms of in labor force | age 16-19, the demographic groups most similar to Immigrants from Brazil are Ute (37.1%, a difference of 0.050%), Yaqui (37.1%, a difference of 0.14%), Immigrants from Saudi Arabia (37.0%, a difference of 0.17%), Kiowa (37.2%, a difference of 0.29%), and Immigrants from Lithuania (37.2%, a difference of 0.31%).
| Demographics | Rating | Rank | In Labor Force | Age 16-19 |
| Tsimshian | 84.7 /100 | #150 | Excellent 37.4% |
| Immigrants | Poland | 84.4 /100 | #151 | Excellent 37.3% |
| Immigrants | Sierra Leone | 83.6 /100 | #152 | Excellent 37.3% |
| Arapaho | 81.8 /100 | #153 | Excellent 37.3% |
| Immigrants | Bulgaria | 81.6 /100 | #154 | Excellent 37.3% |
| Immigrants | Lithuania | 80.7 /100 | #155 | Excellent 37.2% |
| Kiowa | 80.4 /100 | #156 | Excellent 37.2% |
| Immigrants | Brazil | 76.5 /100 | #157 | Good 37.1% |
| Ute | 75.7 /100 | #158 | Good 37.1% |
| Yaqui | 74.4 /100 | #159 | Good 37.1% |
| Immigrants | Saudi Arabia | 73.9 /100 | #160 | Good 37.0% |
| Cambodians | 71.5 /100 | #161 | Good 37.0% |
| Immigrants | Jordan | 69.5 /100 | #162 | Good 36.9% |
| Bermudans | 69.3 /100 | #163 | Good 36.9% |
| Immigrants | Kuwait | 68.9 /100 | #164 | Good 36.9% |