White/Caucasian vs French In Labor Force | Age > 16
COMPARE
White/Caucasian
French
In Labor Force | Age > 16
In Labor Force | Age > 16 Comparison
Whites/Caucasians
French
63.6%
IN LABOR FORCE | AGE > 16
0.0/ 100
METRIC RATING
299th/ 347
METRIC RANK
63.9%
IN LABOR FORCE | AGE > 16
0.1/ 100
METRIC RATING
284th/ 347
METRIC RANK
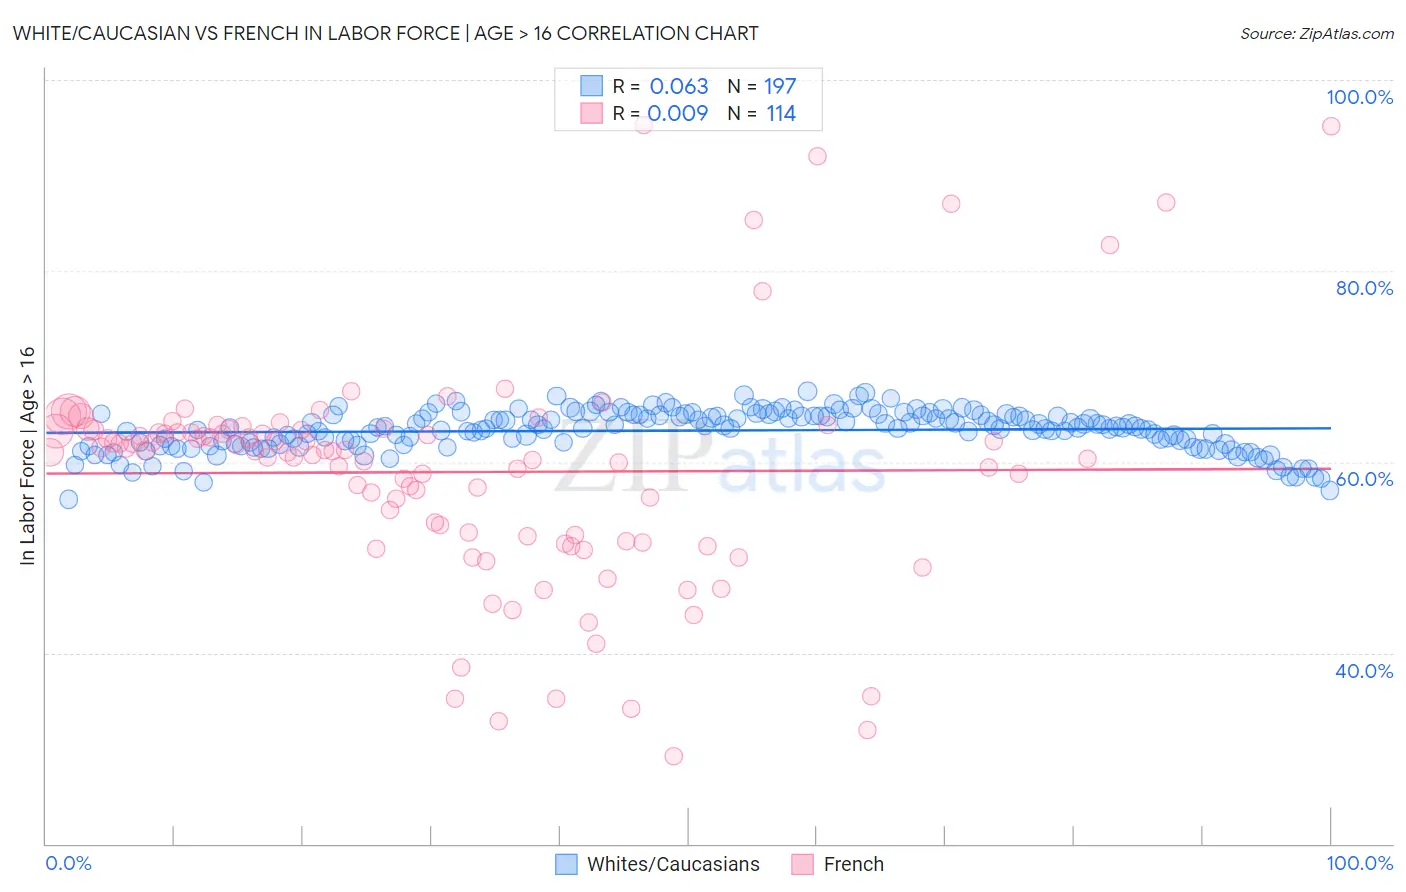
White/Caucasian vs French In Labor Force | Age > 16 Correlation Chart
The statistical analysis conducted on geographies consisting of 584,901,305 people shows a slight positive correlation between the proportion of Whites/Caucasians and labor force participation rate among population ages 16 and over in the United States with a correlation coefficient (R) of 0.063 and weighted average of 63.6%. Similarly, the statistical analysis conducted on geographies consisting of 572,429,642 people shows no correlation between the proportion of French and labor force participation rate among population ages 16 and over in the United States with a correlation coefficient (R) of 0.009 and weighted average of 63.9%, a difference of 0.52%.
In Labor Force | Age > 16 Correlation Summary
| Measurement | White/Caucasian | French |
| Minimum | 56.1% | 29.1% |
| Maximum | 67.3% | 95.3% |
| Range | 11.3% | 66.2% |
| Mean | 63.3% | 58.9% |
| Median | 63.6% | 61.1% |
| Interquartile 25% (IQ1) | 61.8% | 52.2% |
| Interquartile 75% (IQ3) | 64.9% | 63.3% |
| Interquartile Range (IQR) | 3.1% | 11.1% |
| Standard Deviation (Sample) | 2.1% | 11.8% |
| Standard Deviation (Population) | 2.1% | 11.8% |
Demographics Similar to Whites/Caucasians and French by In Labor Force | Age > 16
In terms of in labor force | age > 16, the demographic groups most similar to Whites/Caucasians are Immigrants from the Azores (63.6%, a difference of 0.010%), Spanish American (63.6%, a difference of 0.030%), Immigrants from Grenada (63.6%, a difference of 0.060%), Comanche (63.6%, a difference of 0.060%), and Immigrants from North America (63.7%, a difference of 0.14%). Similarly, the demographic groups most similar to French are Immigrants from Germany (63.9%, a difference of 0.010%), Slovak (63.9%, a difference of 0.030%), Immigrants from Guyana (64.0%, a difference of 0.060%), Immigrants from Austria (63.9%, a difference of 0.060%), and Scottish (63.9%, a difference of 0.060%).
| Demographics | Rating | Rank | In Labor Force | Age > 16 |
| French Canadians | 0.2 /100 | #281 | Tragic 64.0% |
| Immigrants | Guyana | 0.2 /100 | #282 | Tragic 64.0% |
| Immigrants | Germany | 0.1 /100 | #283 | Tragic 63.9% |
| French | 0.1 /100 | #284 | Tragic 63.9% |
| Slovaks | 0.1 /100 | #285 | Tragic 63.9% |
| Immigrants | Austria | 0.1 /100 | #286 | Tragic 63.9% |
| Scottish | 0.1 /100 | #287 | Tragic 63.9% |
| Spanish | 0.1 /100 | #288 | Tragic 63.9% |
| Celtics | 0.1 /100 | #289 | Tragic 63.8% |
| Hungarians | 0.1 /100 | #290 | Tragic 63.8% |
| Nepalese | 0.1 /100 | #291 | Tragic 63.8% |
| Spanish American Indians | 0.1 /100 | #292 | Tragic 63.8% |
| English | 0.1 /100 | #293 | Tragic 63.7% |
| Puget Sound Salish | 0.0 /100 | #294 | Tragic 63.7% |
| Immigrants | Canada | 0.0 /100 | #295 | Tragic 63.7% |
| Immigrants | North America | 0.0 /100 | #296 | Tragic 63.7% |
| Immigrants | Grenada | 0.0 /100 | #297 | Tragic 63.6% |
| Comanche | 0.0 /100 | #298 | Tragic 63.6% |
| Whites/Caucasians | 0.0 /100 | #299 | Tragic 63.6% |
| Immigrants | Azores | 0.0 /100 | #300 | Tragic 63.6% |
| Spanish Americans | 0.0 /100 | #301 | Tragic 63.6% |