West Indian vs Menominee In Labor Force | Age 16-19
COMPARE
West Indian
Menominee
In Labor Force | Age 16-19
In Labor Force | Age 16-19 Comparison
West Indians
Menominee
31.3%
IN LABOR FORCE | AGE 16-19
0.0/ 100
METRIC RATING
321st/ 347
METRIC RANK
33.9%
IN LABOR FORCE | AGE 16-19
0.3/ 100
METRIC RATING
277th/ 347
METRIC RANK
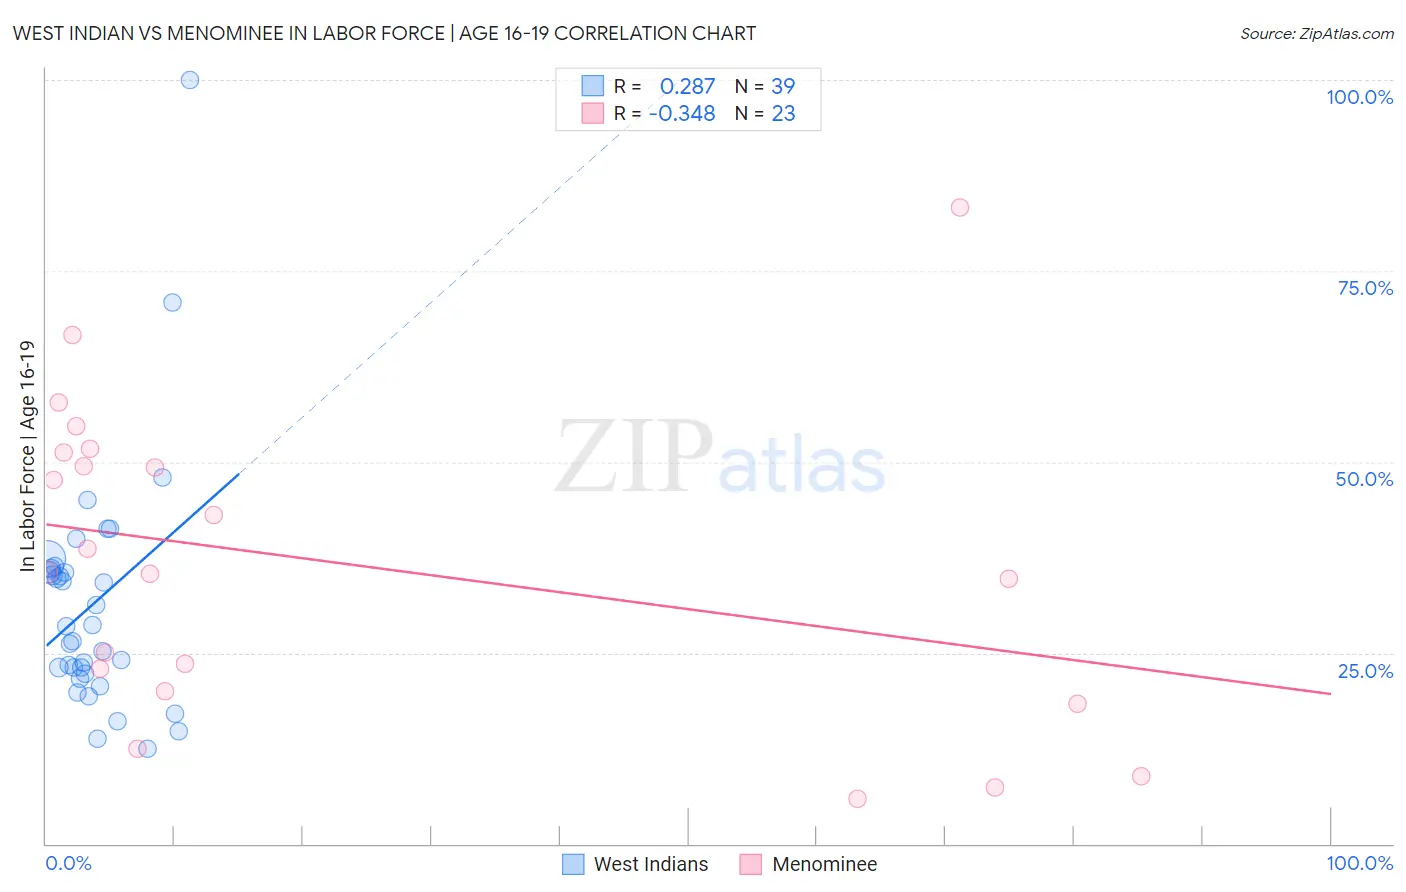
West Indian vs Menominee In Labor Force | Age 16-19 Correlation Chart
The statistical analysis conducted on geographies consisting of 253,845,757 people shows a weak positive correlation between the proportion of West Indians and labor force participation rate among population between the ages 16 and 19 in the United States with a correlation coefficient (R) of 0.287 and weighted average of 31.3%. Similarly, the statistical analysis conducted on geographies consisting of 45,771,172 people shows a mild negative correlation between the proportion of Menominee and labor force participation rate among population between the ages 16 and 19 in the United States with a correlation coefficient (R) of -0.348 and weighted average of 33.9%, a difference of 8.1%.
In Labor Force | Age 16-19 Correlation Summary
| Measurement | West Indian | Menominee |
| Minimum | 12.5% | 5.9% |
| Maximum | 100.0% | 83.3% |
| Range | 87.5% | 77.4% |
| Mean | 31.4% | 36.7% |
| Median | 28.5% | 35.5% |
| Interquartile 25% (IQ1) | 22.3% | 20.0% |
| Interquartile 75% (IQ3) | 35.9% | 51.3% |
| Interquartile Range (IQR) | 13.6% | 31.3% |
| Standard Deviation (Sample) | 15.9% | 20.3% |
| Standard Deviation (Population) | 15.7% | 19.8% |
Similar Demographics by In Labor Force | Age 16-19
Demographics Similar to West Indians by In Labor Force | Age 16-19
In terms of in labor force | age 16-19, the demographic groups most similar to West Indians are Tohono O'odham (31.3%, a difference of 0.12%), Ecuadorian (31.4%, a difference of 0.23%), Immigrants from Caribbean (31.2%, a difference of 0.25%), Soviet Union (31.4%, a difference of 0.30%), and Dominican (31.2%, a difference of 0.43%).
| Demographics | Rating | Rank | In Labor Force | Age 16-19 |
| Cubans | 0.0 /100 | #314 | Tragic 31.8% |
| Immigrants | West Indies | 0.0 /100 | #315 | Tragic 31.7% |
| Filipinos | 0.0 /100 | #316 | Tragic 31.7% |
| Immigrants | Nicaragua | 0.0 /100 | #317 | Tragic 31.6% |
| Immigrants | Yemen | 0.0 /100 | #318 | Tragic 31.5% |
| Soviet Union | 0.0 /100 | #319 | Tragic 31.4% |
| Ecuadorians | 0.0 /100 | #320 | Tragic 31.4% |
| West Indians | 0.0 /100 | #321 | Tragic 31.3% |
| Tohono O'odham | 0.0 /100 | #322 | Tragic 31.3% |
| Immigrants | Caribbean | 0.0 /100 | #323 | Tragic 31.2% |
| Dominicans | 0.0 /100 | #324 | Tragic 31.2% |
| Immigrants | China | 0.0 /100 | #325 | Tragic 31.1% |
| Immigrants | Dominican Republic | 0.0 /100 | #326 | Tragic 31.1% |
| Immigrants | Taiwan | 0.0 /100 | #327 | Tragic 31.0% |
| Immigrants | Ecuador | 0.0 /100 | #328 | Tragic 31.0% |
Demographics Similar to Menominee by In Labor Force | Age 16-19
In terms of in labor force | age 16-19, the demographic groups most similar to Menominee are Colombian (33.8%, a difference of 0.070%), Paraguayan (33.8%, a difference of 0.080%), Taiwanese (33.8%, a difference of 0.090%), Cypriot (33.8%, a difference of 0.10%), and Immigrants from Latin America (33.9%, a difference of 0.11%).
| Demographics | Rating | Rank | In Labor Force | Age 16-19 |
| Immigrants | Russia | 0.4 /100 | #270 | Tragic 34.1% |
| Central American Indians | 0.4 /100 | #271 | Tragic 34.1% |
| Asians | 0.4 /100 | #272 | Tragic 34.1% |
| Immigrants | Panama | 0.4 /100 | #273 | Tragic 34.0% |
| Venezuelans | 0.3 /100 | #274 | Tragic 34.0% |
| Immigrants | Fiji | 0.3 /100 | #275 | Tragic 33.9% |
| Immigrants | Latin America | 0.3 /100 | #276 | Tragic 33.9% |
| Menominee | 0.3 /100 | #277 | Tragic 33.9% |
| Colombians | 0.3 /100 | #278 | Tragic 33.8% |
| Paraguayans | 0.3 /100 | #279 | Tragic 33.8% |
| Taiwanese | 0.3 /100 | #280 | Tragic 33.8% |
| Cypriots | 0.3 /100 | #281 | Tragic 33.8% |
| Immigrants | Korea | 0.3 /100 | #282 | Tragic 33.8% |
| Immigrants | Venezuela | 0.2 /100 | #283 | Tragic 33.7% |
| Immigrants | Spain | 0.2 /100 | #284 | Tragic 33.7% |