West Indian vs Immigrants from India In Labor Force | Age 20-24
COMPARE
West Indian
Immigrants from India
In Labor Force | Age 20-24
In Labor Force | Age 20-24 Comparison
West Indians
Immigrants from India
71.3%
IN LABOR FORCE | AGE 20-24
0.0/ 100
METRIC RATING
323rd/ 347
METRIC RANK
74.4%
IN LABOR FORCE | AGE 20-24
9.9/ 100
METRIC RATING
222nd/ 347
METRIC RANK
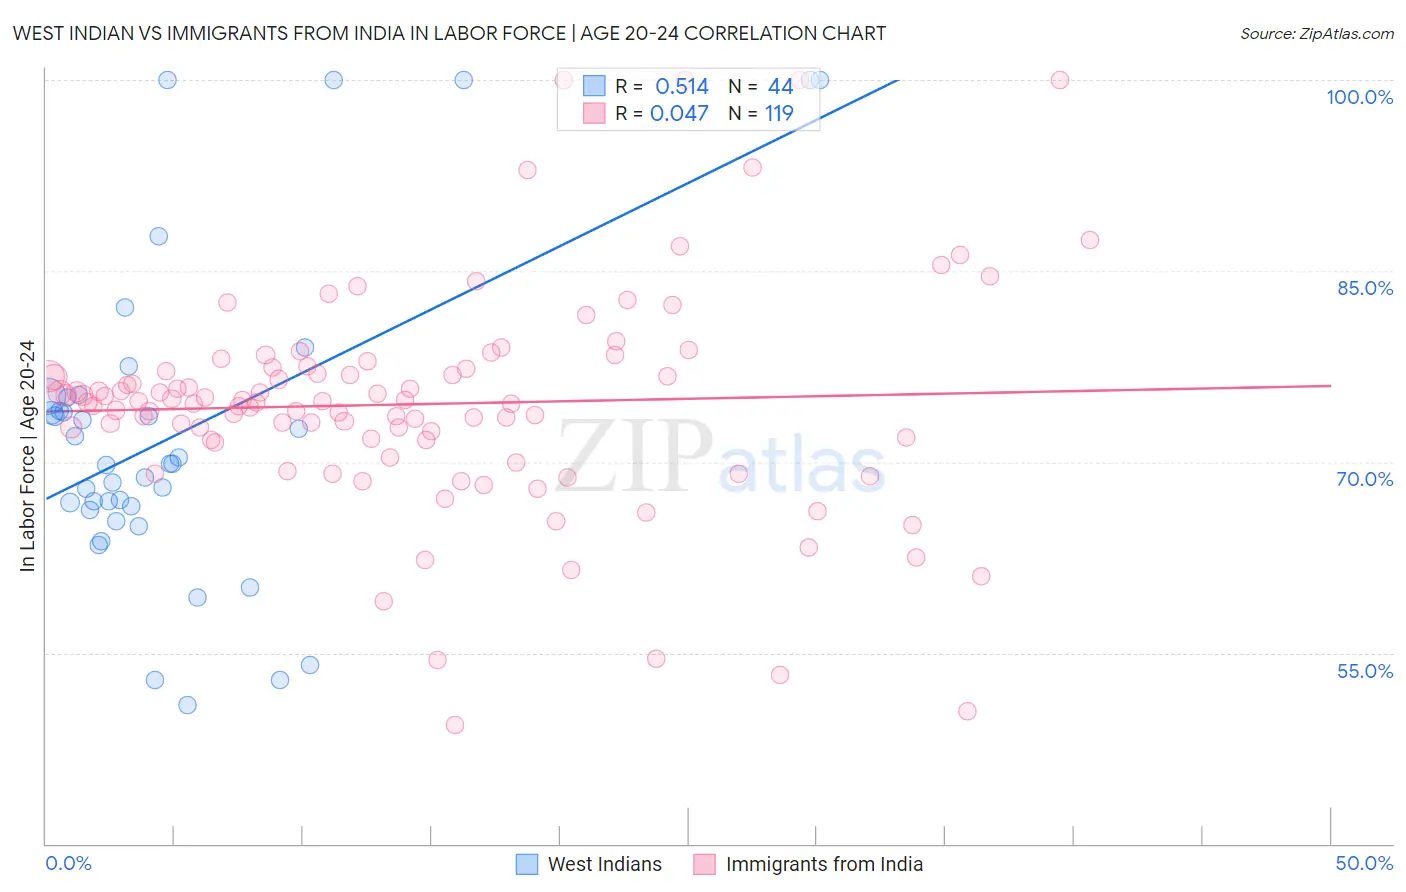
West Indian vs Immigrants from India In Labor Force | Age 20-24 Correlation Chart
The statistical analysis conducted on geographies consisting of 254,022,866 people shows a substantial positive correlation between the proportion of West Indians and labor force participation rate among population between the ages 20 and 24 in the United States with a correlation coefficient (R) of 0.514 and weighted average of 71.3%. Similarly, the statistical analysis conducted on geographies consisting of 433,974,099 people shows no correlation between the proportion of Immigrants from India and labor force participation rate among population between the ages 20 and 24 in the United States with a correlation coefficient (R) of 0.047 and weighted average of 74.4%, a difference of 4.4%.
In Labor Force | Age 20-24 Correlation Summary
| Measurement | West Indian | Immigrants from India |
| Minimum | 50.9% | 49.4% |
| Maximum | 100.0% | 100.0% |
| Range | 49.1% | 50.6% |
| Mean | 72.3% | 74.5% |
| Median | 69.9% | 74.7% |
| Interquartile 25% (IQ1) | 66.3% | 71.7% |
| Interquartile 75% (IQ3) | 75.1% | 77.3% |
| Interquartile Range (IQR) | 8.7% | 5.6% |
| Standard Deviation (Sample) | 12.5% | 8.7% |
| Standard Deviation (Population) | 12.3% | 8.7% |
Similar Demographics by In Labor Force | Age 20-24
Demographics Similar to West Indians by In Labor Force | Age 20-24
In terms of in labor force | age 20-24, the demographic groups most similar to West Indians are Immigrants from Dominican Republic (71.2%, a difference of 0.090%), Filipino (71.4%, a difference of 0.18%), Barbadian (71.1%, a difference of 0.20%), Dominican (71.1%, a difference of 0.28%), and Immigrants from Trinidad and Tobago (71.1%, a difference of 0.28%).
| Demographics | Rating | Rank | In Labor Force | Age 20-24 |
| Immigrants | Eastern Asia | 0.0 /100 | #316 | Tragic 71.8% |
| Immigrants | Armenia | 0.0 /100 | #317 | Tragic 71.7% |
| Immigrants | Hong Kong | 0.0 /100 | #318 | Tragic 71.6% |
| Immigrants | Israel | 0.0 /100 | #319 | Tragic 71.6% |
| Trinidadians and Tobagonians | 0.0 /100 | #320 | Tragic 71.5% |
| Immigrants | Taiwan | 0.0 /100 | #321 | Tragic 71.5% |
| Filipinos | 0.0 /100 | #322 | Tragic 71.4% |
| West Indians | 0.0 /100 | #323 | Tragic 71.3% |
| Immigrants | Dominican Republic | 0.0 /100 | #324 | Tragic 71.2% |
| Barbadians | 0.0 /100 | #325 | Tragic 71.1% |
| Dominicans | 0.0 /100 | #326 | Tragic 71.1% |
| Immigrants | Trinidad and Tobago | 0.0 /100 | #327 | Tragic 71.1% |
| Immigrants | China | 0.0 /100 | #328 | Tragic 71.1% |
| Yup'ik | 0.0 /100 | #329 | Tragic 70.9% |
| Vietnamese | 0.0 /100 | #330 | Tragic 70.6% |
Demographics Similar to Immigrants from India by In Labor Force | Age 20-24
In terms of in labor force | age 20-24, the demographic groups most similar to Immigrants from India are Immigrants from Norway (74.5%, a difference of 0.020%), Chickasaw (74.5%, a difference of 0.020%), Immigrants from Peru (74.5%, a difference of 0.030%), Nepalese (74.5%, a difference of 0.030%), and Hispanic or Latino (74.4%, a difference of 0.090%).
| Demographics | Rating | Rank | In Labor Force | Age 20-24 |
| Immigrants | Ghana | 12.7 /100 | #215 | Poor 74.5% |
| Immigrants | Kuwait | 12.7 /100 | #216 | Poor 74.5% |
| Chileans | 12.5 /100 | #217 | Poor 74.5% |
| Immigrants | Peru | 10.6 /100 | #218 | Poor 74.5% |
| Nepalese | 10.5 /100 | #219 | Poor 74.5% |
| Immigrants | Norway | 10.3 /100 | #220 | Poor 74.5% |
| Chickasaw | 10.3 /100 | #221 | Poor 74.5% |
| Immigrants | India | 9.9 /100 | #222 | Tragic 74.4% |
| Hispanics or Latinos | 7.9 /100 | #223 | Tragic 74.4% |
| Seminole | 6.9 /100 | #224 | Tragic 74.3% |
| Ghanaians | 6.2 /100 | #225 | Tragic 74.3% |
| Immigrants | Fiji | 5.9 /100 | #226 | Tragic 74.3% |
| Immigrants | Ireland | 5.8 /100 | #227 | Tragic 74.3% |
| Immigrants | Ukraine | 5.1 /100 | #228 | Tragic 74.2% |
| Immigrants | Sweden | 4.6 /100 | #229 | Tragic 74.2% |