U.S. Virgin Islander vs Ukrainian In Labor Force | Age > 16
COMPARE
U.S. Virgin Islander
Ukrainian
In Labor Force | Age > 16
In Labor Force | Age > 16 Comparison
U.S. Virgin Islanders
Ukrainians
64.7%
IN LABOR FORCE | AGE > 16
11.3/ 100
METRIC RATING
217th/ 347
METRIC RANK
64.9%
IN LABOR FORCE | AGE > 16
19.6/ 100
METRIC RATING
201st/ 347
METRIC RANK
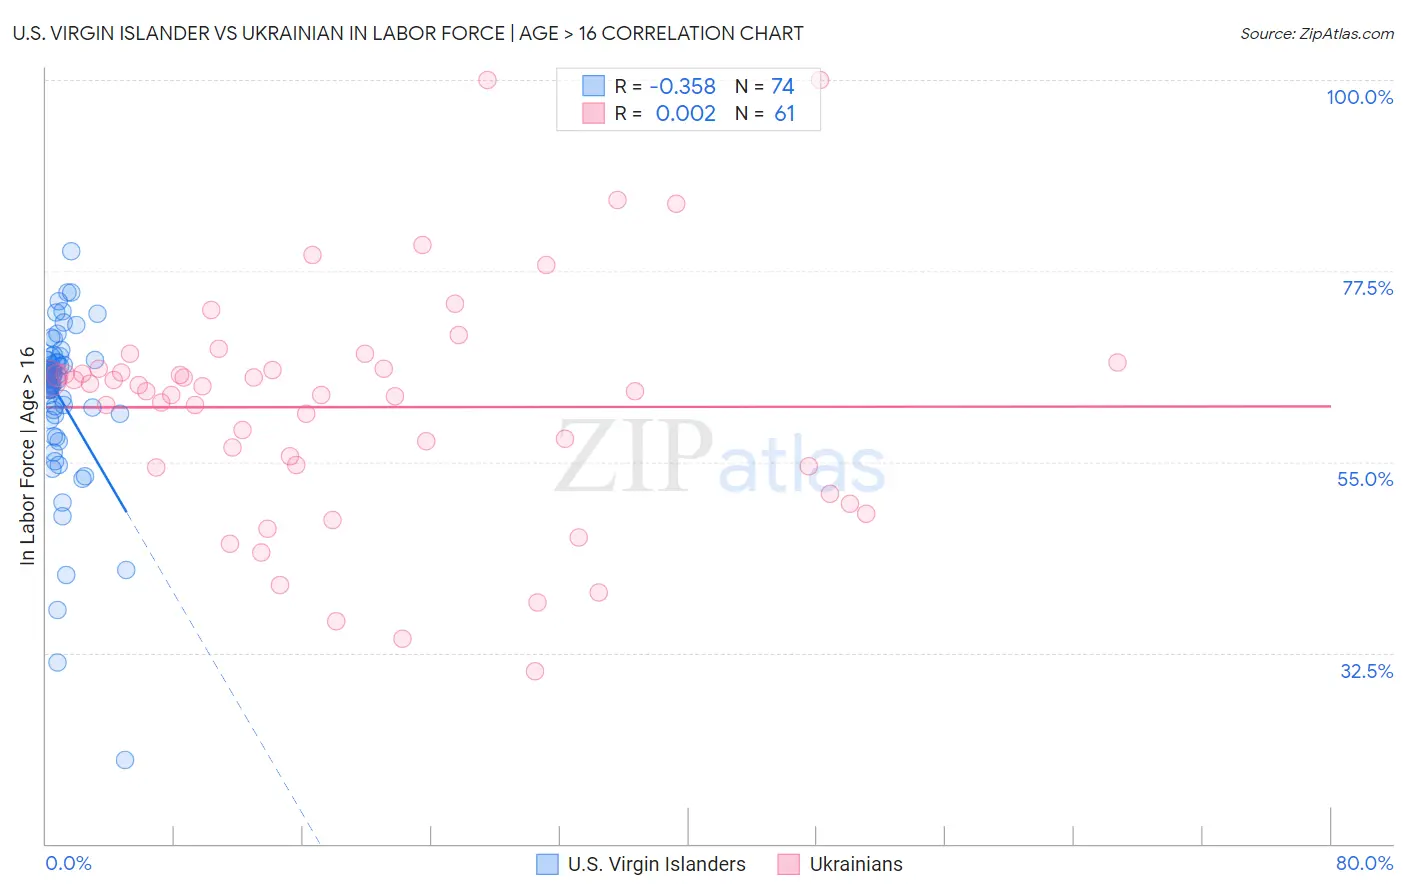
U.S. Virgin Islander vs Ukrainian In Labor Force | Age > 16 Correlation Chart
The statistical analysis conducted on geographies consisting of 87,527,161 people shows a mild negative correlation between the proportion of U.S. Virgin Islanders and labor force participation rate among population ages 16 and over in the United States with a correlation coefficient (R) of -0.358 and weighted average of 64.7%. Similarly, the statistical analysis conducted on geographies consisting of 448,710,826 people shows no correlation between the proportion of Ukrainians and labor force participation rate among population ages 16 and over in the United States with a correlation coefficient (R) of 0.002 and weighted average of 64.9%, a difference of 0.18%.
In Labor Force | Age > 16 Correlation Summary
| Measurement | U.S. Virgin Islander | Ukrainian |
| Minimum | 19.9% | 30.4% |
| Maximum | 79.8% | 100.0% |
| Range | 59.9% | 69.6% |
| Mean | 62.4% | 61.4% |
| Median | 64.8% | 63.4% |
| Interquartile 25% (IQ1) | 60.6% | 54.4% |
| Interquartile 75% (IQ3) | 66.8% | 66.0% |
| Interquartile Range (IQR) | 6.2% | 11.6% |
| Standard Deviation (Sample) | 9.7% | 13.8% |
| Standard Deviation (Population) | 9.6% | 13.7% |
Demographics Similar to U.S. Virgin Islanders and Ukrainians by In Labor Force | Age > 16
In terms of in labor force | age > 16, the demographic groups most similar to U.S. Virgin Islanders are Belgian (64.7%, a difference of 0.0%), Alsatian (64.7%, a difference of 0.020%), Immigrants from Central America (64.7%, a difference of 0.020%), Immigrants from Czechoslovakia (64.8%, a difference of 0.030%), and Estonian (64.8%, a difference of 0.050%). Similarly, the demographic groups most similar to Ukrainians are Immigrants from Belgium (64.9%, a difference of 0.0%), Armenian (64.9%, a difference of 0.010%), Russian (64.9%, a difference of 0.010%), Slovene (64.9%, a difference of 0.020%), and Jamaican (64.9%, a difference of 0.020%).
| Demographics | Rating | Rank | In Labor Force | Age > 16 |
| Mexican American Indians | 23.1 /100 | #199 | Fair 64.9% |
| Armenians | 20.2 /100 | #200 | Fair 64.9% |
| Ukrainians | 19.6 /100 | #201 | Poor 64.9% |
| Immigrants | Belgium | 19.4 /100 | #202 | Poor 64.9% |
| Russians | 18.8 /100 | #203 | Poor 64.9% |
| Slovenes | 18.7 /100 | #204 | Poor 64.9% |
| Jamaicans | 18.7 /100 | #205 | Poor 64.9% |
| Lithuanians | 17.4 /100 | #206 | Poor 64.8% |
| Immigrants | Latin America | 16.4 /100 | #207 | Poor 64.8% |
| Belizeans | 16.2 /100 | #208 | Poor 64.8% |
| Immigrants | Trinidad and Tobago | 15.6 /100 | #209 | Poor 64.8% |
| Immigrants | Denmark | 14.7 /100 | #210 | Poor 64.8% |
| Fijians | 14.1 /100 | #211 | Poor 64.8% |
| Alaskan Athabascans | 13.9 /100 | #212 | Poor 64.8% |
| Maltese | 13.8 /100 | #213 | Poor 64.8% |
| Estonians | 13.1 /100 | #214 | Poor 64.8% |
| Immigrants | Czechoslovakia | 12.3 /100 | #215 | Poor 64.8% |
| Belgians | 11.4 /100 | #216 | Poor 64.7% |
| U.S. Virgin Islanders | 11.3 /100 | #217 | Poor 64.7% |
| Alsatians | 10.7 /100 | #218 | Poor 64.7% |
| Immigrants | Central America | 10.5 /100 | #219 | Poor 64.7% |