Turkish vs Immigrants from India In Labor Force | Age 16-19
COMPARE
Turkish
Immigrants from India
In Labor Force | Age 16-19
In Labor Force | Age 16-19 Comparison
Turks
Immigrants from India
35.4%
IN LABOR FORCE | AGE 16-19
7.3/ 100
METRIC RATING
221st/ 347
METRIC RANK
35.0%
IN LABOR FORCE | AGE 16-19
3.5/ 100
METRIC RATING
237th/ 347
METRIC RANK
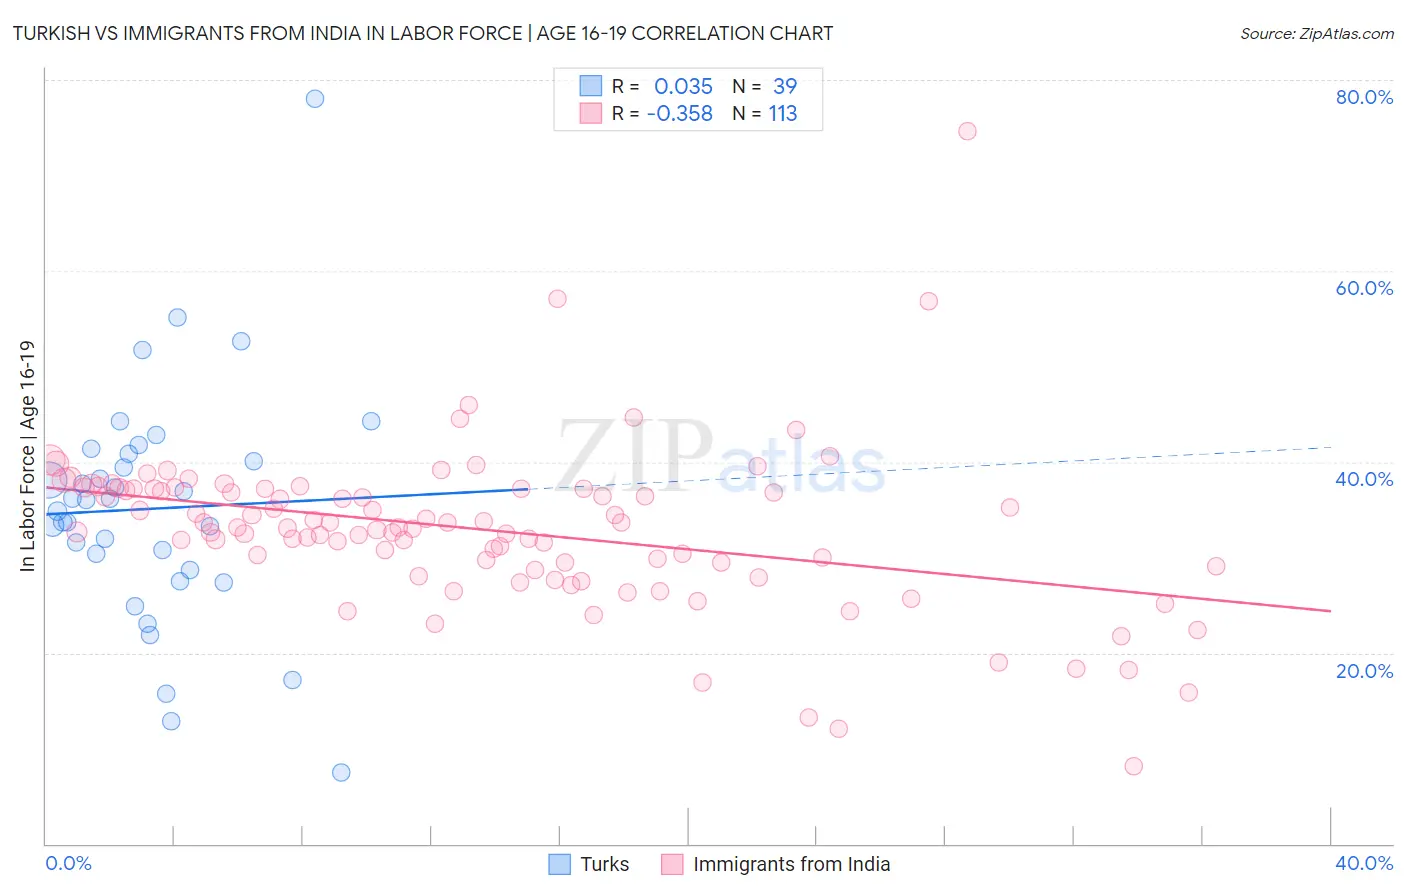
Turkish vs Immigrants from India In Labor Force | Age 16-19 Correlation Chart
The statistical analysis conducted on geographies consisting of 271,508,687 people shows no correlation between the proportion of Turks and labor force participation rate among population between the ages 16 and 19 in the United States with a correlation coefficient (R) of 0.035 and weighted average of 35.4%. Similarly, the statistical analysis conducted on geographies consisting of 433,366,164 people shows a mild negative correlation between the proportion of Immigrants from India and labor force participation rate among population between the ages 16 and 19 in the United States with a correlation coefficient (R) of -0.358 and weighted average of 35.0%, a difference of 1.0%.
In Labor Force | Age 16-19 Correlation Summary
| Measurement | Turkish | Immigrants from India |
| Minimum | 7.4% | 8.1% |
| Maximum | 78.1% | 74.6% |
| Range | 70.7% | 66.5% |
| Mean | 35.1% | 32.9% |
| Median | 36.0% | 33.1% |
| Interquartile 25% (IQ1) | 28.6% | 29.2% |
| Interquartile 75% (IQ3) | 40.8% | 37.2% |
| Interquartile Range (IQR) | 12.2% | 8.0% |
| Standard Deviation (Sample) | 12.4% | 8.5% |
| Standard Deviation (Population) | 12.3% | 8.5% |
Demographics Similar to Turks and Immigrants from India by In Labor Force | Age 16-19
In terms of in labor force | age 16-19, the demographic groups most similar to Turks are Immigrants from Ghana (35.4%, a difference of 0.010%), Ghanaian (35.3%, a difference of 0.16%), Honduran (35.3%, a difference of 0.17%), Immigrants from Bahamas (35.5%, a difference of 0.18%), and Guatemalan (35.5%, a difference of 0.23%). Similarly, the demographic groups most similar to Immigrants from India are Immigrants from Australia (35.1%, a difference of 0.030%), Immigrants from Vietnam (35.0%, a difference of 0.050%), Inupiat (35.0%, a difference of 0.14%), Immigrants from Philippines (35.1%, a difference of 0.17%), and Immigrants from Mexico (35.1%, a difference of 0.25%).
| Demographics | Rating | Rank | In Labor Force | Age 16-19 |
| Guatemalans | 8.6 /100 | #219 | Tragic 35.5% |
| Immigrants | Bahamas | 8.3 /100 | #220 | Tragic 35.5% |
| Turks | 7.3 /100 | #221 | Tragic 35.4% |
| Immigrants | Ghana | 7.3 /100 | #222 | Tragic 35.4% |
| Ghanaians | 6.5 /100 | #223 | Tragic 35.3% |
| Hondurans | 6.5 /100 | #224 | Tragic 35.3% |
| Immigrants | Belgium | 6.1 /100 | #225 | Tragic 35.3% |
| Immigrants | Guatemala | 5.7 /100 | #226 | Tragic 35.3% |
| Mongolians | 5.7 /100 | #227 | Tragic 35.3% |
| Immigrants | Senegal | 5.5 /100 | #228 | Tragic 35.3% |
| Immigrants | Lebanon | 5.0 /100 | #229 | Tragic 35.2% |
| Immigrants | Honduras | 4.9 /100 | #230 | Tragic 35.2% |
| Immigrants | Syria | 4.5 /100 | #231 | Tragic 35.2% |
| Immigrants | Kazakhstan | 4.5 /100 | #232 | Tragic 35.2% |
| Immigrants | France | 4.3 /100 | #233 | Tragic 35.1% |
| Immigrants | Mexico | 4.2 /100 | #234 | Tragic 35.1% |
| Immigrants | Philippines | 4.0 /100 | #235 | Tragic 35.1% |
| Immigrants | Australia | 3.6 /100 | #236 | Tragic 35.1% |
| Immigrants | India | 3.5 /100 | #237 | Tragic 35.0% |
| Immigrants | Vietnam | 3.4 /100 | #238 | Tragic 35.0% |
| Inupiat | 3.2 /100 | #239 | Tragic 35.0% |