Tsimshian vs Yugoslavian In Labor Force | Age > 16
COMPARE
Tsimshian
Yugoslavian
In Labor Force | Age > 16
In Labor Force | Age > 16 Comparison
Tsimshian
Yugoslavians
64.5%
IN LABOR FORCE | AGE > 16
3.1/ 100
METRIC RATING
244th/ 347
METRIC RANK
65.4%
IN LABOR FORCE | AGE > 16
81.3/ 100
METRIC RATING
152nd/ 347
METRIC RANK
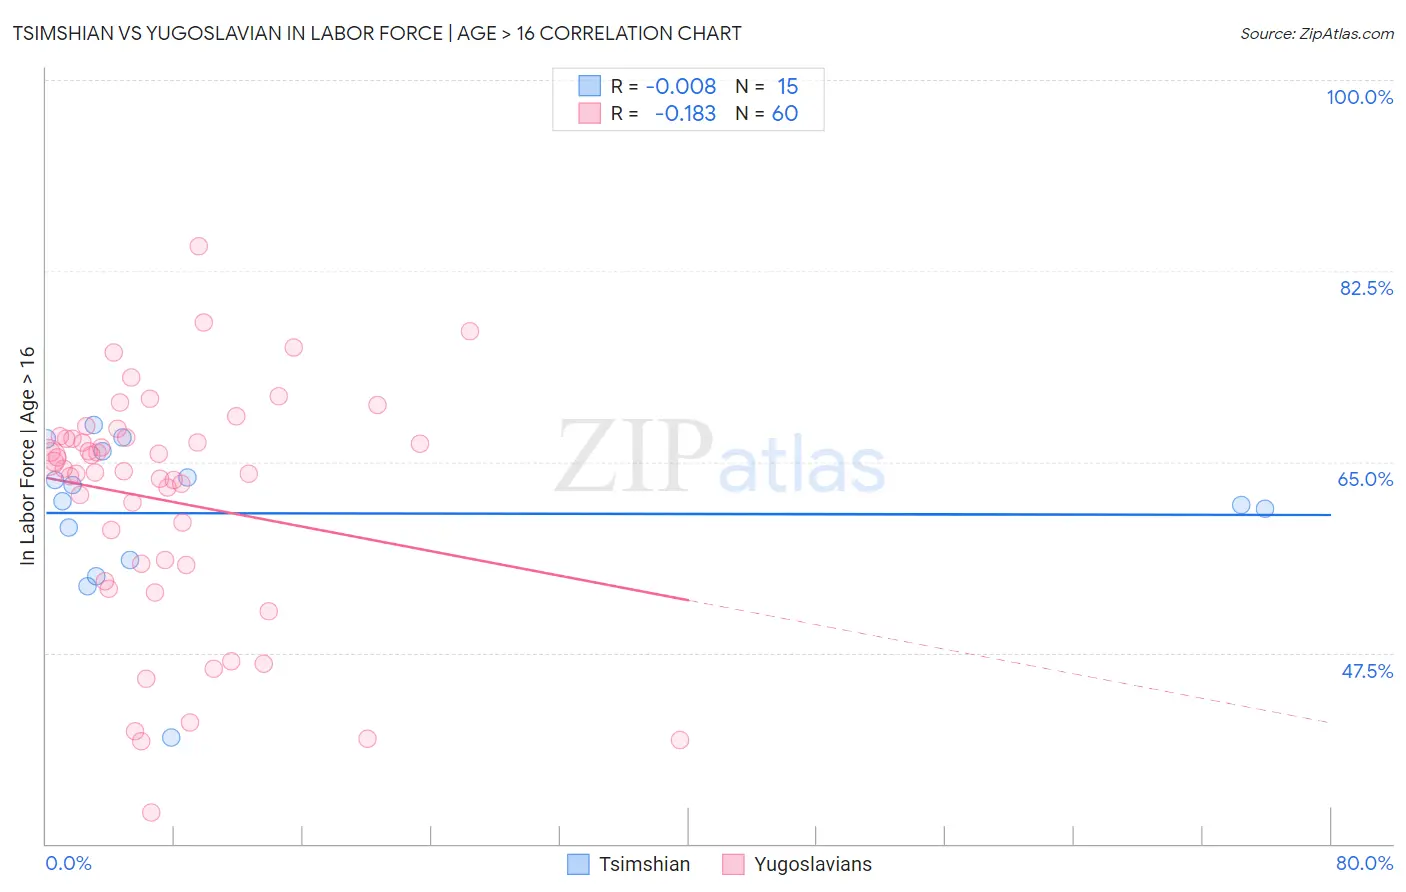
Tsimshian vs Yugoslavian In Labor Force | Age > 16 Correlation Chart
The statistical analysis conducted on geographies consisting of 15,626,544 people shows no correlation between the proportion of Tsimshian and labor force participation rate among population ages 16 and over in the United States with a correlation coefficient (R) of -0.008 and weighted average of 64.5%. Similarly, the statistical analysis conducted on geographies consisting of 285,722,501 people shows a poor negative correlation between the proportion of Yugoslavians and labor force participation rate among population ages 16 and over in the United States with a correlation coefficient (R) of -0.183 and weighted average of 65.4%, a difference of 1.4%.
In Labor Force | Age > 16 Correlation Summary
| Measurement | Tsimshian | Yugoslavian |
| Minimum | 39.7% | 32.9% |
| Maximum | 68.4% | 84.8% |
| Range | 28.7% | 51.9% |
| Mean | 60.3% | 61.4% |
| Median | 61.3% | 64.3% |
| Interquartile 25% (IQ1) | 56.0% | 55.6% |
| Interquartile 75% (IQ3) | 66.0% | 67.2% |
| Interquartile Range (IQR) | 10.0% | 11.6% |
| Standard Deviation (Sample) | 7.3% | 10.9% |
| Standard Deviation (Population) | 7.0% | 10.8% |
Similar Demographics by In Labor Force | Age > 16
Demographics Similar to Tsimshian by In Labor Force | Age > 16
In terms of in labor force | age > 16, the demographic groups most similar to Tsimshian are West Indian (64.5%, a difference of 0.0%), Immigrants from Lebanon (64.5%, a difference of 0.020%), Immigrants from Netherlands (64.5%, a difference of 0.030%), Immigrants from Dominica (64.5%, a difference of 0.040%), and Immigrants from Bangladesh (64.5%, a difference of 0.050%).
| Demographics | Rating | Rank | In Labor Force | Age > 16 |
| Italians | 4.6 /100 | #237 | Tragic 64.6% |
| Lebanese | 3.9 /100 | #238 | Tragic 64.5% |
| Immigrants | Hungary | 3.8 /100 | #239 | Tragic 64.5% |
| Immigrants | Bangladesh | 3.6 /100 | #240 | Tragic 64.5% |
| Immigrants | Dominica | 3.5 /100 | #241 | Tragic 64.5% |
| Immigrants | Netherlands | 3.4 /100 | #242 | Tragic 64.5% |
| Immigrants | Lebanon | 3.2 /100 | #243 | Tragic 64.5% |
| Tsimshian | 3.1 /100 | #244 | Tragic 64.5% |
| West Indians | 3.0 /100 | #245 | Tragic 64.5% |
| Immigrants | Caribbean | 2.3 /100 | #246 | Tragic 64.4% |
| Swiss | 2.1 /100 | #247 | Tragic 64.4% |
| Immigrants | Barbados | 2.1 /100 | #248 | Tragic 64.4% |
| Germans | 1.8 /100 | #249 | Tragic 64.4% |
| British West Indians | 1.8 /100 | #250 | Tragic 64.4% |
| Portuguese | 1.6 /100 | #251 | Tragic 64.4% |
Demographics Similar to Yugoslavians by In Labor Force | Age > 16
In terms of in labor force | age > 16, the demographic groups most similar to Yugoslavians are Czech (65.4%, a difference of 0.0%), Immigrants (65.4%, a difference of 0.010%), Immigrants from China (65.4%, a difference of 0.010%), Immigrants from Eastern Europe (65.4%, a difference of 0.050%), and Immigrants from Armenia (65.3%, a difference of 0.080%).
| Demographics | Rating | Rank | In Labor Force | Age > 16 |
| Tlingit-Haida | 88.3 /100 | #145 | Excellent 65.5% |
| Cypriots | 88.2 /100 | #146 | Excellent 65.5% |
| Immigrants | Oceania | 87.5 /100 | #147 | Excellent 65.5% |
| Bhutanese | 86.3 /100 | #148 | Excellent 65.5% |
| Immigrants | Albania | 85.7 /100 | #149 | Excellent 65.4% |
| Immigrants | Immigrants | 81.9 /100 | #150 | Excellent 65.4% |
| Czechs | 81.5 /100 | #151 | Excellent 65.4% |
| Yugoslavians | 81.3 /100 | #152 | Excellent 65.4% |
| Immigrants | China | 80.5 /100 | #153 | Excellent 65.4% |
| Immigrants | Eastern Europe | 78.3 /100 | #154 | Good 65.4% |
| Immigrants | Armenia | 76.6 /100 | #155 | Good 65.3% |
| Immigrants | Ireland | 75.9 /100 | #156 | Good 65.3% |
| Immigrants | Russia | 75.7 /100 | #157 | Good 65.3% |
| Panamanians | 75.2 /100 | #158 | Good 65.3% |
| Immigrants | Syria | 74.6 /100 | #159 | Good 65.3% |