Tsimshian vs Immigrants from Serbia In Labor Force | Age 45-54
COMPARE
Tsimshian
Immigrants from Serbia
In Labor Force | Age 45-54
In Labor Force | Age 45-54 Comparison
Tsimshian
Immigrants from Serbia
77.4%
IN LABOR FORCE | AGE 45-54
0.0/ 100
METRIC RATING
331st/ 347
METRIC RANK
83.9%
IN LABOR FORCE | AGE 45-54
99.8/ 100
METRIC RATING
26th/ 347
METRIC RANK
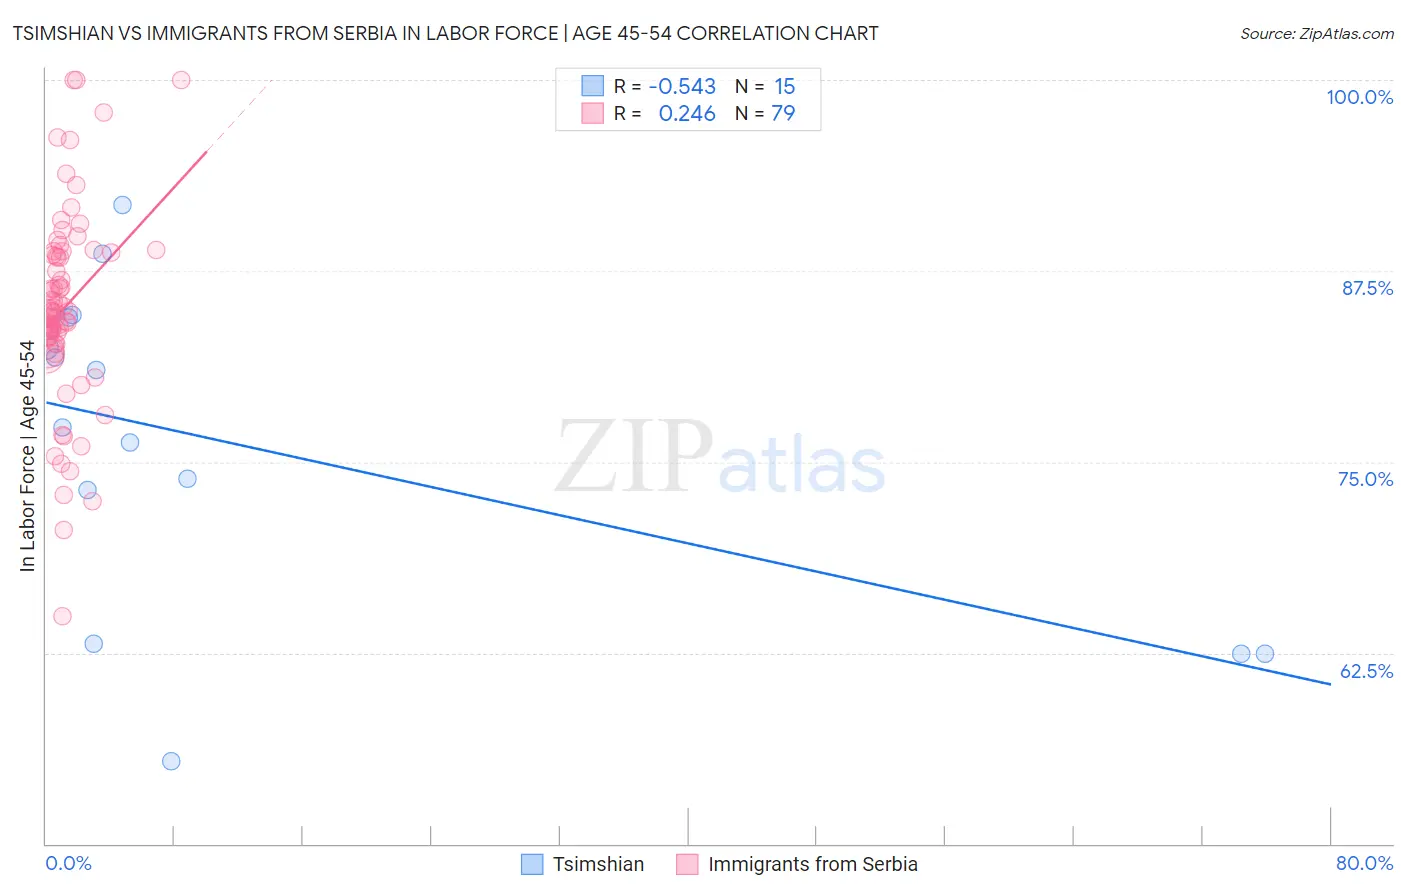
Tsimshian vs Immigrants from Serbia In Labor Force | Age 45-54 Correlation Chart
The statistical analysis conducted on geographies consisting of 15,626,261 people shows a substantial negative correlation between the proportion of Tsimshian and labor force participation rate among population between the ages 45 and 54 in the United States with a correlation coefficient (R) of -0.543 and weighted average of 77.4%. Similarly, the statistical analysis conducted on geographies consisting of 131,723,072 people shows a weak positive correlation between the proportion of Immigrants from Serbia and labor force participation rate among population between the ages 45 and 54 in the United States with a correlation coefficient (R) of 0.246 and weighted average of 83.9%, a difference of 8.3%.
In Labor Force | Age 45-54 Correlation Summary
| Measurement | Tsimshian | Immigrants from Serbia |
| Minimum | 55.4% | 64.9% |
| Maximum | 91.8% | 100.0% |
| Range | 36.4% | 35.1% |
| Mean | 75.9% | 85.1% |
| Median | 77.2% | 84.9% |
| Interquartile 25% (IQ1) | 63.1% | 83.2% |
| Interquartile 75% (IQ3) | 84.5% | 88.7% |
| Interquartile Range (IQR) | 21.4% | 5.5% |
| Standard Deviation (Sample) | 10.8% | 6.4% |
| Standard Deviation (Population) | 10.4% | 6.4% |
Similar Demographics by In Labor Force | Age 45-54
Demographics Similar to Tsimshian by In Labor Force | Age 45-54
In terms of in labor force | age 45-54, the demographic groups most similar to Tsimshian are Menominee (77.4%, a difference of 0.030%), Cheyenne (77.6%, a difference of 0.15%), Creek (77.7%, a difference of 0.37%), Native/Alaskan (77.1%, a difference of 0.39%), and Apache (77.1%, a difference of 0.39%).
| Demographics | Rating | Rank | In Labor Force | Age 45-54 |
| Dutch West Indians | 0.0 /100 | #324 | Tragic 78.2% |
| Choctaw | 0.0 /100 | #325 | Tragic 78.2% |
| Seminole | 0.0 /100 | #326 | Tragic 78.1% |
| Cajuns | 0.0 /100 | #327 | Tragic 78.1% |
| Sioux | 0.0 /100 | #328 | Tragic 78.0% |
| Creek | 0.0 /100 | #329 | Tragic 77.7% |
| Cheyenne | 0.0 /100 | #330 | Tragic 77.6% |
| Tsimshian | 0.0 /100 | #331 | Tragic 77.4% |
| Menominee | 0.0 /100 | #332 | Tragic 77.4% |
| Natives/Alaskans | 0.0 /100 | #333 | Tragic 77.1% |
| Apache | 0.0 /100 | #334 | Tragic 77.1% |
| Arapaho | 0.0 /100 | #335 | Tragic 77.1% |
| Paiute | 0.0 /100 | #336 | Tragic 76.7% |
| Ute | 0.0 /100 | #337 | Tragic 76.6% |
| Yuman | 0.0 /100 | #338 | Tragic 76.3% |
Demographics Similar to Immigrants from Serbia by In Labor Force | Age 45-54
In terms of in labor force | age 45-54, the demographic groups most similar to Immigrants from Serbia are Immigrants from North Macedonia (83.9%, a difference of 0.010%), Immigrants from Brazil (83.9%, a difference of 0.010%), Immigrants from Lithuania (83.9%, a difference of 0.020%), Tlingit-Haida (83.9%, a difference of 0.040%), and Slovene (83.9%, a difference of 0.040%).
| Demographics | Rating | Rank | In Labor Force | Age 45-54 |
| Czechs | 99.8 /100 | #19 | Exceptional 83.9% |
| Immigrants | Eastern Africa | 99.8 /100 | #20 | Exceptional 83.9% |
| Immigrants | Sri Lanka | 99.8 /100 | #21 | Exceptional 83.9% |
| Immigrants | Ireland | 99.8 /100 | #22 | Exceptional 83.9% |
| Tlingit-Haida | 99.8 /100 | #23 | Exceptional 83.9% |
| Slovenes | 99.8 /100 | #24 | Exceptional 83.9% |
| Immigrants | North Macedonia | 99.8 /100 | #25 | Exceptional 83.9% |
| Immigrants | Serbia | 99.8 /100 | #26 | Exceptional 83.9% |
| Immigrants | Brazil | 99.8 /100 | #27 | Exceptional 83.9% |
| Immigrants | Lithuania | 99.8 /100 | #28 | Exceptional 83.9% |
| Immigrants | Pakistan | 99.7 /100 | #29 | Exceptional 83.8% |
| Immigrants | Bulgaria | 99.7 /100 | #30 | Exceptional 83.8% |
| Immigrants | Eritrea | 99.7 /100 | #31 | Exceptional 83.8% |
| Turks | 99.7 /100 | #32 | Exceptional 83.8% |
| Latvians | 99.7 /100 | #33 | Exceptional 83.8% |