Trinidadian and Tobagonian vs Tsimshian In Labor Force | Age > 16
COMPARE
Trinidadian and Tobagonian
Tsimshian
In Labor Force | Age > 16
In Labor Force | Age > 16 Comparison
Trinidadians and Tobagonians
Tsimshian
65.1%
IN LABOR FORCE | AGE > 16
45.2/ 100
METRIC RATING
178th/ 347
METRIC RANK
64.5%
IN LABOR FORCE | AGE > 16
3.1/ 100
METRIC RATING
244th/ 347
METRIC RANK
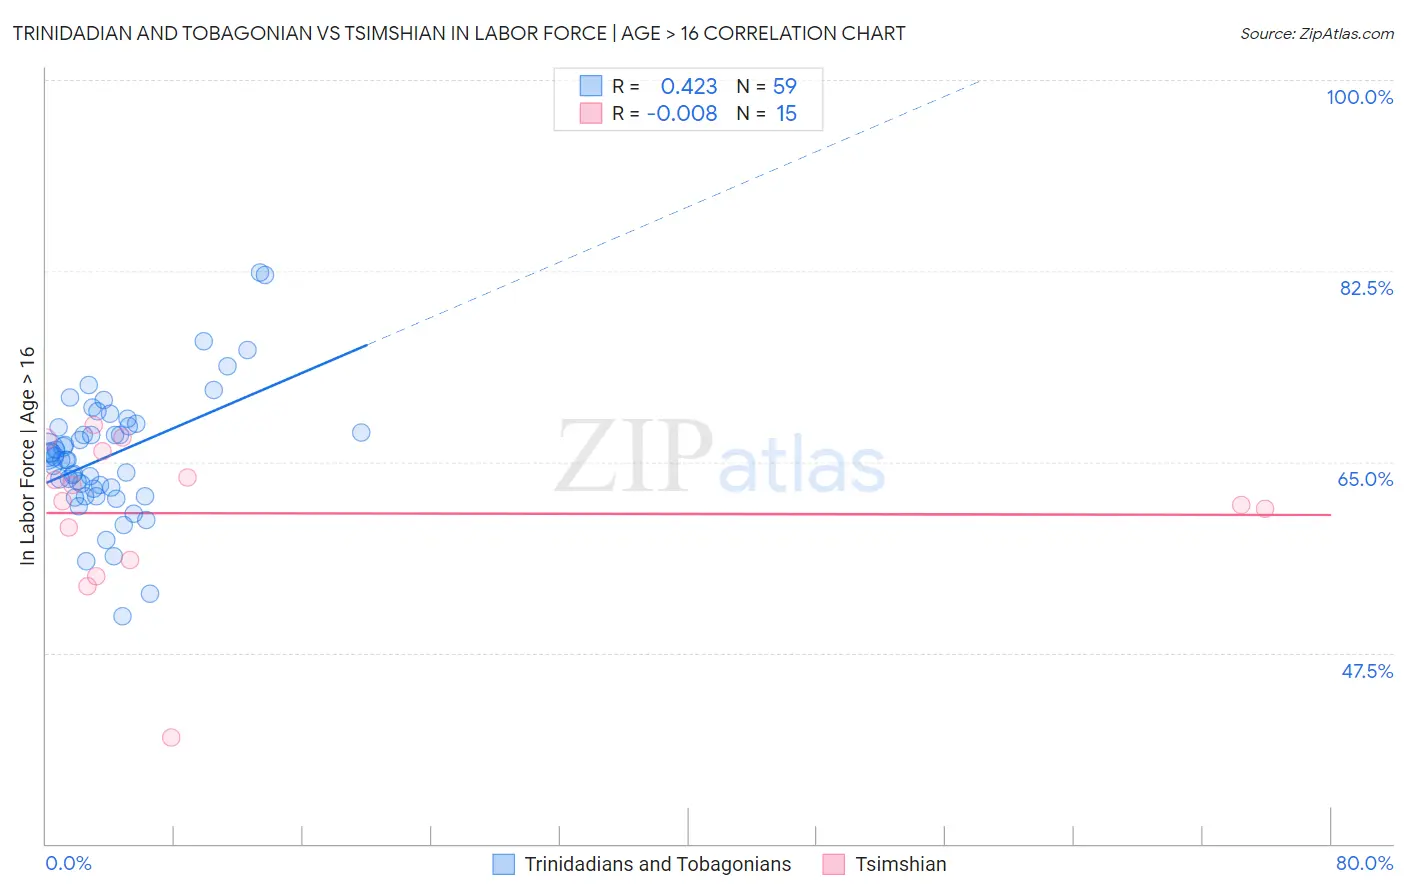
Trinidadian and Tobagonian vs Tsimshian In Labor Force | Age > 16 Correlation Chart
The statistical analysis conducted on geographies consisting of 219,884,780 people shows a moderate positive correlation between the proportion of Trinidadians and Tobagonians and labor force participation rate among population ages 16 and over in the United States with a correlation coefficient (R) of 0.423 and weighted average of 65.1%. Similarly, the statistical analysis conducted on geographies consisting of 15,626,544 people shows no correlation between the proportion of Tsimshian and labor force participation rate among population ages 16 and over in the United States with a correlation coefficient (R) of -0.008 and weighted average of 64.5%, a difference of 0.92%.
In Labor Force | Age > 16 Correlation Summary
| Measurement | Trinidadian and Tobagonian | Tsimshian |
| Minimum | 50.8% | 39.7% |
| Maximum | 82.4% | 68.4% |
| Range | 31.6% | 28.7% |
| Mean | 65.6% | 60.3% |
| Median | 65.5% | 61.3% |
| Interquartile 25% (IQ1) | 62.5% | 56.0% |
| Interquartile 75% (IQ3) | 68.3% | 66.0% |
| Interquartile Range (IQR) | 5.8% | 10.0% |
| Standard Deviation (Sample) | 5.8% | 7.3% |
| Standard Deviation (Population) | 5.7% | 7.0% |
Similar Demographics by In Labor Force | Age > 16
Demographics Similar to Trinidadians and Tobagonians by In Labor Force | Age > 16
In terms of in labor force | age > 16, the demographic groups most similar to Trinidadians and Tobagonians are Eastern European (65.1%, a difference of 0.010%), Immigrants from Haiti (65.1%, a difference of 0.020%), Swedish (65.1%, a difference of 0.030%), Immigrants from Latvia (65.1%, a difference of 0.030%), and Immigrants from Panama (65.1%, a difference of 0.030%).
| Demographics | Rating | Rank | In Labor Force | Age > 16 |
| Israelis | 61.6 /100 | #171 | Good 65.2% |
| Immigrants | Sweden | 61.3 /100 | #172 | Good 65.2% |
| Immigrants | Ukraine | 53.7 /100 | #173 | Average 65.1% |
| Macedonians | 50.0 /100 | #174 | Average 65.1% |
| Nicaraguans | 49.7 /100 | #175 | Average 65.1% |
| Swedes | 47.4 /100 | #176 | Average 65.1% |
| Eastern Europeans | 46.2 /100 | #177 | Average 65.1% |
| Trinidadians and Tobagonians | 45.2 /100 | #178 | Average 65.1% |
| Immigrants | Haiti | 43.3 /100 | #179 | Average 65.1% |
| Immigrants | Latvia | 42.9 /100 | #180 | Average 65.1% |
| Immigrants | Panama | 42.4 /100 | #181 | Average 65.1% |
| Immigrants | Nicaragua | 41.1 /100 | #182 | Average 65.1% |
| Soviet Union | 40.5 /100 | #183 | Average 65.0% |
| Carpatho Rusyns | 40.0 /100 | #184 | Average 65.0% |
| Syrians | 40.0 /100 | #185 | Average 65.0% |
Demographics Similar to Tsimshian by In Labor Force | Age > 16
In terms of in labor force | age > 16, the demographic groups most similar to Tsimshian are West Indian (64.5%, a difference of 0.0%), Immigrants from Lebanon (64.5%, a difference of 0.020%), Immigrants from Netherlands (64.5%, a difference of 0.030%), Immigrants from Dominica (64.5%, a difference of 0.040%), and Immigrants from Bangladesh (64.5%, a difference of 0.050%).
| Demographics | Rating | Rank | In Labor Force | Age > 16 |
| Italians | 4.6 /100 | #237 | Tragic 64.6% |
| Lebanese | 3.9 /100 | #238 | Tragic 64.5% |
| Immigrants | Hungary | 3.8 /100 | #239 | Tragic 64.5% |
| Immigrants | Bangladesh | 3.6 /100 | #240 | Tragic 64.5% |
| Immigrants | Dominica | 3.5 /100 | #241 | Tragic 64.5% |
| Immigrants | Netherlands | 3.4 /100 | #242 | Tragic 64.5% |
| Immigrants | Lebanon | 3.2 /100 | #243 | Tragic 64.5% |
| Tsimshian | 3.1 /100 | #244 | Tragic 64.5% |
| West Indians | 3.0 /100 | #245 | Tragic 64.5% |
| Immigrants | Caribbean | 2.3 /100 | #246 | Tragic 64.4% |
| Swiss | 2.1 /100 | #247 | Tragic 64.4% |
| Immigrants | Barbados | 2.1 /100 | #248 | Tragic 64.4% |
| Germans | 1.8 /100 | #249 | Tragic 64.4% |
| British West Indians | 1.8 /100 | #250 | Tragic 64.4% |
| Portuguese | 1.6 /100 | #251 | Tragic 64.4% |