Syrian vs Immigrants from Australia In Labor Force | Age 25-29

COMPARE

Syrian
Race
Ancestry
AfghanAfricanAlaska NativeAlaskan AthabascanAlbanianAleutAlsatianAmericanApacheArabArapahoArgentineanArmenianAssyrian/Chaldean/SyriacAustralianAustrianBahamianBangladeshiBarbadianBasqueBelgianBelizeanBermudanBhutaneseBlackfeetBolivianBrazilianBritishBritish West IndianBulgarianBurmeseCajunCambodianCanadianCape VerdeanCarpatho RusynCelticCentral AmericanCentral American IndianCherokeeCheyenneChickasawChileanChineseChippewaChoctawColombianColvilleComancheCosta RicanCreeCreekCroatianCrowCubanCypriotCzechCzechoslovakianDanishDelawareDominicanDutchDutch West IndianEastern EuropeanEcuadorianEgyptianEnglishEstonianEthiopianEuropeanFijianFilipinoFinnishFrenchFrench American IndianFrench CanadianGermanGerman RussianGhanaianGreekGuamanian/ChamorroGuatemalanGuyaneseHaitianHmongHonduranHopiHoumaHungarianIcelanderIndian (Asian)IndonesianInupiatIranianIraqiIrishIroquoisIsraeliItalianJamaicanJapaneseJordanianKenyanKiowaKoreanLaotianLatvianLebaneseLiberianLithuanianLumbeeLuxembourgerMacedonianMalaysianMalteseMarshalleseMenomineeMexicanMexican American IndianMongolianMoroccanNative HawaiianNavajoNepaleseNew ZealanderNicaraguanNigerianNorthern EuropeanNorwegianOkinawanOsageOttawaPaiutePakistaniPalestinianPanamanianParaguayanPennsylvania GermanPeruvianPimaPolishPortuguesePotawatomiPuebloPuerto RicanPuget Sound SalishRomanianRussianSalvadoranSamoanScandinavianScotch-IrishScottishSeminoleSenegaleseSerbianShoshoneSierra LeoneanSiouxSlavicSlovakSloveneSomaliSouth AfricanSouth AmericanSouth American IndianSoviet UnionSpaniardSpanishSpanish AmericanSpanish American IndianSri LankanSubsaharan AfricanSudaneseSwedishSwissSyrianTaiwaneseThaiTlingit-HaidaTohono O'OdhamTonganTrinidadian and TobagonianTsimshianTurkishU.S. Virgin IslanderUgandanUkrainianUruguayanUteVenezuelanVietnameseWelshWest IndianYakamaYaquiYugoslavianYumanYup'ikZimbabwean
Immigration
NonimmigrantsImmigrantsAfghanistanAfricaAlbaniaArgentinaArmeniaAsiaAustriaBahamasBangladeshBarbadosBelarusBelgiumBelizeBoliviaBosnia and HerzegovinaBrazilBulgariaBurma/MyanmarCabo VerdeCambodiaCameroonCanadaCaribbeanCentral AmericaChileChinaColombiaCongoCosta RicaCroatiaCubaCzechoslovakiaDenmarkDominicaDominican RepublicEastern AfricaEastern AsiaEastern EuropeEcuadorEgyptEl SalvadorEnglandEritreaEthiopiaEuropeFijiFranceGermanyGhanaGreeceGrenadaGuatemalaGuyanaHaitiHondurasHong KongHungaryIndiaIndonesiaIranIraqIrelandIsraelItalyJamaicaJapanJordanKazakhstanKenyaKoreaKuwaitLaosLatin AmericaLatviaLebanonLiberiaLithuaniaMalaysiaMexicoMicronesiaMiddle AfricaMoldovaMoroccoNepalNetherlandsNicaraguaNigeriaNorth AmericaNorth MacedoniaNorthern AfricaNorthern EuropeNorwayOceaniaPakistanPanamaPeruPhilippinesPolandPortugalRomaniaRussiaSaudi ArabiaScotlandSenegalSerbiaSierra LeoneSingaporeSomaliaSouth AfricaSouth AmericaSouth Central AsiaSouth Eastern AsiaSouthern EuropeSpainSri LankaSt. Vincent and the GrenadinesSudanSwedenSwitzerlandSyriaTaiwanThailandTrinidad and TobagoTurkeyUgandaUkraineUruguayUzbekistanVenezuelaVietnamWest IndiesWestern AfricaWestern AsiaWestern EuropeYemenZaireZimbabweAzores
Immigrants from Australia
Race
Ancestry
AfghanAfricanAlaska NativeAlaskan AthabascanAlbanianAleutAlsatianAmericanApacheArabArapahoArgentineanArmenianAssyrian/Chaldean/SyriacAustralianAustrianBahamianBangladeshiBarbadianBasqueBelgianBelizeanBermudanBhutaneseBlackfeetBolivianBrazilianBritishBritish West IndianBulgarianBurmeseCajunCambodianCanadianCape VerdeanCarpatho RusynCelticCentral AmericanCentral American IndianCherokeeCheyenneChickasawChileanChineseChippewaChoctawColombianColvilleComancheCosta RicanCreeCreekCroatianCrowCubanCypriotCzechCzechoslovakianDanishDelawareDominicanDutchDutch West IndianEastern EuropeanEcuadorianEgyptianEnglishEstonianEthiopianEuropeanFijianFilipinoFinnishFrenchFrench American IndianFrench CanadianGermanGerman RussianGhanaianGreekGuamanian/ChamorroGuatemalanGuyaneseHaitianHmongHonduranHopiHoumaHungarianIcelanderIndian (Asian)IndonesianInupiatIranianIraqiIrishIroquoisIsraeliItalianJamaicanJapaneseJordanianKenyanKiowaKoreanLaotianLatvianLebaneseLiberianLithuanianLumbeeLuxembourgerMacedonianMalaysianMalteseMarshalleseMenomineeMexicanMexican American IndianMongolianMoroccanNative HawaiianNavajoNepaleseNew ZealanderNicaraguanNigerianNorthern EuropeanNorwegianOkinawanOsageOttawaPaiutePakistaniPalestinianPanamanianParaguayanPennsylvania GermanPeruvianPimaPolishPortuguesePotawatomiPuebloPuerto RicanPuget Sound SalishRomanianRussianSalvadoranSamoanScandinavianScotch-IrishScottishSeminoleSenegaleseSerbianShoshoneSierra LeoneanSiouxSlavicSlovakSloveneSomaliSouth AfricanSouth AmericanSouth American IndianSoviet UnionSpaniardSpanishSpanish AmericanSpanish American IndianSri LankanSubsaharan AfricanSudaneseSwedishSwissTaiwaneseThaiTlingit-HaidaTohono O'OdhamTonganTrinidadian and TobagonianTsimshianTurkishU.S. Virgin IslanderUgandanUkrainianUruguayanUteVenezuelanVietnameseWelshWest IndianYakamaYaquiYugoslavianYumanYup'ikZimbabwean
Immigration
NonimmigrantsImmigrantsAfghanistanAfricaAlbaniaArgentinaArmeniaAsiaAustraliaAustriaBahamasBangladeshBarbadosBelarusBelgiumBelizeBoliviaBosnia and HerzegovinaBrazilBulgariaBurma/MyanmarCabo VerdeCambodiaCameroonCanadaCaribbeanCentral AmericaChileChinaColombiaCongoCosta RicaCroatiaCubaCzechoslovakiaDenmarkDominicaDominican RepublicEastern AfricaEastern AsiaEastern EuropeEcuadorEgyptEl SalvadorEnglandEritreaEthiopiaEuropeFijiFranceGermanyGhanaGreeceGrenadaGuatemalaGuyanaHaitiHondurasHong KongHungaryIndiaIndonesiaIranIraqIrelandIsraelItalyJamaicaJapanJordanKazakhstanKenyaKoreaKuwaitLaosLatin AmericaLatviaLebanonLiberiaLithuaniaMalaysiaMexicoMicronesiaMiddle AfricaMoldovaMoroccoNepalNetherlandsNicaraguaNigeriaNorth AmericaNorth MacedoniaNorthern AfricaNorthern EuropeNorwayOceaniaPakistanPanamaPeruPhilippinesPolandPortugalRomaniaRussiaSaudi ArabiaScotlandSenegalSerbiaSierra LeoneSingaporeSomaliaSouth AfricaSouth AmericaSouth Central AsiaSouth Eastern AsiaSouthern EuropeSpainSri LankaSt. Vincent and the GrenadinesSudanSwedenSwitzerlandSyriaTaiwanThailandTrinidad and TobagoTurkeyUgandaUkraineUruguayUzbekistanVenezuelaVietnamWest IndiesWestern AfricaWestern AsiaWestern EuropeYemenZaireZimbabweAzores
In Labor Force | Age 25-29
Income
Poverty
Unemployment
Labor Participation
Family Structure
Vehicle Availability
Education Level
Disability

In Labor Force | Age 25-29 Comparison

Syrians

Immigrants from Australia

Good
Exceptional
84.8%
IN LABOR FORCE | AGE 25-29
76.5/ 100
METRIC RATING
134th/ 347
METRIC RANK
85.3%
IN LABOR FORCE | AGE 25-29
98.9/ 100
METRIC RATING
72nd/ 347
METRIC RANK

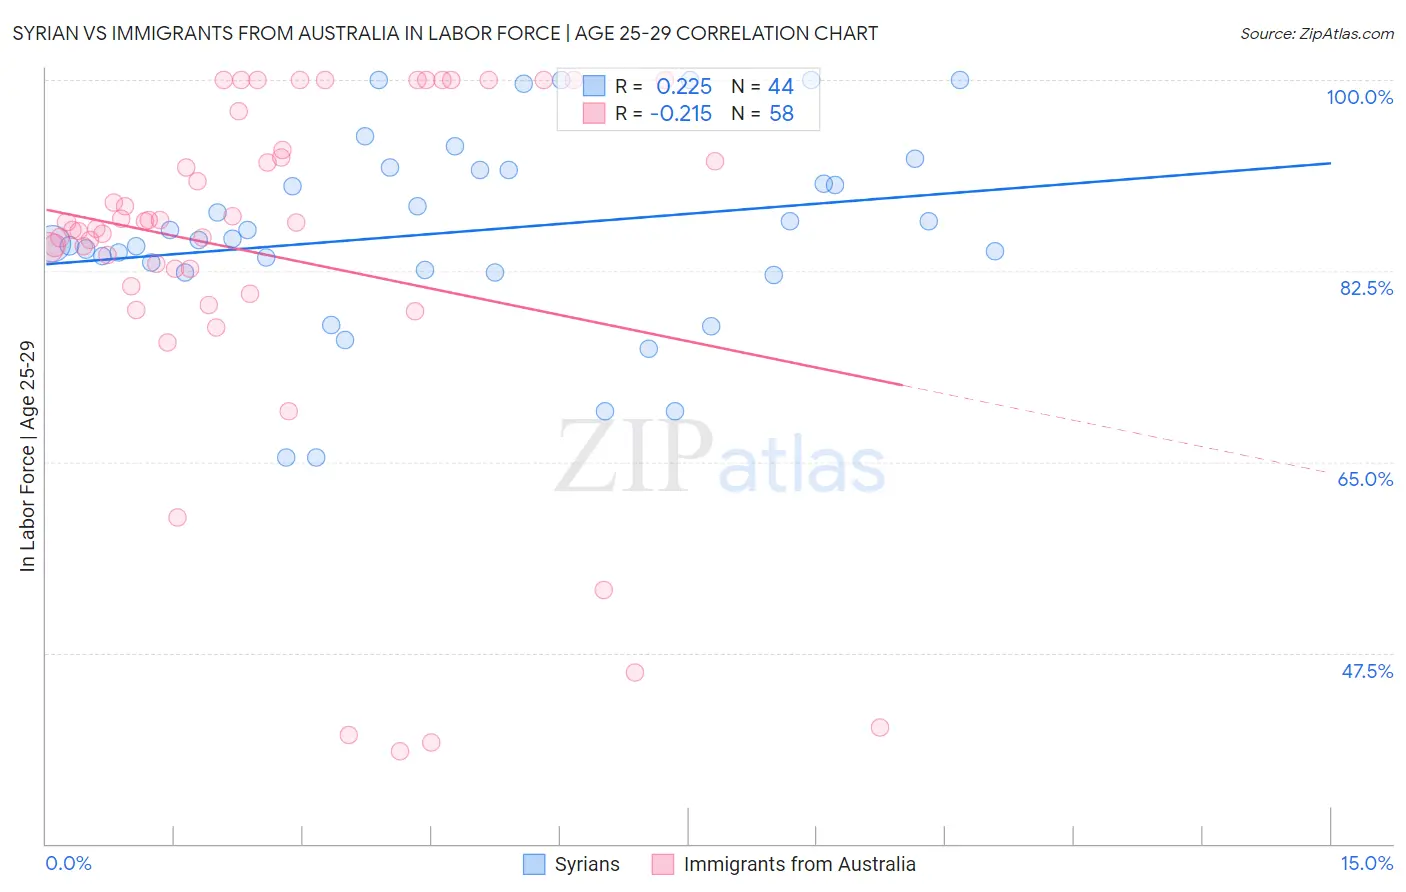
Syrian vs Immigrants from Australia In Labor Force | Age 25-29 Correlation Chart

The statistical analysis conducted on geographies consisting of 266,239,805 people shows a weak positive correlation between the proportion of Syrians and labor force participation rate among population between the ages 25 and 29 in the United States with a correlation coefficient (R) of 0.225 and weighted average of 84.8%. Similarly, the statistical analysis conducted on geographies consisting of 227,173,670 people shows a weak negative correlation between the proportion of Immigrants from Australia and labor force participation rate among population between the ages 25 and 29 in the United States with a correlation coefficient (R) of -0.215 and weighted average of 85.3%, a difference of 0.61%.
Syrian vs Immigrants from Australia In Labor Force | Age 25-29

In Labor Force | Age 25-29 Correlation Summary

MeasurementSyrianImmigrants from Australia
Minimum65.4%38.5%
Maximum100.0%100.0%
Range34.6%61.5%
Mean86.0%83.9%
Median85.4%86.6%
Interquartile 25% (IQ1)82.5%81.1%
Interquartile 75% (IQ3)91.8%93.5%
Interquartile Range (IQR)9.3%12.5%
Standard Deviation (Sample)8.8%16.4%
Standard Deviation (Population)8.7%16.3%

Similar Demographics by In Labor Force | Age 25-29

Demographics Similar to Syrians by In Labor Force | Age 25-29

In terms of in labor force | age 25-29, the demographic groups most similar to Syrians are Immigrants from Hungary (84.8%, a difference of 0.0%), Romanian (84.8%, a difference of 0.010%), Asian (84.8%, a difference of 0.010%), Bhutanese (84.8%, a difference of 0.010%), and Iranian (84.8%, a difference of 0.020%).
DemographicsRating | RankIn Labor Force | Age 25-29
Immigrants | Uruguay
84.0
/100
|
#127
Excellent
84.9%
Australians
83.6
/100
|
#128
Excellent
84.9%
Immigrants | Russia
81.6
/100
|
#129
Excellent
84.9%
Northern Europeans
81.3
/100
|
#130
Excellent
84.9%
Iranians
78.1
/100
|
#131
Good
84.8%
Romanians
77.7
/100
|
#132
Good
84.8%
Asians
77.7
/100
|
#133
Good
84.8%
Syrians
76.5
/100
|
#134
Good
84.8%
Immigrants | Hungary
76.4
/100
|
#135
Good
84.8%
Bhutanese
76.0
/100
|
#136
Good
84.8%
Immigrants | Canada
73.5
/100
|
#137
Good
84.8%
Armenians
72.7
/100
|
#138
Good
84.8%
Immigrants | Eastern Asia
72.6
/100
|
#139
Good
84.8%
Immigrants | North America
72.1
/100
|
#140
Good
84.8%
Danes
71.9
/100
|
#141
Good
84.8%

Demographics Similar to Immigrants from Australia by In Labor Force | Age 25-29

In terms of in labor force | age 25-29, the demographic groups most similar to Immigrants from Australia are Russian (85.3%, a difference of 0.010%), Kenyan (85.4%, a difference of 0.020%), Menominee (85.4%, a difference of 0.040%), Immigrants from Sweden (85.4%, a difference of 0.040%), and Soviet Union (85.3%, a difference of 0.050%).
DemographicsRating | RankIn Labor Force | Age 25-29
Immigrants | Czechoslovakia
99.3
/100
|
#65
Exceptional
85.4%
Immigrants | Scotland
99.3
/100
|
#66
Exceptional
85.4%
Immigrants | Turkey
99.2
/100
|
#67
Exceptional
85.4%
Immigrants | Cameroon
99.2
/100
|
#68
Exceptional
85.4%
Menominee
99.1
/100
|
#69
Exceptional
85.4%
Immigrants | Sweden
99.1
/100
|
#70
Exceptional
85.4%
Kenyans
99.0
/100
|
#71
Exceptional
85.4%
Immigrants | Australia
98.9
/100
|
#72
Exceptional
85.3%
Russians
98.8
/100
|
#73
Exceptional
85.3%
Soviet Union
98.5
/100
|
#74
Exceptional
85.3%
Brazilians
98.3
/100
|
#75
Exceptional
85.3%
Germans
98.1
/100
|
#76
Exceptional
85.3%
Immigrants | South Central Asia
97.9
/100
|
#77
Exceptional
85.2%
Immigrants | Egypt
97.7
/100
|
#78
Exceptional
85.2%
Immigrants | Northern Africa
97.6
/100
|
#79
Exceptional
85.2%