Syrian vs Dominican In Labor Force | Age 16-19
COMPARE
Syrian
Dominican
In Labor Force | Age 16-19
In Labor Force | Age 16-19 Comparison
Syrians
Dominicans
37.6%
IN LABOR FORCE | AGE 16-19
90.7/ 100
METRIC RATING
141st/ 347
METRIC RANK
31.2%
IN LABOR FORCE | AGE 16-19
0.0/ 100
METRIC RATING
324th/ 347
METRIC RANK
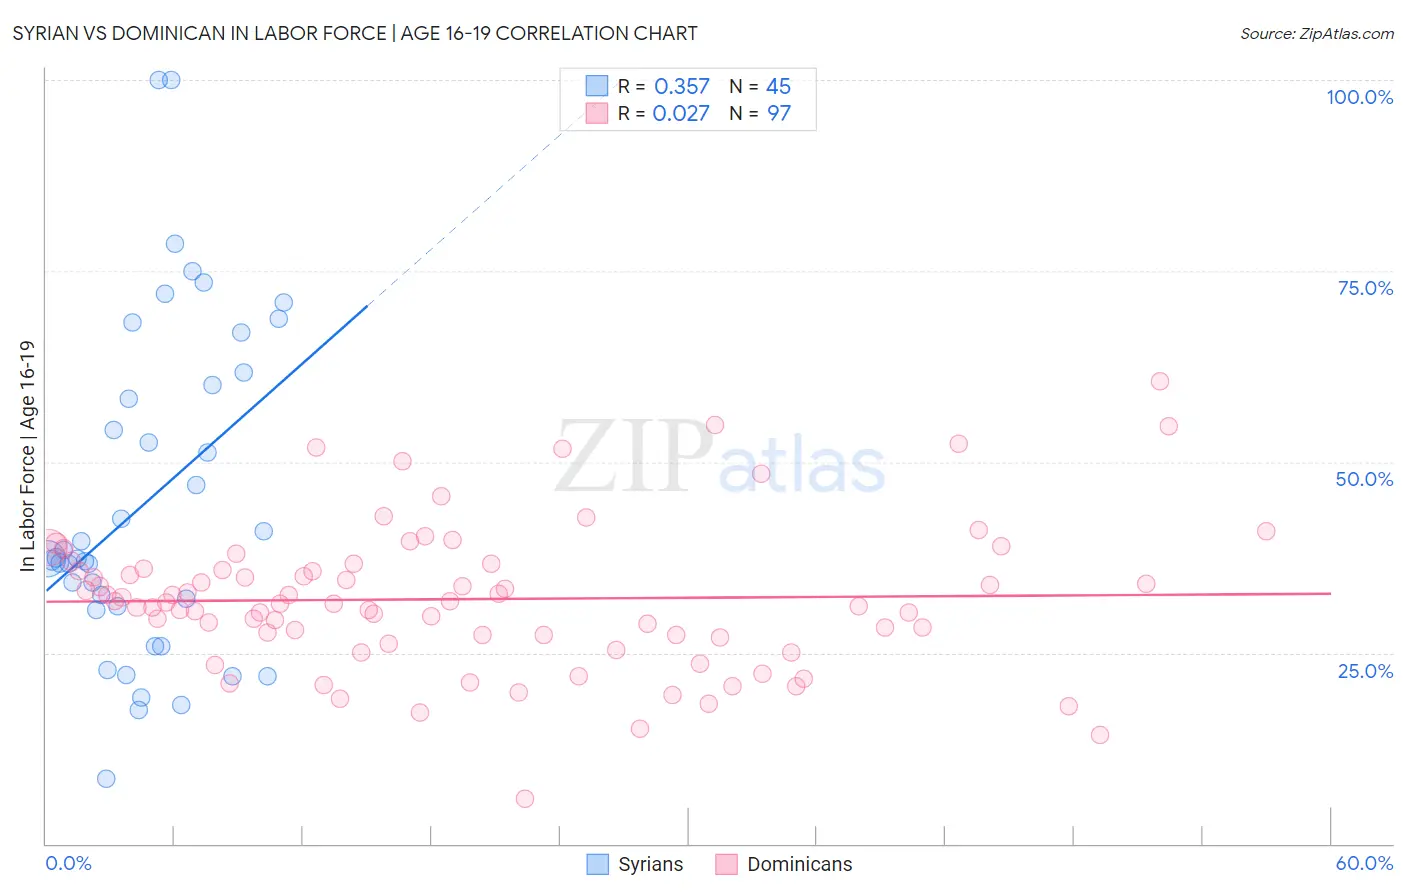
Syrian vs Dominican In Labor Force | Age 16-19 Correlation Chart
The statistical analysis conducted on geographies consisting of 266,042,941 people shows a mild positive correlation between the proportion of Syrians and labor force participation rate among population between the ages 16 and 19 in the United States with a correlation coefficient (R) of 0.357 and weighted average of 37.6%. Similarly, the statistical analysis conducted on geographies consisting of 354,586,301 people shows no correlation between the proportion of Dominicans and labor force participation rate among population between the ages 16 and 19 in the United States with a correlation coefficient (R) of 0.027 and weighted average of 31.2%, a difference of 20.6%.
In Labor Force | Age 16-19 Correlation Summary
| Measurement | Syrian | Dominican |
| Minimum | 8.6% | 5.9% |
| Maximum | 100.0% | 60.5% |
| Range | 91.4% | 54.6% |
| Mean | 44.8% | 32.0% |
| Median | 37.3% | 31.6% |
| Interquartile 25% (IQ1) | 30.9% | 27.2% |
| Interquartile 75% (IQ3) | 60.9% | 36.3% |
| Interquartile Range (IQR) | 30.0% | 9.2% |
| Standard Deviation (Sample) | 21.6% | 9.5% |
| Standard Deviation (Population) | 21.4% | 9.4% |
Similar Demographics by In Labor Force | Age 16-19
Demographics Similar to Syrians by In Labor Force | Age 16-19
In terms of in labor force | age 16-19, the demographic groups most similar to Syrians are Estonian (37.7%, a difference of 0.14%), Sierra Leonean (37.6%, a difference of 0.15%), Immigrants from Moldova (37.7%, a difference of 0.17%), Pakistani (37.6%, a difference of 0.18%), and Comanche (37.7%, a difference of 0.19%).
| Demographics | Rating | Rank | In Labor Force | Age 16-19 |
| Immigrants | Netherlands | 93.7 /100 | #134 | Exceptional 37.8% |
| Macedonians | 93.4 /100 | #135 | Exceptional 37.8% |
| Australians | 93.2 /100 | #136 | Exceptional 37.8% |
| Cajuns | 93.2 /100 | #137 | Exceptional 37.8% |
| Comanche | 91.9 /100 | #138 | Exceptional 37.7% |
| Immigrants | Moldova | 91.9 /100 | #139 | Exceptional 37.7% |
| Estonians | 91.7 /100 | #140 | Exceptional 37.7% |
| Syrians | 90.7 /100 | #141 | Exceptional 37.6% |
| Sierra Leoneans | 89.7 /100 | #142 | Excellent 37.6% |
| Pakistanis | 89.5 /100 | #143 | Excellent 37.6% |
| Japanese | 89.3 /100 | #144 | Excellent 37.5% |
| Paiute | 89.3 /100 | #145 | Excellent 37.5% |
| Immigrants | Western Europe | 88.9 /100 | #146 | Excellent 37.5% |
| Brazilians | 88.7 /100 | #147 | Excellent 37.5% |
| Romanians | 87.3 /100 | #148 | Excellent 37.5% |
Demographics Similar to Dominicans by In Labor Force | Age 16-19
In terms of in labor force | age 16-19, the demographic groups most similar to Dominicans are Immigrants from China (31.1%, a difference of 0.15%), Immigrants from Caribbean (31.2%, a difference of 0.18%), Tohono O'odham (31.3%, a difference of 0.31%), Immigrants from Dominican Republic (31.1%, a difference of 0.35%), and West Indian (31.3%, a difference of 0.43%).
| Demographics | Rating | Rank | In Labor Force | Age 16-19 |
| Immigrants | Nicaragua | 0.0 /100 | #317 | Tragic 31.6% |
| Immigrants | Yemen | 0.0 /100 | #318 | Tragic 31.5% |
| Soviet Union | 0.0 /100 | #319 | Tragic 31.4% |
| Ecuadorians | 0.0 /100 | #320 | Tragic 31.4% |
| West Indians | 0.0 /100 | #321 | Tragic 31.3% |
| Tohono O'odham | 0.0 /100 | #322 | Tragic 31.3% |
| Immigrants | Caribbean | 0.0 /100 | #323 | Tragic 31.2% |
| Dominicans | 0.0 /100 | #324 | Tragic 31.2% |
| Immigrants | China | 0.0 /100 | #325 | Tragic 31.1% |
| Immigrants | Dominican Republic | 0.0 /100 | #326 | Tragic 31.1% |
| Immigrants | Taiwan | 0.0 /100 | #327 | Tragic 31.0% |
| Immigrants | Ecuador | 0.0 /100 | #328 | Tragic 31.0% |
| Barbadians | 0.0 /100 | #329 | Tragic 31.0% |
| Lumbee | 0.0 /100 | #330 | Tragic 31.0% |
| Trinidadians and Tobagonians | 0.0 /100 | #331 | Tragic 30.9% |