Swiss vs Creek In Labor Force | Age 30-34
COMPARE
Swiss
Creek
In Labor Force | Age 30-34
In Labor Force | Age 30-34 Comparison
Swiss
Creek
84.3%
IN LABOR FORCE | AGE 30-34
5.8/ 100
METRIC RATING
219th/ 347
METRIC RANK
80.4%
IN LABOR FORCE | AGE 30-34
0.0/ 100
METRIC RATING
329th/ 347
METRIC RANK
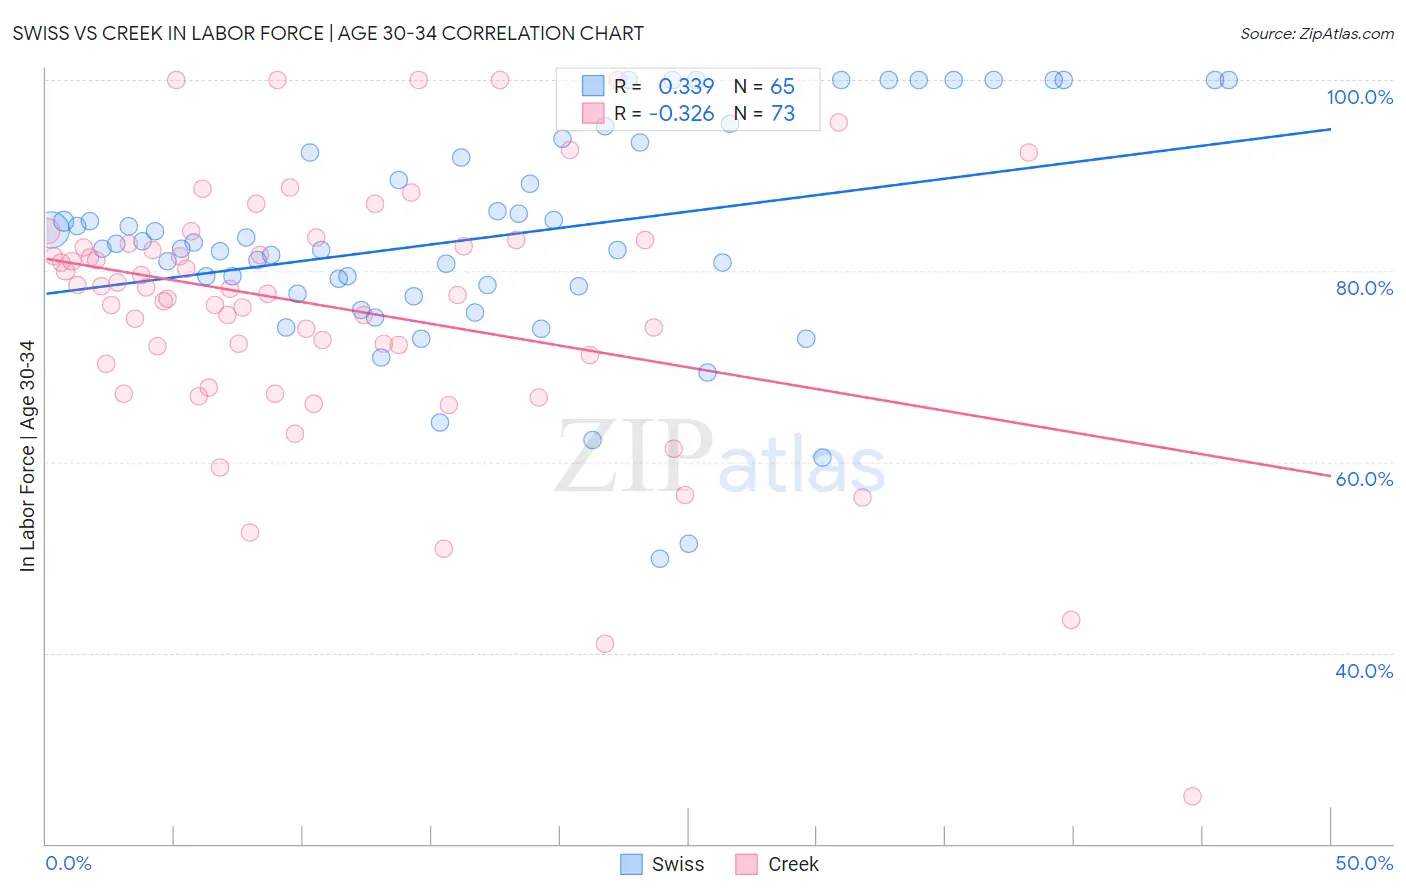
Swiss vs Creek In Labor Force | Age 30-34 Correlation Chart
The statistical analysis conducted on geographies consisting of 464,594,297 people shows a mild positive correlation between the proportion of Swiss and labor force participation rate among population between the ages 30 and 34 in the United States with a correlation coefficient (R) of 0.339 and weighted average of 84.3%. Similarly, the statistical analysis conducted on geographies consisting of 178,425,767 people shows a mild negative correlation between the proportion of Creek and labor force participation rate among population between the ages 30 and 34 in the United States with a correlation coefficient (R) of -0.326 and weighted average of 80.4%, a difference of 4.9%.
In Labor Force | Age 30-34 Correlation Summary
| Measurement | Swiss | Creek |
| Minimum | 49.9% | 25.0% |
| Maximum | 100.0% | 100.0% |
| Range | 50.1% | 75.0% |
| Mean | 83.6% | 76.2% |
| Median | 82.8% | 78.2% |
| Interquartile 25% (IQ1) | 78.0% | 70.7% |
| Interquartile 75% (IQ3) | 93.0% | 83.1% |
| Interquartile Range (IQR) | 15.0% | 12.4% |
| Standard Deviation (Sample) | 11.7% | 13.7% |
| Standard Deviation (Population) | 11.6% | 13.6% |
Similar Demographics by In Labor Force | Age 30-34
Demographics Similar to Swiss by In Labor Force | Age 30-34
In terms of in labor force | age 30-34, the demographic groups most similar to Swiss are Immigrants from Panama (84.3%, a difference of 0.020%), Danish (84.3%, a difference of 0.020%), Immigrants from Germany (84.3%, a difference of 0.040%), European (84.3%, a difference of 0.040%), and Immigrants from Ecuador (84.3%, a difference of 0.040%).
| Demographics | Rating | Rank | In Labor Force | Age 30-34 |
| Immigrants | Western Asia | 8.2 /100 | #212 | Tragic 84.3% |
| Immigrants | Jamaica | 7.9 /100 | #213 | Tragic 84.3% |
| Immigrants | Germany | 7.2 /100 | #214 | Tragic 84.3% |
| Europeans | 7.2 /100 | #215 | Tragic 84.3% |
| Immigrants | Ecuador | 7.1 /100 | #216 | Tragic 84.3% |
| Immigrants | Trinidad and Tobago | 7.0 /100 | #217 | Tragic 84.3% |
| Immigrants | Panama | 6.3 /100 | #218 | Tragic 84.3% |
| Swiss | 5.8 /100 | #219 | Tragic 84.3% |
| Danes | 5.3 /100 | #220 | Tragic 84.3% |
| Salvadorans | 3.8 /100 | #221 | Tragic 84.2% |
| Panamanians | 3.8 /100 | #222 | Tragic 84.2% |
| Immigrants | Laos | 3.6 /100 | #223 | Tragic 84.2% |
| Cubans | 3.4 /100 | #224 | Tragic 84.2% |
| Scottish | 3.1 /100 | #225 | Tragic 84.2% |
| Immigrants | El Salvador | 3.0 /100 | #226 | Tragic 84.2% |
Demographics Similar to Creek by In Labor Force | Age 30-34
In terms of in labor force | age 30-34, the demographic groups most similar to Creek are Sioux (80.4%, a difference of 0.010%), Pueblo (80.0%, a difference of 0.40%), Colville (80.7%, a difference of 0.41%), Houma (79.9%, a difference of 0.58%), and Seminole (80.8%, a difference of 0.60%).
| Demographics | Rating | Rank | In Labor Force | Age 30-34 |
| Puerto Ricans | 0.0 /100 | #322 | Tragic 81.2% |
| Paiute | 0.0 /100 | #323 | Tragic 81.2% |
| Cheyenne | 0.0 /100 | #324 | Tragic 81.1% |
| Dutch West Indians | 0.0 /100 | #325 | Tragic 81.0% |
| Seminole | 0.0 /100 | #326 | Tragic 80.8% |
| Colville | 0.0 /100 | #327 | Tragic 80.7% |
| Sioux | 0.0 /100 | #328 | Tragic 80.4% |
| Creek | 0.0 /100 | #329 | Tragic 80.4% |
| Pueblo | 0.0 /100 | #330 | Tragic 80.0% |
| Houma | 0.0 /100 | #331 | Tragic 79.9% |
| Kiowa | 0.0 /100 | #332 | Tragic 79.8% |
| Inupiat | 0.0 /100 | #333 | Tragic 79.7% |
| Hopi | 0.0 /100 | #334 | Tragic 79.3% |
| Marshallese | 0.0 /100 | #335 | Tragic 79.2% |
| Natives/Alaskans | 0.0 /100 | #336 | Tragic 79.2% |